Validity and Reliability and Item Analyses - · PDF fileValidity, Reliability and Item...
18
Validity, Reliability and Item Analysis Center for Research, Curriculum and Instruction June 17, 2016 ©Center for Research, Curriculum and Instruction
Transcript of Validity and Reliability and Item Analyses - · PDF fileValidity, Reliability and Item...

Validity, Reliability and
Item Analysis
Center for Research, Curriculum and Instruction
June 17, 2016
©Center for Research, Curriculum and Instruction

Why this?
• More accountability in quality of information we share with inside and outside stakeholders about measuring students’ performance in a subject area
• Need for more accurate information (free of bias and distortions)
• Our current reality as shaped by recent educational policies • APPR requirements for rigorous assessments • Changing of state and national curricula • Connectivity between non-common core and common core
curricula • To address the Standards for Educational and
Psychological Testing
6/17/2016 ©Center for Research, Curriculum and Instruction

Validity and Reliability
• Are necessary to ensure correct measurements of traits (not directly observable)
• “Psychological measurement is the process of measuring various psychological traits. Thus in measurement, the two very important concepts are reliability - how consistent the outcome of the tool is, and validity – showing how well the tool measures what it is supposed to measure (how accurate test results are)”.
• https://www.youtube.com/watch?v=fnF2hrLZHoA
6/17/2016 ©Center for Research, Curriculum and Instruction

What is validity in plain language?
• Validity refers to the accuracy of an assessment regardless of whether it measures what it is supposed to measure.
• Example: If we use a scale that tells us that we weigh 140 pounds time after time (reliable) when in fact we weigh 135 pounds (it may not be set correctly) then we can assume that this scale is not accurate as the outcome is not valid.
• Educationally, we make decisions about students (e.g., graduation, retention, promotion) based on their assessment scores, thus making it extremely important to have valid/ accurate information from these measures.
6/17/2016 ©Center for Research, Curriculum and Instruction

Validity
• Validity was created by Kelly in 1927 who argued that a test is valid only if it measures what it is supposed to measure.
• Validity could be of two kinds: content-related and criterion-related.
• Validity could also be internal (the y-effect is based on the manipulation of the x-variable and not on some other confounding variable) or external (ecological –generalize study results to other settings, population – generalize findings to other people, and historical – generalize results over time).
6/17/2016 ©Center for Research, Curriculum and Instruction

Types of Validity Content-Related Validity (appropriate content)
Examples Criterion-Related Validity (measures relationships to other external measures)
Examples
Face Validity: Does the test seem to test what it was created for? People can rate this using a likert scale to assess face validity (1 through 5), but there are more accurate measures for validity
The purpose of the test is clear to a class of students. For instance, the test was design for a unit on persuasive writing, or on measuring addition skills. A summative that includes content taught in the last 6 weeks is not a valid measure of the course overall.
Concurrent Validity: Does it relate to an existing similar measure? It allows us to show that our test is valid by comparing it with an already existing valid test.
A summative test highly correlated to a state assessment may have high concurrent validity. Ex: If the 3rd grade math summative is highly correlated to the statewide math tests, then they would have concurrent validty.
Construct Validity: It is about demonstrating that what is being measured exists, and that is congruent with some model or theory.
Does the test reflect a specific theoretical construct or trait? Ex: ESL students performing differently on a reading test than English-speaking students, as supported by theory. (methods - factor analysis and correlational methods)
Predictive Validity: can the test be used to predict later performance measured on a related criterion? (SAT used to predict later college grades)
For instance, strong baseline or summative assessments may predict how students will perform on a state assessment test.
6/17/2016

Reliability
• Reliability measures how consistent test results are over time from tests, surveys, observations, etc.
• For educators, reliability refers to the extent to which assessment results are consistent in measuring student achievement.
• To measure reliability we usually calculate reliability coefficients that range in value from 0 to 1 (very good reliability would be over .70 or .80)
6/17/2016 ©Center for Research, Curriculum and Instruction

What is reliability in plain language?
• Reliability is measured by the consistency of tools we use. For instance, if a scale shows the same weight every time we step on it we can deem it as reliable. We can draw the same conclusion about a car that starts every time we drive it.
• It is important that state assessments or other district-wide tests are reliable. It should not make a difference in outcomes if students take them at 8:00 a.m. or at 10 a.m., or this week versus next week.
6/17/2016 ©Center for Research, Curriculum and Instruction

Types of Reliability Type of Reliability Example Measurement
Stability or Test-Retest Administering baselines and summatives with same content at different times during the school year.
When administering the same assessment at separate times, reliability is measured through the correlation coefficient between the scores recorded on the assessments at times 1 and 2.
Alternate Form Classroom teachers prepare assessment with the items arranged in different order before administering them to the class.
When creating two similar forms of the same assessment and administering them at different times we expect high correlation between the two forms
Internal Consistency (Alpha, a)
This is not really used very often by practitioners but widely used in technical studies.
Split the test in two sub-tests and compare the correlation coefficient between the two sub-test scores. Methods used are - Kuder-Richardson Formula 20 (KR20) or Cronbach's Alpha
6/17/2016

Case Studies
1. The state just released the technical reports on the most recent administered state assessments. A “savvy” parent comes to you stating that the reliability coefficient of .89 just reported for the grade 5 ELA assessment is too low. How would you address this with the parent?
2. You are researching an assessment instrument to measure students’ math ability and narrowed it down to two options, test 1 indicating high validity with no information about reliability and test 2 indicating high reliability with no information about its validity. Since you were just tasked to do a board presentation about which tool you would recommend for purchasing what would you suggest and why?
6/17/2016 ©Center for Research, Curriculum and Instruction

Distractor Analysis – Discussion Sample
Performance Indicator: Convert improper fractions to mixed numbers, and mixed numbers to improper fractions • A (distractor, 7% of the students selected this choice) • B (correct choice, 76% of the students selected it) • C (distractor, 7% of the students selected this choice) • D (distractor, 10% of the students selected this choice) Observations: This question requires familiarity with understanding the algorithm of converting improper fractions into mixed numbers. This further requires familiarity with fluency in multiplication and addition of whole numbers, both needed to calculate the numerator of the improper fraction. Students who selected distractor A appear to have incorrectly calculated the difference between 24 and 27, while those who selected either distractors C or D incorrectly identified the number of times that 4 goes into 27 and thus may have difficulties with their multiplication/ division skills rather than the process of converting mixed into improper fractions. Overall, one in four students appear to have difficulty with this topic.
6/17/2016 ©Center for Research, Curriculum and Instruction

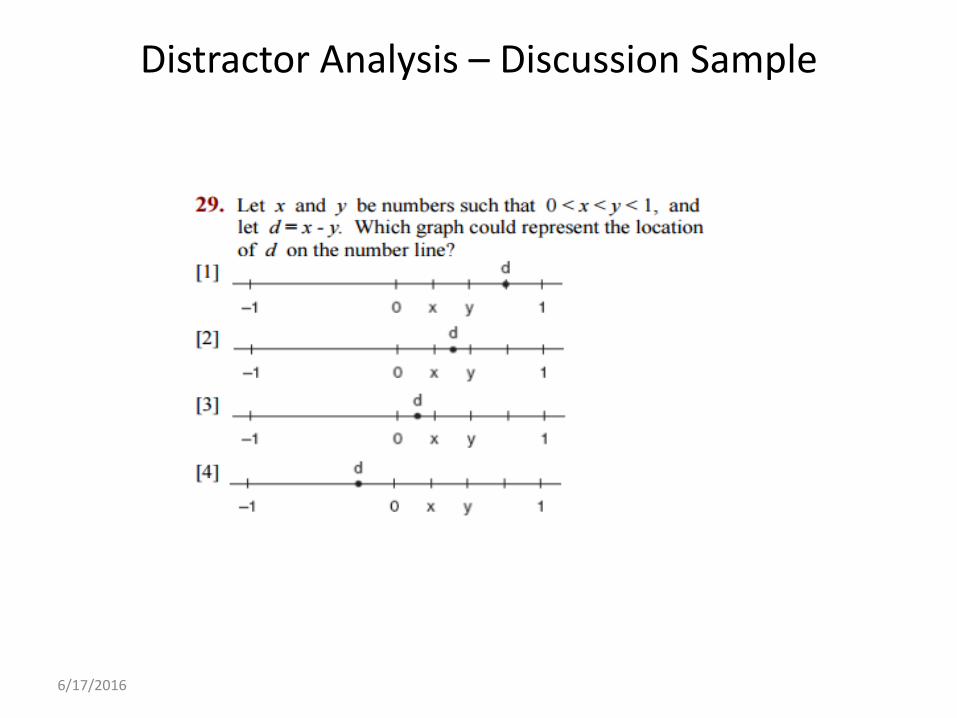
Distractor Analysis – Discussion Sample
6/17/2016
Analysis of distractors: Notice how each distractor is meant to uncover a particular understanding or misunderstanding in the students’ thought process. The students, who select distractor [1], understand how to divide powers but may not remember basic division facts. They would correctly divide the powers of “a” and “c” but incorrectly divide 12 by 4. Correct answer. Those who select choice 2 as an answer correctly understand how to divide whole numbers and also how to correctly divide powers with integer exponents. Students who select distractor [3] may have a misunderstanding regarding the correct interpretation of the exponent of “a”. Thus they may misinterpret “a” to have an exponent of zero instead of an exponent of “1” which is not clearly stated in the given expression. Similarly to distractor [3], students who may select distractor [4] likely interpreted both “a” and “c” variables from the denominators to have exponents of zero. The students have likely followed the correct process for simplifying exponents by correctly subtracting them when dividing powers using the incorrect exponents for the powers shown in the denominator.

Distractor Analysis – Discussion Sample
6/17/2016
1. Since 24 = 4 ∗ 7 = 2 7, students likely incorrectly simplify this
radical to be 4 7 instead of 2 7, and then correctly combined the
resulting radicals, 5 7 + 4 7 = 9 7, while forgetting the “3” located in front of the second radicand. 2. Correct answer 3. Just like in distractor 1, students would likely incorrectly simplify the
second radical to being 3 ∗ 4 7 = 12 7, and then incorrectly multiply this
radical expression to the first radical expression to get 60 7. 4. Students incorrectly added both, the radicands and the coefficients of each radical expression demonstrating a lack of knowledge about combining radical expressions.
Distractor Analysis – Discussion Sample
6/17/2016
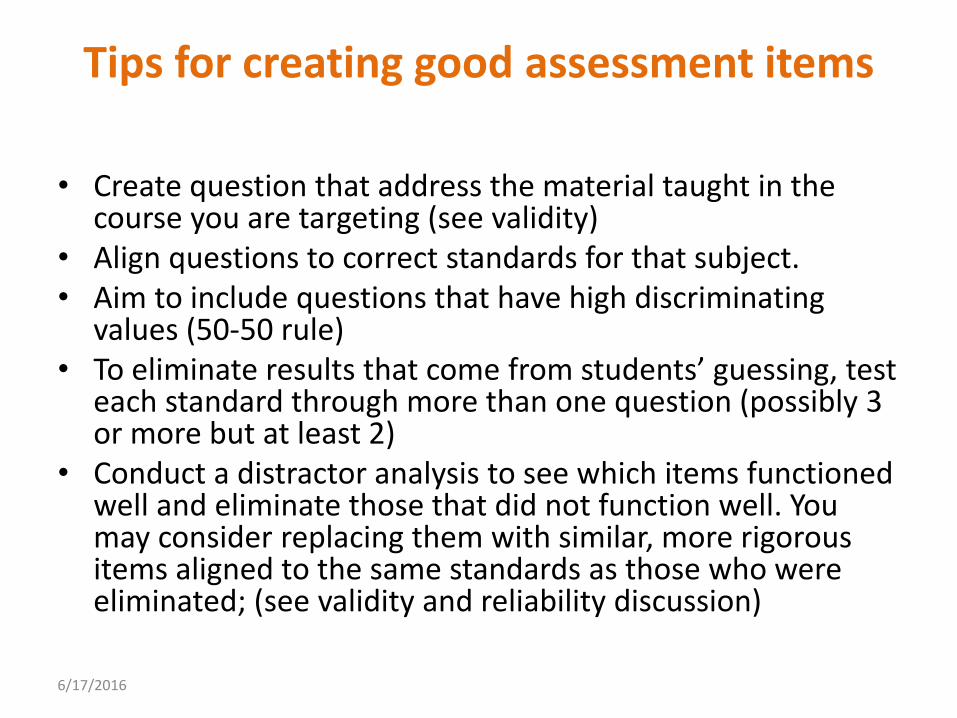
Tips for creating good assessment items
• Create question that address the material taught in the
course you are targeting (see validity) • Align questions to correct standards for that subject. • Aim to include questions that have high discriminating
values (50-50 rule) • To eliminate results that come from students’ guessing, test
each standard through more than one question (possibly 3 or more but at least 2)
• Conduct a distractor analysis to see which items functioned well and eliminate those that did not function well. You may consider replacing them with similar, more rigorous items aligned to the same standards as those who were eliminated; (see validity and reliability discussion)
6/17/2016

Tips for creating good assessment items
• If possible, collect all data on such assessments and have a technical analysis conducted by a specialist or by a third party provider. This step is really essential to perform on assessments that are administered multiple times as either baselines or summatives but somewhat difficult to perform in-house. This is addressed by AERA, APA and NCME as shown below.
• Good assessment items are also items that we could learn from or
that could be used in good follow-up professional development. • Good testing also involves vertical alignment and linkage of
assessment items vertically linked across grade levels or horizontally, across one grade level from fall to spring (can help with growth and ideally with value added through hierarchical linear models)
6/17/2016

The Standards for Educational and Psychological Testing
Developed jointly by: • American Educational Research Association (AERA) • American Psychological Association (APA) • National Council on Measurement in Education (NCME) The 2014 edition of the "Standards for Educational and Psychological Testing" is now available. The Testing Standards are a product of the American Educational Research Association, the American Psychological Association and the National Council on Measurement in Education. Published collaboratively by the three organizations since 1966, it represents the gold standard in guidance on testing in the United States and in many other countries.
6/17/2016

Overview of Content
Part I: Foundations • Validity. • Reliability/precision and errors of measurement. • Fairness in testing. Part II: Operations • Test design and development. • Scores, scales, norms, score linking and cut scores. • Test administration, scoring, reporting and interpretation. • Supporting documentation for tests. • The rights and responsibilities of test takers. • The rights and responsibilities of test users. Part III: Testing Applications • Psychological testing and assessment. • Workplace testing and credentialing. • Educational testing and assessment. • Uses of tests for program evaluation, policy studies and accountability.
6/17/2016