Validation Study of a Passive Image-Assisted Dietary ...
151
University of Tennessee, Knoxville University of Tennessee, Knoxville TRACE: Tennessee Research and Creative TRACE: Tennessee Research and Creative Exchange Exchange Masters Theses Graduate School 8-2018 Validation Study of a Passive Image-Assisted Dietary Assessment Validation Study of a Passive Image-Assisted Dietary Assessment Method with Automated Image Analysis Process Method with Automated Image Analysis Process Tsz-Kiu Chui University of Tennessee, [email protected] Follow this and additional works at: https://trace.tennessee.edu/utk_gradthes Recommended Citation Recommended Citation Chui, Tsz-Kiu, "Validation Study of a Passive Image-Assisted Dietary Assessment Method with Automated Image Analysis Process. " Master's Thesis, University of Tennessee, 2018. https://trace.tennessee.edu/utk_gradthes/5106 This Thesis is brought to you for free and open access by the Graduate School at TRACE: Tennessee Research and Creative Exchange. It has been accepted for inclusion in Masters Theses by an authorized administrator of TRACE: Tennessee Research and Creative Exchange. For more information, please contact [email protected].
Transcript of Validation Study of a Passive Image-Assisted Dietary ...

University of Tennessee, Knoxville University of Tennessee, Knoxville
TRACE: Tennessee Research and Creative TRACE: Tennessee Research and Creative
Exchange Exchange
Masters Theses Graduate School
8-2018
Validation Study of a Passive Image-Assisted Dietary Assessment Validation Study of a Passive Image-Assisted Dietary Assessment
Method with Automated Image Analysis Process Method with Automated Image Analysis Process
Tsz-Kiu Chui University of Tennessee, [email protected]
Follow this and additional works at: https://trace.tennessee.edu/utk_gradthes
Recommended Citation Recommended Citation Chui, Tsz-Kiu, "Validation Study of a Passive Image-Assisted Dietary Assessment Method with Automated Image Analysis Process. " Master's Thesis, University of Tennessee, 2018. https://trace.tennessee.edu/utk_gradthes/5106
This Thesis is brought to you for free and open access by the Graduate School at TRACE: Tennessee Research and Creative Exchange. It has been accepted for inclusion in Masters Theses by an authorized administrator of TRACE: Tennessee Research and Creative Exchange. For more information, please contact [email protected].

To the Graduate Council:
I am submitting herewith a thesis written by Tsz-Kiu Chui entitled "Validation Study of a Passive
Image-Assisted Dietary Assessment Method with Automated Image Analysis Process." I have
examined the final electronic copy of this thesis for form and content and recommend that it be
accepted in partial fulfillment of the requirements for the degree of Master of Science, with a
major in Nutrition.
Hollie Anne Raynor, Major Professor
We have read this thesis and recommend its acceptance:
Marsha Lynn Spence, Jindong Tan
Accepted for the Council:
Dixie L. Thompson
Vice Provost and Dean of the Graduate School
(Original signatures are on file with official student records.)

Validation Study of a Passive Image-Assisted Dietary Assessment Method with Automated Image Analysis
Process
A Thesis Presented for the
Master of Science
Degree
The University of Tennessee, Knoxville
Tsz-Kiu Chui
August 2018

ii
ACKNOWLEDGEMENT
To my major professor, Dr. Hollie Raynor, I really appreciate the help and support that
you provided throughout my graduate career. I am thankful to have the opportunity to work in
your lab, where I gained valuable experience and developed a passion for research in the field of
nutrition!
To my committee members, Drs. Spence and Tan, thank you for your feedback and
support for my thesis project.
To my family and friends, thank you for all the support and encouragement! I would like
to especially thank my parents for the love and support from Hong Kong. Thank you for
believing in me to pursue my graduate career! Without all these, I do not know if I could
overcome all the challenges in these two years.
To Fan Li, Lydia Prince, and Yan Li, thank you for all your hard work on this project!
Finally, to all the ladies in the HEAL lab, thank you for all the support, encouragement, and help
that you offered for this project and throughout my graduate career.

iii
ABSTRACT
Background: Image-assisted dietary assessment is being developed to enhance accuracy of
dietary assessment. This study validated a passive image-assisted dietary assessment method,
with an emphasis on examining if food shape and complexity influenced results.
Methods: A 2x2x2x2x3 mixed factorial design was used, with a between-subject factor of meal
orders, and within-subject factors of food shapes, food complexities, meals, and methods of
measurement, to validate the passive image-assisted dietary assessment method. Thirty men and
women (22.7 ± 1.6 kg/m2, 25.1 ± 6.6 years, 46.7% White) wore the Sony Smarteyeglass that
automatically took images while two meals containing four foods representing four food
categories were consumed. Images from the first 5 minutes of each meal were coded and then
compared to DietCam for food identification. The comparison produced four outcomes: DietCam
identifying food correctly in image (True Positive), DietCam incorrectly identifying food in
image (False Positive), DietCam not identifying food in image (False Negative), or DietCam
correctly identifying that the food is not in the image (True Negative). Participants’ feedback
about the Sony Smarteyeglass was obtained by a survey.
Results: A total of 36,412 images were coded by raters and analyzed by DietCam, with raters
coding that 92.4% of images contained foods and DietCam coding that 76.3% of images
contained foods. Mixed factorial analysis of covariance revealed a significant main effect of
percent agreement between DietCam and rater’s coded images [(F (3,48) = 8.5, p < 0.0001]. The
overall mean of True Positive was 22.2 ± 3.6 %, False Positive was 1.2 ± 0.4%, False Negative
was 19.6 ± 5.0%, and True Negative was 56.8 ± 7.2%. True Negative was significantly (p <
0.0001) different from all other percent agreement categories. No main effects of food shape or

iv
complexity were found. Participants reported that they were not willing to wear the Sony
Smarteyeglass under different types of dining experiences.
Conclusion: DietCam is most accurate in identifying images that do not contain food. The
platform from which the images are collected needs to be modified to enhance consumer
acceptance.

v
TABLE OF CONTENTS
CHAPTER I: LITERATURE REVIEW ................................................................................. 1
DIETARY ASSESSMENT ..................................................................................................... 2
SUBJECTIVE DIETARY ASSESSMENT .............................................................................. 2
OBJECTIVE DIETARY ASSESSMENT ................................................................................ 7
USE OF IMAGE-ASSISTED TECHNOLOGY TO ADDRESS DIETARY ASSESSMENT
ACCURACY ........................................................................................................................ 8
ACTIVE IMAGE-ASSISTED DIETARY ASSESSMENT .............................................. 8
PASSIVE IMAGE-ASSISTED DIETARY ASSESSMENT .......................................... 14
CHAPTER II: MANUSCRIPT .............................................................................................. 25
INTRODUCTION ................................................................................................................ 26
STUDY DESIGN AND METHODOLOGY .......................................................................... 28
STUDY DESIGN ............................................................................................................... 28
PARTICIPANTS ................................................................................................................ 29
SONY SMARTEYEGLASS ................................................................................................. 30
PROCEDURES ................................................................................................................. 31
SCREENING SESSION ................................................................................................ 31
MEAL SESSIONS ........................................................................................................ 31
MEAL DESCRIPTION ................................................................................................. 32
MEASURES ...................................................................................................................... 33
ANTHROPOMETRICS ................................................................................................ 33
DEMOGRAPHICS........................................................................................................ 33
CONSUMPTION .......................................................................................................... 34

vi
WEIGHED FOOD INTAKE ..................................................................................... 34
DIETCAM ................................................................................................................ 34
24-HOUR DIETARY RECALL ................................................................................ 37
PARTICIPANTS’ FEEDBACK .................................................................................... 37
PARTICIPANTS’ EXPERIENCES ........................................................................... 38
LIKELIHOOD AND COMFORTABLENESS OF WEARING SONY
SMARTEYEGLASS ................................................................................................. 38
Validation of Questionnaire ....................................................................................... 39
STATISTICAL ANALYSIS ................................................................................................. 40
RESULTS ................................................................................................................................ 41
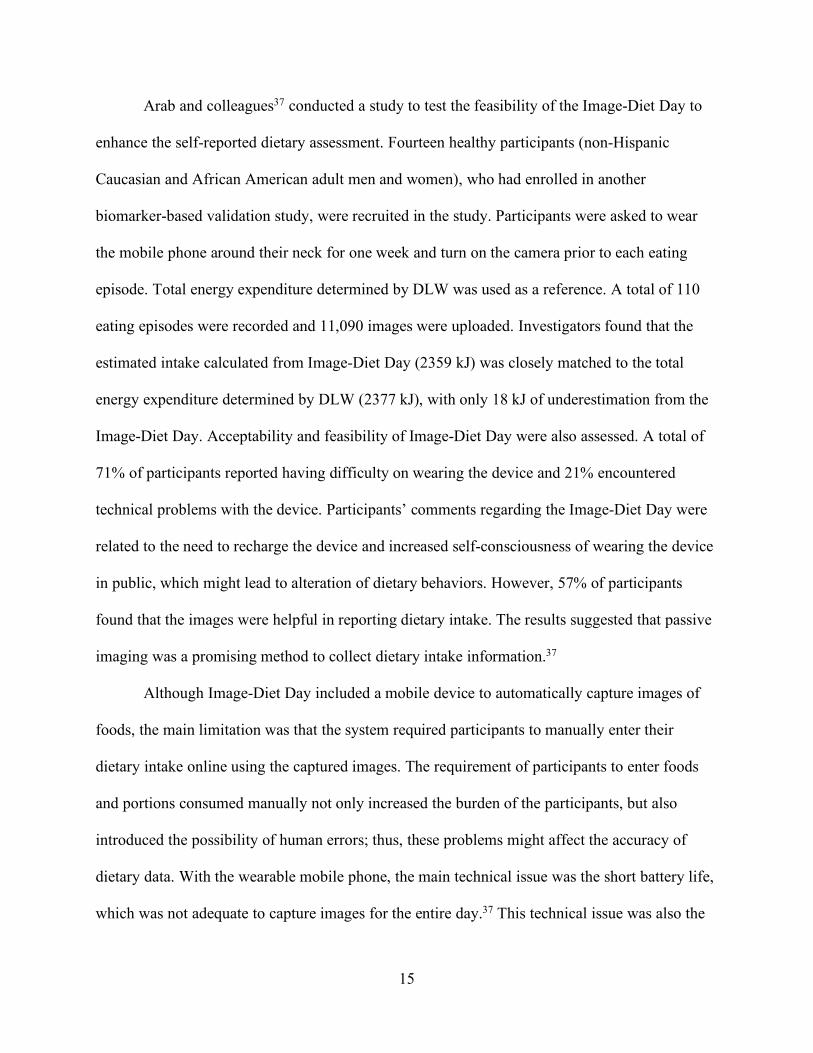
PARTICIPANT CHARACTERISTICS ................................................................................ 41
FOOD IDENTIFICATION ................................................................................................ 41
PROVIDED FOOD: IMAGES CODED BY RATER .................................................... 41
DIETCAM .................................................................................................................... 43
PERCENT AGREEMENT FOOD IDENTIFICATION: DIETCAM VS. PROVIDED
FOOD ........................................................................................................................... 43
PARTICIPANTS’ FEEDBACK .......................................................................................... 44
PARTICIPANTS’ EXPERIENCE ................................................................................. 44
LIKELIHOOD AND COMFORTABLENESS OF WEARING SONY
SMARTEYEGLASS ..................................................................................................... 44
FOOD VOLUME .............................................................................................................. 45
WFI VS 24-HOUR DIETARY RECALL ...................................................................... 45
DISCUSSION ........................................................................................................................... 46

vii
REFERENCES........................................................................................................................ 53
APPENDICES ......................................................................................................................... 58
APPENDIX 1 – TABLES & FIGURES ................................................................................. 59
APPENDIX 2 – IRB FORM B ............................................................................................... 80
APPENDIX 3 – RECRUITMENT FLYER ............................................................................ 96
APPENDIX 4 – PHONE SCRIPT .......................................................................................... 98
APPENDIX 5 – CONSENT FORM ..................................................................................... 104
APPENDIX 6 – STUDY MEASURES ................................................................................ 110
APPENDIX 7 – STUDY PROTOCOL................................................................................. 117
APPENDIX 8 – SONY SMARTEYEGLASS INSTRUCTION ............................................ 136
VITA ...................................................................................................................................... 140

viii
LIST OF TABLES Table 1. Description of study design. ........................................................................................ 60
Table 2. Detailed description of provided foods. ....................................................................... 61
Table 3. Detailed description of meal sessions. .......................................................................... 62
Table 4. Participant characteristics. ........................................................................................... 63
Table 5. Summary of images coded by raters: Meal A and Meal B. ........................................... 70
Table 6. Results of DietCam food identification. ....................................................................... 71
Table 7. Results of food identification (classification): DietCam vs provided food. ................... 72
Table 8. Questionnaire results: Easiness of using Sony Smarteyeglass. ..................................... 73
Table 9. Questionnaire results: Clearness of instructions for using Sony Smarteyeglass. ........... 73
Table 10. Questionnaire results: Satisfaction with experience using Sony Smarteyeglass. ......... 73
Table 11. Questionnaire results: Likelihood of wearing Sony Smarteyeglass while eating at
different dining situations. ......................................................................................................... 74
Table 12. Questionnaire results: Likelihood to remember to wear Sony Smarteyeglass before
eating. ....................................................................................................................................... 74
Table 13. Questionnaire results: Comfortableness to use Sony Smarteyeglass if it captures
images other than eating. ........................................................................................................... 75

ix
LIST OF FIGURES Figure 1. Flow of study participants. ......................................................................................... 64
Figure 2. First level of training DietCam for food identification, classification. ......................... 65
Figure 3. Results of DietCam food identification at first level, classification. ............................ 66
Figure 4. Example image coded by raters. ................................................................................. 67
Figure 5. Second level of training DietCam for food identification, subclass identification: Single
food. ......................................................................................................................................... 68
Figure 6. Second level of training DietCam for food identification, subclass identification: Mixed
food. ......................................................................................................................................... 69
Figure 7. Mean weight of Regular-shaped foods: 24-hour Dietary Recall vs. WFI. .................... 76
Figure 8. Mean weight of Irregular-shaped Foods: 24-hour Dietary Recall vs. WFI. .................. 77
Figure 9. Mean weight of Single foods: 24-hour Dietary Recall vs. WFI. .................................. 78
Figure 10. Mean weight of Mixed foods: 24-hour Dietary Recall vs. WFI. ................................ 79

1
CHAPTER I: LITERATURE REVIEW

2
DIETARY ASSESSMENT
Dietary assessment is used to determine the nutrient intake of individuals and groups.1
Accurate dietary assessment is essential to nutrition research to understand how diet impacts
health.2 Currently, there is no gold standard or single method of dietary assessment that is
applicable for all nutrition research questions, as the purpose, population of interest, and
resources available in any investigation impact the method of assessment that can be
implemented.1
SUBJECTIVE DIETARY ASSESSMENT
Subjective dietary assessment is obtained through self-report methods. These methods of
dietary assessment are widely used in free-living situations. Three common self-report dietary
assessment methods include 24-hour dietary recall, food record, and food frequency
questionnaires (FFQ).3
The 24-hour dietary recall, with at least three days (two non-consecutive weekdays and
one weekend day), is considered close to the gold standard.4 A 24-hour dietary recall is a dietary
assessment tool in which an individual reports on all foods and beverages consumed (including
portion sizes) in a previous 24-hour period during a recall interview conducted in person, by
phone, or by using a computer interface.1,5,6 In-person and phone methods require a trained
interviewer with knowledge of foods available in the community, as well as commonly used
cultural dietary practices to obtain dietary information.1,5 The interview contains structured
questions to aid the individual to remember all the foods and portion consumed in the past 24
hours.5 The 24-hour dietary recall not only provides detailed dietary information on foods and
beverages consumed on a specific day and the total amount of each food and beverage
3
consumed, it also provides contextual information, such as meal and snack patterns, food
preparation, and timing and location of meals.7
The Automated Multiple Pass Method (AMPM) is designed by the United States
Department of Agriculture (USDA) to enhance the accuracy of 24-hour dietary recall and reduce
respondent burden.8 The AMPM is a five-step computerized method to collect dietary data by
interviewer.8 The five-step approach includes the following steps: 1) collecting a list of foods
and beverages consumed; 2) obtaining forgotten foods; 3) describing the time and eating
occasion; 4) acquiring detailed information of consumed foods and beverages; and 5) collecting
any additional missing information.8 The AMPM has been used in the United States National
Health and Nutrition Examination Survey yearly since 2002.8
One strength of 24-hour dietary recall is that it reduces literacy barriers (unless using a
computer interface in which a participant inputs information).1,3 The 24-hour dietary recall is
also less burdensome to individuals as compared to a food record.5 In addition, 24-hour dietary
recall is less likely to influence dietary intake as compared to non-recall methods, as collection of
information on dietary intake happens after eating has occured.5 However, there are limitations
associated with 24-hour dietary recall that might affect the accuracy of dietary data and create
bias. The 24-hour dietary recall relies on memory and knowledge to report food consumption
and estimate portion sizes.3,5 Another limitation of 24-hour dietary recall is that it can be labor-
intensive regarding what is required for data collection and analysis.9 Due to the high cost of
interviewer-administrated 24-hour dietary recall, this method may not be feasible for use in large
scale studies.5 Furthermore, studies have shown that 24-hour dietary recall has problems of
underreporting, when reported intake is compared to weighed dietary assessment methods and
biological markers, with issues of underreporting more prevalent in populations with obesity.10-13

4
A food record, also called food diary, requires individuals to record all foods and
beverages and their amounts consumed, immediately following consumption, for at least three
consecutive days.1,5 The recording can be done by hand or electronically.14 Individuals need to
receive adequate training to accurately describe foods and beverages and learn how to weigh and
measure foods and beverages to report portion sizes consumed.1,5 Similarly to 24-hour dietary
recall, food records can also assess contextual information, such as meal and snack patterns, food
preparation, and timing and location of meals.14
A strength of food records is that it does not rely on individuals’ memory to report dietary
intake, which can eliminate memory errors.1,3 If foods and beverages are weighed or measured at
each eating episode, errors from portion size estimation can be minimized.5 A disadvantage of
food records is that study samples need to be literate, which limits the method being used in
some specific populations, such as new immigrants or low literacy groups.1,3,5 Another
disadvantage of food records is that there is limited generalizability of dietary intake information
obtained from food records.1 As completing food records in the recommended method is highly
burdensome, individuals who complete food records as foods and beverages are being consumed
are usually highly motivated and dedicated, making the data hard to be used to represent the
general population.1 The third disadvantage is that data analysis process of food records is labor-
intensive, especially if dietary data are entered manually.1,9 This makes the food records difficult
to administer in large population studies.1 Another disadvantage of food records is
underreporting. Studies have shown that individuals tend to underreport and underestimate
dietary intake when using food records compared to biological markers, especially in populations
with obesity.12,15 In addition, food records may alter dietary intake, thus not providing
information on current intake.1,9 Rebro and colleagues16 studied the effect of writing food records

5
on eating behaviors among women aged 50 to 79 years old.16 A sample of 176 four-day food
records were randomly selected and analyzed.16 Investigators found that the food items, food
components, and snacks recorded on day four were significantly less than those on day one.16
Thus, the investigators interpreted that individuals might decrease food consumption and reduce
the complexity of the foods consumed to finish the food records.16 The increase awareness of
what is being consumed when writing food records may also alter intake.1
A FFQ assesses typical frequency of consumption of foods and beverages during a
specific time interval (usually about six months) using a list of foods and beverages.5,6 The semi-
quantitative FFQ includes questions with standard portion sizes listed for each item17 while the
quantitative FFQ allows individuals to choose their own portion sizes consumed.1 The FFQ can
be collected via a questionnaire provided as a hard copy or as a questionnaire provided
electronically. The FFQ can be self-administered or administered by a trained interviewer.1
Currently, there are many developed FFQ instruments for different populations and purposes and
these instruments are often linked to a database for nutrient intake estimation based on
individuals’ answers.5 Commonly used FFQs include the Harvard Willett FFQ developed by
Willett and colleagues,18,19 the Block FFQ developed by Block and colleagues,20 and the Diet
History Questionnaires developed by Thompson and Subar.13,21-23
A strength of FFQ is that it collects individuals’ usual dietary intake over a long period.3,5
Unlike other subjective dietary assessment methods, FFQ can be used to avoid sudden changes
in recent diet (i.e., due to illness or disease) by collecting dietary information prior to that
period.5 Also, FFQ is less burdensome to collect dietary information for the respondent and
staff.17 Compared to 24-hour dietary recalls and food records, FFQ is often used to assess usual
dietary intake from large numbers of people (i.e., over 100 individuals).17 Weaknesses of FFQ

6
include that it relies on individual’s ability to report the frequency of food patterns and portions
over a long period of time.3 Also, the nutrient intake estimation of FFQ is not as accurate as
compared to 24-hour dietary recalls and food records.5 When validated with doubly labeled
water (DLW), FFQ is found to underestimate energy intake by up to 38% in women and 36% in
men.13 The difference in accuracy is believed to be due to the use of incomplete lists of foods,
errors in frequency and portion size estimation.5 In addition, FFQ does not collect detailed
dietary information including food preparation, specific foods and beverages consumed, and
contextual information, such as meal and snack patterns, and timing and locations of meals.24 In
terms of literacy level, the self-administered FFQ requires higher literacy level than interviewer-
administered FFQ.5
The accuracy of traditional self-reported dietary assessment methods has been questioned
by many researchers due to concerns of measurement errors that lead to inaccurate dietary
data.2,3,6,25 The main challenges in accuracy of dietary data with subjective dietary assessment
methods include reliance on memory (which might create bias), inability to accurately quantify
portion sizes consumed, cost, and alteration of dietary behaviors as data are being collected.
Although when weighed food records are completed as food is being consumed, thus not
involving memory, it still relies on individuals to weigh and measure all foods and beverages
prior to and after consumption and to record this information, which can still introduce human
errors. These challenges indicate that objective methods that reduce reliance of procedures on
individuals are needed to minimize bias and estimation issues to enhance the accuracy of dietary
assessment.
Technology advancement has led to the development of new methods to address many
limitations previously described in self-reported dietary assessment conducted in free-living

7
situations. Initial use of technology focused on internet-based platforms without the use of
images accessible by computers, personal digital assistants (PDAs), or smartphones.26 These
technologies without the use of images focused on reducing the time needed to collect and
process data, thereby reducing participant and staff burden.26,27 An example of this is the
National Cancer Institute’s Automated Self-Administered 24-hour recall (ASA24), which is a
self-administered 24-hour dietary recall completed on an internet-based platform.28 Even though
these new technology-based dietary assessment methods without the use of images reduced
participant and staff burden, this type of technology does not appear to impact on reducing
inaccuracy of the data caused by memory recall or inability to correctly quantify portion sizes
consumed.29-31
OBJECTIVE DIETARY ASSESSMENT
Objective dietary assessment collects dietary intake using methods that do not involve
self-report. The most commonly used objective dietary assessment methods include weighed
food intake (WFI) and biomarkers that reflect dietary intake. One of the most commonly used
biomarkers for assessing energy intake via determining energy expenditure is DLW.1
WFI, also called “plate waste,” can only be used when all foods and beverages consumed
can be weighed before and after consumption by a second person in which the dietary
assessment is not being conducted.9 WFI is usually obtained in a controlled environment, such as
laboratory or cafeteria-like setting.9 In these settings, the items that can be selected to consume
are controlled (or set due to a menu) and participants usually eat in the setting, allowing for
everything to be measured prior to and after consumption.9 A strength of WFI is that quantity of
foods and the items consumed can be objectively determined.17 Even though accurate dietary

8
information can be obtained from WFI, the controlled environment where eating occurs does not
necessarily represent food consumption in free-living situations.9
DLW is the gold standard method to determine energy expenditure in free-living
situations.1 It is a biomarker used to calculate carbon dioxide production indirectly, and the
carbon dioxide production is used to calculate energy expenditure by the use of standard
equations for indirect calorimetry.1 DLW is applicable to a wide range of protocols and has been
used as a validation tool to estimate energy intake in a free-living environment.1,9 However,
DLW only provides information about energy intake (assuming that participants are weight
stable so that the calculated energy expenditure represents energy intake).1 Other disadvantages
of DLW include its high cost and the need for technical skills to perform the analysis.1,9,32
USE OF IMAGE-ASSISTED TECHNOLOGY TO ADDRESS DIETARY ASSESSMENT
ACCURACY
To reduce the errors encountered in subjective dietary assessment in free-living situations
and allow collection of detailed dietary intake in free-living situations, researchers have
developed image-assisted dietary assessment, which is a new method of using technology to
enhance dietary assessment acuracy.33 This type of dietary assessment is defined as any method
that incorporate images or videos of dietary intake to enhance self-reported dietary intake or to
obtain dietary intake. Image-assisted dietary assessment is categorized into two types: active and
passive.33
ACTIVE IMAGE-ASSISTED DIETARY ASSESSMENT
Active image-assisted dietary assessment is self-administered and requires individuals to
manually capture images or videos with digital cameras, smartphones, and other devices with
picture-capturing function.33 Images are taken before and after each eating episode and are

9
usually taken with measurement references for manual or automated image analysis processing.33
The studies reviewed below focused on active image-assisted dietary assessment that is validated
in comparison with objective dietary assessment methods, such as DLW or WFI.
Rollo and colleagues34 conducted a pilot study to validate Nutricam Dietary Assessment
Method (NuDAM) in adults with type 2 diabetes. NuDAM consisted of Nutricam, a mobile
phone application, and a follow-up phone call to the participants the next day. Nutricam was an
image-based food record application on mobile phones that allowed users to capture foods before
and after eating episodes, with images captured at a 45-degree angle. Participants also recorded
audio to describe the photographs and provide specific information about location, meal
occasion, and consumed foods (such as brand names and preparation methods). A reference card
(9 cm x 5 cm) was placed next to the food items to assist with estimating portion sizes. A prompt
card with instructions for recording intake was also attached to the mobile phone to remind users
of the instructions for dietary assessment. Images and audio recordings were then sent to a
website and analyzed by a dietitian. On the next day, dietitians called participants to collect
additional intake information for the NuDAM record, as well as any potential unreported foods.34
Ten participants with type 2 diabetes and no recent weight loss between 18 to 70 years
old were asked to participate in the study.34 Participants recorded their dietary intake with
NuDAM in the first week and food records in the second week for three nonconsecutive days
(one weekend day and two weekdays). DLW was used as the reference method to determine total
energy expenditure for two weeks. Anthropometric data (height and weight) were collected at
day 0, 8, and 15 to assess weight changes, and dietary restraint was also measured at baseline to
account for any factors that may cause misreporting of dietary intake. Participants were asked to
complete questionnaires on their experience with NuDAM and food records at the end of each

10
week. Dietary information from NuDAM and food records were analyzed by three dietitians. To
analyze NuDAM records, dietitians first identified food items, and then quantified the items with
a portion size estimation tool developed by the investigators’ research team. The tool consisted
of different reference images of foods, serving tools, and food shapes. For the food records, the
dietary information was entered directly into nutrition analysis software called FoodWorks
program.34
A low level of dietary restraint was found in participants and no significant weight
changes were found in participants during the two-week investigation period.34 Investigators
reported that the overall mean energy intake from NuDAM (8.8 ± 2.0 MJ/day) and the food
records (8.8 ± 1.8MJ/day) were significantly lower than the mean total energy expenditure
calculated from DLW (11.8 ± 2.3 MJ/day). The percentage of underreporting compared to the
total energy expenditure was -23.7% in NuDAM and -23.9% in food records. Eight out of ten
participants underreported their intake in either NuDAM, food records, or both. None were found
to be over-reporting of energy intake. For the results of questionnaires, investigators found that
all participants preferred to use NuDAM to record dietary intake instead of food records.
However, the questionnaires revealed that changes in eating behaviors were reported when using
both methods (nine participants with NuDAM and six with the food records). Another limitation
of the study was that the same dietitian was used to clarify intake data and estimate intake. The
familiarity with the participants’ dietary intake may affect the results of intake estimation. In
addition, investigators did not provide any information on the quality of the pictures taken by
participants or how many pictures could not be used for analysis.34
Martin and colleagues35 validated a dietary assessment method called Remote Food
Photography Method (RFPM) to estimate energy and nutrient intake in free-living adults. RFPM

11
allowed individuals to use cell phones with cameras to capture images of foods prior to and after
consumption, with a reference card placed next to the plates. Customized prompts were sent to
remind participants to capture images of food selections and foods that was remaining after
consumption. Food images were then sent to a computer program (Food Photography
Application) through a wireless network to estimate food types and grams amount consumed.
The images were analyzed semi-automatically, in which a dietitian was responsible to review all
computer-analyzed results and make changes on estimated food portions manually when
necessary. Fifty adults between 18 to 65 years of age with a stable weight were asked to capture
images of foods before and after eating for six days under free-living conditions and in two
laboratory-based buffet meals. DLW was used as a reference to determine energy expenditure in
the free-living conditions. In the laboratory-based buffet meals, two lunches were provided two
days apart and consisted of sandwiches, pretzels, cookies, fruit cocktail and a beverage. User-
satisfaction was also assessed with participants rating at the end of the study.35
The investigators found no significant difference of the estimated energy intake between
RFPM and DLW.35 During laboratory-based buffet meals, the energy and nutrient contents
estimated from RFPM did not show a significant difference when compared to weighed intake.
RFPM underestimated energy intake by 152 ± 694 kcal/day under free-living conditions and 4 ±
73 kcal for laboratory-based buffet meals. Investigators also noted that there was no significant
change of eating behaviors (overeating or undereating) while using RFPM. In terms of user
satisfaction, the results showed that participants were satisfied with RFPM and the ease of use.
Investigators did not provide any information on how many images were included and usable for
analyzing dietary intake. Also, investigators did not provide any information regarding errors of

12
the automated computer analysis and how often the dietitian was needed to review the computer
program and manually make changes to dietary data.35
Boushey and colleagues36 investigated the accuracy and usability of the Mobile Food
Records (mFR), an application which allows individuals to capture images manually to record
food intake on mobile phone to yield energy and nutrient intake, in community dwelling
individuals as compared to DLW. Forty-five men and women, who were between the ages of 21
and 65 years and resided in a rural county in the Midwest, were included in the study.
Participants were asked to attend three visits at Purdue University campus during the study
period. The second and third visits were approximately seven days apart. At the second visit,
participants received instructions on using mFR to capture images prior to and after eating
episodes, and also practiced using mFR on food models. Participants were asked to start
recording dietary intake using mFR when a practice meal was provided at the second visit.
Participants were then asked to continue recording all eating episodes using mFR for 7.5 days
until the third visit. Pre-packed and weighed foods, based on estimated energy requirement for
each participant, were provided to participants during all the remaining 7.5 days. Participants
were required to return all foods that were not consumed for plate waste purpose. Aside from the
pre-packed foods provided, participants could also consume additional foods and beverages.36
For the instruction of capturing images of dietary intake, participants were asked to
capture the images with a provided reference marker with known dimensions next to the foods
and at certain angles for the purpose of food identification and portion estimation.36 Acceptable
images taken by participants would automatically be uploaded to the central server for automatic
image analysis, which was trained on the foods and beverages that were provided in the pre-
packed foods prior to the investigation. After the automatic food identification, participants were

13
able to review and confirm the results, and made necessary changes to complete food records
through a list of foods in the system. All images taken by participants prior to and after eating
episodes were also reviewed by three trained analysts to either identify and estimate food items
(both provided pre-packed and not provided) in the images using standard protocol. The three
analysts also used the Food and Nutrient Database for Dietary Studies developed by the USDA
to estimate the reported energy intake of each participant from mFR. The plate waste method
was used to determine the difference between provided pre-packed foods and the leftover
returned from the participants to estimate the presumed energy intake.36
Boushey and colleagues36 found a statistical difference of mean energy intake of 579
kcal/day between reported energy intake from mFR (2353kcal/day) and total energy expenditure
estimated by DLW (2932 kcal/day). When comparing the reported energy intake from mFR and
the presumed energy intake, the investigators found a mean difference of 20 kcal/day between
two methods. The investigators also found 53% of participants underreported food intake and 2%
overreported. In term of usability of mFR, the majority of participants reported being willing to
use mFR, but some reported that the automatic food identification was slow and the accuracy of
it was low.36
The results of the above studies suggest that using active image-assisted dietary
assessment can provide relatively comparable measures of energy intake as compared to WFI or
DLW. However, the main challenge is that these methods still rely on individuals to manually
capture images and thus would increase the possibility of missing meals (no information found
for the above studies). Missed eating episodes may lead to inaccurate energy and nutrient
calculation. These active dietary assessment methods usually require users to take images at
certain angles and with references placed next to the foods. Images with blurry quality, incorrect

14
angles, insufficient lights, and without references cannot be analyzed manually by human or
automatically via computer software. No information was provided in the studies regarding the
frequency of occurrence of these issues.
PASSIVE IMAGE-ASSISTED DIETARY ASSESSMENT
In passive image-assisted dietary assessment methods, images or videos automatically
capture dietary intake through the use of wearable devices or other tools that do not rely on
individuals to actively capture images.33 It is believed that removing the need for participants to
“remember,” either via memory to engage in directions for capturing images (i.e., actively take
pictures, use correct angle for taking images, place marker close to foods in images, etc.), will
enhance accuracy as compared to active image-assisted dietary assessment.3 The studies
reviewed below focused on validating wearable devices in comparison to objective dietary
assessment methods such as DLW or WFI.
Image-Diet Day, a dietary assessment system developed by Arab and colleagues37, used a
wearable camera-phone to automatically capture and transmit images. Image-Diet Day consisted
of two components – a mobile phone (model Nokia N80) with a three-mega pixel camera and the
computer-assisted, multi-pass 24-hour recall. The mobile phone was designed to be worn around
the neck and capture images every ten seconds. Battery life of the mobile phone was managed by
a specific application to balance power savings and performance. Maximum 100 images could be
saved in each mobile phone. Poor quality images were filtered, and key images were saved
chronologically in groups for review. In terms of privacy, participants could review images and
delete any images that they did not want to share with the investigators. The images were then
used as a memory aid for the users to complete the web-based 24-hour recall called DietDay.37
15
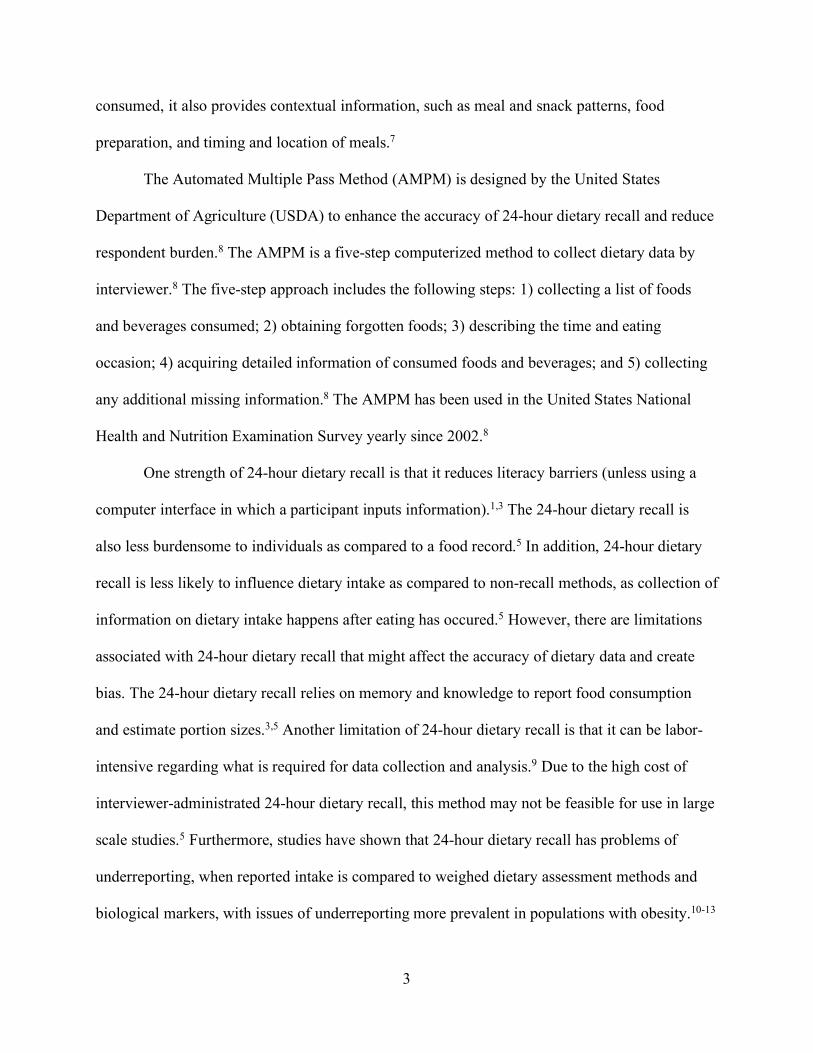
Arab and colleagues37 conducted a study to test the feasibility of the Image-Diet Day to
enhance the self-reported dietary assessment. Fourteen healthy participants (non-Hispanic
Caucasian and African American adult men and women), who had enrolled in another
biomarker-based validation study, were recruited in the study. Participants were asked to wear
the mobile phone around their neck for one week and turn on the camera prior to each eating
episode. Total energy expenditure determined by DLW was used as a reference. A total of 110
eating episodes were recorded and 11,090 images were uploaded. Investigators found that the
estimated intake calculated from Image-Diet Day (2359 kJ) was closely matched to the total
energy expenditure determined by DLW (2377 kJ), with only 18 kJ of underestimation from the
Image-Diet Day. Acceptability and feasibility of Image-Diet Day were also assessed. A total of
71% of participants reported having difficulty on wearing the device and 21% encountered
technical problems with the device. Participants’ comments regarding the Image-Diet Day were
related to the need to recharge the device and increased self-consciousness of wearing the device
in public, which might lead to alteration of dietary behaviors. However, 57% of participants
found that the images were helpful in reporting dietary intake. The results suggested that passive
imaging was a promising method to collect dietary intake information.37
Although Image-Diet Day included a mobile device to automatically capture images of
foods, the main limitation was that the system required participants to manually enter their
dietary intake online using the captured images. The requirement of participants to enter foods
and portions consumed manually not only increased the burden of the participants, but also
introduced the possibility of human errors; thus, these problems might affect the accuracy of
dietary data. With the wearable mobile phone, the main technical issue was the short battery life,
which was not adequate to capture images for the entire day.37 This technical issue was also the

16
concern for some participants as stated in post-study interview.37 During the technical feasibility
test, some devices required a replacement of battery.37 The second technical issue was the slow
imaging frequency (about 6 images per minutes). This might not capture all the foods and
portions consumed during meal time and thus might introduce the problem of underreporting.
However, battery life should also be enhanced to increase imaging frequency.37 The third
technical issue was the appearance of the wearable mobile phone. As indicated from the
participants’ feedback, the current appearance of the device increased participants’ self-
consciousness of wearing it in public, which might lead to change in dietary behaviors.37
Another wearable camera, SenseCam, was developed by Microsoft and was intended to
be worn around the neck to passively capture images every 20 seconds in response to changes in
motion, light and temperature.38 SenseCam internal storage was sufficient for one week and
battery was enough for 12 to 16 hours per day. A privacy button on SenseCam was designed to
temporarily stop capturing images when necessary and SenseCam would automatically re-start
the capturing function after seven minutes.
Gemming and colleagues38 conducted a study to validate SenseCam-assisted 24-hour
recall on measuring energy intake while comparing to total energy expenditure estimated by
DLW. Forty adults (20 males and 20 females) aged between 18 to 64 years with mean body mass
index (BMI) of 27 kg/m2 were asked to wear SenseCam before eating episodes for four set days
(one test day and three actual data collection day) over a 15-day period. Participants were also
asked to wear SenseCam throughout the day while awake with the option to remove it anytime
when they felt uncomfortable. On the day after wearing SenseCam, participants completed the
paper-based multiple pass 24-hour recall (MP24) with a trained dietitian in person with tools to
help the participants to estimate portion sizes, such as standard household measure, example

17
crockery and glassware, and portion size guide. After completion of MP24, participants could
view the images privately and delete any images that they did not wish to disclose with the
records to be seen by the researchers. The dietitian then reviewed the SenseCam images with the
participants. Participants could confirm, modify, or add any information to MP24 that was
collected prior to the review of the SenseCam images, and this method was identified as MP24
plus SenseCam images. DLW was used to assess the total energy expenditure during four data
collection appointments for each participant. Before DLW, resting energy expenditure was
measured via indirect calorimetry to aid in determining total energy expenditure during the
investigation period.38
Investigators reported that one participant was noncompliant to wear the SenseCam and
six devices malfunctioned during study period.38 The results of total energy expenditure
measured by DLW and energy intake assessed by MP24 and MP24 with SenseCam images were
compared. In male participants, mean energy intake reported in MP24 only underestimated 17%
and MP24 plus SenseCam images underestimated 9% when compared to total energy
expenditure measured by DLW. In female participants, the results of mean energy intake
reported in MP24 underestimated 13% and MP24 plus SenseCam images underestimated 7%.
Investigators reported that the use of SenseCam images with MP24 significantly reduced
underreporting for both males and females when compared to MP24 alone. No significant
difference of energy intake was found between MP24 with SenseCam images and total energy
expenditure from DLW. Investigators did not report any mean energy intake results for
combined sex.38
The main limitation of the study was the manual image analysis process particularly only
a single dietitian was used in both dietary assessment and image review. These procedures were

18
not audited during the study period, which might potentially introduce human errors and bias.
Second, the option for the participants to review and delete any images that they did not want to
disclose on records might be another limitation. Participants might delete any food images during
private screening, which then might result in underreporting.
Gemming and colleague38 suggested that SenseCam significantly reduced the
underreporting in typical 24-hour recall. However, there are several limitations of SenseCam that
need to consider. Under insufficient light, the quality of images captured by SenseCam can be
relatively poor. Also, SenseCam has a slow capturing frequency that is insufficient to capture all
the consumed foods. These issues might result in production of useless images that might affect
the effectiveness of using SenseCam images during dietary assessment. Another limitation is that
SenseCam has a relatively short battery life (12 to 16 hours) as a device that is intended to be
worn throughout the day to capture dietary intake passively.38
Pettitt and colleagues39 developed another wearable device (currently called wearble
micro-camera) and conducted a pilot study to evaluate its ability to improve dietary assessment
accuracy. The wearable micro-camera was designed to be worn on the ear and had a wide-angle
lens (170-degree view angle) to take audiovisual recordings during eating episodes. The length
of each eating episode could also be measured using the audiovisual recording feature. Six
healthy participants between the ages of 24 to 30 with moderate to high activity levels were
recruited and asked to wear the wearable micro-camera during meal times for three study days
(two weekdays and one weekend day). Participants were instructed to turn on the wearable
micro-camera before each eating episode. Participants were also asked to complete 14-day food
records with instructions provided by a trained researcher at baseline. The 14-day food records
and micro-camera images were analyzed by a dietitian. Standard portion size estimations were

19
used if details were not provided. No additional information was provided on how the micro-
camera images were being analyzed. DLW was used to determine total energy expenditure over
14-day study period. At baseline, anthropometric data were collected. Resting metabolic rate was
measured at each visit using indirect calorimetry. Estimated energy intake from 14-day food
records and food records plus micro-camera images were compared to total energy expenditure
determined from DLW.39
The investigators reported that only two days (out of three-day attempted recording)
worth of eating episodes were recorded due to short battery life of the camera.39 When compared
to total energy expenditure determined from DLW, results from two-day food records alone
showed a significant difference of estimated energy intake with 34% (-3912kJ) underreporting.
Two-day food records plus micro-camera images had 30% (-3507kJ) underreporting, which was
also found significant, when compared to total energy expenditure from DLW. The mean
estimated energy intake calculated from 14-day food records resulted in closer values to total
energy expenditure determined from DLW when compared to the results of both two-day food
records with or without micro-camera images. A reduction in energy intake was noted in the
two-day food records when the camera was in use as compared to the 14-day food records,
which led the investigators to indicate that the wearable micro-camera might affect eating
behaviors. Feedback from participants confirmed that the device did affect their activities and
they also felt uncomfortable wearing it in the public. There was no information reported on the
quality of the micro-camera captured images and how many poor quality images were eliminated
during the analysis process.39
The results of this study suggested that dietary images with food records did improve the
underreporting rate when compared to the food records alone collected for the same amount of

20
days.39 However, the errors was still significantly different from the actual total energy
expenditure determined from DLW.39 The main limitation of this study that might contribute to
this high error rate was the manual image analysis process.39 Human errors and bias remained as
a major challenge in this manual analysis process.
There are limitations with the wearable micro-camera. The main limitation is the short
battery life. In the study conducted by Pettitt and colleagues,39 the issue of insufficient battery
caused the study to only have two days worth of dietary data instead of planned three days. Due
to the short battery life of the device, the users need to turn the camera on to begin recording
process and regularly charge the device.39 Thus, the user bias remain as an issue that would
potientially lower the accuracy of the dietary data.39 Another limitation is the appearance of the
device. Participants’ feedback from the validation study revealed that most participants did not
want to wear the micro-camera in public.39 The unwillingness to wear the device might introduce
another user error, potentially increasing underreporting, as the users might not record all the
eating episodes.
eButton, a wearable computer with camera, was developed by Sun and colleagues40 and
was designed to be worn on the chest. eButton captures images passively every one to five
seconds. Circular dinning plate/bowl with known sizes (diameter and depth) and shapes were
required to be placed in the image for portion size estimation. Captured images were saved to the
micro SD card in the device and were analyzed semi-automatically when downloaded. All
images were first automatically segmented into groups of similar images and key frames were
then chosen as the representative images. For privacy protection, all images were automatically
processed to recognize human faces and block them before being reviewed. At eButton’s current
stage of development, identification of food items was required to be done manually. However,

21
eButton could segment each food item and estimate volumes of each food automatically. After
food recognition and portion size estimation, the name of foods and portion sizes were to be sent
to USDA’s food database to determine energy and nutrient information.40
Jia and colleagues41 evaluated the accuracy of portion size estimation by eButton when
compared to human raters’ estimation and actual food volume. Seven participants were recruited
from the investigators’ laboratory and received instructions on how to use the eButton before the
study. No further information was provided on participants’ characteristics for the study.
Investigators examined 105 foods (Asian and Western foods) with 78 of them amorphous in
shape and 22 being non-amorphous. No liquids were included in the study. Foods were either
prepared by participants or purchased from fast-food restaurants. Participants were asked to wear
eButton during eating occasion. Foods were wrapped in plastic film and then submerged in a
pool of millet seeds to determine the volume of the foods (i.e. the difference in volume of millet
seeds before and after submerging). Selected food images were analyzed by eButton and three
raters (a dietitian, a volunteer, and a lab member) to estimate the portion size of each consumed
food. For the result of volume estimated by eButton, 15% of the food volume estimation had
over 30% errors. The mean relative errors of estimated volumes between eButton and the actual
food volume was -2.8% among all food samples. When compared to the actual food volume,
three raters’ volume estimation had higher mean relative errors with the error range between -
15.5% to -78.8%. The result suggested that eButton had less errors in portion size estimation
when compared to human raters.41
eButton provided higher accuracy in volume estimation when compared to estimation
completed by human manually.40,41 However, there are several issues needed to be addressed in
eButton. First, the main issue is that the food recognition process is done manually.40 This might

22
potentially introduce human errors and bias, and thus affecting the accuracy of the dietary data.
Second, eButton currently has low battery support which can only last four to eight hours
depending on the sensors and capacity of the rechargeable battery.40 Poor battery life is a
disadvantage for a device that is designed to be worn continuously during eating episode. Also, it
will be very burden and challenged for users to charge the device multiple times during the day,
which might potentially miss capturing all the eating episodes. Third, a known reference is
required to present in the picture to aid in volume estimation.41 Sizes of reference objects must
be provided before volume estimation.41
In sum, the validation studies showed that wearable devices that passively capture
images/videos could help in increase the accuracy of dietary assessment and provide objective
dietary information.37-39,41 However, there are technical issues of the reviewed devices, which
include insufficient battery life, poor quality images, slow capturing frequencies, and insufficient
memory. None of the reviewed passive image-assisted dietary assessment methods have fully
automated image analysis capabilities for both food identification and volume estimation without
reference objects. Thus, human errors and bias remain as an major issue with these wearable
devices.
The current dietary assessment methods have limitations that can affect the accuracy of
dietary data. Currently, subjective dietary assessment methods are widely used in research.
However, these subjective methods are prone to errors due to issues of accuracy of capturing all
foods and beverages consumed as a consequence of recall errors and determining portion sizes of
foods and beverages consumed due to poor estimation or inaccurate measurements.3,5 Self-
reported dietary data also appears to have systematic bias, in which populations with obesity are
more likely to underreport intake.10-13,15,42-44 Subjective methods are also labor-intensive in

23
regards to data collection and/or analysis.1,9 Technology-integrated, but not image-assisted, self-
reported dietary assessment methods do not address the forementioned issue of human errors and
bias in traditional self-reported dietary assessment since humans are still involved in the process
of recalling and collecting dietary data.45 Objective dietary assessment can limit human errors
and provide objective dietary information.1,17 However, few objective dietary assessment
methods are available in free-living situations, and these objective methods can be costly and
difficult to be used in studies with large samples.1,9,32 The incorporation of image technology into
dietary assessment (image-assisted dietary assessment) has been investigated by researchers to
improve accuracy in collecting dietary information in free-living situations.33 Reviewed studies
validated different methods in using image-assisted dietary assessment. For active image-assisted
dietary assessment methods, the overall results suggested that these methods had improved
accuracy and provided comparable accuracy of dietary information when compared with
reference methods such as DLW and WFI.34-36 However, the active image-assisted dietary
assessment methods still rely on humans to manually capture images, which does not eliminate
human errors. Passive image-assisted dietary assessment methods can reduce human errors as the
process of collecting dietary information reduces the effort and training needed to obtain
imagery.33 The results of reviewed passive image-assisted dietary assesment methods showed
improved accuracy in assessing dietary information.37-39,41 However, all the passive image-
assisted dietary assessment methodologies at this time involve manual image analysis processes
for either food identification or volume estimation with reference objects, which increases cost.
Thus, there is a need for a wearable device that has the function of passive image capturing, with
automated image analysis software for food identification and volume estimation that requires no
reference objects, to provide accuate and inexpensive dietary information.

24
Therefore, the purpose of this investigation was to validate a passive image-assisted
dietary assessment method using images taken by Sony Smarteyeglass and an automatic image
analysis software, DietCam, to identify food items. The specific aims of this investigation were:
1) to determine the accuracy of DietCam in identifying foods in different shapes (Regular vs
Irregular) and complexities (Single food vs Mixed food); and 2) to determine the accuracy of
DietCam to estimate food volumes comparing with weighed food intake measured from plate
waste method.

25
CHAPTER II: MANUSCRIPT

26
INTRODUCTION
Dietary assessment is used to determine the nutrient intake of individuals and groups.1
Accurate dietary assessment is essential to nutrition research to understand how diet impacts
health.2 There are two types of dietary assessment methods: subjective and objective. Currently,
there is no gold standard or single method of dietary assessment that is applicable for all nutrition
research questions, as the purpose, population of interest, and resources available in any
investigation impact the method of assessment that can be implemented.1
Current dietary assessment methods have limitations that can affect the accuracy of
dietary data. Subjective dietary assessment methods, obtained through self-reported methods, are
widely used to assess dietary intake in free-living situations. Three common self-report dietary
assessment methods include 24-hour dietary recall, food record, and food frequency
questionnaires (FFQ).3 However, these subjective methods are prone to errors due to issues of
accuracy of capturing all foods and beverages consumed as a consequence of recall errors and
determining portion sizes of foods and beverages consumed due to poor estimation or inaccurate
measurements.3,5 Subjective methods are also labor-intensive in regards to data collection and/or
analysis.1,9 Self-reported dietary data also appear to have systematic bias, in which populations
with obesity are more likely to underreport intake.10-13,15,42-44 To begin to address these issues,
technology-integrated, but not image-assisted, self-reported dietary assessment methods were
developed. These initial efforts included uses of computers, personal digital assistants (PDAs),
and smartphones, and focused on reducing the time needed to collect and process data, thereby
reducing participant and staff burden.26,27 An example of this is the National Cancer Institute’s
Automated Self-Administered 24-hour recall (ASA24), which is a self-administered 24-hour
dietary recall completed on an internet-based platform. These initial technology-integrated, but

27
not image-assisted, self-reported dietary assessment methodology still do not appear to address
the inaccuracy of the data caused by memory recall or the inability to correctly quantify portion
sizes consumed.29-31
Objective dietary assessment methods collect dietary intake without involving self-report
methods. These methods include weighed food intake (WFI) and biomarkers such as doubly
labeled water (DLW) that reflect intake. These objective dietary assessment methods can limit
human errors and provide objective dietary information.1,17 However, few objective dietary
assessment methods are available in free-living situations, and these objective methods can be
costly and difficult to be used in studies with large samples.1,9,32
The incorporation of technology via images into dietary assessment (image-assisted
dietary assessment) has been investigated by researchers to improve accuracy in collecting
dietary information in free-living situations.33 Dietary assessment using images can be divided
into active and passive methods. Research on active image-assissted dietary assessment methods,
which are self-administered and require individuals to manually capture images or videos with
digital cameras, smartphones, and other devices with picture-capturing function,33 suggested an
improved accuracy and provided comparable accuracy of dietary information when compared
with objective dietary assessment methods.34-36 However, the active image-assisted dietary
assessment methods still rely on humans to manually capture images, which does not eliminate
human errors. Passive image-assisted dietary assessment methods, in which images or videos
automatically capture dietary intake through the use of wearable devices or other tools, can
reduce human errors as the process of collecting dietary information requires less effort and
training than the active image-assisted dietary assessment.33 The results of reviewed passive
image-assisted dietary assessment methods showed improved accuracy in assessing dietary

28
information.37-39,41 However, all the passive image-assisted dietary assessment methodologies at
this time involve manual image analysis processes to determine food identification or volume
estimation which increases cost. Thus, there is a need for a wearable device that has the function
of passive image capturing, with complete automated image analysis software, to provide
accurate and inexpensive dietary information.
Therefore, the purpose of this investigation was to validate a passive image-assisted
dietary assessment method using images taken by Sony Smarteyeglass and an automatic image
analysis software, DietCam, to identify food items and volume consumed. The specific aims of
this investigation were: 1) to determine the accuracy of DietCam in identifying foods in different
shapes (Regular vs Irregular) and complexities (Single food vs Mixed food); and 2) to determine
the accuracy of DietCam to estimate food volumes comparing with weighed food intake
measured from plate waste method.
STUDY DESIGN AND METHODOLOGY
STUDY DESIGN
To validate the accuracy of DietCam in analyzing food images taken by Sony
Smarteyeglass in food identification and volume estimation, a 2x2x2x2x3 mixed factorial design
was used, with a between-subject factor of the order of meals (Meal Order 1 and 2) and within-
subject factors of food shapes (Regular and Irregular), food complexities (Single food and Mixed
food), meals (Meal A and B), and methods of measurement (DietCam, weighed food intake
[WFI], and 24-hour dietary recall) (see Table 1). Individuals were randomized into one of the
two orders of meals. In each meal, participants were given a meal that included a regular-shaped
single food (i.e., cookie), an irregular-shape single food (i.e., ice-cream), a regular-shaped mixed
food (i.e., sandwich), and irregular-shaped mixed food (i.e., pasta dish). Dependent variables

29
were the identification of foods and amount of foods consumed (grams). The study was approved
by the Institutional Review Board at the University of Tennessee-Knoxville (UTK IRB) and was
registered at ClinicalTrials.gov (NCT03267004).
PARTICIPANTS
Thirty men and women were invited to participate in the validation study. The study was
advertised as an investigation of dietary assessment via digital images. To recruit participants,
flyers were posted around the University of Tennessee, Knoxville (UTK) campus. Individuals
who were interested in participating in the research study were asked to contact the Healthy
Eating and Activity Laboratory (HEAL) for more information and were screened over the phone
for eligibility. Participants were enrolled until 30 had been recruited and completed the study.
Eligibility criteria of this investigation included:
1. Between the ages of 18 and 65 years
2. Body mass index (BMI) between 18.5 to 24.9 kg/m2
3. No food allergies/intolerance to foods used in the investigation
4. Report not having a dietary plan or dietary restrictions that prevents consumption of the
foods used in the investigation
5. Report a favorable preference for the foods served in the meal (listed in Table 2), with
participants rating each food item ³ 3 on a Likert scale during phone screen
6. Able to complete all two meal sessions within four weeks of the screening session
7. Not legally blind without corrected lenses
8. Able to eat a meal while wearing Sony Smarteyeglass

30
Participants were excluded if they wore electronic medical devices such as pacemakers
and implantable defibrillators as the controller of Sony Smarteyeglass emits radio waves that
would affect the medical devices according to the Sony Smarteyeglass Reference Guide.46
A total of 54 individuals were interest in participating in the investigation. Of these
initially interested individuals, three were no longer interested in participating after initial phone
screenings with details provided regarding the study, and eleven were unable to be reached for
phone screenings. Of the remaining that were phone-screened for eligibility, eight became
ineligible for the following reasons: five reported a BMI outside the eligible range, one reported
being legally blind without corrected lenses, one reported disliking the foods provided in the
study, and one reported having food allergies or dietary restriction. After being phone screened,
all eligible individuals attended the screening session and signed the informed consent. After the
screening session, two more participants were excluded due to BMI outside the eligible range.
Thus, a total of 30 eligible participants participated in this study (see Appendix 1, Figure 1, for
the flow of study participants).
SONY SMARTEYEGLASS
Sony Smarteyeglass is developed by Sony Corporation and is an eyeglass that is intended
to be operated as an Android system mobile device.47 Sony Smarteyeglass has a display, built-in
camera, sensors, and a touch-sensitive controller and keys.47 Sony Smarteyeglass is designed to
be worn as usual eyeglasses, and the user is able to operate the eyeglasses via the touch-sensitive
controller.47 The controller can also be connected to an Android system device wirelessly.47 In
this study, Sony Smarteyeglass was connected to an Android system tablet, which was used by
researchers to review the recordings during meal sessions.

31
PROCEDURES
SCREENING SESSION
At the completion of the phone screen, 32 eligible participants were scheduled to come to
HEAL for one, 30-minute face-to-face screening session. All screening sessions were scheduled
between 11:00am and 5:00pm, Monday to Friday. During the screening session, eligible
participants signed a consent form. After signing the consent form, eligibility was confirmed by
taking height and weight measures. Participants were also asked to fill out a demographic
questionnaire. Prior to the start of the first meal session, eligible participants were randomized to
one of the two orders described in Appendix 1, Table 1. Participants were instructed for the meal
sessions to stop eating a minimum of two hours prior to the scheduled meal sessions and only
consume water during that period.
MEAL SESSIONS
After the screening session and randomization, participants were scheduled for two 40-
minute meal sessions, with approximately one week occurring between each session. All meal
sessions were scheduled between 11:00am and 5:00pm, Monday to Friday.
During both meal sessions, instructions on how to use Sony Smarteyeglass were provided
to participants. These instructions included how to wear and use the eyeglasses. Participants
were instructed that, after putting on the Smarteyeglass, to initiate the recording via the controller
of the Sony Smarteyeglass. After the recording was initiated and prior to starting to eat,
participants were instructed to look at each provided food at the table. Then, participants were
also instructed to turn their head toward their left shoulder, look at each food from the side, and
then repeat the same step by turning their head toward to the right shoulder. Participants were
then asked to start the meal by taking one bite of each provided food. For the first bite of each

32
food, participants were instructed to hold the food, either in their hand or on a fork or a spoon
(depending on the food), approximately 12 inches in front of the eyeglasses and to look at the
food. Following taking the first bite of each provided food, participants were instructed to eat
normally until satisfied. Participants were then given 30 minutes to eat. The investigator then left
the room while participants were eating. The investigator checked in with participants every 10
minutes. At the end of 30 minutes, participants were instructed to again look at each provided
food on the table at three different angles (looking straight at each food, from the left side and
the right side) following the exact same procedure at the beginning of the meal. The second meal
session followed the same procedure as the first meal session.
On the day following each meal session, participants were called to complete a 24-hour
dietary recall. Instructions were provided to participants about how to complete the dietary recall
at the end of each meal session and a two-dimensional visual aid was provided to aid participants
in estimating the consumed portions for each food and beverage item consumed. A total of 29
participants completed all 24-hour dietary recalls, with one recall missed from one participant
due to being unable to contact participant on the day following the meal session.
At the end of second meal session, participants were asked to complete a questionnaire to
provide feedback on their use of the Sony Smarteyeglass. After the second meal session was
completed, each participant was thanked for their participation and given a $20 gift card to
compensate for their time in the study.
MEAL DESCRIPTION
The meals that were served for this investigation contained foods that were categorized
into two food shapes (Regular and Irregular) and two food complexities (Single food and Mixed
food). Each meal contained four foods (see Appendix 1, Table 2, for detailed description of

33
foods), with the four foods representing the four potential food categories (regular-shaped single
food, irregular-shaped single food, regular-shaped mixed food, irregular-shaped mixed food).
Along with the four foods, participants were given 20 oz. of water in each meal session. Foods
were weighed prior to being provided to participants and the amount provided to participants
were within +/- 3g of the amount described in Appendix 1, Table 3. Mixed foods were broken
down into their individual food components and measured. Each meal provided approximately
50% of daily estimated energy need for each sex. The Estimated Calories Needed Per Day for
males and females aged 19 to 35 years are 2450 kcal/day and 1900 kcal/day, respectively.48
Thus, each meal provided approximately 1225 kcal for males and 950 kcal for females. Each
food provided approximately 25% of the energy for each meal.
MEASURES
ANTHROPOMETRICS
During the screening session, height and weight were assessed using a stadiometer and an
electronic scale, respectively. Standard procedures were used to collect the measurements.
Participants were asked to remove their shoes, jackets, and any other items in their pockets. BMI
(kg/m2) was calculated from collected height and weight for each participant to confirm
eligibility of this study.
DEMOGRAPHICS
Basic demographic information, such as gender, age, race, ethnicity, and education level,
were collected via demographic questionnaire during the screening session after consent form is
obtained.

34
CONSUMPTION
WEIGHED FOOD INTAKE
Before and after each meal session, each food item was weighed to the nearest tenth of a
gram using an electronic food scale. The weights of the containers were also measured. The total
grams of each food item were recorded, and total food consumed were calculated by subtracting
plate waste weight from the pre-meal weight. The food consumption of pasta and alfredo sauce
were weighed together to yield more accurate weight due to inability to separate each ingredient
after mixing.
DIETCAM
DietCam, developed by Dr. JinDong Tan and colleagues,49 is an application designed to
automatically recognize foods and estimate volumes of a meal from images or videos. DietCam
has an algorithm called multi-view food classification that recognizes foods and beverages in
images or videos and estimates volumes without any reference objects.49 DietCam has the
average accuracy rate of 84% in recognizing regular shape food items.49 DietCam was used to
analyze images taken by the Sony Smarteyeglass in the study to identify food items. In this
investigation, DietCam was used to identify food items with different shapes (Regular vs
Irregular) and complexities (Single food vs Mixed food). While volume estimation of foods in
the unit of cubic meters (m3) was initially proposed for this project, as the analysis process for
volume estimation was not at a stage that allowed completion of determining this variable, these
results are not reported. Thus, reported methodology and results focus on food identification
only.
After data collection, two levels of food identification (classification and subclass
identification) were completed using DietCam. First, images of both meal sessions from 10

35
participants were selected as training images for DietCam system. For the first level of training
(classification), 14 images were randomly selected from each meal, a total of 28 images from
each of the 10 selected participants. Each food in the selected image was framed and annotated
with general food categories (e.g. sandwich, cookie, wrap, grapes etc.) using MATLAB version
R2017b with coded program written by a research staff, Yan Li, from Dr. JinDong Tan’s
laboratory (see Appendix 1, Figure 2, for example). Each framed and annotated food category
was then cropped out into small image patches for data augmentation by adding additional
external images for training and generalization purpose. The version 2012 dataset from the
PASCAL Visual Object Classes (VOC)50 with over 17,000 images was used for the data
augmentation during training. For the first level of food identification, classification, the training
achieved an average of 97% accuracy. After the training, all the food images from the remaining
20 participants were input into the DietCam for automatic image analysis. Each image was
analyzed individually through DietCam with the model developed at training. After the
automatic image analysis, processed food images were labeled with names of the food categories
appearing in the image, with a rectangle frame around the identified foods, and provided in a text
file with a list of foods identified in each image (see Appendix 1, Figure 3, for example).
To determine accuracy of food identification by DietCam, after images from 20
participants were analyzed by DietCam, the images captured in the first 5 minutes of each meal
session, with the 5-minute period starting when the first food image appeared in the meal, were
selected. This first 5-minute period captured the period at the start of the meal when participants
were instructed to capture images of the food from several angles before starting to eat. The
selected images were coded by raters into one of the three codes for each food (100% of food
available and visible on the serving plate, less than 100% of food available and visible on the

36
serving plate, or food in the image but not on the plate (being consumed [held in hand or on
utensil]), or two other codes (blurry image and no food at all in the image). Images were coded
into all possible codes, meaning one image could include more than one image code (see
Appendix 1, Figure 4, for example). To capture inter-rater reliability, 33% of all coded images
were coded by two raters. All raters coded one meal until 90% agreement was achieved. Once
90% agreement was achieved, raters coded meals independently.
After all images were coded, the results of the coding were compared to the results of
DietCam food identification (first level classification). The comparison produced four outcomes:
DietCam identifying food correctly in image (True Positive: coded image result and DietCam
result both identify the food in the image), DietCam incorrectly identifying food in image (False
Positive: coded image result does not identify food in the image while DietCam identifies the
food in the image), DietCam not identifying food in image (False Negative: coded image result
identifies the food in the image while DietCam does not identify the food in the image), or
DietCam correctly identifying that the food is not in the image (True Negative: coded image
result and DietCam result both do not identify the food in the image).
For the second level of food identification (subclass identification), 4 images were
selected from each meal, a total of 8 images, from each of the 10 selected participants with each
image represented one food category (i.e. sandwich, cookie, wrap etc.). Microsoft Paint was used
to color-code each visible individual ingredient in the image with a specific set of color codes
(Blue, Red, Green codes) assigned to each ingredient (see Appendix 1, Figure 5 and 6, for
examples). A list of color codes was created for all the ingredients for both meals. While
subclass identification of foods was initially proposed for this project, as the analysis process for

37
subclass identification was not at a stage that allowed completion of this variable, these results
are not reported.
24-HOUR DIETARY RECALL
On the following day of each meal session, the investigator asked the participant to recall
their dietary intake by having the participant reporting all foods and beverages consumed and the
time in which they consumed these items within the past 24 hours. Participants were provided a
two-dimensional food shapes to help with estimating portion sizes. Only dietary intake for the
meal sessions were entered into Nutrition Data System for Research (NDS-R) dietary software
developed by the Nutrition Coordinating Center, University of Minnesota, Minneapolis,
Minnesota.
All data extracted from NDS-R were merged into one file for analysis. For mixed food
(details refer to Table 1), the portion consumed (grams) of each individual food components
were combined and recoded into its own food category (i.e. wrap, chicken and rice, sandwich,
and pasta dish).
PARTICIPANTS’ FEEDBACK
At the end of second meal session, participants were asked to complete a questionnaire
regarding their experience using Sony Smarteyeglass. A total of six structured questions were
included in the questionnaire and each question was associated with an open-ended question.
Structured questions consisted of a five-scale rating regarding ease of use, clearness of
instructions, satisfaction, likelihood, and comfortableness. Percentages of participants answering
in responses to each structured question were tabulated and open-ended questions were
summarized.

38
PARTICIPANTS’ EXPERIENCES
Three questions were included in this section regarding participants’ overall experience
with the Sony Smarteyeglass. One question asked about the ease of use of Sony Smarteyeglass.
Responses for this question were based on a five-scale rating ranging from extremely easy to
extremely hard (extremely easy, easy, neither hard or easy, hard, and extremely hard). For
participants who rated ease of use as hard or extremely hard, they completed an opened-ended
question so that they could describe why they responded with their response. The second
question asked about the clearness of instructions for using Sony Smarteyeglass. Responses for
this question were also based on a five-scale rating ranging from extremely clear to extremely
unclear (extremely clear, clear, neither unclear or clear, unclear, and extremely unclear). For
participants who rated the clearness of instructions as unclear or extremely unclear, they
completed an opened-ended question so that they could describe why they responded with their
response. The last question of this section asked about participants’ satisfaction with their
experience using Sony Smarteyeglass. Responses were on a five-scale rating ranging from
extremely satisfied to extremely unsatisfied (extremely satisfied, satisfied, neither unsatisfied or
satisfied, unsatisfied, and extremely unsatisfied). For participants who rated satisfaction as
unsatisfied or extremely unsatisfied, they completed an opened-ended question so that they could
describe why they responded with their response.
LIKELIHOOD AND COMFORTABLENESS OF WEARING SONY SMARTEYEGLASS
Three questions were included in this section of the questionnaire regarding the
likelihood and comfortableness of wearing Sony Smarteyeglass. All responses to the structured
questions were based on a five-scale rating. An open-ended question was associated with each
question asking participants to describe the reasons why they chose unlikely/uncomfortable or

39
extremely unlikely/uncomfortable. The first question asked about the likelihood of wearing Sony
Smarteyeglass during dining episodes in different situations. The second question asked about
the likelihood of participants remembering to put on Sony Smarteyeglass and start the recording
before eating. Responses for the first and second questions ranged from extremely likely to
extremely unlikely (extremely likely, likely, neither unlikely or likely, unlikely, and extremely
unlikely). The last question asked about participants’ comfortableness of using Sony
Smarteyeglass if it captures images other than their eating. Responses for this question ranged
from extremely comfortable to extremely uncomfortable (extremely comfortable, comfortable,
neither uncomfortable or comfortable, uncomfortable, and extremely uncomfortable).
VALIDATION OF QUESTIONNAIRE
The questionnaire was validated for its content via cognitive interviewing and pilot
testing. For cognitive interviewing, five students at UTK were randomly selected and asked to
read each question in the questionnaire and rephrase each question in their own words.
Responses of each question were recorded to identify any unclear questions. In this step, one out
of five responses were different from the original meaning of the questions asking about the ease
of use of Sony Smarteyeglass and comfortableness of participants using Sony Smarteyeglass if it
captures images other than eating. All other responses were similar to the meaning of the original
questions. No revision was made to the questionnaire.
For pilot testing, another five students at UTK were randomly selected and asked to
complete the questionnaire. They were also asked if there was anything on the questionnaire that
was unclear or misleading after they completed the questionnaire. Responses were documented
and reviewed. Based on the answer and the responses to the question regarding the clearness of

40
the questionnaire, there were no unclear or misleading questions in the questionnaire; as a result,
no revision was made to the questionnaire.
STATISTICAL ANALYSIS
The data were analyzed using SPSS version 22.0 for Windows (SPSS Inc., Chicago IL).
Quantitative data on participant characteristics were described with summary statistics. For
interval/ratio data, independent sample t-tests, and for nominal/ordinal data, Chi-square tests,
with the between-subject factor of meal orders, were conducted to examine the difference
between meal orders on participant characteristics. Due to a statistically significant difference
between meal orders for race and ethnicity, these two variables were used as covariates in
subsequent analyses. For all analyses on intake, Mixed foods were analyzed using their food
categories (e.g. sandwich, pasta dish, chicken and rice, and wrap). Percent agreement between
the raters was calculated. Percent agreement for food identification between the DietCam and
provided foods was analyzed using a 2x2x2x2x4 mixed analysis of covariance, with a between-
subject factor of meal orders (Meal Order 1 and 2) and within-subject factors of food shapes
(Regular and Irregular), food complexities (Single food and Mixed food), meals (Meal A and B),
and percent agreement between outcomes (True Positive, False Positive, False Negative, True
Negative), with covariates of ethnicity and race. Mauchly’s Test of Sphericity indicated that the
assumption of sphericity had been violated for percent agreement, c2 (5) = 81.3, p < 0.0001.
Greenhouse-Geisser corrections was used to adjust for sphericity. Post hoc pairwise comparisons
using Bonferroni corrections were made to determine which groups differed in percent
agreement between DietCam and provided foods. A 2x2x2x2x2 mixed analysis of covariance,
with a between-subject factor of meal orders (Meal Order 1 and 2) and within-subject factors of
food shapes (Regular and Irregular), food complexities (Single food and Mixed food), meals
41
(Meal A and B), and methods of measurement (WFI and 24-hour dietary recall), and covariates
of ethnicity and race, was conducted for the amount of food consumed. For significant outcomes,
alpha was set at 0.05. Quantitative and qualitative data from the questionnaire were summarized.
RESULTS
PARTICIPANT CHARACTERISTICS
Participant characteristics by meal order are presented in Appendix 1, Table 4.
Participants were aged 25.1 ± 6.6 years with a BMI of 22.7 ± 1.6 kg/m2. The participants were
56.7% female and 43.3% male. No statistical significant differences were found between Meal
Order 1 and 2 for age (p = 0.68) and BMI (p = 0.59). No statistical significant differences were
found between meals orders and sex (c2 (1, N = 30) = 1.2, p = 0.27), education level (c2 (3, N =
30) = 5.3, p = 0.15), and marital status (c2 (1, N = 30) = 0, p = 1.00). Over 96.6% of participants
had some college education and 86.7% of participants were never married. For race, participants
were predominately White (46.7%) and Asian (46.7%). Statistically significant differences were
found between meal orders for race [c2 (3, N = 30) = 13.7, p = 0.003] with 80.0% of participants
in Meal Order 1 identifying as Asian and 73.3% of participants in Meal Order 2 identifying as
White. Statistically significant differences were also found between meal orders for ethnicity
[c2(1, N = 30) = 6.0 p = 0.01] with 100% of participants identifying as non-Hispanic or Latino in
Meal Order 1 and 66.7% identifying as non-Hispanic or Latino in Meal Order 2.
FOOD IDENTIFICATION
PROVIDED FOOD: IMAGES CODED BY RATER
Thirteen meals were double-coded to determine percent agreement between raters. The
overall mean percent agreement between raters was 84.5 ± 3.7% (n=13), and the percent

42
agreement for individual meal was 85.3 ± 3.4% for Meal A (n=6) and 83.9 ± 4.0% for Meal B
(n=7).
Summary of coded images by meals is presented in Appendix 1, Table 5. A total of
36,412 images were coded (18,344 in Meal A and 18,068 in Meal B). A total of 33,376 (91.6%
of total images) images were coded with foods, with 16,599 (49.7% of images coded with foods)
in Meal A and 16,735 (50.1% of images coded with foods) in Meal B. In Meal A, 49.9% of
images were coded as cookies, 53.6% were coded as chips, 32.2% were coded as chicken and
rice, and 30.6% were coded as sandwich. Of those coded images in Meal A, the largest
percentage of images for cookies and chips were coded as 100% of food available and visible on
the serving plate (cookie = 26.4%, chips = 26.9%), while the largest percentage of images for
chicken and rice and sandwich were coded as less than 100% of food available and visible on the
serving plate (chicken and rice = 22.4%, sandwich = 20.1%). In Meal B, 52.9% images were
coded as ice-cream, 58.2% were coded as grapes, 30.6% were coded as pasta dish, and 25.1%
were coded as wrap. Of those coded images in Meal B, 36.6% of images with ice-cream, the
largest percentage of images, was coded as 100% of food available and visible on the serving
plate. For grapes, 32.5%, the largest percentage of images, was coded as less than 100% of food
available and visible on the serving plate. For the pasta dish, 22.0%, the largest percentage of
images, was coded as less than 100% of food available and visible on the serving plate. For the
wrap, 11.4%, the largest percentage of images, was coded as 100% of food available and visible
on the serving plate. When the images for Meal A and Meal B are combined, 2,778 images
(7.6% of total images) were coded as having no food at all in the image and 2,101 images (5.8%
of total images) were coded as blurry images.

43
DIETCAM
Results of DietCam in food identification (classification) are presented in Appendix 1,
Table 6. DietCam identified foods in 27,781 images (76.3%), with 14,077 in Meal A and 13,704
in Meal B. In Meal A, 38.5% of images were identified with cookies by DietCam, 21.4% were
identified with chips, 18.8% were identified with chicken and rice, and 17.7% were identified
with sandwich. In Meal B, 12.2% of images were identified with ice-cream, 43.3% were
identified with grapes, 18.7% were identified with pasta dish, and 16.2% were identified with
wrap.
PERCENT AGREEMENT FOOD IDENTIFICATION: DIETCAM VS. PROVIDED
FOOD
Results of food identification (classification) for each food for DietCam vs. coded image
are shown in Appendix 1, Table 7. The overall mean of True Positive was 22.2 ± 3.6 %, False
Positive was 1.2 ± 0.4%, False Negative was 19.6 ± 5.0%, and True Negative was 56.8 ± 7.2%.
After adjusting for race and ethnicity, a statistically significant main effect of percent agreement
was found [(F (3,48) = 8.5, p < 0.0001]. The pairwise comparisons for the main effect of percent
agreement indicated statistically significant differences between True Positive and False Positive
(p < 0.0001), True Positive and True Negative (p < 0.0001), False Positive and False Negative (p
< 0.0001), False Positive and True Negative (p < 0.0001), and False Negative and True Negative
(p < 0.0001). Furthermore, there was no statistically significant difference found between True
Positive and False Negative (p = 0.22). No other statistically significant main effects or
interactions were found for shapes, complexities, and meals.
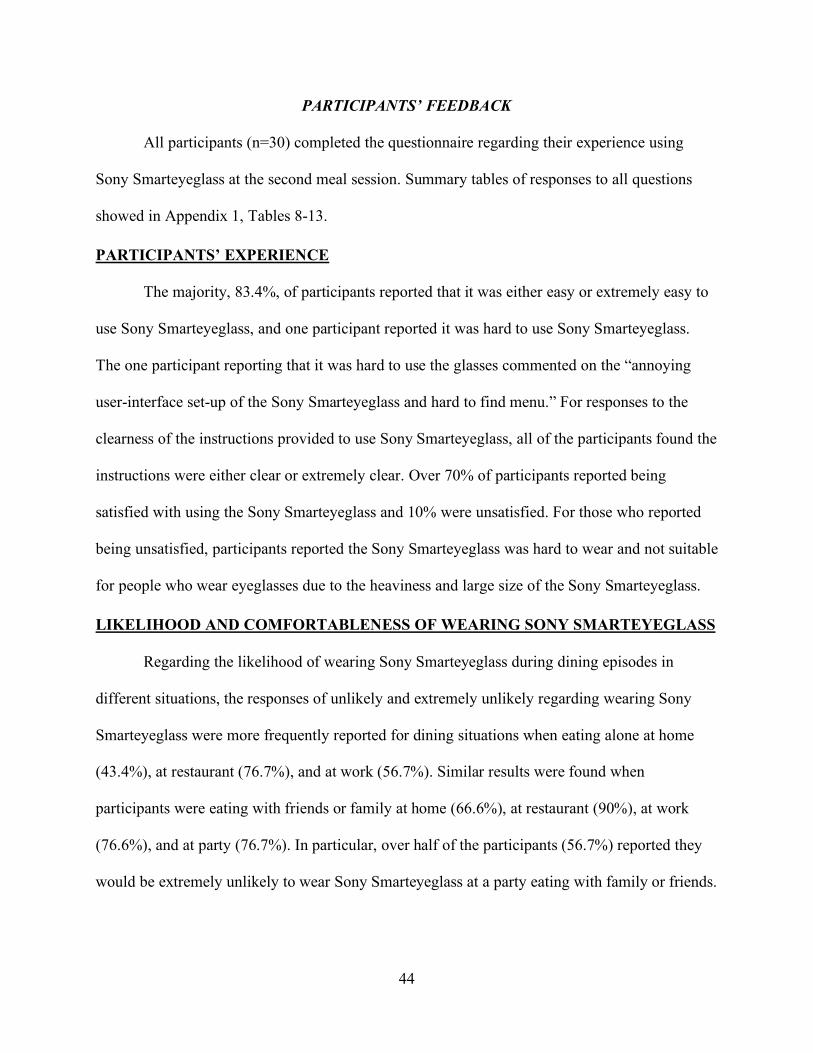
44
PARTICIPANTS’ FEEDBACK
All participants (n=30) completed the questionnaire regarding their experience using
Sony Smarteyeglass at the second meal session. Summary tables of responses to all questions
showed in Appendix 1, Tables 8-13.
PARTICIPANTS’ EXPERIENCE
The majority, 83.4%, of participants reported that it was either easy or extremely easy to
use Sony Smarteyeglass, and one participant reported it was hard to use Sony Smarteyeglass.
The one participant reporting that it was hard to use the glasses commented on the “annoying
user-interface set-up of the Sony Smarteyeglass and hard to find menu.” For responses to the
clearness of the instructions provided to use Sony Smarteyeglass, all of the participants found the
instructions were either clear or extremely clear. Over 70% of participants reported being
satisfied with using the Sony Smarteyeglass and 10% were unsatisfied. For those who reported
being unsatisfied, participants reported the Sony Smarteyeglass was hard to wear and not suitable
for people who wear eyeglasses due to the heaviness and large size of the Sony Smarteyeglass.
LIKELIHOOD AND COMFORTABLENESS OF WEARING SONY SMARTEYEGLASS
Regarding the likelihood of wearing Sony Smarteyeglass during dining episodes in
different situations, the responses of unlikely and extremely unlikely regarding wearing Sony
Smarteyeglass were more frequently reported for dining situations when eating alone at home
(43.4%), at restaurant (76.7%), and at work (56.7%). Similar results were found when
participants were eating with friends or family at home (66.6%), at restaurant (90%), at work
(76.6%), and at party (76.7%). In particular, over half of the participants (56.7%) reported they
would be extremely unlikely to wear Sony Smarteyeglass at a party eating with family or friends.

45
Participants generally had concerns regarding privacy and the appearance and weight of the Sony
Smarteyeglass.
Regarding the likelihood of participants remembering to put on Sony Smarteyeglass and
start the recording before eating, over half of participants reported either being likely or
extremely likely to remember to complete these steps. However, participants (16.7%) who
responded either unlikely or extremely unlikely to remember reported that it would be difficult to
develop the habit to wear Sony Smarteyeglass and start recording before each eating episode. For
the comfortableness of Sony Smarteyeglass capturing images other than eating, most responses
were reported with 40% of participants reported either comfortable or extremely comfortable and
36.7% reported either uncomfortable or extremely uncomfortable. For those who reported being
uncomfortable or extremely uncomfortable, participants again expressed concerns regarding
invasion of privacy and potentially affecting others around them.
FOOD VOLUME
WFI VS 24-HOUR DIETARY RECALL
Results of each food category is shown in Appendix 1, Figures 2 to 5. Overall, no
statistical significant main effect was found for food shapes [(F (1,25) = 0.2, p = 0.70], food
complexities [(F (1,25) = 3.6, p = 0.70], meal orders [(F (1,25) = 0.7, p = 0.41], or methods of
assessing intake [(F (1,25) = 2.4, p = 0.14], after adjusting for race and ethnicity. The overall
mean WFI (n=30) for single food was 354.4 ± 126.2g, mixed food was 682.9 ± 191.7g, regular-
shaped food was 599.8 ± 208.5g, and irregular-shaped food was 437.5 ± 118.4g. For 24-hour
dietary recall (n=29), the mean intake for single food was 302.6 ± 132.6g, mixed food was 739.3
± 264.9g, regular-shaped food was 556.0 ± 209.6g, and irregular-shaped food was 632.7 ±
265.7g.

46
DISCUSSION
The purpose of the study was to validate a passive image-assisted dietary assessment
method using images taken by Sony Smarteyeglass and an automatic image analysis software,
DietCam, to identify food items and volume consumed. This study was designed to determine
the accuracy of DietCam in identifying foods of differing shapes (Regular vs Irregular) and
complexities (Single vs Mixed food). Additionally, this study was to determine the accuracy of
DietCam in determining food volume consumed as compared to WFI measured from plate waste
method.
The results of the analyses for food identification, classification, indicate that DietCam
has the best accuracy in determining when a food is not present. DietCam also has a low mis-
identification (identifying a specific food when it is not in the image) rate, 1.2 ± 0.4%. However,
no significant difference was found between True Positive and False Negative, indicating that
there was no difference in DietCam’s ability in correctly identifying the provided foods when the
foods are present in images and not identifying the provided foods when the foods are present in
images. This would mean that within any given image with a food, the food would miss being
identified just as frequently as being correctly identified. The findings also suggest that there was
no difference in DietCam’s ability in identifying Regular- and Irregular-shaped foods, and Single
and Mixed foods.
Only one other recent study has examined how well an automated system identifies food
in images, but this system only identified if any food is in the image or if the image does not
contain any food. Thus, it appears that this system does not have the capacity to identify a
specific food in the image. In this study conducted by Jia and colleagues,51 participants used a
wearable device, eButton, to collect the images. Only the results of two meals sessions were

47
reported in the study. The investigators found that in the first meal session, the system identified
food as being in the image in 92.6% of the images that did contain food.51 It incorrectly
identified that an image did not contain food in 7.4% of images that did contain food.51 It
incorrectly identified an image as containing a food in 9.6% of images that actually did not
contain a food.51 It correctly identified images as not containing food in 90.4% of images that did
not contain a food.51 In the second meal session, the system correctly identified food in the image
in 79.4% of images that did contain food.51 It incorrectly identified that an image did not contain
a food in 20.6% of images that did contain a food.51 It incorrectly identified that food was
present in 7.0% of images that did not contain a food, and correctly identified that an image did
not contain a food in 93% of images without food.51 When the data in the present study are
examined as identification being food present in an image or not (rather than a specific food
identified in an image or not), DietCam correctly identified food in an image in 82.1% of images
with food present in images. It incorrectly identified that an image did not contain food in 17.9%
of images that contained food. It incorrectly identified that food was present in 12.8% of images
that did not contain a food, and correctly identified that an image did not contain food in 87.2%
of the images without food. The findings in the present study show that DietCam is similar in
accuracy to the previous study for identifying food in images that contain foods but may be less
accurate when identifying that food is not in an image when food is truly not in images. This
difference in results may be a consequence of sampling (the previous investigation was
providing information per meal for only two meals, while this study is presenting summary
statistics on 40 meals), or potentially due to DietCam trying to identify specific foods in images
(rather than just if food is present), which may create more error in saying a food is present in an
image when no food is present.

48
The findings of food identification, classification, in the present study are novel as no
current passive image-assisted dietary assessment methods possesses the ability to automatically
identify specific food items. Previous studies37-39,41 validating different passive image-assisted
dietary assessment methods either rely on participants to identify food items consumed or rely on
raters to recognize food items from images taken by the passive methods. With the manual food
identification process, these passive methods validated in previous studies did not eliminate the
possibility of human errors and bias. However, the present study completely eliminated human
effort in the process of identifying food items from images taken by Sony Smarteyeglass. A
previous study validating an active image-assisted dietary assessment method, mobile Food
Record (mFR), has the automatic image analysis to classify food items and estimate portion
sizes.36 However, there was no information reported on the accuracy of mFR in identifying food
items from the images taken by participants.36 Although mFR has the function of automatic food
identification, it requires a specific colored fiducial marker to facilitate the identification of foods
and beverages in captured images.52 DietCam used in the present study does not require any
reference objects to facilitate the food identification process.
Feedback from participants suggest that the Sony Smarteyeglass was easy to use and
clear instructions were provided. This finding is inconsistent with a previous study37 validating
Image-Diet Day system, a passive image-assisted dietary assessment method that included a
wearable mobile phone. Arab and colleagues37 found that 71% of participants had difficulty
using the wearable mobile phone. Participants in the present study did have negative feedback on
the likelihood and comfortableness of wearing the Sony Smarteyeglass at different dining
situations. This feedback, combined with participants’ concerns regarding privacy and the
appearance and weight of the Sony Smarteyeglass, suggest that it would be unlikely for

49
participants to wear the Sony Smarteyeglass at meal times. These findings are consistent with the
findings of the wearable mobile phone used in Image-Diet Day system. In the study conducted
by Arab and colleagues,37 participants reported the wearable mobile phone was heavy to wear
and too large in size.
The finding in the present study that there was no significant difference in the volume
consumed between the 24-hour dietary recalls and WFI is inconsistent with the literature that has
found underreporting of dietary intake using self-reported dietary assessment.10-13,53 The previous
studies10-13,53 were conducted in free-living situation, while the present study was in a controlled
laboratory setting and required participants to really examine their food both at the start and the
end of the meal due to the instructions provided to capture the images with the Sony
Smarteyeglass. Thus, the extended time of looking at each provided foods may potentially
increase the participant’s awareness of the portion consumed. Studies have found that increased
training on portion sizes improves the accuracy of portion size estimation as people were more
familiar with the portions.54-56
The study has a number of limitations and strengths. The first limitation is that the
subclass identification and food volume estimation were not completed as proposed since they
were not at a stage that allowed completion of these variables. Future research is needed for
these steps of image analyses. Second, this study only included the results from text files to
perform analysis of the food identification (classification) of DietCam. The text files used for
analysis in the present study did not specify whether if the rectangle frame was correctly placed
on the identified foods or not. For example, the text file may indicate that cookies were in the
image, but the actual image may have a rectangle frame around the chips and label the frame
cookies (so frame around the wrong food) and miss having a rectangle frame around the cookies

50
in the image. Thus, the food identification generated by DietCam in the text files used for
analysis may have additional errors than what is reported. Third, the present study had a limited
number of images for training from each participant (28), which could have resulted in
incomplete training for the DietCam. The images captured a wide variety of different angles of
the foods, and the small number of training images might not have captured all the angles
required to completely train the DietCam system to identify each food item. Lastly, there were
limited numbers of foods included in the present study. Thus, it is not clear how well DietCam
would accurately identify items consumed in eating occasions with greater variety of foods or
across several eating occasions in a day.
For strengths, the present study examined DietCam’s ability to identify food items
differing in shape and complexity, which has not been done in previous studies investigating
passive image-assisted dietary assessment.37-39,41 Second, the present study was the first to
validate a passive image-assisted dietary assessment with a complete automatic food
identification process by food items. Third, the present study included a larger and more diverse
sample as compared to previous studies investigating passive image-assisted dietary
assessment.37,39,41
To better enhance understanding of the accuracy of food identification by DietCam,
future research should further investigate what types of images (100% of food available and
visible on the serving plate, less than 100% of food available and visible on the serving plate, or
food in the image but not on the plate (being consumed [held in hand or on utensil]) would
impact the accuracy of food identification. By understanding what types of images lower the
accuracy of identification, potentially those types of images could be eliminated from the
analyses of identification. Second, future studies should further examine the number of images

51
that are needed for food identification in dietary assessment. For example, the passive image-
assisted dietary assessment collects many more images as compared to the active image-assisted
dietary assessment (thousands of images vs. two images). Thus, in the passive image-assisted
dietary assessment, for food identification, potentially images need to be analyzed until no new
additional foods are identified. For this type of process, analyses of images do not need to be
100% accurate (i.e., a food would not need to be correctly identified in every image), as if a food
was identified in at least one image, it would be considered to be an item consumed. Most
importantly for accuracy in dietary assessment, the analyses from the images should not identify
a food in an image that actually was not there, and thus not consumed. Moreover, since the
participants reported that they were not willing to wear the Sony Smarteyeglass under different
dining episodes, future studies should investigate the feasibility of other wearable devices that
are smaller in size to decrease the noticeable appearance and/or increase the comfortableness of
the devices. Lastly, to address privacy concerns, future studies should incorporate automatic
processes to remove images with human faces before analysis, which has been previously done
by Sun and colleagues40 in one of the passive image-assisted dietary assessment methods.
Overall, while DietCam shows promise with its automatic food identification system,
when the analyses are about identifying specific foods consumed, it is most accurate in
identifying images that do not contain food. However, when identification is only about if an
image contains a food, rather than a specific food, DietCam shows a high degree of accuracy of
identifying that food is in an image. Furthermore, from a consumer perspective, the platform
from which the images are collected needs to be modified to enhance consumer acceptance.
Future research is needed to enhance DietCam’s ability to identify components of foods
consumed, rather than just broad categories of food, and its ability to estimate volume of food

52
consumed; to incorporate a smaller and unnoticeable wearable device for the platform from
which to collect images; and to examine the feasibility of this system in free-living situation.

53
REFERENCES

54
1. Johnson R.K. YBA, Hankin J.H. Dietary assessment and validation. In: Research Successful Approaches. 3rd ed.: American Dietetic Association; 2008.
2. Kirkpatrick SI, Collins CE. Assessment of nutrient intakes: introduction to the special issue. Nutrients. 2016;8(4):184.
3. Thompson FE, Subar AF, Loria CM, Reedy JL, Baranowski T. Need for technological innovation in dietary assessment. Journal of the American Dietetic Association. 2010;110(1):48-51.
4. Ma Y, Olendzki BC, Pagoto SL, et al. Number of 24-hour diet recalls needed to estimate energy intake. Annals of Epidemiology. 2009;19(8):553-559.
5. Thompson FE, Subar AF. Dietary assessment methodology. In. Nutrition in the Prevention and Treatment of Disease. 3rd ed. Bethesda, Maryland: National Cancer Institute; 2013:5-46.
6. Thompson FE, Kirkpatrick SI, Subar AF, et al. The National Cancer Institute's dietary assessment primer: a resource for diet research. Journal of the Academy of Nutrition and Dietetics. 2015;115(12):1986-1995.
7. National Institutes of Health, National Cancer Institiute. Dietary assessment primer, 24-hour dietary recall (24HR) at a glance. https://dietassessmentprimer.cancer.gov/profiles/recall/. Accessed Feb, 2017.
8. United States Department of Agriculture. AMPM - USDA Automated Multiple-Pass Method. 2016; https://www.ars.usda.gov/northeast-area/beltsville-md/beltsville-human-nutrition-research-center/food-surveys-research-group/docs/ampm-usda-automated-multiple-pass-method/. Accessed Dec, 2016.
9. Lam YY, Ravussin E. Analysis of energy metabolism in humans: a review of methodologies. Molecular Metabolism. 2016;5(11):1057-1071.
10. Moshfegh AJ, Rhodes DG, Baer DJ, et al. The US Department of Agriculture Automated Multiple-Pass Method reduces bias in the collection of energy intakes. The American Journal of Clinical Nutrition. 2008;88(2):324-332.
11. Pikholz C, Swinburn B, Metcalf P. Under-reporting of energy intake in the 1997 National Nutrition Survey. The New Zealand Medical Journal. 2004;117(1202):U1079.
12. Scagliusi FB, Ferriolli E, Pfrimer K, et al. Underreporting of energy intake in Brazilian women varies according to dietary assessment: a cross-sectional study using doubly labeled water. Journal of the American Dietetic Association. 2008;108(12):2031-2040.
13. Subar AF, Kipnis V, Troiano RP, et al. Using intake biomarkers to evaluate the extent of dietary misreporting in a large sample of adults: the OPEN study. American Journal of Epidemiology. 2003;158(1):1-13.
14. National Institutes of Health, National Cancer Institiute. Dietary assessment primer, food record at a glance. https://dietassessmentprimer.cancer.gov/profiles/record/index.html. Accessed Feb, 2017.
15. Bandini LG, Schoeller DA, Cyr HN, Dietz WH. Validity of reported energy intake in obese and nonobese adolescents. The American Journal of Clinical Nutrition. 1990;52(3):421-425.
16. Rebro SM, Patterson RE, Kristal AR, Cheney CL. The effect of keeping food records on eating patterns. Journal of the American Dietetic Association. 1998;98(10):1163-1165.
17. Wrieden W, Peace H, Armstrong J, Barton K. A short review of dietary assessment methods used in National and Scottish Research Studies. Briefing Paper Prepared for: Working Group on Monitoring Scottish Dietary Targets Workshop. 2003.

55
https://www.food.gov.uk/sites/default/files/multimedia/pdfs/scotdietassessmethods.pdf. Accessed Jan 2017.
18. Willett WC, Sampson L, Browne ML, et al. The use of a self-administered questionnaire to assess diet four years in the past. American Journal of Epidemiology. 1988;127(1):188-199.
19. Willett WC, Sampson L, Stampfer MJ, et al. Reproducibility and validity of a semiquantitative food frequency questionnaire. American Journal of Epidemiology. 1985;122(1):51-65.
20. Block G, Hartman AM, Dresser CM, Carroll MD, Gannon J, Gardner L. A data-based approach to diet questionnaire design and testing. American Journal of Epidemiology. 1986;124(3):453-469.
21. Kipnis V, Subar AF, Midthune D, et al. Structure of dietary measurement error: results of the OPEN biomarker study. American Journal of Epidemiology. 2003;158(1):14-21; discussion 22-16.
22. Subar AF, Thompson FE, Kipnis V, et al. Comparative validation of the Block, Willett, and National Cancer Institute food frequency questionnaires : the Eating at America's Table Study. American Journal of Epidemiology. 2001;154(12):1089-1099.
23. Thompson FE, Subar AF, Brown CC, et al. Cognitive research enhances accuracy of food frequency questionnaire reports: results of an experimental validation study. Journal of the American Dietetic Association. 2002;102(2):212-225.
24. National Institutes of Health, National Cancer Institiute. Dietary assessment primer, food frequency questionnaire at a glance. https://dietassessmentprimer.cancer.gov/profiles/questionnaire/index.html. Accessed Feb, 2017.
25. Subar AF, Freedman LS, Tooze JA, et al. Addressing current criticism regarding the value of self-report dietary data. The Journal of Nutrition. 2015;145(12):2639-2645.
26. Ngo J, Engelen A, Molag M, Roesle J, Garcia-Segovia P, Serra-Majem L. A review of the use of information and communication technologies for dietary assessment. The British Journal of Nutrition. 2009;101 Suppl 2:S102-112.
27. Long JD, Littlefield LA, Estep G, et al. Evidence Review of Technology and Dietary Assessment. Worldviews on Evidence-Based Nursing. 2010;7(4):191-204.
28. Subar AF, Kirkpatrick SI, Mittl B, et al. The Automated Self-Administered 24-hour dietary recall (ASA24): a resource for researchers, clinicians, and educators from the National Cancer Institute. Journal of the Academy of Nutrition and Dietetics. 2012;112(8):1134-1137.
29. Raatz SK, Scheett AJ, Johnson LK, Jahns L. Validity of electronic diet recording nutrient estimates compared to dietitian analysis of diet records: randomized controlled trial. Journal of Medical Internet Research. 2015;17(1):e21.
30. Beasley J, Riley WT, Jean-Mary J. Accuracy of a PDA-based dietary assessment program. Nutrition (Burbank, Los Angeles County, Calif). 2005;21(6):672-677.
31. Illner AK, Freisling H, Boeing H, Huybrechts I, Crispim SP, Slimani N. Review and evaluation of innovative technologies for measuring diet in nutritional epidemiology. International Journal of Epidemiology. 2012;41(4):1187-1203.
32. Burrows TL, Martin RJ, Collins CE. A systematic review of the validity of dietary assessment methods in children when compared with the method of doubly labeled water. Journal of the American Dietetic Association. 2010;110(10):1501-1510.

56
33. Gemming L, Utter J, Ni Mhurchu C. Image-assisted dietary assessment: a systematic review of the evidence. Journal of the Academy of Nutrition and Dietetics. 2015;115(1):64-77.
34. Rollo ME, Ash S, Lyons-Wall P, Russell AW. Evaluation of a mobile phone image-based dietary assessment method in adults with Type 2 Diabetes. Nutrients. 2015;7(6):4897-4910.
35. Martin CK, Correa JB, Han H, et al. Validity of the Remote Food Photography Method (RFPM) for estimating energy and nutrient intake in near real-time. Obesity (Silver Spring, Md). 2012;20(4):891-899.
36. Boushey CJ, Spoden M, Delp EJ, et al. Reported Energy Intake Accuracy Compared to Doubly Labeled Water and Usability of the Mobile Food Record among Community Dwelling Adults. Nutrients. 2017;9(3).
37. Arab L, Estrin D, Kim DH, Burke J, Goldman J. Feasibility testing of an automated image-capture method to aid dietary recall. European Journal of Clinical Nutrition. 2011;65(10):1156-1162.
38. Gemming L, Rush E, Maddison R, et al. Wearable cameras can reduce dietary under-reporting: doubly labelled water validation of a camera-assisted 24 h recall. The British Journal of Nutrition. 2015;113(2):284-291.
39. Pettitt C, Liu J, Kwasnicki RM, Yang GZ, Preston T, Frost G. A pilot study to determine whether using a lightweight, wearable micro-camera improves dietary assessment accuracy and offers information on macronutrients and eating rate. The British Journal of Nutrition. 2016;115(1):160-167.
40. Sun M, Burke LE, Baranowski T, et al. An exploratory study on a chest-worn computer for evaluation of diet, physical activity and lifestyle. Journal of Healthcare Engineering. 2015;6(1):1-22.
41. Jia W, Chen HC, Yue Y, et al. Accuracy of food portion size estimation from digital pictures acquired by a chest-worn camera. Public Health Nutrition. 2014;17(8):1671-1681.
42. Black AE, Prentice AM, Goldberg GR, et al. Measurements of total energy expenditure provide insights into the validity of dietary measurements of energy intake. Journal of the American Dietetic Association. 1993;93(5):572-579.
43. Buhl KM, Gallagher D, Hoy K, Matthews DE, Heymsfield SB. Unexplained disturbance in body weight regulation: diagnostic outcome assessed by doubly labeled water and body composition analyses in obese patients reporting low energy intakes. Journal of the American Dietetic Association. 1995;95(12):1393-1400; quiz 1401-1392.
44. Prentice AM, Black AE, Coward WA, et al. High levels of energy expenditure in obese women. British Medical Journal (Clinical Research Ed). 1986;292(6526):983-987.
45. Naska A, Lagiou A, Lagiou P. Dietary assessment methods in epidemiological research: current state of the art and future prospects. F1000Research. 2017;6:926.
46. SONY Coporation. SmartEyeglass Developer Edition Reference Guide. 2015; https://dl.developer.sony.com/uploads/2017/10/SmartEyeglass_Reference_guide_US_4541087112.pdf?Expires=1519504342&Policy=eyJTdGF0ZW1lbnQiOlt7IlJlc291cmNlIjoiaHR0cHM6Ly9kbC5kZXZlbG9wZXIuc29ueS5jb20vdXBsb2Fkcy8yMDE3LzEwL1NtYXJ0RXllZ2xhc3NfUmVmZXJlbmNlX2d1aWRlX1VTXzQ1NDEwODcxMTIucGRmIiwiQ29uZGl0aW9uIjp7IkRhdGVMZXNzVGhhbiI6eyJBV1M6RXBvY2hUaW1lIjoxNTE5NTA0MzQyfX19XX0_&Signature=PkuU2UXxPclq7LjjNDDEDUZYtRAw9Y1URmqz

57
Hi7-Yc8PXYkUW-F2RIOlBWpAPDlRSXkzcYUlgtn2uQV0G0v9fW5V-N1Qp1Tpai2IlJJU7exb6aubusho-nhZMs725uR~mv1F85hYKtqVhYhbXoWWxa95M8lXD~KMY0xebILncFkp3V~n3TY3tiYAhZC1fUdOW3xjxWoH2AjpS8yHXVn1KrSovNLL86mMwx7142L~2GIW591UPzNmg3oj30D8Y-ig-8OqMIX4M1QL-fkrLjfR8xFZMwbhhjT1TfMDLeRCdC6AQX3OuJgGJytbhwdO9FvDWTzN1y00RyraJP4PUgkkDg__&Key-Pair-Id=APKAJLG7HFNQA6DQJUYA. Accessed Feb 24, 2018.
47. Sony Coporation. Smarteyeglass: API Overview. 2017; https://developer.sony.com/develop/wearables/smarteyeglass-sdk/api-overview/. Accessed Feb, 2017.
48. U.S. Department of Health and Human Services; U.S. Department of Agriculture. 2015-2020 Dietary guidelines for Americans. Appendix 2. Estimated Calorie Needs per Day, by Age, Sex, and Physical Activity Level 2015; 8th Edition:http://health.gov.dietaryguidelines/2015/guidelines/. Accessed April 18, 2017.
49. He H, Kong F, Tan J. DietCam: multiview food recognition using a multikernel SVM. IEEE Journal of Biomedical and Health Informatics. 2016;20(3):848-855.
50. Mark Everingham LvG, Chris Williams, John Winn, Andrew Zisserman. The {PASCAL} {V}isual {O}bject {C}lasses {C}hallenge 2012 {(VOC2012)} {R}esults. In. Vol 20182012.
51. Jia W, Li Y, Qu R, et al. Automatic food detection in egocentric images using artificial intelligence technology. Public Health Nutrition. 2018:1-12.
52. Boushey CJ, Spoden M, Zhu FM, Delp EJ, Kerr DA. New mobile methods for dietary assessment: review of image-assisted and image-based dietary assessment methods. The Proceedings of the Nutrition Society. 2017;76(3):283-294.
53. Johansson G, Wikman A, Ahren AM, Hallmans G, Johansson I. Underreporting of energy intake in repeated 24-hour recalls related to gender, age, weight status, day of interview, educational level, reported food intake, smoking habits and area of living. Public Health Nutrition. 2001;4(4):919-927.
54. Small L, Lane H, Vaughan L, Melnyk B, McBurnett D. A systematic review of the evidence: the effects of portion size manipulation with children and portion education/training interventions on dietary intake with adults. Worldviews on Evidence-Based Nursing. 2013;10(2):69-81.
55. Weber JL, Tinsley AM, Houtkooper LB, Lohman TG. Multimethod training increases portion-size estimation accuracy. Journal of the American Dietetic Association. 1997;97(2):176-179.
56. Yuhas JA, Bolland JE, Bolland TW. The impact of training, food type, gender, and container size on the estimation of food portion sizes. Journal of the American Dietetic Association. 1989;89(10):1473-1477.

58
APPENDICES

59
APPENDIX 1 – TABLES & FIGURES

60
Table 1. Description of study design.
Meal Order Meal Session 1 Meal Session 2
1 (n=15)
Meal A: Turkey & Provolone Cheese Sandwich (Regular-shaped mixed food) Chicken and Wild Rice (Irregular-shaped mixed food) Chocolate Chip Cookie (Regular-shaped single food) Potato Chips Original (Irregular-shaped single food)
Meal B: Ham and Cheddar Cheese Wrap (Regular-shaped mixed food) Pasta with Broccoli in Alfredo Sauce (Irregular-shaped mixed food) Red Seedless Grapes (Regular-shaped single food) Chocolate Ice-cream (Irregular-shaped single food)
2 (n=15)
Meal B: Ham and Cheddar Cheese Wrap (Regular-shaped mixed food) Pasta with Broccoli in Alfredo Sauce (Irregular-shaped mixed food) Red Seedless Grapes (Regular-shaped single food) Chocolate Ice-cream (Irregular-shaped single food)
Meal A: Turkey & Provolone Cheese Sandwich (Regular-shaped mixed food) Chicken and Wild Rice (Irregular-shaped mixed food) Chocolate Chip Cookie (Regular-shaped single food) Potato Chips Original (Irregular-shaped single food)

61
Table 2. Detailed description of provided foods.
Food Brand Serving Calories per Serving
Calories per Gram
Cookie Nabisco Chips Ahoy! Original 33g 160 4.85 Grapes Red Seedless Grapes 161g 104 0.65 Potato chips Food Clubâ Classic Potato Chips 28g 160 5.71
Ice-cream Blue Bellâ Dutch Chocolate 72g 160 2.22
Chicken Tysonâ Fully Cooked Chicken Breast Fillets 98g 110 1.12
Wild Rice Minuteâ Ready-to-serve Brown & Wild Rice 125g 230 1.84
Sandwich Bread
Nature’s Ownâ 100% whole wheat bread 26g 60 2.30
Turkey Deli Oscar Mayer Delifresh Smoked Turkey Breast 56g 50 0.89
Provolone Cheese
Food Clubâ Not Smoked Provolone Cheese 23g 80 3.48
Tomato Fresh Tomato Medium 50g 8 0.16 Lettuce Fresh Lettuce 75g 6 0.08
Tortilla OLE Mexican Foods High Fiber Low Carbs Tortilla 45g 50 1.11
Ham Deli Oscar Mayer Delifresh Smoked Ham 56g 50 0.89
Cheddar Cheese
Food Clubâ Mild Cheddar Cheese (Thin Sliced) 32g 130 4.06
Spring Mix Fresh Spring Mix 142g 35 0.25
Dressing Food Clubâ Fat Free Ranch Dressing 29g 25 0.85
Pasta Barillaâ Ready Pasta Fully Cooked Penne 121g 210 1.74
Broccoli Food Clubâ Broccoli Spears 89g 30 0.34
Alfredo Sauce Raguâ Classic Alfredo 61g 90 1.48

62
Table 3. Detailed description of meal sessions.
Meals Food
Female Male Amount Served
Calories Served
Amount Served
Calories Served
A
Turkey & Provolone Cheese Sandwich
Whole Wheat Bread 52g 120 52g 120
Turkey 70g 62 133g 118 Provolone Cheese 23g 80 23g 80 Tomato 50g 8 50g 8 Lettuce 45g 4 45g 4 Total: 240g 274 303g 330
Chicken and Wild Rice
Chicken 98g 110 98g 110 Wild Rice 71g 131 107g 197 Total: 169g 241 205g 307
Chocolate Chips Cookies 44g 213 60.5g 293 Potato chips Original 39g 223 52g 297
Total Meal A Calories 951 1227
B
Ham and Cheddar Cheese Wrap
Tortilla 45g 50 45g 50 Ham Deli 76g 68 103 92 Cheddar Cheese 21g 85 32g 130 Spring Mix 36g 9 36 9 FF Ranch Dressing 29g 25 29g 25 Total: 207g 237 247g 306
Pasta with Broccoli and Alfredo Sauce
Pasta 91g 158 121g 210 Broccoli 66g 22 66g 22 Alfredo Sauce 38g 56 50g 74 Total: 195g 214 171g 284
Chocolate Ice-cream 107g 238 138g 306 Red Seedless Grapes 365g 237 471g 306
Total Meal B Calories 948 1224

63
Table 4. Participant characteristics.
Meal Order 1 (n=15)b Meal Order 2 (n=15)b
Age (years)a 25.3 ± 6.2 24.8 ± 7.1
Sex (%) 53.3 (Male) 46.7 (Female)
33.3 (Male) 66.7 (Female)
BMI (kg/m2)a 22.6 ± 1.6 22.8 ± 1.7
Marital Status (%) Married 13.3 13.3 Never Married 86.7 86.7
Education Status (%) High school (10-12 years) 6.7 0 Some College (< 4 years) 6.7 33.3 College/University Degree 40.0 46.7 Graduate/Professional
Education 46.7 20.0
Race (%)* American Indian/Alaskan
Native 0 6.7
Asian 80.0 13.3 White 20.0 73.3 Other 0 6.7
Ethnic Heritage (%)* Hispanic/Latino 0 33.3 Not Hispanic/Latino 100 66.7
a Mean ± SD
b See Table 1 for description of Meal Orders.
* Significant were found between Meal Orders
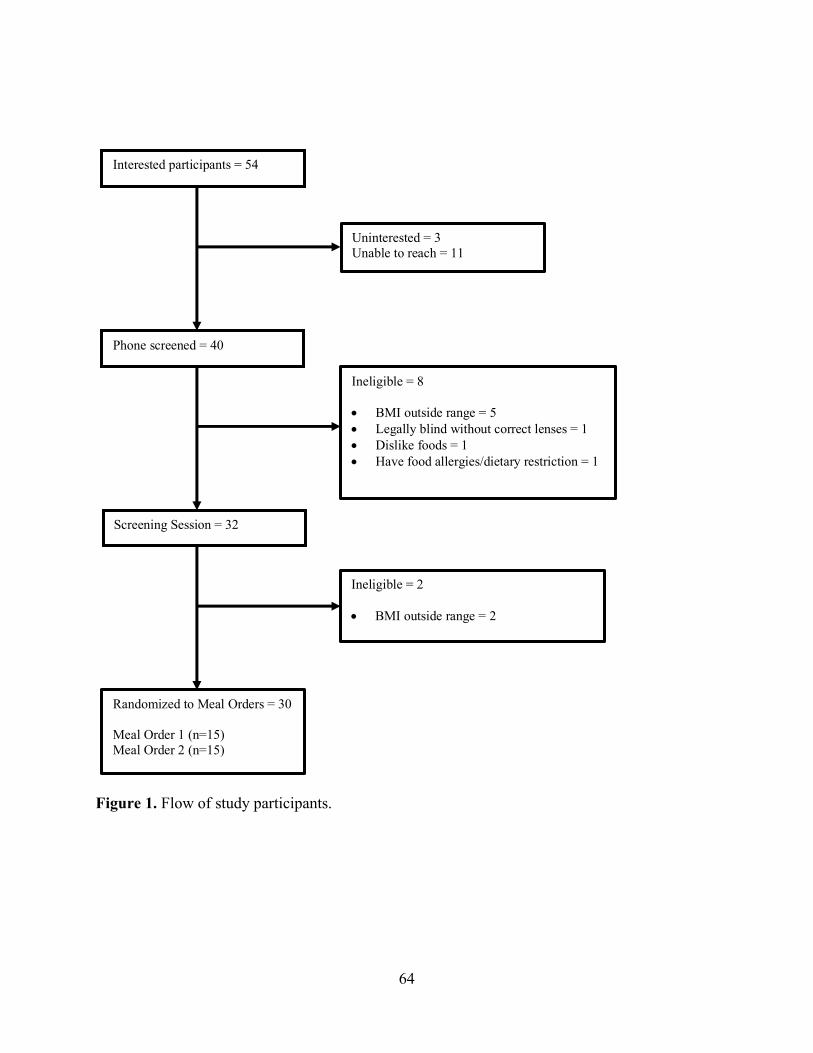
64
Figure 1. Flow of study participants.
Interested participants = 54
Uninterested = 3 Unable to reach = 11
Phone screened = 40
Ineligible = 8
• BMI outside range = 5 • Legally blind without correct lenses = 1 • Dislike foods = 1 • Have food allergies/dietary restriction = 1
Screening Session = 32
Ineligible = 2
• BMI outside range = 2
Randomized to Meal Orders = 30 Meal Order 1 (n=15) Meal Order 2 (n=15)

65
Figure 2. First level of training DietCam for food identification, classification.
For training DietCam at first level of food identification, classification, pasta dish in this image
was framed and annotated as “pasta dish”.

66
Figure 3. Results of DietCam food identification at first level, classification.
On the left, a processed image by DietCam is shown, with each rectangle frame representing one
food identification, which also appears on the associated text file showed on the right and is
highlighted.

67
Figure 4. Example image coded by raters.
This image was coded by raters as: grapes 100% available and visible on the serving plate; ice-
cream 100% available and visible on the serving plate; pasta dish less than 100% available and
visible on the serving plate; and pasta dish in the image but not on the plate.

68
Figure 5. Second level of training DietCam for food identification, subclass identification:
Single food.
For training DietCam at the second level of food identification, subclass identification, this
particular color was assigned for cookie.

69
Figure 6. Second level of training DietCam for food identification, subclass identification:
Mixed food.
For training DietCam at the second level of food identification, subclass identification, a specific
color was assigned to each ingredient in the sandwich.

70
Table 5. Summary of images coded by raters: Meal A and Meal B.
Numbers of Images n (%)
Meal A (n=18,344)
Chocolate Chip Cookies Item 100% on the plate 4,843 (26.4) Item partially on the plate 4,257 (23.2) Item in the image but not on the plate 391 (2.1)
Potato Chips Item 100% on the plate 4,935 (26.9) Item partially on the plate 5,096 (27.8) Item in the image but not on the plate 383 (2.1)
Chicken & Wild Rice Item 100% on the plate 1,601 (8.7) Item partially on the plate 4,116 (22.4) Item in the image but not on the plate 867 (4.7)
Turkey and Provolone Cheese Sandwich
Item 100% on the plate 1,754 (9.6) Item partially on the plate 3,692 (20.1) Item in the image but not on the plate 1,153 (6.3)
No Food at all
1,590 (8.7)
Blurry
1,062 (5.8)
Meal B (n=18,068)
Chocolate Ice-cream Item 100% on the plate 6,612 (36.6) Item partially on the plate 2,921 (16.2) Item in the image but not on the plate 313 (1.7)
Grapes Item 100% on the plate 4,644 (25.7) Item partially on the plate 5,853 (32.5) Item in the image but not on the plate 316 (1.7)
Pasta with Broccoli & Alfredo Sauce
Item 100% on the plate 1,307 (7.2) Item partially on the plate 3,978 (22.0) Item in the image but not on the plate 1,155 (6.4)
Ham & Cheddar Cheese Wrap
Item 100% on the plate 2,061 (11.4) Item partially on the plate 1,944 (10.8) Item in the image but not on the plate 740 (4.1)
No Food at all 1,188 (6.6)
Blurry
1,039 (5.8)

71
Table 6. Results of DietCam food identification.
Numbers of Images in which Item was Identified
n (%) Meal A (n=18,344) Chocolate Chip Cookies 7,061 (38.5) Potato Chips 3,931 (21.4) Chicken & Wild Rice 3,445 (18.8) Turkey and Provolone Cheese Sandwich 3,238 (17.7) No food at all 4,267 (23.3) Meal B (n=18,068) Chocolate Ice-cream 2,203 (12.2) Grapes 7,830 (43.3) Pasta with Broccoli and Alfredo Sauce 3,386 (18.7) Ham & Cheddar Cheese Wrap 2,922 (16.2) No food at all 4,364 (24.2)

72
Table 7. Results of food identification (classification): DietCam vs provided food.
Means with different superscripts were significantly different (p < 0.05). True Positive: coded image result and DietCam result both identify the food in the image False Positive: coded image result does not identify food in the image while DietCam identifies the food in the image False Negative: coded image result identifies the food in the image while DietCam does not identify the food in the image True Negative: coded image result and DietCam result both do not identify the food in the image
Numbers of Images n (% per total image in meal)
Meal A (n=18,344)
Chocolate Chips Cookies
Correctly Identified (True Positive)a 6681 (36.4) Incorrectly Identified (False
Positive)b 380 (2.1)
No Identification (False Negative)a 2503 (13.6) Not in image (True Negative)c 8780 (47.9)
Potato Chips
True Positivea 3836 (20.9) False Positiveb 95 (0.5) False Negativea 6244 (34.0) True Negativec 8169 (44.5)
Chicken & Wild Rice
True Positivea 3284 (17.9) False Positiveb 161 (0.9) False Negativea 2589 (14.1) True Negativec 12310 (67.1)
Turkey and Provolone Cheese Sandwich
True Positivea 3075 (16.8) False Positiveb 163 (0.9) False Negativea 2694 (14.7) True Negativec 12312 (67.7)
Meal B (n=18,068)
Chocolate Ice-cream
True Positivea 2070 (11.5) False Positiveb 133 (0.7) False Negativea 7489 (41.4) True Negativec 8376 (46.4)
Grapes
True Positivea 7532 (41.7) False Positiveb 289 (1.6) False Negativea 2980 (16.5) True Negativec 7267 (40.2)
Pasta with Broccoli & Alfredo Sauce
True Positivea 3226 (17.9) False Positiveb 160 (0.9) False Negativea 2303 (12.7) True Negativec 12379 (68.5)
Ham & Cheddar Cheese Wrap
True Positivea 2572 (14.2) False Positiveb 350 (1.9) False Negativea 1957 (10.8) True Negativec 13189 (73.0)

73
Table 8. Questionnaire results: Easiness of using Sony Smarteyeglass.
Percent % (n) n=30
Extremely Hard 0 (0)
Hard 3.3 (1)
Neither Hard or Easy 13.3 (4)
Easy 66.7 (20)
Extremely Easy 16.7 (5)
Table 9. Questionnaire results: Clearness of instructions for using Sony Smarteyeglass.
Percent % (n) n=30
Extremely Unclear 0 (0)
Unclear 0 (0)
Neither Unclear or Clear 0 (0)
Clear 56.7 (17)
Extremely Clear 43.3 (13)
Table 10. Questionnaire results: Satisfaction with experience using Sony Smarteyeglass.
Percent % (n) n=30
Extremely Unsatisfied 0 (0)
Unsatisfied 10 (3)
Neither Unsatisfied or Satisfied
13.3 (4)
Satisfied 53.3 (16)
Extremely Satisfied 23.3 (7)

74
Table 11. Questionnaire results: Likelihood of wearing Sony Smarteyeglass while eating at different dining situations.
Percent % (n) n=30
Extremely Unlikely
Unlikely Neither Unlikely or
Likely
Likely Extremely Likely
At home eating alone? 16.7 (5) 26.7 (8) 26.7 (8) 20 (6) 10 (3)
At home eating with family/friends?
33.3 (10) 33.3 (10) 6.7 (2) 23.3 (7) 3.3 (1)
At a restaurant eating alone?
40 (12) 36.7 (11) 10 (3) 10 (3) 3.3 (1)
At a restaurant eating with family/friends?
46.7 (14) 43.3 (13) 6.7 (2) 0 (0) 3.3 (1)
At work eating alone? 26.7 (8) 30 (9) 20 (6) 20 (6) 3.3 (1)
At work eating with family/friends?
43.3 (13) 33.3 (10) 10 (3) 10 (3) 3.3 (1)
At a party eating with family/friends?
56.7 (17) 20 (6) 16.7 (5) 3.3 (1) 3.3 (1)
Table 12. Questionnaire results: Likelihood to remember to wear Sony Smarteyeglass before eating.
Percent % (n) n=30
Extremely Unlikely 6.7 (2)
Unlikely 10 (3)
Neither Unlikely or Likely 30 (9)
Likely 46.7 (14)
Extremely Likely 6.7 (2)
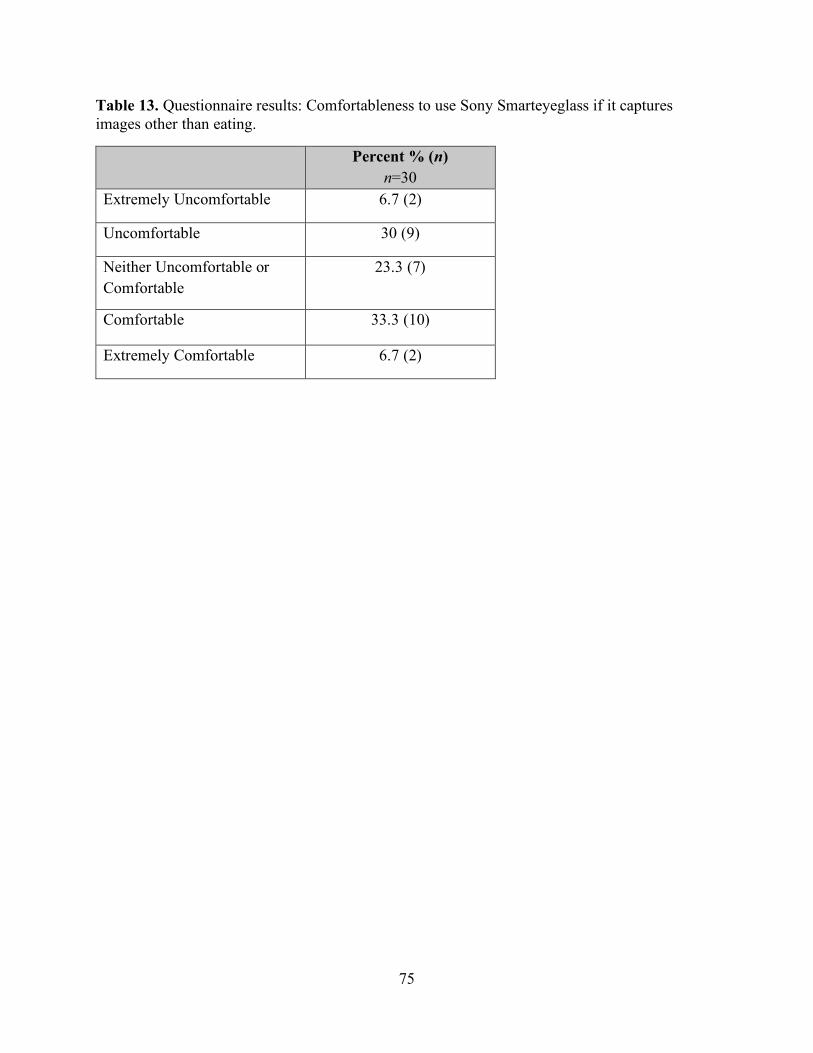
75
Table 13. Questionnaire results: Comfortableness to use Sony Smarteyeglass if it captures images other than eating.
Percent % (n) n=30
Extremely Uncomfortable 6.7 (2)
Uncomfortable 30 (9)
Neither Uncomfortable or Comfortable
23.3 (7)
Comfortable 33.3 (10)
Extremely Comfortable 6.7 (2)

76
Figure 7. Mean weight of Regular-shaped foods: 24-hour Dietary Recall vs. WFI.
0
50
100
150
200
250
300
350
Cookie(Single Food)
Grapes(Single Food)
Sandwich(Mixed Food)
Wrap(Mixed Food)
Mea
n W
eigh
t (g)
Regular-Shaped Foods
Recall WFI

77
Figure 8. Mean weight of Irregular-shaped Foods: 24-hour Dietary Recall vs. WFI.
0
50
100
150
200
250
300
350
Chips(Single Food)
Ice cream(Single Food)
Chicken & Rice(Mixed Food)
Pasta Dish(Mixed Food)
Mea
n W
eigh
t (g)
Irregular-Shaped Foods
Recall WFI

78
Figure 9. Mean weight of Single foods: 24-hour Dietary Recall vs. WFI.
0
50
100
150
200
250
300
350
Cookie(Regular-Shaped)
Grapes(Regular-Shaped)
Chips(Irregular-Shaped)
Ice cream(Irregular-Shaped)
Mea
n W
eigh
t (g)
Single Foods
Recall WFI
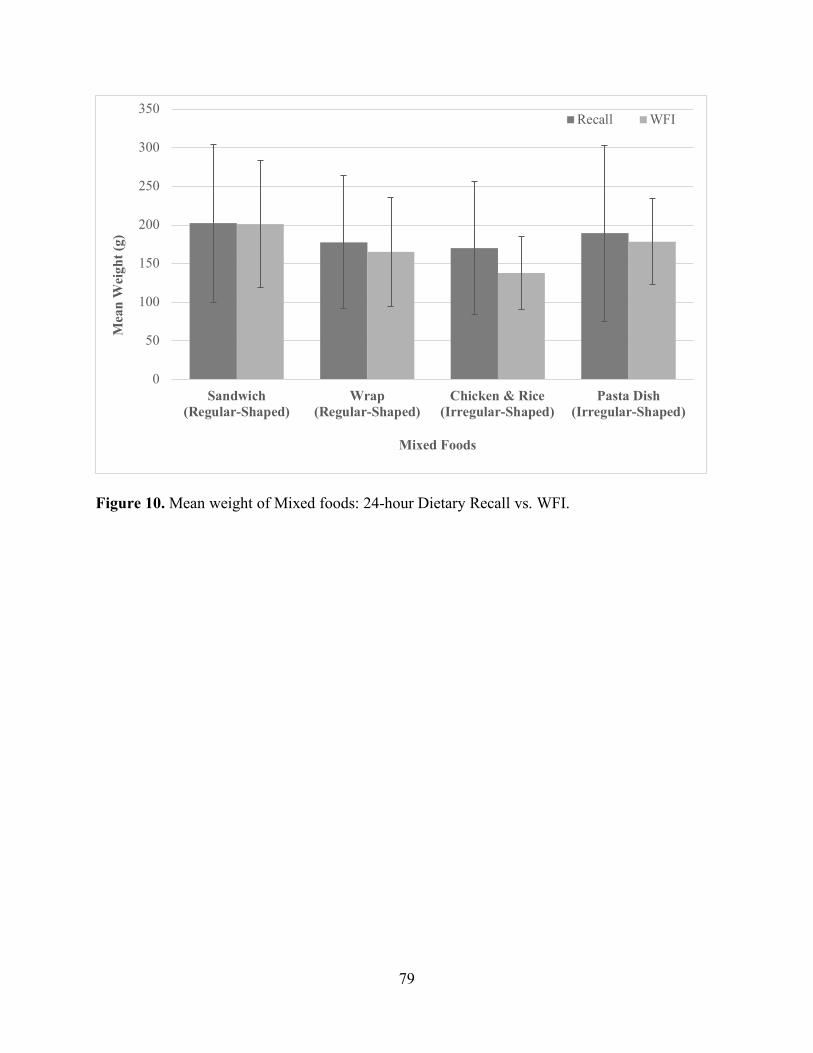
79
Figure 10. Mean weight of Mixed foods: 24-hour Dietary Recall vs. WFI.
0
50
100
150
200
250
300
350
Sandwich(Regular-Shaped)
Wrap(Regular-Shaped)
Chicken & Rice(Irregular-Shaped)
Pasta Dish(Irregular-Shaped)
Mea
n W
eigh
t (g)
Mixed Foods
Recall WFI

80
APPENDIX 2 – IRB FORM B

81
FORM B APPLICATION
All applicants are encouraged to read the Form B guidelines. If you have any questions as you develop your Form B, contact your Departmental Review Committee (DRC) or Research Compliance Services at the Office of Research.
FORM B
IRB # ____________________________ Date Received in OR ________________
THE UNIVERSITY OF TENNESSEE
APPLICATION FOR REVIEW OF RESEARCH INVOLVING HUMAN SUBJECTS
I. IDENTIFICATION OF PROJECT
1. Principal Investigator: Tsz-Kiu Chui, RD (Principal Investigator) Jessie Harris Building Room 229 1215 W. Cumberland Avenue Knoxville, TN 37996-1920 974-0752 [email protected]
Faculty Advisor: Hollie Raynor, PhD, RD, LDN Jessie Harris Building Room 229 1215 W. Cumberland Avenue Knoxville, TN 37996-1920 974-6259 [email protected] Department: Nutrition
2. Project Classification: Research project
3. Title of Project: Validation Study of a Passive Image-Assisted Dietary Assessment with Automated Image Analysis Process
4. Starting Date: Upon IRB Approval
5. Estimated Completion Date: December 2018

82
6. External Funding (if any): N/A
o Grant/Contract Submission Deadline:
o Funding Agency:
o Sponsor ID Number (if known):
o UT Proposal Number (if known): II. PROJECT OBJECTIVES Background and Specific Aims
Dietary assessment is used to determine the nutrient intake of individuals and groups.1 Accurate dietary assessment is essential to nutrition research to understand how diet impacts health.2 Currently, there is no gold standard or single method of dietary assessment that is applicable for all nutrition research questions, as the purpose, population of interest, and resources available in any investigation impact the method of assessment that can be implemented.1
The current dietary assessment methods have limitations that can affect accuracy of dietary data. Currently, subjective dietary assessment methods are widely used in research. However, these subjective methods are prone to errors due to issues of accuracy of capturing all foods and beverages consumed as a consequence of recall errors and determining portion sizes of foods and beverages consumed due to poor estimation or inaccurate measurements.3,4 Self-reported dietary data also appears to have a systematic bias, in which populations with obesity are more likely to underreport intake.5-12 Subjective methods are also labor-intensive in regards to data collection and/or analysis.1,13 Objective dietary assessment can limit human errors and provide objective dietary information. However, few objective methods are available in free-living situations, and objective methods can be costly and difficult to use in studies with large samples.1,13,14 The incorporation of technology into dietary assessment, such as image-assisted dietary assessment, has been investigated by researchers to improve accuracy in collecting dietary information in free-living situations.15 The active dietary assessment methods, which is self-administered and requires individuals to manually capture images or videos with digital cameras, smartphones, and other devices with picture-capturing function,15 had improved accuracy and provided comparable accuracy of dietary information when compared with objective dietary assessment methods.16,17 However, the active dietary assessment methods still rely on humans to manually capture images, which does not eliminate human errors. Passive dietary assessment methods, which images or videos automatically capture dietary intake through the use of wearable devices or other tools, can reduce human errors as the process of collecting dietary information by reducing the effort and training needed to obtain imagery.15 The results of reviewed passive dietary assessment methods showed improved accuracy in assessing dietary information.18-21 However, all the image-assisted dietary assessment methodologies at this time involve manual image analysis processes, which increases cost. Thus, there is a need for a wearable device that has the function of passive image capturing, with

83
complete automated image analysis software to provide accurate and inexpensive dietary information.
Therefore, the purpose of this investigation is to validate a passive image-assisted dietary assessment method using images taken by Sony Smarteyeglass and an automatic image analysis software, DietCam, to identify food items and estimate portion sizes. The specific aims of this investigation are: 1) to determine the accuracy of DietCam in identifying foods in different shapes (Regular vs Irregular) and complexities (Single food vs Mixed food); and 2) to determine the accuracy of DietCam to estimate food volumes comparing with weighed food intake measured from plate waste method. III. DESCRIPTION AND SOURCE OF RESEARCH PARTICIPANTS Study Design
To validate the accuracy of DietCam in analyzing food images taken by Sony Smarteyeglass in food recognition and volume estimation, a 2x2x2x2x3 mixed factorial design will be used, with a between-subject factor of the order of meals (Order 1 and 2) and within-subject factors of food shapes (Regular and Irregular), food complexities (Single food and Mixed food), meals (Meal A and B), and methods of measurement (DietCam, weighed food intake [WFI], and 24-hour dietary recall) (see Description of Study Design). Individuals will be randomized into one of the two orders of meals. In each meal, participants will be given a meal that includes a regular-shaped single food (i.e., cookie), an irregular-shape single food (i.e., ice cream), a regular-shaped mixed food (i.e., sandwich), and irregular-shaped mixed food (i.e., pasta dish). Dependent variables will be the identification of foods and amount of foods consumed.

84
Description of Study Design Order Meal Session 1 Meal Session 2 1 (n=15) Meal A:
Turkey & Provolone Cheese Sandwich (Regular-shaped mixed food) Chicken and Wild Rice (Irregular-shaped mixed food) Chocolate Chip Cookie (Regular-shaped single food) Potato Chips Original (Irregular-shaped single food)
Meal B: Ham and Cheddar Cheese Wrap (Regular-shaped mixed food) Pasta with Broccoli in Alfredo Sauce (Irregular-shaped mixed food) Red Seedless Grapes (Regular-shaped single food) Chocolate Ice-cream (Irregular-shaped single food)
2 (n=15) Meal B: Ham and Cheddar Cheese Wrap (Regular-shaped mixed food) Pasta with Broccoli in Alfredo Sauce (Irregular-shaped mixed food) Red Seedless Grapes (Regular-shaped single food) Chocolate Ice-cream (Irregular-shaped single food)
Meal A: Turkey & Provolone Cheese Sandwich (Regular-shaped mixed food) Chicken and Wild Rice (Irregular-shaped mixed food) Chocolate Chip Cookie (Regular-shaped single food) Potato Chips Original (Irregular-shaped single food)
Participants
Thirty men and women will be invited to participate in the validation study. Eligibility of this investigation will be based upon the following criteria: 1) between the ages of 18 and 65 years; 2) body mass index (BMI) 18.5 to 24.9 kg/m2; 3) no food allergies/intolerance to foods used in the investigation; 4) report not having a dietary plan or dietary restrictions that prevents consumption of the foods used in the investigation; 5) report a favorable preference for the foods served in the meal (listed in Table 2), with participants rate each food item ³ 3 on a Likert scale during the phone screen; 6) able to complete all two meal sessions within four weeks of the screening session; 7) are not legally blind without corrected lenses; and 8) are able to eat a meal while wearing the Sony Smarteyeglass. Participants will be excluded if they wear electronic medical devices such as pacemakers and implantable defibrillators. Recruitment
Participants will be recruited from the University of Tennessee, Knoxville campus by posting flyers around campus and handing out flyers around campus and sending emails through University electronic mailing lists. Participants will be asked to contact the Healthy Eating and

85
Activity Laboratory (HEAL) by phone and will be given information about a study that investigates dietary assessment via digital images. Interested participants will be screened over the phone and scheduled for a face-to-face screening session. Participants who sign the consent form at the screening session and meet eligibility criteria will be randomized to one of two orders. IV. METHODS AND PROCEDURES Procedures
All participants will be asked to come to HEAL for 1, 30-minute screening session, and then for 2, 40-minute meal sessions, with approximately one week occurring between each session. Sessions will be scheduled between 11:00am and 5:00pm, Monday to Friday. During the screening session, interested participants will sign the consent form. After signing the consent from, eligibility will be confirmed by taking height and weight measures. Participants will also be given questionnaires related to demographics. Prior to the start of the first meal session, eligible participants will be randomized to one of the two orders described in Table 1, using a random numbers table. Participants will be instructed for the meal sessions to stop eating a minimum of two hours prior to the scheduled meal sessions and only consume water during that period.
During both meal sessions, instructions on how to use Sony Smarteyeglass will be provided to participants. These instructions will include how to wear and use the eyeglasses. Participants will be instructed that, after putting on the Smarteyeglass, to initiate the recording via the controller of the Sony Smarteyeglass. After the recording is initiated and prior to starting to eat, participants will be instructed to look at each provided food at the table. Then, participants will also be instructed to turn their head toward the left shoulder, look at each food from the side, and then repeat the same step for turning their head toward the right shoulder. Participants will be asked to start the meal by taking one bite of each provided food. For the first bite of each food, participants will be instructed to hold the food, either in their hand or on a fork or spoon (depending on the food), approximately 12 inches in front of the eyeglasses and to look at the food. Following taking the first bite of each provided food, participants will be instructed to eat normally until satisfied. Participants will be given 30 minutes to eat. The investigator will leave the room while the participant is eating. The investigator will check in with participants every 10 minutes. At the end of 30 minutes, participants will be instructed to again look at each provided food on the table at three different angles (looking straight at each food, from left side and the right side) following the exact same procedure at the beginning of the meal. The second meal session will follow the same procedure as the first session.
On the day following each meal session, participants will be called to complete a 24-hour dietary recall, which will take 20 minutes to complete. Instructions will be provided to participants at the end of each meal session about how to complete the dietary recall and a two-dimensional visual aid will be provided to aid participants in estimating the consumed portions for each food and beverage item consumed.
At the end of second meal session, participants will be asked to complete a questionnaire to provide feedback on their use of the Sony Smarteyeglass. After the second session is completed, the participants will be thanked for their participation and given a $20 gift card to compensate for their time in the study.
For the first and second meal session, the meals will contain foods that are categorized into two food shapes (Regular and Irregular) and two food complexities (Single food and Mixed

86
food). Each meal will contain four foods (see Detailed Description of Provided Foods for detailed description of foods), with the four foods representing the four potential food categories (regular-shaped single food, irregular-shaped single food, regular-shaped mixed food, irregular-shaped mixed food). Along with the four foods, participants will be given 20oz of water in each meal session. Foods will be weighed prior to being provided to participants and the amount provided to participants will be within +/- 3g of the amount described in Detailed Description of Meal Sessions. Mixed foods will be broken down into their individual food components and measured. Each meal will provide approximately 50% of daily estimated energy need for each sex. The Estimated Calories Needed Per Day for males and females aged 19 to 35 years are 2450 kcal/day and 1900 kcal/day, respectively.22 Thus, each meal will provide approximately 1225 kcal for males and 950 kcal for females. Each food will provide approximately 25% of the energy for each meal. Detailed Description of Provided Foods
Food Brand Serving Calories per
Serving
Calories per
Gram Cookie Nabisco Chips Ahoy! Original 33g 160 4.85 Grapes Red Seedless Grapes 161g 104 0.65
Potato chips Food Clubâ Classic Potato Chips 28g 160 5.71 Ice-cream Blue Bellâ Dutch Chocolate 72g 160 2.22 Chicken Tysonâ Fully Cooked Chicken Breast
Fillets 98g 110 1.12
Wild Rice Minuteâ Ready-to-serve Brown & Wild Rice
125g 230 1.84
Sandwich Bread
Nature’s Ownâ 100% whole wheat bread
26g 60 2.30
Turkey Deli Oscar Mayer Delifresh Smoked Turkey Breast
56g 50 0.89
Provolone Cheese
Food Clubâ Not Smoked Provolone Cheese
23g 80 3.48
Tomato Fresh Tomato Medium 50g 8 0.16 Lettuce Fresh Lettuce 75g 6 0.08 Tortilla OLE Mexican Foods High Fiber Low
Carbs Tortilla 45g 50 1.11
Ham Deli Oscar Mayer Delifresh Smoked Ham 56g 50 0.89 Cheddar Cheese
Food Clubâ Mild Cheddar Cheese (Thin Sliced)
32g 130 4.06
Spring Mix Fresh Spring Mix 142g 35 0.25 Dressing Food Clubâ Fat Free Ranch Dressing 29g 25 0.85
Pasta Barillaâ Ready Pasta Fully Cooked Penne
121g 210 1.74
Broccoli Food Clubâ Broccoli Spears 89g 30 0.34 Alfredo Sauce Raguâ Classic Alfredo 61g 90 1.48

87
Detailed Description of Meal Sessions
Meals Food
Female Male Amoun
t Served
Calories
Served
Amount
Served
Calories
Served
A
Turkey & Provolone Cheese Sandwich
Whole Wheat Bread 52g 120 52g 120 Turkey 70g 62 133g 118 Provolone Cheese 23g 80 23g 80 Tomato 50g 8 50g 8 Lettuce 45g 4 45g 4 Total: 240g 274 303g 330
Chicken and Wild Rice
Chicken 98g 110 98g 110 Wild Rice 71g 131 107g 197 Total: 169g 241 205g 307
Chocolate Chips Cookies 44g 213 60.5g 293 Potato chips Original 39g 223 52g 297
Total Meal A Calories 951 1227
B
Ham and Cheddar Cheese Wrap
Tortilla 45g 50 45g 50 Ham Deli 76g 68 103 92 Cheddar Cheese 21g 85 32g 130 Spring Mix 36g 9 36 9 FF Ranch Dressing 29g 25 29g 25 Total: 207g 237 247g 306
Pasta with Broccoli and Alfredo Sauce
Pasta 91g 158 121g 210 Broccoli 66g 22 66g 22 Alfredo Sauce 38g 56 50g 74 Total: 195g 236 237g 306
Chocolate Ice-cream 107g 238 138g 306 Red Seedless Grapes 365g 237 471g 306
Total Meal B Calories 948 1224 Measures All measures will be collected at HEAL by trained research assistants.
Anthropometrics: Weight, height, and BMI- During the initial phone screen height and weight will be asked by the phone screener and BMI calculated from those values. During the initial screening session, weight will be assessed by an electronic scale, and height will be assessed using a stadiometer, using standard procedures, with participants wearing light clothing, without shoes.23 BMI (kg/m2) will be calculated from these measures. A BMI between 18.5 and 24.9 is required to be eligible for this study.

88
Demographics- At the initial screening session, basic demographic information (e.g., gender, age, education level) will be obtained.
Sony Smarteyeglass – Digital images will be recorded during each meal session using Sony Smarteyeglass. Number of blurred images and times that Sony Smarteyeglass fail to capturing images will be documented.
Weighed Food Intake- Before and after each meal session, each food items will be weighed to the nearest tenth of a gram using an electronic food scale. The weight of the containers will also be measured. The total grams of each food items will be recorded and total food consumed will be calculated by subtracting plate waste weight from the pre-meal weight. Results of total grams of each food items and total food consumed will be entered into Nutrition Data System for Research (NDS-R) dietary software developed by the Nutrition Coordinating Center, University of Minnesota, Minneapolis, Minnesota.
DietCam- DietCam is developed by Dr. JinDong Tan and colleagues24 and is an application designed to automatically recognize foods and estimate volumes of a meal from images or videos. DietCam has an algorithm called multi-view food classification that recognizes foods and beverages in images or videos and estimates volumes without any reference objects.24 DietCam has the average accuracy rate of 84% in recognizing regular shape food items.24 DietCam will be used to analysis digital images taken by the Sony Smarteyeglass in the study to identify food items and estimate volumes of food intake. In this investigation, DietCam will be used to identify food items with different shapes (Regular vs Irregular) and complexities (Single food vs Mixed food). DietCam will also be used to estimate volume of foods in the unit of cubic meters (m3). Results of volume estimation of foods from DietCam will be entered to NDS-R to convert to commonly used measurements.
24-hour Dietary Recall- On the following day of each meal session, the investigator will ask the participant to recall their dietary intake by having the participant reporting all foods and beverages consumed and the time in which they consumed these items within the past 24 hours. Participants will be asked what time of day the foods and beverages were consumed and will be shown two-dimensional food shapes to help with estimating portion sizes. Only dietary intake for the meal session will be entered into NDS-R to convert to commonly used measurements.
Participants’ Feedback- At the end of last meal session, participants will be asked to complete a questionnaire regarding their experience on using Sony Smarteyeglass. A total of six structured questions will be included in the questionnaire and each question will be associated with an open-ended question. Structured questions will consist of a five-scale rating regarding ease of use, clearness of instructions, satisfaction, likelihood, and comfortableness. Percentages of participants answering in responses to each structured question will be tabulated and open-ended questions will be summarized. Statistical Analyses
The data will be analyzed using SPSS version 22.0 for Windows (SPSS Inc., Chicago IL). Quantitative data on participant characteristics and responses for the questionnaire regarding participants’ feedback will be described with summary statistics. Qualitative data from the questionnaire will be summarized. For all analyses, mixed foods will be broken into their food categories (e.g. sandwich, pasta dish, etc.) and also into their individual food components (e.g., whole wheat bread, turkey, provolone cheese, etc.), with analyses conducted using both methods for coding mixed foods. Percent agreement for food identification between the DietCam and provided foods will be determined for irregular- and regular-shaped foods and single and mixed

89
foods. Inter-rater agreement on food identification between the DietCam and provided foods for irregular- and regular-shaped foods and single and mixed foods will be determined using Cohen’s kappa coefficient. For food volume, percent amount agreement will be described by dividing the DietCam consumed amount by actual consumed amount, and then multiplying by 100 for irregular- and regular-shaped foods and single and mixed foods. A 2x2x2x2x3 mixed analysis of variance, with a between-subject factor of orders (Order 1 and 2) and within-subject factors of food shapes (Regular and Irregular), food complexities (Single food and Mixed food), meals (Meal A and B), and methods of measurement (DietCam, WFI, and 24-hour dietary recall) will be conducted for amount of food consumed. For significant outcomes (p<0.05), post hoc pairwise comparisons using Bonferroni corrections were made to determine which groups differed in total grams and energy consumed. The Greenhouse-Geisser corrections were used when appropriate for repeated measures to adjust for sphericity.
V. SPECIFIC RISKS AND PROTECTION MEASURES Human Subjects Research and Protection from Risk Risks to Subjects Human Subjects Involvement and Characteristics. Participants will be 30 healthy weight men and women, 18 to 65 years old recruited from the University of Tennessee campus. Participants will be eligible if they meet the following criteria: 1) between the ages of 18 and 65 years; 2) body mass index (BMI) 18.5 to 24.9 kg/m2; 3) no food allergies/intolerance to foods used in the investigation; 4) report not having a dietary plan or dietary restrictions that prevents consumption of the foods used in the investigation; 5) report a favorable preference for the foods served in the meal (listed in Table 2), with participants rate each food item ³ 3 on a Likert scale during the phone screen; 6) able to complete all two meal sessions within four weeks of the screening session; 7) are not legally blind without corrected lenses; and 8) are able to eat a meal while wearing the Sony Smarteyeglass. Participants will be excluded if they wear electronic medical devices such as pacemakers and implantable defibrillators. Rationale for Exclusion of Children and Adolescents. These groups may respond differently to the use and the instructions of the Sony Smarteyeglass. The first step in validating this approach for dietary assessments is to determine if this approach works with adults. Source of Materials. Participants will provide weight, dietary intake, and questionnaire data specifically for research purposes. Participants will be given a unique identification number that will be used on all documents and electronic data files with no references to individual names, addresses, or phone numbers. Hard copies of data will be stored in locked file cabinets in locked rooms in which only project staff will have access (Jessie Harris Building [JHB], room 102) and electronic files will be password protected. No personal identification information including participants’ names, addresses, or phone numbers will be digitally recorded by Sony Smarteyeglass during sessions. Videos/images will be downloaded directly to the university server weekly and saved as electronic data files with a unique identification number assigned to each documents and files. Only project staff will have access to the electronic copies of videos/images. Videos/images will only be analyzed by the project staffs using the DietCam software.

90
Potential Risks. The risks of this investigation are considered minimal. Participants could be allergic to the foods used in the investigation; however, all participants will be screened for food allergies prior to consuming the meal. Videos/images taken by Sony Smarteyeglass may capture things other than served foods during the meal sessions; however, all meal sessions will be conducted in HEAL (JHB 102) with only one participant at each scheduled time period. In addition, no personal identification information will be digitally recorded during sessions. Other possible risks related to the research may include loss of confidentiality, discomfort (such as eye strain, fatigue, nausea, or motion sickness) while using the Sony Smarteyeglass, and the use of Sony Smarteyeglass may affect the performance of electronic medical device such as cardiac pacemakers and implantable defibrillators. Adequacy of Protection against Risk Recruitment and Informed Consent. Participants will be recruited from the University of Tennessee, Knoxville campus by posting flyers around campus and handing out flyers around campus and sending emails through University electronic mailing lists. Participants will contact HEAL and will receive a description of the study over the telephone. Interested participants will be screened over the phone and scheduled for an in-person screening session. Interested participants who meet eligibility criteria will sign a consent form approved by the Institutional Review Board of the University of Tennessee during the first appointment. Protection against Risk. The confidentiality of all participants will be protected in the following ways: 1) participants will be given a unique identification number that will be used on all documents with no references to individual names, addresses, or phone numbers; 2) all hard copy data will be stored in locked cabinets in the locked rooms of JHB 102; 3) videos/images taken by Sony Smarteyeglass containing no identifiable data will be downloaded directly to the university server weekly and saved as electronic data files, and only analyzed by project staff with DietCam software for research purposes; 4) all electronic data files will be password protected and backed-up; 5) these procedures will be approved by the University of Tennessee’s Institutional Review Board to ensure that they meet the standards for the protection of human subjects. Data and Safety Monitoring Plan Data Collection, Storage, and Quality Control. All staff involved in data collection will be trained by the PI and must demonstrate competence in administering all questionnaire measures. The research assistant will review all questionnaire data for accuracy and completion. Participants will be re-contacted to provide missing data or to clarify responses. Range checks will be built into the data entry procedure to alert staff to data that should be clarified. Under the supervision of the PI, a complete double-entry verification procedure will be used to ensure that all data entry is correct. Furthermore, Tsz-Kiu Chui will conduct error checking and preliminary analyses of all data to ensure accuracy. Hard copies of data will be stored in a locked filing cabinet and electronic data files will be password protected and backed-up. Data will be stored in JHB 102 and will be retained indefinitely. Videos/images taken by Sony Smarteyeglass will be downloaded directly to the university server weekly and saved as electronic data files to prevent loss of data. Videos/images will be analyzed by project staff with DietCam software. The files will be retained indefinitely.

91
Participant Confidentiality. All participant records and assessment data from this study will be treated as confidential, including participants’ names and the fact they are participating in the study. The records and questionnaires collected will be safeguarded according to the policy of the University of Tennessee, a policy that is based on Tennessee law and which promotes the protection of confidential health information. Adverse Event and External Review for Data Safety. Adverse events reported during the course of the study will be documented by research staff and reported to the University of Tennessee’s Institution Review Board. VI. BENEFITS Potential Benefits of the Proposed Research to the Subjects and Others. There are no benefits for participating in this study. Importance of Knowledge Gained. The potential for minimal risk to human subjects is considered reasonable in relation to the importance of the knowledge that is expected to result from this study. We believe this project is significant because it validates a new passive image-assisted dietary assessment with automated image analysis process, which eliminates human errors in the process of data collection and analysis process. Moreover, the findings of this study will have important applications for future refinement of the automated image analysis software, DietCam, and further development of the passive image-assisted dietary assessment. VII. METHODS FOR OBTAINING "INFORMED CONSENT" FROM PARTICIPANTS
The study will be described individually to each interested adult during the initial telephone call and then in more detail during the first in-person appointment at HEAL on the University of Tennessee, Knoxville campus. Interested, eligible participants will sign a consent form approved by the Institutional Review Board at the University of Tennessee during the first appointment. Signed consent forms will be stored in locked file cabinets in JHB 102 with participants receiving a copy. VIII. QUALIFICATIONS OF THE INVESTIGATOR(S) TO CONDUCT RESEARCH
The Principal Investigator will be led by a faculty advisor (Dr. Hollie Raynor), who has extensive research and experience in designing, implementing, and evaluating randomized controlled trials with experience in conducting dietary assessment. Tsz-Kiu Chui is a registered dietitian with three years of work experience in nutrition counseling and dietary assessment. IX. FACILITIES AND EQUIPMENT TO BE USED IN THE RESEARCH Research space in JHB will be used for this investigation. The space is in room 102 (Healthy Eating and Activity Laboratory), is 768 square feet, and includes a group meeting room, two offices, a reception area, a storage closet, and a kitchen. Data will be stored in locked filing cabinets and in password-protected files in HEAL. All equipment to be used is courtesy of HEAL. The following equipment will be used in the research study: a food scale (Denver Instruments SI-8001, Fisher Scientific); a portable digital scale (Healthometer Professional, Sunbeam Product Inc. Raton, FL); and a portable stadiometer (SECA, ITIN Scale Company, Brooklyn, NY). Hard copies of data will be stored in

92
a locked filing cabinet and electronic data files will be password protected and backed-up. Data will be analyzed using NDS-R and the statistical program, SPSS for Windows. X. RESPONSIBILITY OF THE PRINCIPAL/CO-PRINCIPAL INVESTIGATOR(S) The following information must be entered verbatim into this section: By compliance with the policies established by the Institutional Review Board of The University of Tennessee the principal investigator(s) subscribe to the principles stated in "The Belmont Report" and standards of professional ethics in all research, development, and related activities involving human subjects under the auspices of The University of Tennessee. The principal investigator(s) further agree that: 1. Approval will be obtained from the Institutional Review Board prior to instituting
any change in this research project.
2. Development of any unexpected risks will be immediately reported to Research Compliance Services.
3. An annual review and progress report (Form R) will be completed and submitted
when requested by the Institutional Review Board. 4. Signed informed consent documents will be kept for the duration of the project and
for at least three years thereafter at a location approved by the Institutional Review Board.
XI. SIGNATURES ALL SIGNATURES MUST BE ORIGINAL. The Principal Investigator should keep the original copy of the Form B and submit a copy with original signatures for review. Type the name of each individual above the appropriate signature line. Add signature lines for all Co-Principal Investigators, collaborating and student investigators, faculty advisor(s), department head of the Principal Investigator, and the Chair of the Departmental Review Committee. The following information should be typed verbatim, with added categories where needed: Principal Investigator: Tsz-Kiu Chui, RD Signature: _________________________ Date: ____________________ Co-Principal Investigator: Signature: ________________________ Date: _____________________ Co-Investigator: Signature: ________________________ Date: _____________________ Student Advisor (if any): Dr. Hollie Raynor, PhD, RD, LDN

93
Signature: __________________________ Date: ___________________ XII. DEPARTMENT REVIEW AND APPROVAL The application described above has been reviewed by the IRB departmental review committee and has been approved. The DRC further recommends that this application be reviewed as: [X] Expedited Review -- Category(s): ________4______________ OR [ ] Full IRB Review Chair, DRC: Katie Kavanagh, PhD Signature: ____________________________ Date: _________________ Department Head: Jay Whelan, PhD Signature: ____________________________ Date: _________________ Protocol sent to Research Compliance Services for final approval on (Date) : ___________ Approved: Research Compliance Services Office of Research 1534 White Avenue Signature: ____________________________ Date: _________________
For additional information on Form B, contact the Office of Research Compliance Officer or by phone at (865) 974-3466.
References 1. Johnson R.K. YBA, Hankin J.H. Dietary assessment and validation. Research Successful
Approaches. 3rd ed: American Dietetic Association; 2008. 2. Kirkpatrick SI, Collins CE. Assessment of nutrient intakes: introduction to the special
issue. Nutrients. 2016;8(4):184. 3. Thompson FE, Subar AF. Dietary assessment methodology. Nutrition in the Prevention
and Treatment of Disease. 3rd ed. Bethesda, Maryland: National Cancer Institute; 2013:5-46.
4. Thompson FE, Subar AF, Loria CM, Reedy JL, Baranowski T. Need for technological innovation in dietary assessment. Journal of the American Dietetic Association. 2010;110(1):48-51.

94
5. Black AE, Prentice AM, Goldberg GR, et al. Measurements of total energy expenditure provide insights into the validity of dietary measurements of energy intake. Journal of the American Dietetic Association. 1993;93(5):572-579.
6. Buhl KM, Gallagher D, Hoy K, Matthews DE, Heymsfield SB. Unexplained disturbance in body weight regulation: diagnostic outcome assessed by doubly labeled water and body composition analyses in obese patients reporting low energy intakes. Journal of the American Dietetic Association. 1995;95(12):1393-1400; quiz 1401-1392.
7. Prentice AM, Black AE, Coward WA, et al. High levels of energy expenditure in obese women. British Medical Journal (Clinical Research Ed). 1986;292(6526):983-987.
8. Moshfegh AJ, Rhodes DG, Baer DJ, et al. The US Department of Agriculture Automated Multiple-Pass Method reduces bias in the collection of energy intakes. The American Journal of Clinical Nutrition. 2008;88(2):324-332.
9. Pikholz C, Swinburn B, Metcalf P. Under-reporting of energy intake in the 1997 National Nutrition Survey. The New Zealand Medical Journal. 2004;117(1202):U1079.
10. Scagliusi FB, Ferriolli E, Pfrimer K, et al. Underreporting of energy intake in Brazilian women varies according to dietary assessment: a cross-sectional study using doubly labeled water. Journal of the American Dietetic Association. 2008;108(12):2031-2040.
11. Subar AF, Kipnis V, Troiano RP, et al. Using intake biomarkers to evaluate the extent of dietary misreporting in a large sample of adults: the OPEN study. American Journal of Epidemiology. 2003;158(1):1-13.
12. Bandini LG, Schoeller DA, Cyr HN, Dietz WH. Validity of reported energy intake in obese and nonobese adolescents. The American Journal of Clinical Nutrition. 1990;52(3):421-425.
13. Lam YY, Ravussin E. Analysis of energy metabolism in humans: a review of methodologies. Molecular Metabolism. 2016;5(11):1057-1071.
14. Burrows TL, Martin RJ, Collins CE. A systematic review of the validity of dietary assessment methods in children when compared with the method of doubly labeled water. Journal of the American Dietetic Association. 2010;110(10):1501-1510.
15. Gemming L, Utter J, Ni Mhurchu C. Image-assisted dietary assessment: a systematic review of the evidence. Journal of the Academy of Nutrition and Dietetics. 2015;115(1):64-77.
16. Rollo ME, Ash S, Lyons-Wall P, Russell AW. Evaluation of a mobile phone image-based dietary assessment method in adults with Type 2 Diabetes. Nutrients. 2015;7(6):4897-4910.
17. Martin CK, Correa JB, Han H, et al. Validity of the Remote Food Photography Method (RFPM) for estimating energy and nutrient intake in near real-time. Obesity (Silver Spring, Md). 2012;20(4):891-899.
18. Arab L, Estrin D, Kim DH, Burke J, Goldman J. Feasibility testing of an automated image-capture method to aid dietary recall. European Journal of Clinical Nutrition. 2011;65(10):1156-1162.
19. Gemming L, Rush E, Maddison R, et al. Wearable cameras can reduce dietary under-reporting: doubly labelled water validation of a camera-assisted 24 h recall. The British Journal of Nutrition. 2015;113(2):284-291.
20. Pettitt C, Liu J, Kwasnicki RM, Yang GZ, Preston T, Frost G. A pilot study to determine whether using a lightweight, wearable micro-camera improves dietary assessment

95
accuracy and offers information on macronutrients and eating rate. The British Journal of Nutrition. 2016;115(1):160-167.
21. Jia W, Chen HC, Yue Y, et al. Accuracy of food portion size estimation from digital pictures acquired by a chest-worn camera. Public Health Nutrition. 2014;17(8):1671-1681.
22. U.S. Department of Health and Human Services; U.S. Department of Agriculture. 2015-2020 Dietary guidelines for Americans. Appendix 2. Estimated Calorie Needs per Day, by Age, Sex, and Physical Activity Level 2015; 8th Edition:http://health.gov.dietaryguidelines/2015/guidelines/. Accessed April 18, 2017.
23. Lohman TR, Roche AF, Martorell R. Anthropometric Standardization Reference Manual. Champaign,Illinois: Human Kinetics Books; 1988.
24. He H, Kong F, Tan J. DietCam: multiview food recognition using a multikernel SVM. IEEE Journal of Biomedical and Health Informatics. 2016;20(3):848-855.

96
APPENDIX 3 – RECRUITMENT FLYER

97

98
APPENDIX 4 – PHONE SCRIPT

99

100

101

102

103

104
APPENDIX 5 – CONSENT FORM

105

106

107

108

109

110
APPENDIX 6 – STUDY MEASURES

111
Date: __________________ Reference #: ____________
Anthropometric Measures
Height: __________ inches Weight: __________ pounds BMI: __________ kg/m2

112

113

114
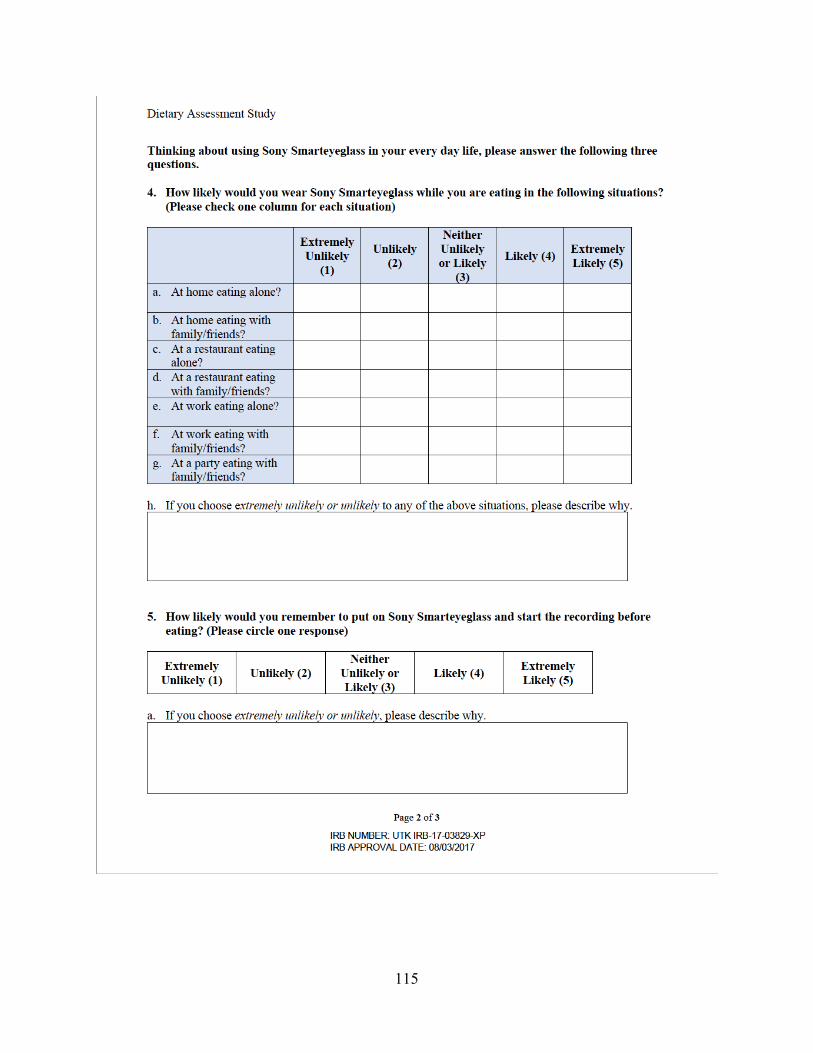
115

116

117
APPENDIX 7 – STUDY PROTOCOL

118
Dietary Assessment Study Procedures
Materials needed for the screening session:
• Dietary Assessment Study Checklist • Stamped consent forms (2) • Anthropometrics form (1)
o Calculator for BMI o Formula for BMI = [Pounds/ (Inches^2)] X 703
• Demographics form (1) • Appointment Reminder form • Pens
Before participant arrive:
1. Print out materials – under “Session1-SCREENING” folder of the Dietary Assessment Study (CEHHS Share à NTR-HEAL à Dietary Assessment Study à Session1-SCREENING)
2. Check the PTL (Dietary Assessment-PTL) to determine the participant’s scheduled screening session.
During the session:
1. Once the participant arrives for the appointment, escort him or her into the group room and close the door. Say the following:
Welcome to the Healthy Eating and Activity Laboratory. You are here today
because you indicated that you are interested in participating in the Dietary
Assessment Study. The purpose of this study is to investigate the accuracy of
a new dietary assessment method using images taken by Sony Smarteyeglass.
As you were told over the phone, this study will require three sessions; this
first screening sessions will take approximately 30 minutes and the remaining
two meal sessions will also take approximately 40 minutes. The meal sessions
will need to be scheduled between the hours 11am and 5pm, Monday-Friday.
These meal sessions will need to be completed within the next 4 weeks.
During this first session, I will describe the study to you and collect informed
consent. I will also take measurements of your height and weight. Lastly,

119
you will also be asked to complete questionnaires regarding your
demographics.
2. Say: We will first start with the informed consent.
a. Read through the consent form, making sure that he or she initials each page and
then signs the last page. Sign and keep this copy. Hand the participant the other
copy and have him or her initials each page and then signs the last page again.
Then, give the participant a copy for his or her records.
3. Say: Thank you for completing the informed consent. Now we will take your height
and weight measurements.
a. Next, take the participant’s height and weight measurements using the
stadiometer and scale located in the group room.
a. Formula for BMI = [Pounds/ (Inches^2)] X 703
4. àIf height and weight do not meet eligibility criteria (BMI between 18.5 and 24.9),
thank the participant for his or her interest in the study and escort him or her out of the
lab.
a. Say: Unfortunately, you do not meet the eligibility criteria required for this
study. We appreciate your interest in the Dietary Assessment Study. Let me
escort you out of the lab. Have a nice day.
5. IF ELIGIBILE: After confirming that the participant is eligible for the study based on
height and weight measurements, have the participant fill out the demographic form.
6. Then, scheduled the participant for his or her next in-lab session.
a. Say: I would like to schedule you for your next appointments. The
appointments can be scheduled between 11am and 5pm, Monday-Friday.

120
Will this same appointment day and time work over the next 2 sessions? If
not, what day and time are you available to meet next week?
(TRY TO SCHEDULE ALL TWO REMAINING SESSIONS)
7. After the appointment is scheduled, tell the participant that if anything changes to please
call the HEAL lab. Thank the participant for coming in for the first lab session and escort
the participant out of the lab.
a. Say: Your next appointment has been scheduled for _______. If you are
unable to keep this appointment for any reason, please call us at 974-0752.
We will reschedule your appointment at your earliest convenience. For the
next session, we ask that you please stop eating and only drink water 2 hours
before your appointment. For example, since your appointment is scheduled
at ____, we ask that you stop eating at ______. We look forward to seeing
you again on _____ (Hand the participant the appointment sheet). Let me
escort you out of the lab. Have a nice day.
After Session
• Update the PTL and Kiu will randomize participant to Meal Order 1 or 2.
• Meal Order 1 = Screening, Meal A, Meal B
• Meal Order 2 = Screening, Mean B, Meal A

121
Responsibilities prior to all meal sessions
• Clean cutting board, knives, containers, and serving plates *****Make sure everything is dry before using it*****
• Prepare each meal according to the preparation instructions for Meal A or B • Properly store each food ingredient:
Meal A: Room Temperature: Keep Refrigerated: Keep Frozen: Minuteâ Ready-to-serve Brown & Wild Rice
Nature’s Ownâ 100% whole wheat bread
Tysonâ Fully Cooked Chicken Breast Fillets:
Oscar Mayer Delifresh Smoked Turkey Breast
Food Clubâ Not Smoked Provolone Cheese
Tomato Lettuce Nabisco Chips Ahoy! Original Food Clubâ Classic Potato
Chips
Meal B: Room Temperature: Keep Refrigerated: Keep Frozen: Barilla Ready Pasta Fully Cooked Penne
OLE Mexican Foods High Fiber Low Carbs Tortilla
Food Clubâ Broccoli Spears
Oscar Mayer Delifresh Smoked Ham
Blue Bellâ Dutch Chocolate
Food Clubâ Mild Cheddar Cheese (Thin Sliced)
Spring Mix Food Clubâ Fat Free Ranch
Dressing
Raguâ Classic Alfredo Red seedless grapes
• Wear non-latex gloves • Remember: Always go by the number of grams

122
Materials for Sessions 2 and 3:
1. Checklist 2. Sony Smarteyeglass instructions 3. Dietary Recall instructions (Portion estimation) 4. Dietary Assessment Food Information and Weight Sheet 5. Pre-measured Meal A or Meal B 6. Google Calendar 7. Appointment Sheet 8. Participant’s Experience Questionnaires (ONLY FOR SESSION 2) 9. Compensation form (ONLY FOR SESSION 2)
Before participant arrives:
1. Determine the meal order and preparation methods required for the meal that participant
is to receive by referring to the “Order”, “Status”, and “Gender” columns in the Dietary
Assessment-PTL. You can access the PTL by opening the CEHHS Share à Dietary
Assessment Study à DietaryAssessment-PTL.
2. Weigh out the amount of food within +/-3 grams of each food. Based on the order
number and participant’s gender, prepare Meal A or Meal B according to the preparation
listed below. It is important to pay attention to the order number and participant’s
gender, and prepare the correct meal with correct amount. Meal preparation
instructions and presentations of each food are listed belo

123
Meal A
Foods: For Female Participant: Turkey & Provolone Cheese Sandwich
52g Whole Wheat Bread (~2 slices) 70g Turkey 23g Provolone Cheese (~1 slice) 50g Tomato Slices (Washed & Dried) 45g Lettuce (Washed & Dried)
Chicken and Wild Rice
98g Chicken (~1.5-2 chicken breast) 71 g Wild Rice
44 g Chocolate Cookie (~4 cookies) 39g Potato Chips 20 oz water
For Male Participant: Turkey & Provolone Cheese Sandwich
52g Whole Wheat Bread (~2 slices) 133g Turkey 23g Provolone Cheese (~1 slice) 50g Tomato Slices (Washed & Dried) 45g Lettuce (Washed & Dried)
Chicken and Wild Rice
98g Chicken (~1.5-2 chicken breast) 107 g Wild Rice
60.5g Chocolate Cookie (~5 ½ cookies) 52g Potato Chips 20 oz water
Other Materials:
• Weighing container (HEAL Plate with Yellow print on the edge) • Microwave plates • Paper towels • Serving plates (White Rectangular Plate) x 4 • Pens • Sandwich Sticks x 2 • 20 oz white plastic water cup
Instructions:
1. Set out measuring cups and measuring spoons, cutting board, chef knife, pen, oven mitts, weighing container, microwave plates, and Dietary Assessment Food Information and Weight Sheet.
2. Record the reference #. 3. Wash Tomato and Lettuce. *** Make sure they are dry before weighing! *** 4. Zero the scale and place the weighing container on the scale 5. Record the number of grams (at the container weight column on Dietary Assessment
Food Information and Weight Sheet) for the weighting container and zero the scale. 6. Weigh the first ingredient within +/- 3 grams and record the number of grams for each
ingredient in the Dietary Assessment Food Information and Weight Sheet. 7. Then, remove the weighing container with ingredient from the scale and zero the scale.
Put the weighing container with ingredient back to the scale and record the weight in Food + Container Pre- Weight Column on Dietary Assessment Food Information and Weight Sheet.

124
8. Repeat the step for the next ingredient until all ingredient are weighed. 9. Next, assemble each food:
a. Turkey & Provolone Cheese Sandwich
**You may have to cut one side of each slice of bread to make them weigh ~52g (+/- 3 grams) **
i. Place 1 slice of Nature’s Ownâ 100% whole wheat bread on the cutting board. Put pre-weighed Oscar Mayer Delifresh Smoked Turkey Breast, Food Clubâ Not Smoked Provolone Cheese, tomato slices, and lettuce on top of the bread. Place another slice of bread on the top. Cut finished sandwich in half diagonally. Stick one sandwich stick in the middle of each half of cut sandwich. *** Ensure the stick firmly hold everything together ***
ii. Presentation: Place cut sandwich on the white rectangular serving plate with all the ingredients facing up to the participant. (Ensure all the ingredients are shown clearly)
b. Chicken and Wild Rice i. Chicken
• Read the Tysonâ Fully Cooked Chicken Breast Fillets package. Follow the directions for the microwave heating option. Follow package’s directions and heat up 1 chicken breast [You might have to prepare an additional chicken breast, if 1 chicken breast is shy 95g]. *** For smaller chicken breast, heat up for 2 minutes ***
ii. Wild Rice • Read the Minuteâ Ready-to-serve Brown & Wild Rice package.
Follow the directions for the microwave heating options. Follow

125
package’s directions and heat up 1 package of rice.
ii. Weighing heated chicken and wild rice: • Place a weighing container on a scale and record the container
weight. Zero the scale and then measure the cooked chicken breast. Write down the cooked weight of chicken breast in the Dietary Assessment Food Information and Weight Sheet. Then, remove the weighing container with chicken breast from scale, and zero scale. Put the weighing container with chicken breast on scale and record the weigh on Food + Container Pre-weight column.
• Follow the same procedure for weighing the heated wild rice. Weigh 71g cooked rice for female participant or 107g cooked rice for male participant (within +/- 3 grams)
iii. Presentation: Cut chicken breast into strips (~1-inch-wide), and plate on the left side of the white rectangular serving plate (different than the one for sandwich). Then, place wild rice on the right side of the plate.
** You may have to re-heat the chicken & wild rice dish before serving to participants**
c. Chocolate Chip Cookie: i. Presentation: Place pre-measured cookies in the middle of a white
rectangular serving plate
d. Potato Chips: i. Presentation: Place pre-measured potato chips in the middle of a white
rectangular serving plate (different plate than the one for the cookie)
e. 20 oz water: i. Provide a cup of 20 oz water to participant using a white 20 oz plastic cup

126
Presentation of each food in Meal A:
1. Turkey & Provolone Cheese Sandwich a. Place cut sandwich on a white rectangular serving plate with all the ingredients
facing up to the participant. (Ensure all the ingredients are shown clearly) 2. Chicken and Wild Rice
a. Plate cut chicken breast on the left side of the white rectangular serving plate (different than the one for sandwich). Then, place wild rice on the right side of the plate.
3. Chocolate Chip Cookie a. Place the cookie in the middle of a white rectangular serving plate.
4. Potato Chips a. Place potato chips in the middle of a white rectangular serving plate (different
plate than the one for the cookie). 5. Provide a cup of 20 oz water to participant

127
Meal B Materials Foods: For Female Participant: Ham and Cheddar Cheese Wrap
45g Tortilla (~1 tortilla) 76g Ham Deli 21g Cheddar Cheese (~2 slices) 36g Spring Mix 29g FF Ranch Dressing
Pasta with Broccoli and Alfredo Sauce
91g Pasta 66g Broccoli 38g Alfredo Sauce
107 g Chocolate Ice-cream 365g Red Seedless Grapes (remove from stem, washed & dried) 20 oz water
For Male Participant: Ham and Cheddar Cheese Wrap
45g Tortilla (~1 tortilla) 103g Ham Deli 32g Cheddar Cheese (~3 slices) 36g Spring Mix 29g FF Ranch Dressing
Pasta with Broccoli and Alfredo Sauce
121g Pasta 66g Broccoli 50g Alfredo Sauce
138g Chocolate Ice-Cream 471g Red Seedless Grapes (remove from stem, washed & dried) 20 oz water
Other Materials:
• Weighing container (HEAL Plate with Yellow print on the edge) • Microwave plates • Paper towels • Serving plates (White Rectangular Plate) x 4 • Pens • Sandwich Sticks x 2 • 20 oz white plastic water cup
Instructions:
1. Set out measuring cups and measuring spoons, cutting board, chef knife, pen, oven mitts, weighing container, microwave plates, and Dietary Assessment Food Information and Weight Sheet.
2. Record the reference #. 3. Wash Grapes. *** Make sure they are dry before weighing! *** 4. Place a serving plate in the freezer (For later use to plate ice-cream) 5. Zero the scale and place the weighing container on the scale. 6. Record the number of grams (at the container weight column on Dietary Assessment
Food Information and Weight Sheet) for the weighting container and zero the scale.

128
7. Weigh the first ingredient within +/- 3 grams and record the number of grams for each ingredient in the Dietary Assessment Food Information and Weight Sheet.
8. Then, remove the weighing container with ingredient from the scale and zero the scale. Put the weighing container with ingredient back to the scale, and record the weight in Food + Container Pre- Weight Column on Dietary Assessment Food Information and Weight Sheet.
9. Repeat the step for the next ingredient until all ingredient are weighed. 10. Next, assemble each food:
a. Ham and Cheddar Cheese Wrap i. Place 1 OLE Mexican Foods High Fiber Low Carbs Tortilla on cutting
board. Spread pre-measured Food Clubâ Fat Free Ranch Dressing on the tortilla. Nicely layer the following ingredient on the torilla: Oscar Mayer Delifresh Smoked Ham, Food Clubâ Mild Cheddar Cheese (Thin Sliced), and Fresh Spring Mix. [It is important to make sure you carefully layout all the ingredients, so that when you cut the wrap, all the ingredients will show clearly.] Carefully roll the tortilla wrap with all the ingredients into a wrap. Place 2x sandwich sticks in the wrap (one on the center of each side). Cut the wrap diagonally. ** Ensure all ingredients are tightly hold by the sandwich sticks**
ii. Presentation: Place the sliced on a white rectangular serving plate with all the ingredients facing up to the participant (Ensure all the ingredients are shown clearly)
b. Pasta with Broccoli and Alfredo Sauce i. Read the Barilla Ready Pasta Fully Cooked Penne package. Follow the
directions for the microwave heating option. Follow package’s directions and heat up pasta.
ii. While the pasta is in microwave, remove the Food Clubâ Broccoli Spears from freezer. Follow the directions for the microwave heating option. Follow package’s directions and heat up pre-measured broccoli.
iii. Remove the HOT pasta and broccoli from the microwaves and carefully place both containers on the counter (use oven mitts if necessary!)
iv. Place a weighing container on a scale and record the container weight. Zero the scale and then measure the cooked pasta. Write down the cooked weight of pasta in the Dietary Assessment Food Information and Weight

129
Sheet. Then, remove the weighing container with pasta from scale, and zero scale. Put the weighing container with pasta on scale and record the weigh on Food + Container Pre-weight column.
iii. Follow the same procedure for weighing the heated broccoli. v. Once you record the weight, pour cooked pasta and broccoli together to a
same plate, and add pre-measured Alfredo sauce. Mix up sauce, broccoli and pasta.
vi. Presentation: Place the mixed pasta dish (Paste + broccoli + Alfredo sauce) on a white rectangular serving plate (different than the one for wrap).
** You may have to re-heat the pasta dish before serving to participants**
c. Red Seedless Grapes i. Pre-measure Red Seedless Grapes: 365g for female participant and 471g
for male participant ii. Presentation: Plate grapes in the serving plate.
d. Chocolate Ice-cream
*** DO ALL THIS RIGHT BEFORE SERVING TO PARTICIPANTS***
i. Measure Blue Bellâ Dutch Chocolate ice-cream: 107g for female participant and 138g for male participant
i. Presentation: Take out the serving plate from freezer. Plate the scooped ice-cream in the center of white rectangular serving plate (different plate then the one for grapes). Immediately serve to participant!
e. 20 oz water: i. Provide a cup of 20 oz water to participant using a white 20 oz plastic cup

130
Presentation of each food in Meal B:
11. Ham and Cheddar Cheese Wrap a. Place the sliced (diagonal) on a white rectangular serving plate with all the
ingredients facing up to the participant (Ensure all the ingredients are shown clearly)
12. Pasta with Broccoli in Alfredo Sauce a. Place the mixed pasta dish (Paste + broccoli + Alfredo sauce), with the broccoli
mixed into the pasta, on a white rectangular serving plate (different than the one for wrap) with all the ingredients clearly shown
13. Red Seedless Grapes a. Plate the red seedless grapes on a white rectangular serving plate
14. Chocolate Ice-cream a. Plate the scooped ice-cream on a white rectangular serving plate (different plate
then the one for grapes) 15. Provide a cup of 20 oz water to participant
** Plate arrangement – same as Meal A (Refer to Meal A presentation picture on Page 9) **

131
During the session:
1. Once the participant arrives for the appointment, escort the participant into the group
room and close the door.
2. Say: Thank you for coming in today!
3. Ask the participant if he or she is feeling ill today and check about if participant has eaten
within past 2 hours.
4. If the participant is feeling ill or ate within the past 2 hours, inform the participant that we
will need to reschedule the appointment for a later time. ENTER into PTL!
5. If the participant is not feeling ill or has eaten the past 2 hours continue with the
appointment.
a. Say: You are here today for your _______ (first or second) meal session
appointment in the Dietary Assessment via Digital Images study. This
session should take approximately 40 minutes. During this session, I will
first go through the instructions on how to use Sony Smarteyeglass when you
are eating. You will follow these instructions to consume each food while you
are eating
b. Go through the Instructions to use Sony Smarteyeglass during meal session and
provide the instruction paper to participant.
c. Say: Please follow the provided instructions (Point to the instruction paper)
to consume the meal. You will have 30 minutes to consume the foods as it is
presented to you. Eat as much or as little of the meal as you want, but please
at least taste each food provided. You will also be given 20 fluid ounces of
water; we ask that you do not consume any other foods or beverage other

132
than provided during this session. I will check to see how you are doing
every 10 minutes.
d. Say: I will now bring your meal. Please put on Sony Smarteyeglass now and
follow the instruction to start the digital recording.
e. Ask participant if he/she see the frame number on the screen is increasing.
f. If no, ask participant to follow the instruction to start the digital recording.
g. If yes, continue:
§ Put the first plate on the table in front of participant, ask participant to
follow the instruction to look at the food. When participant is done
looking at the first plate, move to the next plate until participant finished
looking at all four foods.
§ After participant finished looking all four plates, arrange the plates into the
plate arrangement (Refer to Page 9). Ask participant to hold first food with
hand or fork and look at the food for 5 seconds about 12 inches in front of
Sony Smarteyeglass. When participant is done with the first food, ask the
participant to follow the same procedure (provided in the instruction) for
the rest of the foods.
6. Leave the room for participant to eat the meal and check with participant every 10
minutes. Set a timer for 10 minutes.
7. After 10 minutes, knock on the door and check on participant.
a. Say: Hello. How is everything going? You have about 20 minutes left.
8. After 20 minutes, knock on the door and check on participant.
a. Say: Hello. How is everything going? You have about 10 minutes left.
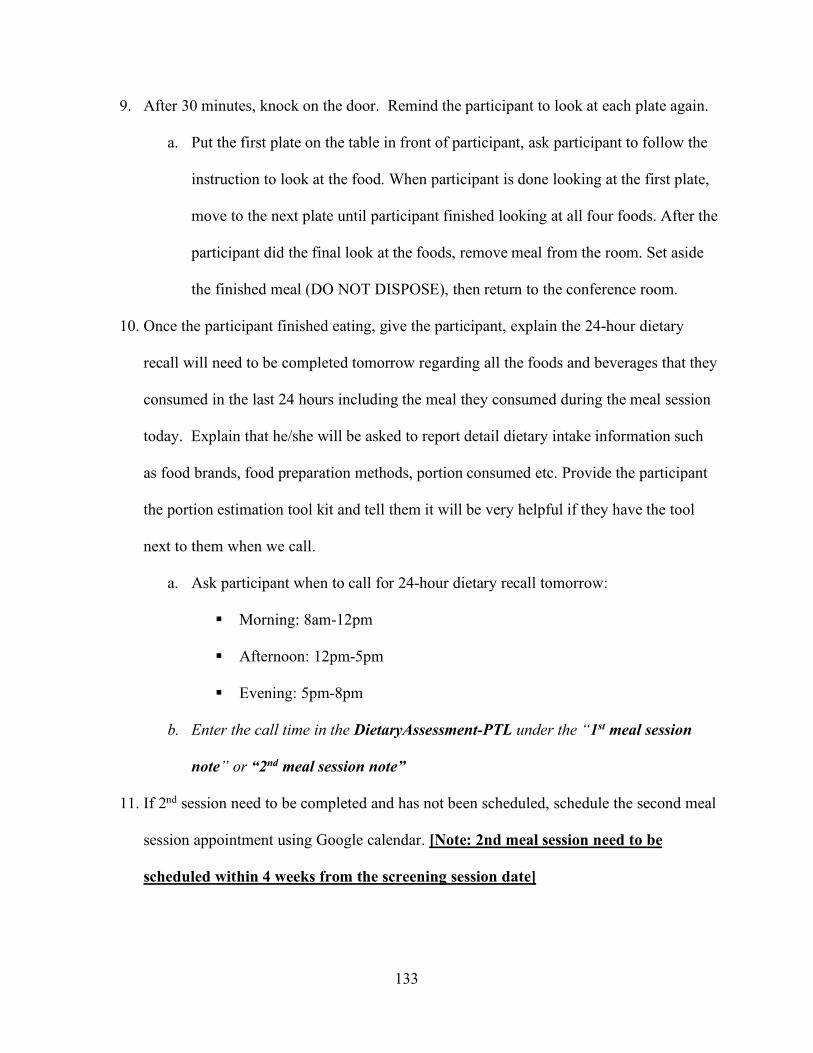
133
9. After 30 minutes, knock on the door. Remind the participant to look at each plate again.
a. Put the first plate on the table in front of participant, ask participant to follow the
instruction to look at the food. When participant is done looking at the first plate,
move to the next plate until participant finished looking at all four foods. After the
participant did the final look at the foods, remove meal from the room. Set aside
the finished meal (DO NOT DISPOSE), then return to the conference room.
10. Once the participant finished eating, give the participant, explain the 24-hour dietary
recall will need to be completed tomorrow regarding all the foods and beverages that they
consumed in the last 24 hours including the meal they consumed during the meal session
today. Explain that he/she will be asked to report detail dietary intake information such
as food brands, food preparation methods, portion consumed etc. Provide the participant
the portion estimation tool kit and tell them it will be very helpful if they have the tool
next to them when we call.
a. Ask participant when to call for 24-hour dietary recall tomorrow:
§ Morning: 8am-12pm
§ Afternoon: 12pm-5pm
§ Evening: 5pm-8pm
b. Enter the call time in the DietaryAssessment-PTL under the “1st meal session
note” or “2nd meal session note”
11. If 2nd session need to be completed and has not been scheduled, schedule the second meal
session appointment using Google calendar. [Note: 2nd meal session need to be
scheduled within 4 weeks from the screening session date]

134
a. Say: Now, I would like to confirm (schedule) you for your next appointment.
The appointment can be scheduled between 11am and 5pm, Monday-Friday.
What day and time are you available to meet next week?
b. Your appointment has been scheduled for _________ (hand participant
appointment sheet). If you are unable to keep this appointment for any
reason, please call us at 974-0752. We will reschedule your appointment at
your earliest convenience. Thank you for participating in the first session of
the Dietary Assessment via Digital Images. Additionally, we ask that you stop
eating 2 hours before your scheduled appointment time. For example, since
your appointment is scheduled at _____, we ask that you stop eating at
______. We look forward to seeing you again on _____. Let me escort you out
of the lab. Have a nice day.
c. if scheduled, update PTL
12. [AT THE END OF 2ND MEAL SESSION]
a. Ask participant to complete the Participant’s Experience Questionnaire (you can
find it under CEHHS Shares Drive à NTR HEAL à Dietary Assessment
Study à Session3-Meal SESSION2 à Participants Experience Questionnaire)
b. After participant completed questionnaire:
§ Say: You have now completed the last session. Thank you for
participating in the Dietary Assessment via Digital Images Study. You
will receive a $20 gift card via mail after you completed the 24-hour
dietary recall. Please sign this form indicating you will receive the $20
gift card after you completed the second 24-hour dietary recall. We

135
appreciate your time in taking part in this study. Let me escort you
out of the lab.
After the Session:
1. Record the weight of weighing container (HEAL plate with yellow print on the edge) in
the 2nd “Container weight (g)” column.
2. Then zero scale, weight each food and ingredient again. For mixed foods, separate all the
ingredients and scrape off each ingredient as much as possible. Record the weight of each
ingredient on “Food Weight Post (g)”.
3. Then, zero scale again, weight each ingredient with container and then record the weight
in the “Food + Container Weight Post (g)” column.
4. Then, calculate the change in weight by subtracting the post-weight measurement from
the pre-weight measurement. (i.e. Weight Change = “Food Weight Post (g)” - “Food
Weight Pre (g)”) Put the difference between these two values in the last column labeled
“Weight Change.”
5. Update the PTL indicating the participant completed the session and make any notes
about the session in the “Notes” column.
6. Place all session materials in the appropriate place.

136
APPENDIX 8 – SONY SMARTEYEGLASS INSTRUCTION

137
Instructions to Use Sony Smarteyeglass during Meal Sessions 1. When you see the home screen of the Sony Smarteyeglass (in green words with date and
time, battery percentage), using your finger to swipe to the right on the controller (on the
arch) to go to “Sample Camera.
Home Screen of Sony Smarteyeglass:
Use your finger to swipe to right on the arch of controller (show in red arrow).
2. Once you see “Sample Camera”, tap the controller (on the arch) to choose the app.

138
3. When the researcher instructs you to start the JPEG Stream, tap the controller (on the
arch) to initiate the recording. When it is recording, the display will show “JPEG
Streaming” and the frame number will be increasing.
Follow the following instructions to eat:
4. Before eating, please look at each provided food.
a. Please look at first provided plate at ~12 inches away from the plate for
approximately 5 seconds. (Look at one food and slowly and silently count to 5.)
**Make sure you locate the green words in the center of the foods that you are recording**
b. Turn your head toward your left shoulder, look at the first food from the left side
at ~12 inches away from the plate for another 5 seconds.
c. Turn your head toward your right shoulder, look at the first food from the right
side at ~12 inches away from the plate for another 5 seconds.
d. Then, move to the next plate and do the same, and continue to each food until you
have looked at all four foods.
5. After you looked at each provided food, take one bite of each provided food.
6. For the first bite of each food, hold the food approximately 12 inches in front of the
Sony Smarteyeglass and to look at the food, either in your hand or on a fork or spoon
(depending on the food).
7. Following taking the first bite of each provided food, eat normally until you are
satisfied. You will be given 30 minutes to complete the meal. Researcher will leave the

139
room while you are eating, and he/she will check in with you every 10 minutes to see if
you are completed with the meal or if you need anything.
8. When you are done eating, look at each provided plate for 5 seconds in the exact same
way you did at the start of the meal for all four foods
9. Once you completed looking at all four foods, tap the controller (on the arch) to stop
recording.

140
VITA
Tsz-Kiu Chui (Kiu) was born and raised in Hong Kong. In 2008, she came to the United
States to pursue a bachelor’s degree, and she graduated from the University of Illinois at Urbana-
Champaign with a Bachelor of Science in Dietetics in 2013. Upon completion, she started her
Dietetic Internship at Meredith College. After she became a registered dietitian in 2014, Kiu
worked as a Clinical Dietitian at Aiken Regional Medical Center for a year and then moved back
to Hong Kong to work as a Registered Dietitian at a primary care clinic. In August 2016, Kiu
moved to Knoxville to pursue graduate degree of Master of Science in Public Health Nutrition at
the University of Tennessee, Knoxville.
As a graduate student, Kiu worked in the Healthy Eating and Activity Laboratory, where
she developed passion for nutrition research and expanded her skills in research under the
direction of Dr. Hollie Raynor. Additionally, she developed skills in pediatric and adult weight
management while involved in different projects in the lab. After graduation, Kiu hopes to find a
job in research area to continue her passion for nutrition research.