Validation Report 12 - EURL | Pesticides12) Appendix 6 Validering... · EURL for Cereals and...
19
EURL for Cereals and Feeding stuff National Food Institute Technical University of Denmark Validation Report 12 Determination of pesticide residues in hay by LC-MS/MS and GC-MS/MS (QuEChERS method) Mette Erecius Poulsen December 2012
Transcript of Validation Report 12 - EURL | Pesticides12) Appendix 6 Validering... · EURL for Cereals and...

EURL for Cereals and Feeding stuff National Food Institute Technical University of Denmark
Validation Report 12
Determination of pesticide residues in hay by LC-MS/MS and GC-MS/MS
(QuEChERS method)
Mette Erecius Poulsen
December 2012
mpou
Typewritten Text
Appendix 6

Page 2 of 19
DTU, National Food Institute
CONTENT:
1. Introduction ................................................................................................................................ 3
2. Principle of analysis .................................................................................................................... 3
3. Validation design ........................................................................................................................ 4
4. Chromatograms and calibration curves....................................................................................... 4
5. Validation parameters ................................................................................................................. 7
6. Criteria for the acceptance of validation results .......................................................................... 7
7. Results and discussion ................................................................................................................. 7
8. Conclusions................................................................................................................................. 8
9. References ................................................................................................................................... 8
Appendix 1. MRM transitions for the validated pesticides analysed by LC/MS/MS. ......................... 9
Appendix 2. MRM transitions for the validated pesticides analysed by GC/MS/MS ....................... 11
Appendix 3. Recoveries, repeatability (RSDr) and Limit of Quantification (LOQs) for pesticides validated on Hay. .......................................................................................................................... 14
Appendix 4: Principles of the QuEChERS method for cereal extraction ........................................ 19

Page 3 of 19
DTU, National Food Institute
1. Introduction This report describes the validation of the QuEChERS method combined with LC-MS/MS and GC-
MS/MS. The method was validated for 75 pesticides and degradation products in hay matrix.
The QuEChERS method has an extraction and clean-up step, which has been developed to be
Quick, Easy, Cheap, Efficient, Rugged and Safe. The method is most commonly used on fruit,
vegetables and cereals1. The method were slightly modified due to the dry texture of the hay.
2. Principle of analysis Sample preparation: The hay samples was is grinded on a cutting Mill SM 2000 from Retsch
equipped with a sieve at 1 mm (see foto below).
Extraction: One gram of sample was added 10 ml of water and left for 30 min. Then the samples
were added ml acetonitril and the samples was shaken. Salt and buffer mixture was added and the
sample was shaken again.
Clean-up: After centrifugation the supernatant was transferred to a tube with PSA and MgSO4.
After shaking and an additional centrifugation step the final extract is diluted 1:1 with acetonitrile to
obtain the same matrix concentration as in the calibration standards. For the LC-MS/MS analysis
the extraction is followed by adding internal standard and the extract is filtered into HPLC vials.
Quantification and qualification:
LC-MS/MS: The pesticide residues are separated on a reversed-phase column and detected by
tandem mass spectrometry (MS/MS) by electrospray (ESI). The validation includes pesticides
determined with both positive and negative ESI. 13C6-carbaryl was used as internal standard for
quantification. All pesticides were detected in the multiple reaction monitoring mode (MRM). For
each pesticide precursor ion and 2 product ions were determined. One product ion for quantification
and one for qualification. The MRM transitions for the pesticides and degradation products sought
validated are given in Appendix 1.
GC/MS/MS: The pesticide residues are separated on a DB5-MS column and detected by tandem
mass spectrometry (MS/MS) operating with electron energy at 70 eV, source temperature at 180°C
and transfer line at 250°C. The injection volume was 4 µl. All pesticides were detected in the
multiple reaction monitoring mode (MRM). For each pesticide two transistion were determined.
One for quantification and one for qualification. The MRM transitions for the pesticides and
degradation products are given in Appendix 1.

Page 4 of 19
DTU, National Food Institute
3. Validation design The method was south validated for 93 pesticides or degradation products in hay. The validation
was performed on 5-6 replicates on each cereals commodity at each of the three spiking levels;
0.01, 0.02 and 0.1 mg/kg. A blank sample of hay was included.
4. Chromatograms and calibration curves The calibration curve is determined by the analysis of each of the analysts at at least 4 calibration
levels, i.e. 0.003, 0.01, 0.033 and 0.1 µg/ml. The calibration curves were best fitted to linear curves.
The quantification was performed from the mean of two bracketing calibration curves. The majority
of the correlation coefficients (R) were higher or equal to 0.99. Examples of chromatograms
obtained when analysing the extracts by LC-MS/MS and GC-MS/MS are presented in Figure 1.
Examples of calibration curves are presented in Figure 2.

Page 5 of 19
DTU, National Food Institute
min13.00 13.50 14.00 14.50 15.00 15.50 16.00 16.50
%
-0
100
F3:MRM of 9 channels,ES+239>182.3
130306_30_Straw Smooth(SG,1x2) 17. Spk. 0,020 ppm Halm C
2.331e+004Pirimicarb
14.18
min
%
-0
100
F3:MRM of 9 channels,ES+239 > 72.1
130306_30_Straw Smooth(SG,1x2) 17. Spk. 0,020 ppm Halm C
3.160e+004Pirimicarb
14.18
min28.60 28.80 29.00 29.20 29.40 29.60 29.80 30.00 30.20 30.40
%
50
F18:MRM of 8 channels,EI+388>345
130306st21 Smooth(Mn,2x2) Valid. halm spk. m. samstik A 0.05 ppm C 1:1 ACN
2.577e+003Azoxystrobin
29.72
29.3728.4828.73
29.1829.07
30.08
30.4630.36
min
%
39
F18:MRM of 8 channels,EI+344>329
130306st21 Smooth(Mn,2x2) Valid. halm spk. m. samstik A 0.05 ppm C 1:1 ACN
4.237e+003Azoxystrobin
29.72
29.4928.8228.6528.50 29.3429.2129.04
30.1129.97 30.25 30.48
Figure 1: Examples of chromatograms for pirimicarb 0.02 mg/kg on LC-MS/MS and azoxystrobin 0.05 mg/kg on GC-MS/MS (two MRM transitions are shown for each pesticide).

Page 6 of 19
DTU, National Food Institute
Compound name: PirimicarbCorrelation coefficient: r = 0.995698, r^2 = 0.991414Calibration curve: 1579.34 * x + 0.492158Response type: Internal Std ( Ref 1 ), Height * ( IS Conc. / IS Height )Curve type: Linear, Origin: Include, Weighting: 1/x, Axis trans: None
Conc-0.00 0.10 0.20 0.30 0.40 0.50 0.60 0.70 0.80 0.90 1.00
Res
pons
e
-0
200
400
600
800
1000
1200
1400
1600
Compound name: AzoxystrobinCorrelation coefficient: r = 0.990753, r^2 = 0.981592Calibration curve: 102134 * x + 146.548Response type: External Std, AreaCurve type: Linear, Origin: Exclude, Weighting: 1/x, Axis trans: None
ug/ml0.010 0.020 0.030 0.040 0.050 0.060 0.070 0.080 0.090 0.100
Res
pons
e
-0
2000
4000
6000
8000
10000
Figure 2. Examples of calibration curves for pirimicarb (LC-MS/MS, concentrations from 0.003-1.0 µg/ml) and azoxystrobin (GC-MS/MS, concentrations from 0.003-0.1 µg/ml) .

Page 7 of 19
DTU, National Food Institute
5. Validation parameters Precision – repeatability
Repeatability was calculated for all pesticides and degradation products on all three spiking levels.
Repeatability is given as the relative standard deviation on the result from two or more analysis at
the same sample, done by the same technician, on the same instrument and within a short period of
time. Repeatability in this validation was calculated from the 5-6 replicate determinations.
Repeatability were calculated as given in ISO 5725-22.
Appendix 3 shows the relative repeatability for the validated pesticides and degradation products.
Accuracy – Recovery The accuracy was determined by recovery, samples were spiked at three concentration levels. In
appendix 2 and 3 recovery, repeatability and limit of quantification (LOQ) are given for the
validated pesticides, isomers and degradation products for all three spiking levels (0.01 mg/kg, 0.02
mg/kg and 0.1 mg/kg). Recoveries is listed in Appendix 3.
Robustness
The QuEChERS method has earlier by Anastassiades et al. 20031 in connection with the
development of the method been shown to be robust.
Limit of quantification, LOQ
Quantification limits (LOQ) are calculated from the results at the lowest accepted spike level, as 6
times the standard deviation (absolute recovery). The quantification limits are given in Appendix 3.
6. Criteria for the acceptance of validation results
For the pesticides to be accepted as validated the following criteria for precision and trueness must
to be fulfilled:
1. The relative standard deviation of the repeatability must be less than or equal to the standard
deviation proposed by Horwitz3.
2. The average relative recovery must be between 70 and 120%4.
If the above mentioned criteria have been meet, the detection limits have been calculated.
7. Results and discussion The method was sought validated for 94 compound. Two different detection system was used,
LC/MS/MS and GC/MS/MS. In general, the compounds analysed on LC/MS/MS could be detected

Page 8 of 19
DTU, National Food Institute
at all three spike levels, while it was the case for only one fifth of the compounds measured on
GC/MS/MS. Ten compounds were measured on both LC/MS/MS and GC/MS/MS and for these
compound the results from LC/MS/MS was better and more pesticide were validated. Some of the
compound measured on the GC/MS/MS can be analysed on LC/MS/MS but were analysed on
GC/MS/MS for historical reasons. Furthermore, a more sensitive GC system would allow more
pesticides.
In total, 76 compounds were validated, 47 at all spike levels, 67 at the two highest spike level and
76 at the highest level. The relative repeatability (RSDr) varied between 2-31 %, however most of
the values were below 20%. For the majority of the pesticides the recovery was in the range of 70-
110% at all three concentration levels. But in general the recoveries for cycloxydim was low for all
commodities. The LOQs were in the range of 0.01-0.15 mg/kg.
The results for the pesticides are listed in Appendix 3.
8. Conclusions In conclusion, 76 pesticides and degradation products were validated on hay matrice for the
QuEChERS method using LC-MS/MS and GC-MS/MS for the detection.
9. References 1 http://www.quechers.com/ or Anastassiades et al., J. AOAC Int., vol. 86, no. 2, p. 412, 2003
2 ISO 5725-2:1994. Accuracy (trueness and precision) of measurement methods and results – Part2.
Basic method for the determination of repeatability and reproducibility of standard measurement
method. First edition. December 1994.
3 W. Horwitz, Anal. Chem., 1982; 54, 67A.
4 Method Validation and Quality Control Procedures for Pesticide Residue Analysis in Food and
Feed, Document No SANCO/10684/2010, 01/01/2010, European Commission, Brussels, 2010.
5 EU Pesticides database available at http://ec.europa.eu/sanco_pesticides/public/index.cfm

Page 9 of 19
DTU, National Food Institute
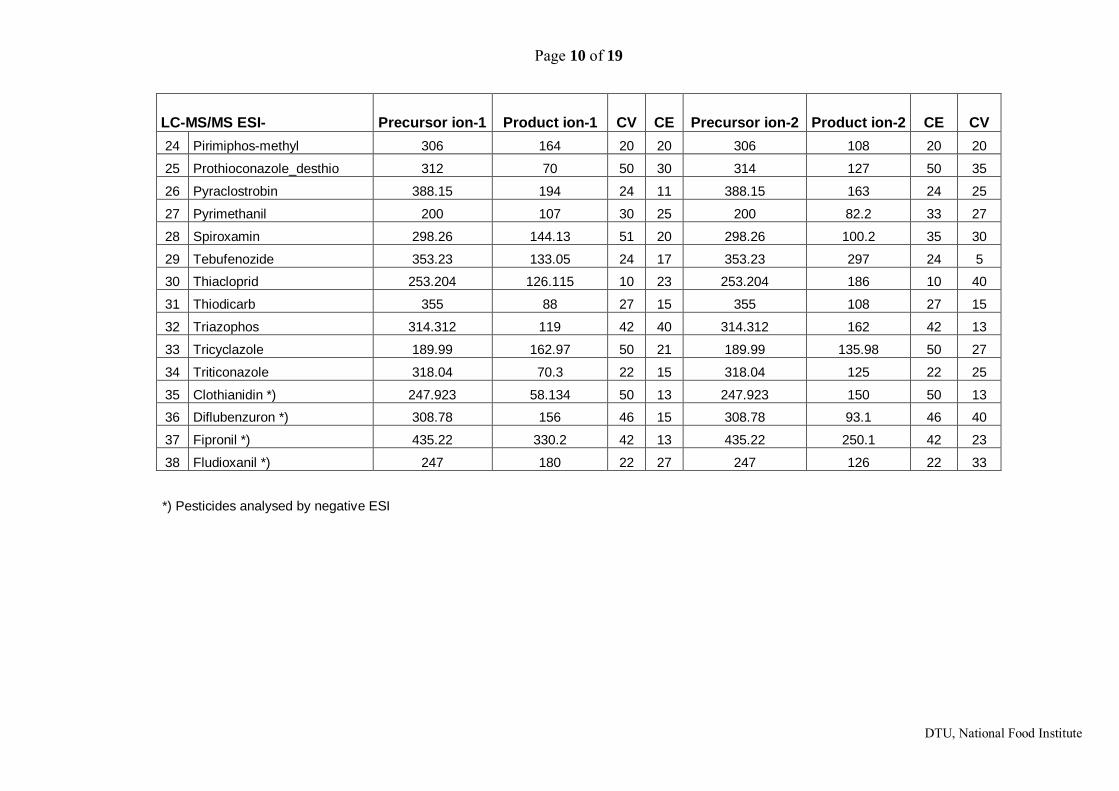
Appendix 1. MRM transitions for the validated pesticides analysed by LC/MS/MS.
LC-MS/MS ESI- Precursor ion-1 Product ion-1 CV CE Precursor ion-2 Product ion-2 CE CV 1 3-Hydroxy carbofuran 255.3 163 30 13 255.3 107.2 30 25
2 Acephat 183.78 143.01 30 8 183.78 125 30 20
3 Carbaryl 219.3 145.27 29 13 219.3 127.2 29 37
4 Cyprodinil 226 93.2 16 33 226 77.2 16 40
5 Dementon-S-methyl sulfoxid 247 169 33 10 247 127 18 25
6 Demeton-S-methyl sulfon 263 169 55 15 263 127 45 28
7 Epoxiconazol 330.11 121.1 45 23 330.11 91.2 45 41
8 Fenhexamid 302.28 97.3 30 21 302.28 55.5 30 40
9 Flusilazole 316.17 247.1 20 17 316.17 165.1 51 20
10 Imazalil 297.4 159.2 29 21 297.4 201.2 29 20
11 Imidacloprid 256 209 21 15 256 175 20 20
12 Isoproturon 207.07 72.2 38 23 207.07 165.2 17 13
13 Kresoxim-methyl 314 116 30 30 314 131 30 20
14 Linuron 249.24 160.2 21 21 249.24 182.2 21 13
15 Malaoxon 315 127 48 10 315 99.1 33 21
16 Methacrifos 258.09 209 17 11 258.09 125 21 25
17 Methomyl 163.15 106.2 29 13 163.15 88.3 29 5
18 Metribuzin 215.06 187.1 52 23 215.06 84.3 21 20
19 Omethoat 214 183 10 11 214 143 10 17
20 Paclobutrazole 294.3 70.2 20 31 294.3 125.2 20 31
21 Pendimethalin 282.12 212 33 10 282.12 194 33 10
22 Pirimicarb 239 72.1 25 16 239 182.3 25 14
23 Pirimicarb-desmethyl 225.11 72.3 22 21 225.11 168.1 22 15
Page 10 of 19
DTU, National Food Institute
LC-MS/MS ESI- Precursor ion-1 Product ion-1 CV CE Precursor ion-2 Product ion-2 CE CV 24 Pirimiphos-methyl 306 164 20 20 306 108 20 20
25 Prothioconazole_desthio 312 70 50 30 314 127 50 35
26 Pyraclostrobin 388.15 194 24 11 388.15 163 24 25
27 Pyrimethanil 200 107 30 25 200 82.2 33 27
28 Spiroxamin 298.26 144.13 51 20 298.26 100.2 35 30
29 Tebufenozide 353.23 133.05 24 17 353.23 297 24 5
30 Thiacloprid 253.204 126.115 10 23 253.204 186 10 40
31 Thiodicarb 355 88 27 15 355 108 27 15
32 Triazophos 314.312 119 42 40 314.312 162 42 13
33 Tricyclazole 189.99 162.97 50 21 189.99 135.98 50 27
34 Triticonazole 318.04 70.3 22 15 318.04 125 22 25
35 Clothianidin *) 247.923 58.134 50 13 247.923 150 50 13
36 Diflubenzuron *) 308.78 156 46 15 308.78 93.1 46 40
37 Fipronil *) 435.22 330.2 42 13 435.22 250.1 42 23
38 Fludioxanil *) 247 180 22 27 247 126 22 33
*) Pesticides analysed by negative ESI

Page 11 of 19
DTU, National Food Institute
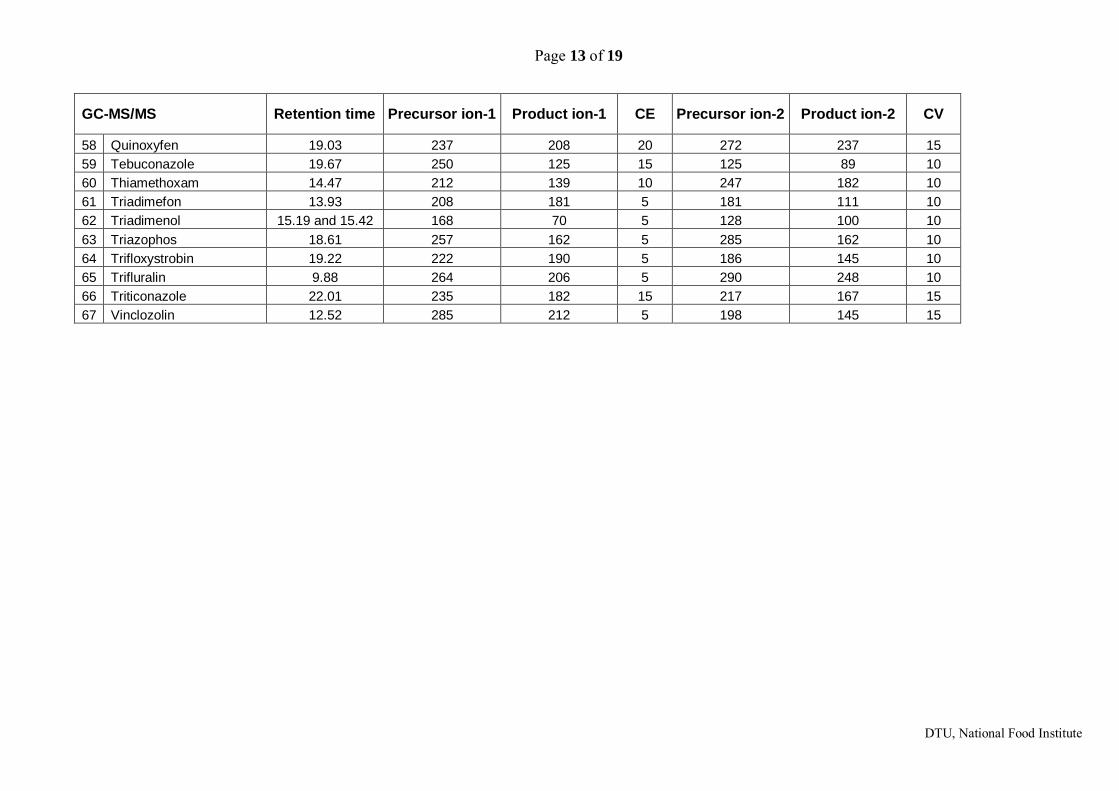
Appendix 2. MRM transitions for the validated pesticides analysed by GC/MS/MS
GC-MS/MS Retention time Precursor ion-1 Product ion-1 CE Precursor ion-2 Product ion-2 CV
1 2-Phenylphenol 8.76 141 115 15 170 169 20 2 Azinphos-methyl 22.16 160 77 15 132 77 10 3 Azoxystrobin 29.75 344 329 15 388 345 15 4 Bifenthrin 20.92 181 166 10 165 115 20 5 Boscalid 26 342 140 15 167 139 20 6 Captan 15.11 149 70 12 149 105 2 7 Carbofuran 7.34 149 121 5 164 149 10 8 Carboxin 16.96 235 143 5 143 87 5 9 Chlorfenvinphos
323 267 15 295 267 5
10 Chlorothalonil 11.8 266 133 18 266 231 10 11 Chlorpropham 9.79 213 127 15 213 171 5 12 Chlorpyrifos 13.82 197 169 10 314 258 12 13 Chlorpyrifos-methyl 12.53 286 93 20 125 79 5 14 Cyfluthrin 25.46 226 206 10 163 91 10 15 Cypermethrin 25.86 163 127 10 181 152 20 16 Cyproconazole 17.41 222 125 15 139 111 15 17 Cyprodinil 14.61 226 225 15 223 208 15 18 Deltamethrin 28.61 and 29.04 181 152 10 253 174 10 19 Diazinon 11.27 304 179 10 276 179 10 20 Dichlorvos 7.02 109 79 5 187 93 10 21 Difenoconazole 28.38 and 28.52 323 265 15 325 267 15 22 Dimethoate 10.67 229 87 7 125 79 6 23 Endosulfan-alpha 19.09 195 159 5 339 159 20 24 Endosulfan-beta 15.89 195 159 5 339 159 20 25 Endosulfan-sulfate 17.74 272 236 20 387 252 10 26 Epoxiconazole 20.26 192 138 10 206 165 5 27 Ethion 18.07 384 231 5 231 203 15

Page 12 of 19
DTU, National Food Institute
GC-MS/MS Retention time Precursor ion-1 Product ion-1 CE Precursor ion-2 Product ion-2 CV
28 Fenbuconazole 25.31 198 129 10 129 102 15 29 Fenitrothion 13.27 277 260 5 277 109 15 30 Fenpropidin 12.96 98 70 10 99 71 10 31 Fenpropimorph 13.9 303 128 5 117 115 10 32 Fenvalerate 27.56 and 27.96 167 125 10 125 99 10 33 Fipronil 15.21 367 213 20 367 255 15 34 Fluquinconazole 24.59 420 351 10 351 255 15 35 Flutriafol 16.15 383 255 20 255 228 10 36 HCH, -alpha 10.41 217 181 5 181 145 15 37 HCH, -beta 11.11 218 182.5 5 147 147 10 38 Hexaconazole 16.33 231 175 10 214 172 15 39 Iprodione 20.63 314 245 10 216 187 5 40 Isoprothiolane 16.47 290 118 10 290 204 2 41 Kresoxim-methyl 17.12 206 116 4 206 131 10 42 Lambda-cyhalothrin 22.44 and 22.81 197 141 10 208 181 10 43 Lindane 11.11 217 181 10 219 183 10 44 Malathion 13.5 173 99 10 173 127 5 45 Metconazole 21.46 125 89 10 127 89 10 46 Metribuzin 12.42 198 82 15 214 198 5 47 Parathion 13.87 291 109 10 291 81 20 48 Penconazole 14.83 248 157 20 159 123 15 49 Pendimethalin 14.75 281 252 5 252 162 5 50 Permethrin 24.12 and 24.38 183 168 15 183 153 10 51 Phosphamidone 12.27 264 127 10 127 109 10 52 Pirimicarb 11.95 238 166 10 166 96 15 53 Pirimiphos-methyl 13.25 305 290 10 290 233 10 54 Prochloraz 24.71 180 138 10 310 268 5 55 Procymidone 15.32 283 96 6 283 254 10 56 Propiconazole 19.07 and 19.28 173 145 15 259 173 15 57 Pyrimethanil 11.34 199 198 5 198 183 10
Page 13 of 19
DTU, National Food Institute
GC-MS/MS Retention time Precursor ion-1 Product ion-1 CE Precursor ion-2 Product ion-2 CV
58 Quinoxyfen 19.03 237 208 20 272 237 15 59 Tebuconazole 19.67 250 125 15 125 89 10 60 Thiamethoxam 14.47 212 139 10 247 182 10 61 Triadimefon 13.93 208 181 5 181 111 10 62 Triadimenol 15.19 and 15.42 168 70 5 128 100 10 63 Triazophos 18.61 257 162 5 285 162 10 64 Trifloxystrobin 19.22 222 190 5 186 145 10 65 Trifluralin 9.88 264 206 5 290 248 10 66 Triticonazole 22.01 235 182 15 217 167 15 67 Vinclozolin 12.52 285 212 5 198 145 15
Page 14 of 19
DTU, National Food Institute
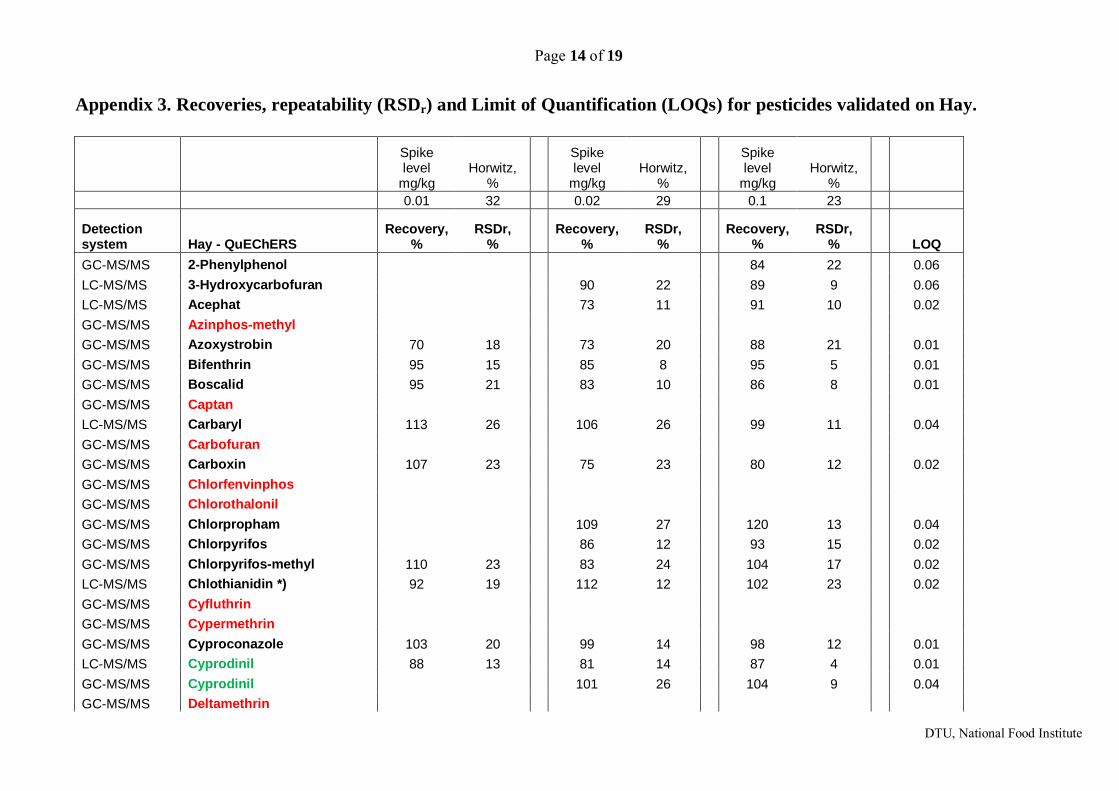
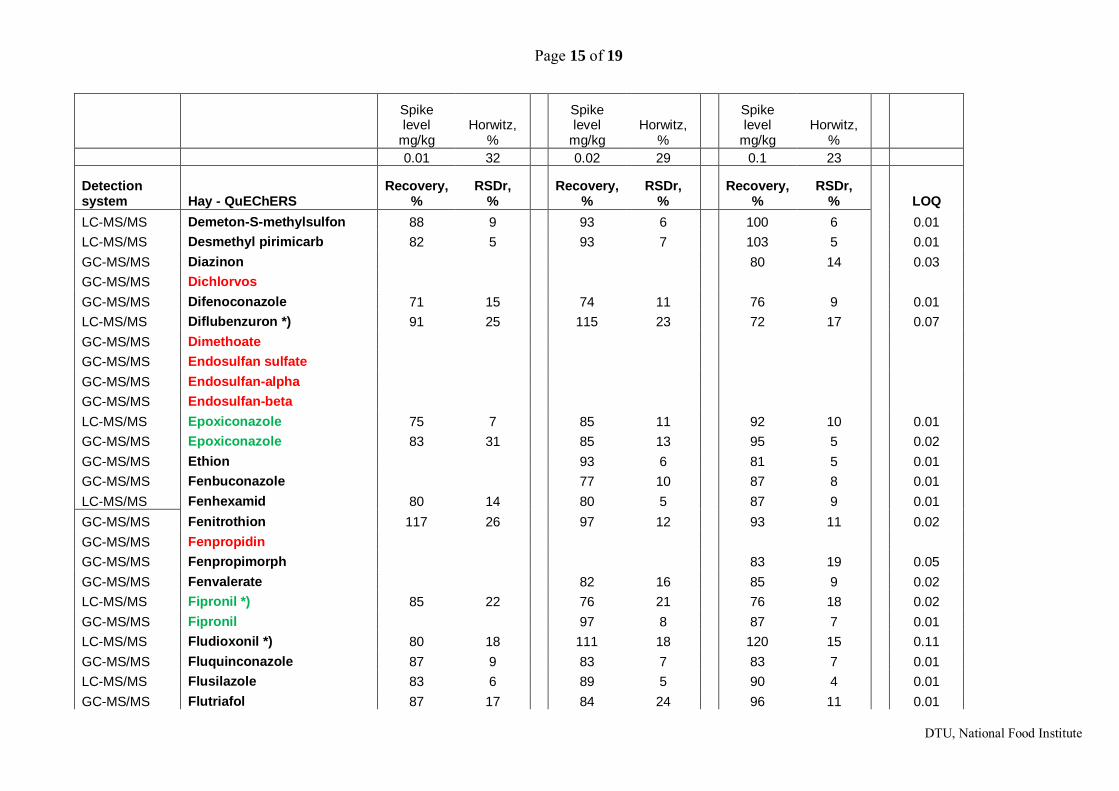
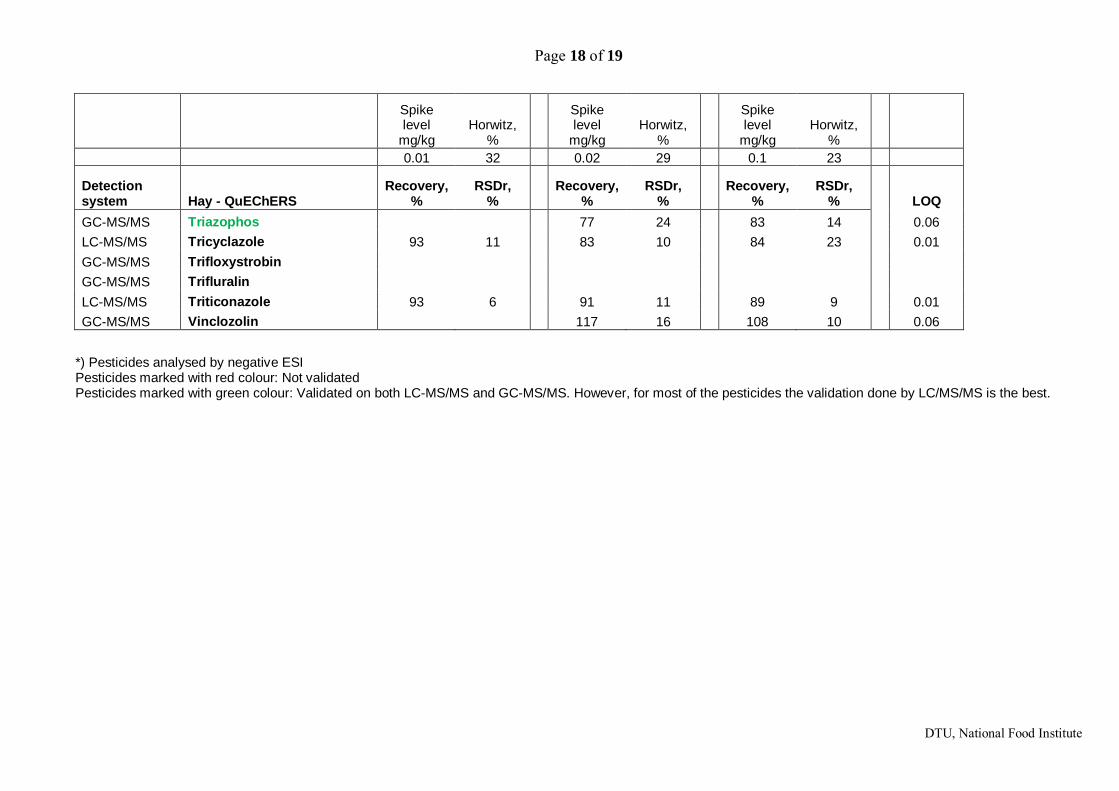
Appendix 3. Recoveries, repeatability (RSDr) and Limit of Quantification (LOQs) for pesticides validated on Hay.
Spike level
mg/kg Horwitz,
%
Spike level
mg/kg Horwitz,
%
Spike level
mg/kg Horwitz,
% 0.01 32 0.02 29 0.1 23
Detection system Hay - QuEChERS
Recovery, %
RSDr, %
Recovery,
% RSDr,
% Recovery,
% RSDr,
% LOQ GC-MS/MS 2-Phenylphenol 84 22 0.06 LC-MS/MS 3-Hydroxycarbofuran
90 22
89 9 0.06
LC-MS/MS Acephat
73 11
91 10 0.02 GC-MS/MS Azinphos-methyl
GC-MS/MS Azoxystrobin 70 18
73 20
88 21 0.01 GC-MS/MS Bifenthrin 95 15
85 8
95 5 0.01
GC-MS/MS Boscalid 95 21
83 10
86 8 0.01 GC-MS/MS Captan
LC-MS/MS Carbaryl 113 26
106 26
99 11 0.04 GC-MS/MS Carbofuran
GC-MS/MS Carboxin 107 23
75 23
80 12 0.02 GC-MS/MS Chlorfenvinphos
GC-MS/MS Chlorothalonil
GC-MS/MS Chlorpropham
109 27
120 13 0.04
GC-MS/MS Chlorpyrifos
86 12
93 15 0.02 GC-MS/MS Chlorpyrifos-methyl 110 23
83 24
104 17 0.02
LC-MS/MS Chlothianidin *) 92 19
112 12
102 23 0.02 GC-MS/MS Cyfluthrin
GC-MS/MS Cypermethrin
GC-MS/MS Cyproconazole 103 20
99 14
98 12 0.01
LC-MS/MS Cyprodinil 88 13
81 14
87 4 0.01 GC-MS/MS Cyprodinil
101 26
104 9 0.04
GC-MS/MS Deltamethrin
Page 15 of 19
DTU, National Food Institute
Spike level
mg/kg Horwitz,
%
Spike level
mg/kg Horwitz,
%
Spike level
mg/kg Horwitz,
% 0.01 32 0.02 29 0.1 23
Detection system Hay - QuEChERS
Recovery, %
RSDr, %
Recovery,
% RSDr,
% Recovery,
% RSDr,
% LOQ LC-MS/MS Demeton-S-methylsulfon 88 9
93 6
100 6 0.01
LC-MS/MS Desmethyl pirimicarb 82 5
93 7
103 5 0.01 GC-MS/MS Diazinon
80 14 0.03
GC-MS/MS Dichlorvos
GC-MS/MS Difenoconazole 71 15
74 11
76 9 0.01
LC-MS/MS Diflubenzuron *) 91 25
115 23
72 17 0.07 GC-MS/MS Dimethoate
GC-MS/MS Endosulfan sulfate
GC-MS/MS Endosulfan-alpha
GC-MS/MS Endosulfan-beta
LC-MS/MS Epoxiconazole 75 7
85 11
92 10 0.01
GC-MS/MS Epoxiconazole 83 31
85 13
95 5 0.02 GC-MS/MS Ethion
93 6
81 5 0.01
GC-MS/MS Fenbuconazole
77 10
87 8 0.01 LC-MS/MS Fenhexamid 80 14 80 5 87 9 0.01 GC-MS/MS Fenitrothion 117 26 97 12 93 11 0.02 GC-MS/MS Fenpropidin
GC-MS/MS Fenpropimorph
83 19 0.05 GC-MS/MS Fenvalerate
82 16
85 9 0.02
LC-MS/MS Fipronil *) 85 22
76 21
76 18 0.02 GC-MS/MS Fipronil
97 8
87 7 0.01
LC-MS/MS Fludioxonil *) 80 18
111 18
120 15 0.11 GC-MS/MS Fluquinconazole 87 9
83 7
83 7 0.01
LC-MS/MS Flusilazole 83 6
89 5
90 4 0.01 GC-MS/MS Flutriafol 87 17
84 24
96 11 0.01

Page 16 of 19
DTU, National Food Institute
Spike level
mg/kg Horwitz,
%
Spike level
mg/kg Horwitz,
%
Spike level
mg/kg Horwitz,
% 0.01 32 0.02 29 0.1 23
Detection system Hay - QuEChERS
Recovery, %
RSDr, %
Recovery,
% RSDr,
% Recovery,
% RSDr,
% LOQ GC-MS/MS HCH, -alpha
72 22
84 23 0.02
GC-MS/MS HCH, -beta
105 18 0.06 GC-MS/MS Hexaconazole
LC-MS/MS Imazalil 86 18
85 8
89 9 0.02 LC-MS/MS Imidacloprid 77 24
85 18
94 12 0.02
GC-MS/MS Iprodione
99 10
85 9 0.03 GC-MS/MS Isoprothiolane
83 20
89 8 0.05
LC-MS/MS Isoproturon 100 6
93 10
90 7 0.01 LC-MS/MS Kresoxim-methyl 115 20
93 20
86 10 0.03
GC-MS/MS Kresoxim-methyl
86 26
93 18 0.07 GC-MS/MS Lambda-cyhalothrin
GC-MS/MS Lindane
93 19 0.11 LC-MS/MS Linuron 85 10
95 5
101 5 0.01
LC-MS/MS Malaoxon 83 6
89 8
97 3 0.01 GC-MS/MS Malathion
96 17
98 8 0.05
GC-MS/MS Metconazole
71 16 0.07 LC-MS/MS Methacrifos 85 12
85 16
89 18 0.01
LC-MS/MS Methomyl
101 14
118 13 0.04 LC-MS/MS Metribuzin 102 13
92 11
81 12 0.02
GC-MS/MS Metribuzin
94 20
92 10 0.06 LC-MS/MS Omethoat 70 18
78 8
92 4 0.02
LC-MS/MS Oxydemeton-methyl 73 11
81 7
93 8 0.01 LC-MS/MS Paclobutrazole 93 16
89 9
96 4 0.02
GC-MS/MS Parathion
82 22
82 10 0.05 GC-MS/MS Penconazole 114 15
95 16
95 10 0.05

Page 17 of 19
DTU, National Food Institute
Spike level
mg/kg Horwitz,
%
Spike level
mg/kg Horwitz,
%
Spike level
mg/kg Horwitz,
% 0.01 32 0.02 29 0.1 23
Detection system Hay - QuEChERS
Recovery, %
RSDr, %
Recovery,
% RSDr,
% Recovery,
% RSDr,
% LOQ LC-MS/MS Pendimethalin 92 28
93 19
104 19 0.03
GC-MS/MS Pendimethalin
91 17 0.09 GC-MS/MS Permethrin
76 20
98 18 0.04
GC-MS/MS Phosphamidone
117 11
103 23 0.04 LC-MS/MS Pirimicarb 93 11
100 10
104 4 0.01
GC-MS/MS Pirimicarb
89 19
102 7 0.05 LC-MS/MS Pirimiphos-methyl 92 4
91 4
89 3 0.01
GC-MS/MS Pirimiphos-methyl
87 8 0.04 GC-MS/MS Prochloraz
83 20 0.10
GC-MS/MS Procymidone 120 18
93 17
95 12 0.05 GC-MS/MS Propiconazole
72 18
102 21 0.04
LC-MS/MS Prothioconazole-desthio 100 24
83 11
82 9 0.03 LC-MS/MS Pyraclostrobin 70 8
84 6
96 5 0.01
LC-MS/MS Pyrimethanil 102 7
87 8
87 7 0.01 GC-MS/MS Pyrimethanil 113 9
103 8
101 7 0.02
GC-MS/MS Quinoxyfen 93 24
79 13
95 19 0.03 LC-MS/MS Spiroxamine 98 8
99 9
100 5 0.01
GC-MS/MS Tebuconazole
73 9
88 22 0.02 LC-MS/MS Tebufenozide 77 26
90 22
103 10 0.02
LC-MS/MS Thiacloprid 88 13
90 12
98 4 0.01 GC-MS/MS Thiamethoxam
117 12 0.08
LC-MS/MS Thiodicarb 82 9
77 7
80 2 0.01 GC-MS/MS Triadimefon
105 23 0.15
GC-MS/MS Triadimenol
94 13
87 18 0.04 LC-MS/MS Triazophos 77 13
87 9
97 6 0.01
Page 18 of 19
DTU, National Food Institute
Spike level
mg/kg Horwitz,
%
Spike level
mg/kg Horwitz,
%
Spike level
mg/kg Horwitz,
% 0.01 32 0.02 29 0.1 23
Detection system Hay - QuEChERS
Recovery, %
RSDr, %
Recovery,
% RSDr,
% Recovery,
% RSDr,
% LOQ GC-MS/MS Triazophos
77 24
83 14 0.06
LC-MS/MS Tricyclazole 93 11
83 10
84 23 0.01 GC-MS/MS Trifloxystrobin
GC-MS/MS Trifluralin
LC-MS/MS Triticonazole 93 6
91 11
89 9 0.01
GC-MS/MS Vinclozolin 117 16 108 10 0.06 *) Pesticides analysed by negative ESI Pesticides marked with red colour: Not validated Pesticides marked with green colour: Validated on both LC-MS/MS and GC-MS/MS. However, for most of the pesticides the validation done by LC/MS/MS is the best.
Page 19 of 19
DTU, National Food Institute
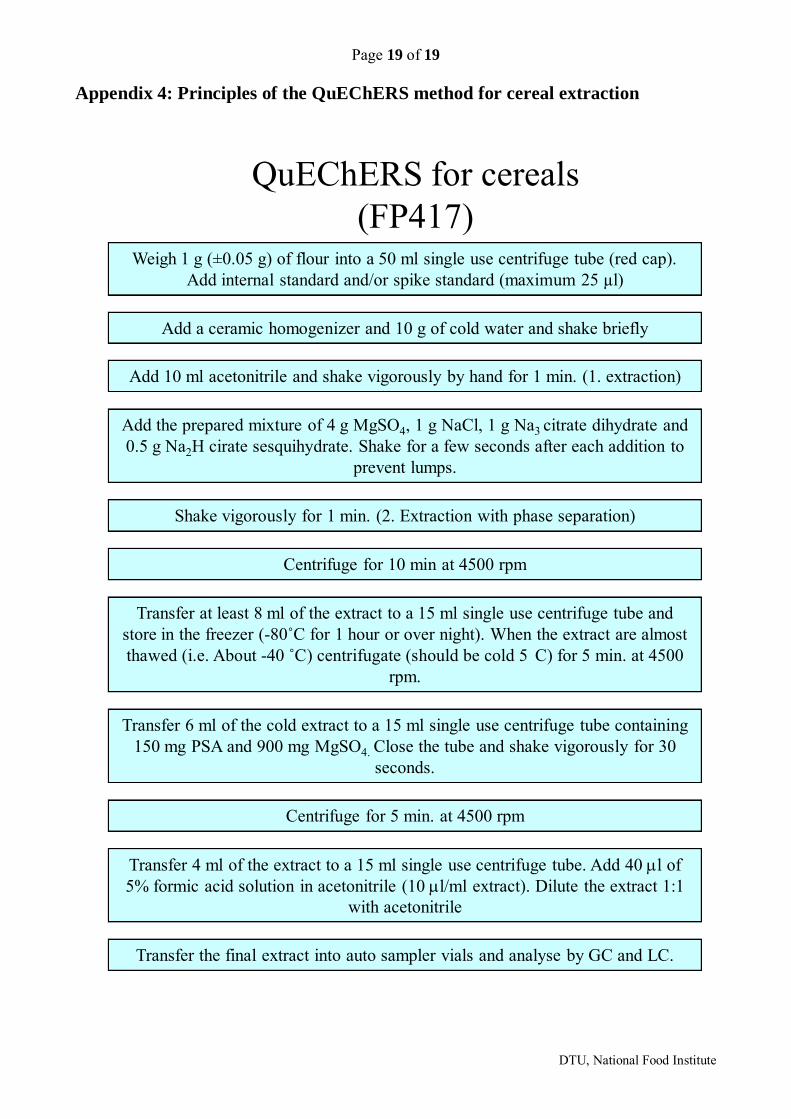
Appendix 4: Principles of the QuEChERS method for cereal extraction
QuEChERS for cereals(FP417)
Weigh 1 g (±0.05 g) of flour into a 50 ml single use centrifuge tube (red cap). Add internal standard and/or spike standard (maximum 25 µl)
Add a ceramic homogenizer and 10 g of cold water and shake briefly
Add 10 ml acetonitrile and shake vigorously by hand for 1 min. (1. extraction)
Add the prepared mixture of 4 g MgSO4, 1 g NaCl, 1 g Na3 citrate dihydrate and 0.5 g Na2H cirate sesquihydrate. Shake for a few seconds after each addition to
prevent lumps.
Centrifuge for 10 min at 4500 rpm
Transfer 6 ml of the cold extract to a 15 ml single use centrifuge tube containing 150 mg PSA and 900 mg MgSO4. Close the tube and shake vigorously for 30
seconds.
Centrifuge for 5 min. at 4500 rpm
Transfer 4 ml of the extract to a 15 ml single use centrifuge tube. Add 40 µl of 5% formic acid solution in acetonitrile (10 µl/ml extract). Dilute the extract 1:1
with acetonitrile
Transfer the final extract into auto sampler vials and analyse by GC and LC.
Shake vigorously for 1 min. (2. Extraction with phase separation)
Transfer at least 8 ml of the extract to a 15 ml single use centrifuge tube and store in the freezer (-80˚C for 1 hour or over night). When the extract are almost thawed (i.e. About -40 ˚C) centrifugate (should be cold 5 C) for 5 min. at 4500
rpm.