Validation of OpenStreetMap road data for integration...
36
Validation of OpenStreetMap road data for integration into the gROADS v1 Master’s project in Environmental sciences and engineering (01.09.2015 – 19.02.2016) CIESIN Supervisors: Paola Kim-Blanco & Alex de Sherbinin - Bogdan-Mihai Cirlugea -
Transcript of Validation of OpenStreetMap road data for integration...
Validation of OpenStreetMap road data for integration into the gROADS v1
Master’s project in Environmental sciences and engineering (01.09.2015 – 19.02.2016)
CIESIN Supervisors: Paola Kim-Blanco & Alex de Sherbinin
- Bogdan-Mihai Cirlugea -
Content• Context
• OSMo Background o Quality aspectso Previous validation methods o Current validation methods
• Assessment methodso Historic assessmento Attribute structureo Positional accuracyo Completeness assesmento Versioning as trust parameter
• Ingestion decision
• Conclusion

ContextgROADS v1• Global dataset - best available open access road data by country• Low positional accuracy (RMSE > 900m) + Low completenessOpenStreetMap• Successful Volunteered Geographic Information product (> 2 million active users)• Best source of data to improve gROADS v1
Problematic • OSM has no systematic quality control • OSM’s quality is highly variable
Objective• Develop diagnostics that can give a sense about overall quality of OSM• Decide if OSM country data should be ingested into gROADS
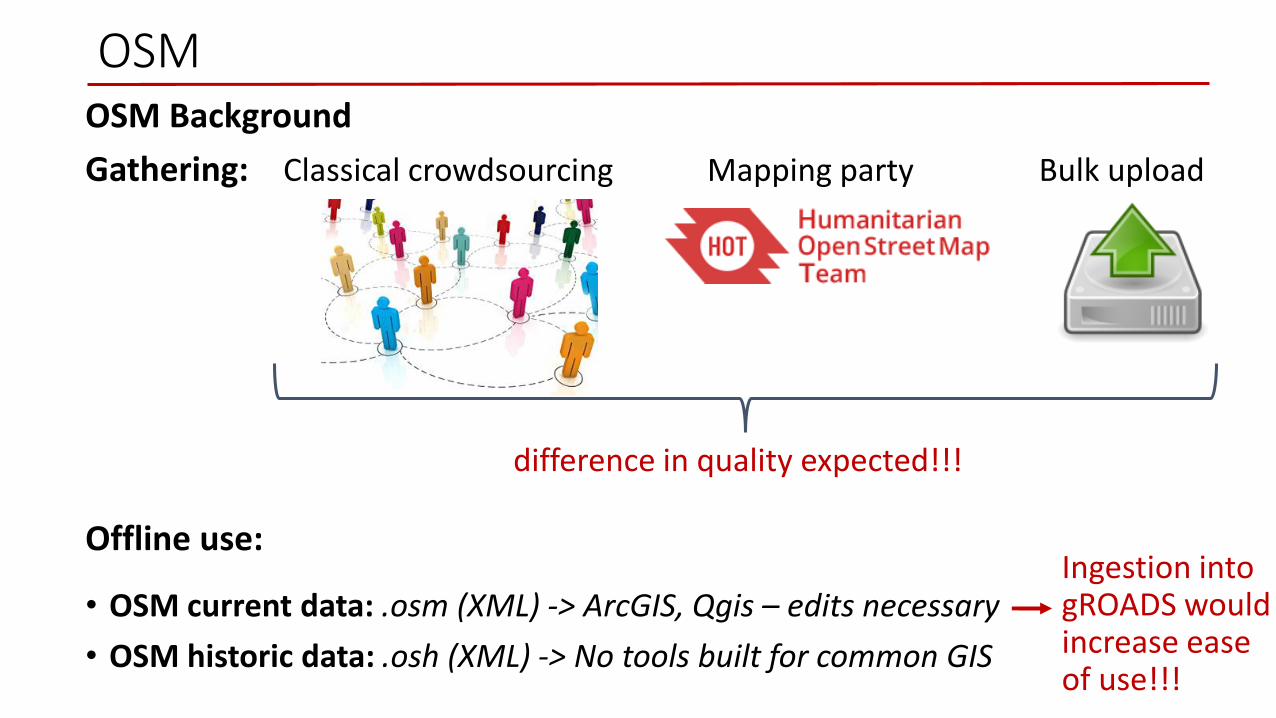
OSM Background
Gathering: Classical crowdsourcing Mapping party Bulk upload
difference in quality expected!!!
Offline use:
• OSM current data: .osm (XML) -> ArcGIS, Qgis – edits necessary
• OSM historic data: .osh (XML) -> No tools built for common GIS
OSM
Ingestion into gROADS would increase ease of use!!!

OSMQuality components
• Positional accuracy – Accuracy of coordinate values (horizontal and vertical)
• Attribute accuracy - Accuracy of quantitative attributes, the correctness of non-qualitative ones and the correctness of classification.
• Completeness – A measure of the absence of data and the presence of excess data
• Lineage - Traceability of geographic data - capacity to describe the origin and evolution

OSM Previous validation work
• Comparison against reference datasets
Completeness
Positional accuracy
Attribute accuracy
• Historic assessment
Evolution of road length
Evolution of position
Attribute evolution
• Trust parameters
Number of contributorsNumber of versions
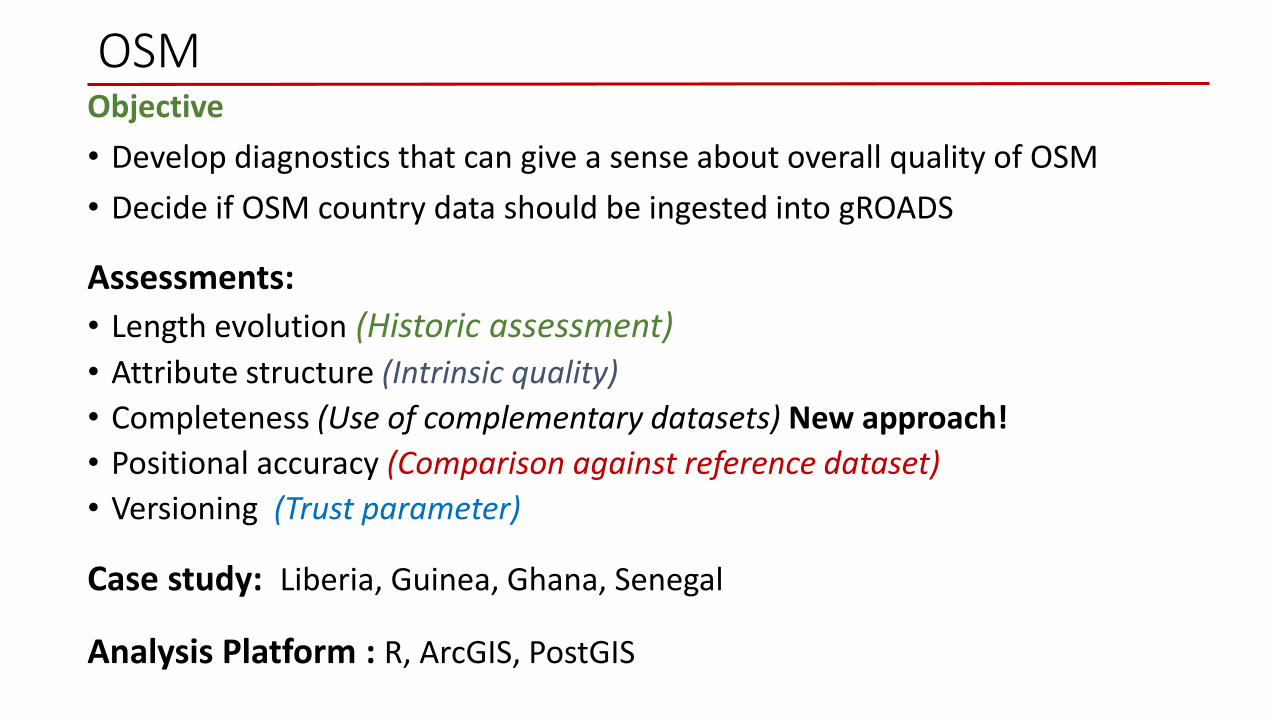
OSMObjective
• Develop diagnostics that can give a sense about overall quality of OSM
• Decide if OSM country data should be ingested into gROADS
Analysis Platform : R, ArcGIS, PostGIS
Case study: Liberia, Guinea, Ghana, Senegal
Assessments:
• Length evolution (Historic assessment) • Attribute structure (Intrinsic quality)
• Completeness (Use of complementary datasets) New approach!
• Positional accuracy (Comparison against reference dataset)
• Versioning (Trust parameter)

OSM Full
history
dump
.poly countryboundaries
OSM history
splitter
Charts
&
Maps
SQL Queries
+ QGIS
SQL Queries
+ R)
OSM history
importer
Historic assessment
Method

Historic assessment
Results
Liberia & Guinea
• Mapping intensified during Ebola crisis
• Contribution stagnates in the present

Historic assessment
Results
Ghana & Senegal
• More steady evolution
• Reclassifications
• Strong contribution in the present
• No pattern for road types
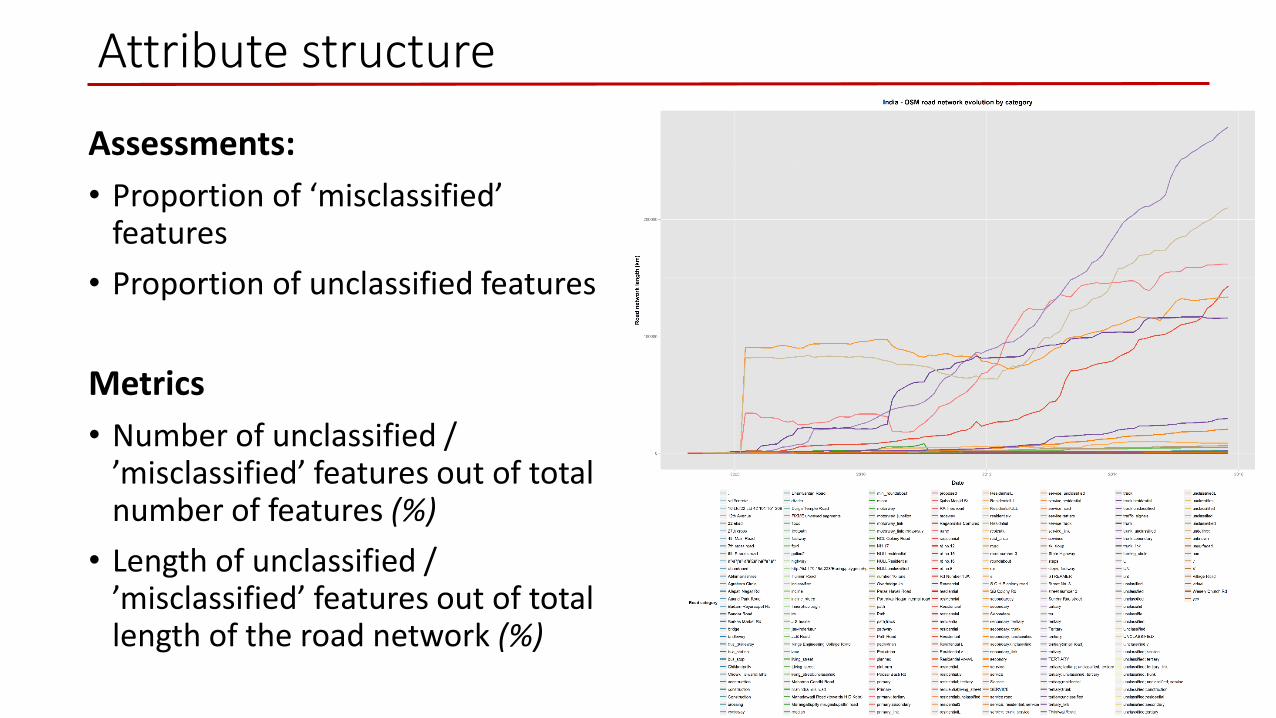
Attribute structure
Assessments:
• Proportion of ‘misclassified’ features
• Proportion of unclassified features
Metrics
• Number of unclassified / ’misclassified’ features out of total number of features (%)
• Length of unclassified / ’misclassified’ features out of total length of the road network (%)
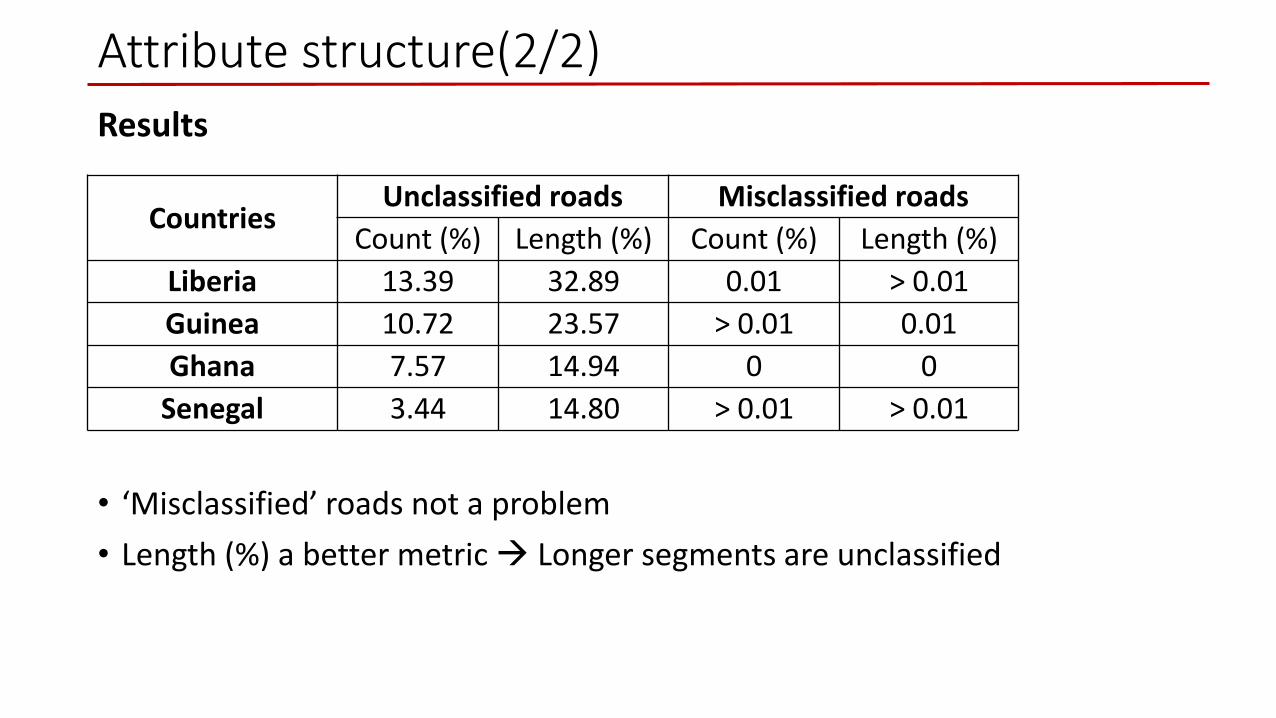
Attribute structure(2/2)
CountriesUnclassified roads Misclassified roads
Count (%) Length (%) Count (%) Length (%)
Liberia 13.39 32.89 0.01 > 0.01
Guinea 10.72 23.57 > 0.01 0.01
Ghana 7.57 14.94 0 0
Senegal 3.44 14.80 > 0.01 > 0.01
Results
• ‘Misclassified’ roads not a problem
• Length (%) a better metric Longer segments are unclassified

Completeness assessmentAssumption
Presence/absence of roads is influenced by 3 quantifiable variables: Population, Wealth, Terrain Variability
IF TRUE The 3 variables can be used to predict regions with missing roads in OSM
• Identify suitable datasets: GPW, DSH survey, STRM-1 Arc Second Global
• Aggregate datasets: Subnational admin units 2
• Asses data correlation
• Develop prediction methods: Discrete classification & Regression model
• Verify prediction accuracy
Workflow

Completeness assessment
GPW 4
Population density (pers./km2)
No transformation needed
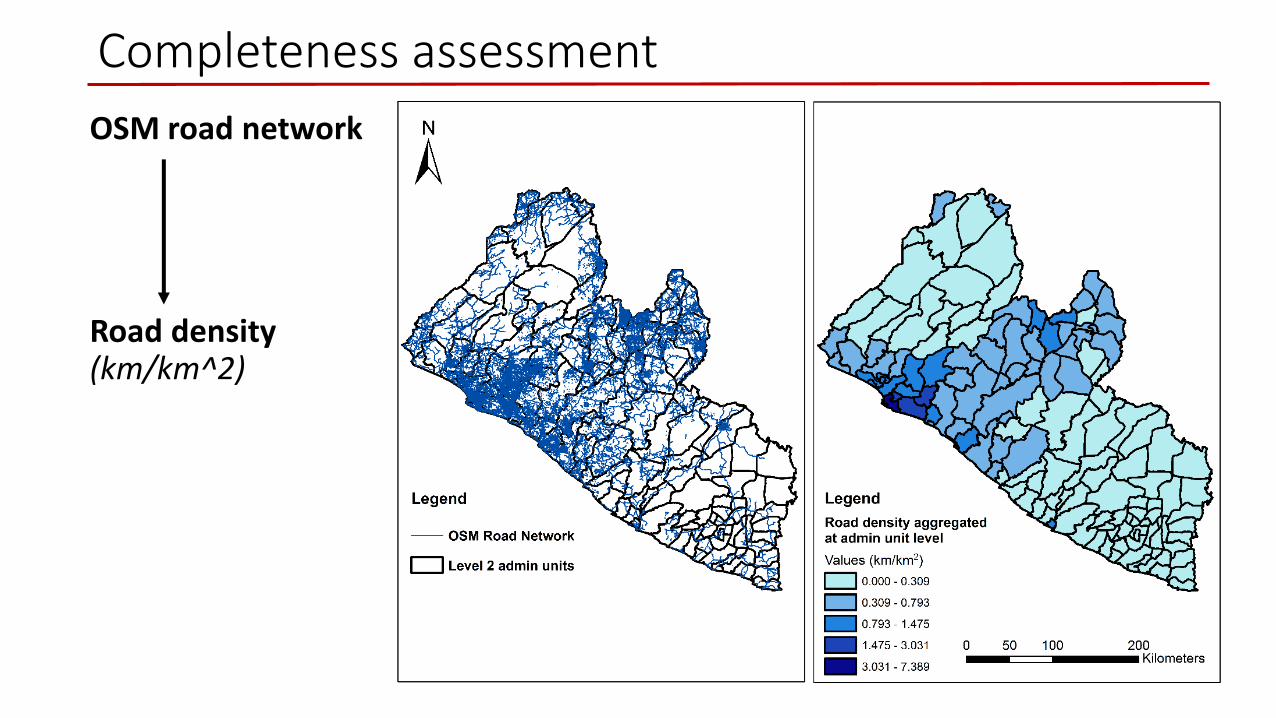
Completeness assessment
OSM road network
Road density (km/km^2)

Completeness assessment
DSH Survey
Prediction raster
Aggregated Wealth Index (relative value 1 - 5)

Completeness assessment
Correlation results
Country
data SHPsR - Data
assembly
R - Analysis Discrete
classification
Regression
analysis
Population
density
Wealth Index
Elevation SD
Correlation
assessment
OSM road
density
Road
density
Pop.
density
Wealth Elevation
SD
Slope
AVG
Road density 1.00 0.86 0.68 -0.18 -0.35
Pop. density 0.86 1.00 0.45 -0.16 -0.25
Wealth 0.69 0.45 1.00 -0.07 -0.29
Elevation SD -0.18 -0.17 -0.07 1.00 0.67
Slope Avg -0.35 -0.25 -0.29 0.67 1.00
Conclusions
• Road Dens. correlates with Pop. Dens. & Wealth
• No correlation with terrain variables
• Interrelation between Pop. Dens. & Wealth

Completeness assessment Method 1: Discrete classification prediction
∩
Determine: Low-High Road density, Low-High Population density, Low-High Wealth
Use: Median
Tag: Regions with Low Road Density but HighPop. Denisty & High Wealth

Completeness assessmentMethod 2: Spatial regression prediction
• Predict Road density with Population density & Wealth
• Tag regions with extreme negative residuals
• Extreme residuals: lower quartile of negative residuals (<25%)
Regression model: Spatial Durbin
Weighting scheme: Queen 1 contiguity
Simplification !
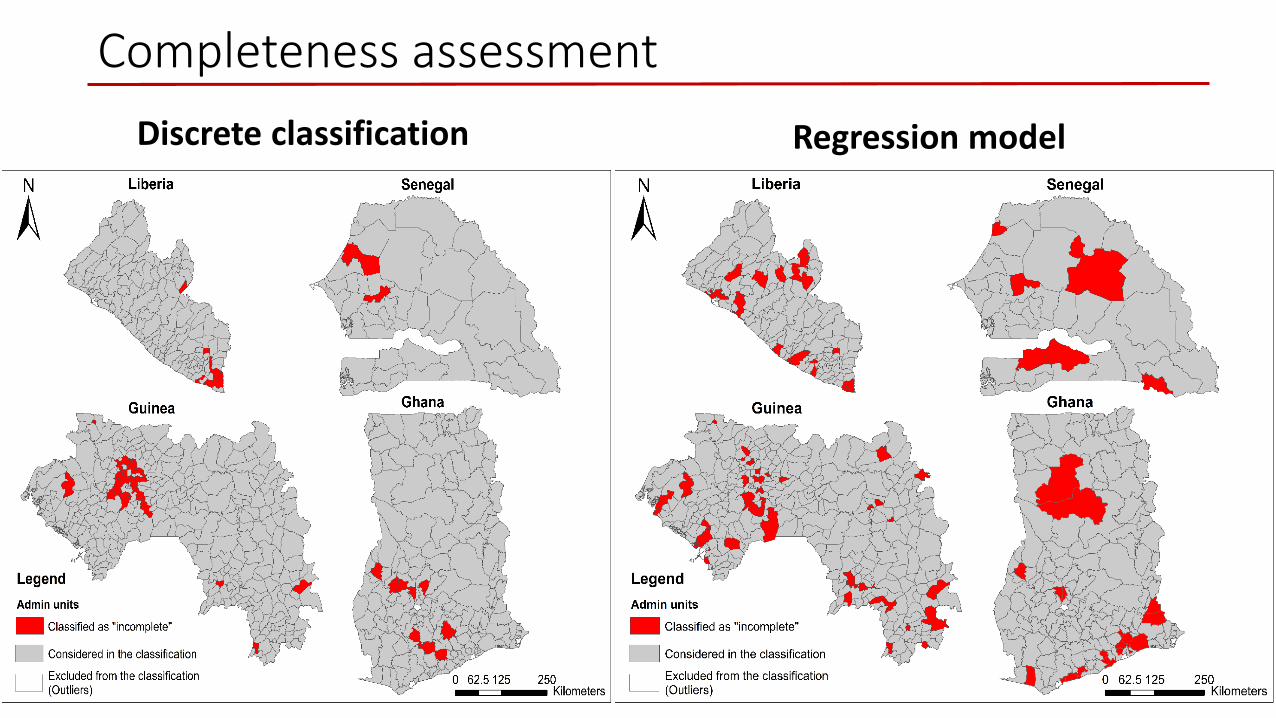
Completeness assessment
Discrete classification Regression model

Completeness assessment
Country
Incorrect classifications
Discrete
classification (%)
Regression
models (%)
Liberia 21% 31%
Guinea 0% 11%
Ghana 22% 23%
Senegal 0% 0%
Conclusions
• Some patterns can be spotted
• Generally different predictions!
• Big number of erroneous predictions!
• Methods suitable for exploration (complementarily)
Limitations
• Modifiable area unit
• Quality of input datasets
• Cut-off values
+ Others
?!

Positional accuracy
Method
Compare position of OSM road intersections with the position of road intersections digitized on imagery (ground truth). Provide one RMSE value for each country.
Issue
Which source of imagery? How to sample? How big of a sample?
Preliminary tests
• 2 imagery sources: Google Earth, Esri
• 3 sampling schemes
• 2 countries: Liberia, Guinea
Conclusions
• Imagery: Google Earth
• Sample size: 100
• Sampling scheme: 10 random admin units (urban + rural) & 10 random intersections in each

Positional accuracy
Country Total RMSE
(m)
Urban RMSE
(m)
Rural RMSE
(m)
Regional RMSE SD
(m)
Liberia 31.57 7.97 43.93 26.68
Guinea 11.50 8.06 13.30 5.17
Senegal 7.46 4.10 8.99 3.66
Ghana 9.47 9.90 9.03 3.46
Results
• RMSE < 50m
• Urban RMSE < Rural RMSE
• Classical gathering < Mapping party
Limitation
• Relative value of accuracy
• Digitization process and imagery induce systematic errors
• Digitization is time consuming

Versioning as trust parameterAssumption
Positional accuracy & Segment complexity increases as Number of versions increases
IF TRUE ‘version’ attribute – trust parameter
Methods
Positional accuracy
• Use the road intersection of known RMSE already samples
• Transfer them a the version of the parent segments
Segment complexity
• Segment complexity = number of nodes / segment length
• Use directly ‘version’ attribute
V=6
V=4
V= 𝟔+𝟒
𝟐
Study correlation
Study correlation

Versioning as trust parameter
Countries Correlation
coefficient / Nr.
of points
Correlation
coefficient (subset)
/ Nr. of points
Liberia -0.0357 100 -0.0661 58
Guinea 0.1069 100 -0.0089 40
Ghana -0.0008 100 -0.0221 54
Senegal 0.0426 99 0.2119 31
All samples 0.0142 399 -0.0189 183
Results
• No significant correlation noticed
• Numbers improve when excluding 1-3 versions
• Small number of points for the assessment

Versioning as trust parameter
Results
• Opposite results than expected
• Consistent in all cases
• Number of nodes & Segment length individually follow the same trend with increase in version

Versioning as trust parameter
Results
• Road fragmentation
• Data lineage error
• Magnitude of problem hard to assess
• Use of ‘version’ as trust parameter not recommended in case of roads !!!
Ingestion decision
Country
Criteria
Ingestion
decision Completeness Positional
Accuracy
Attribute
structure
Liberia
Guinea
Ghana
Senegal
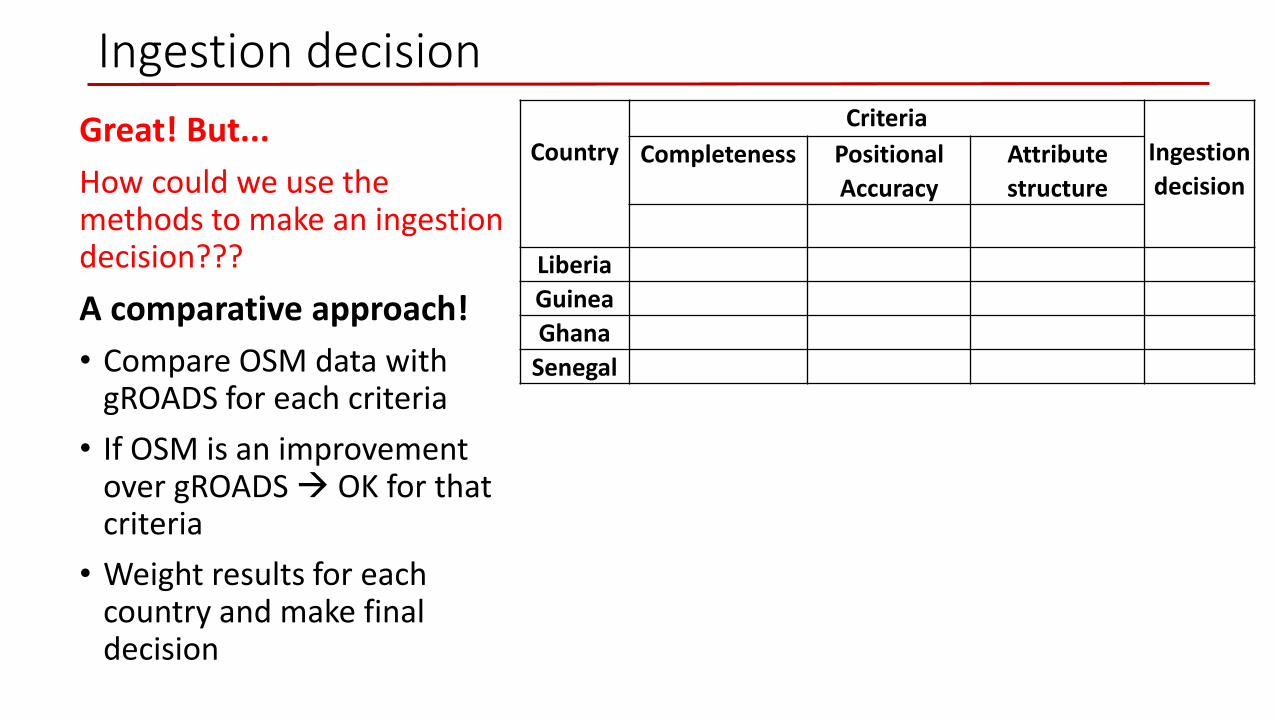
Great! But...
How could we use the methods to make an ingestion decision???
A comparative approach!
• Compare OSM data with gROADS for each criteria
• If OSM is an improvement over gROADS OK for that criteria
• Weight results for each country and make final decision
Ingestion decision
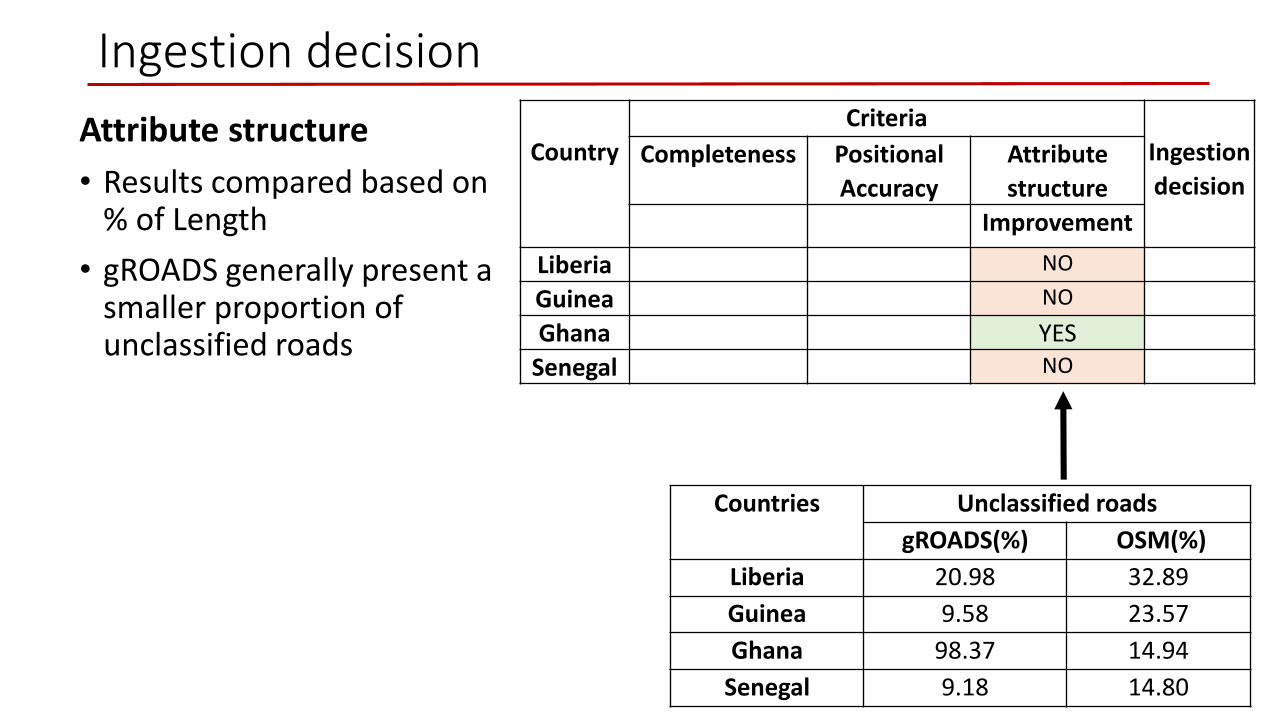
Countries Unclassified roads
gROADS(%) OSM(%)
Liberia 20.98 32.89
Guinea 9.58 23.57
Ghana 98.37 14.94
Senegal 9.18 14.80
Country
Criteria
Ingestion
decision Completeness Positional
Accuracy
Attribute
structure
Improvement
Liberia NO
Guinea NO
Ghana YES
Senegal NO
Attribute structure
• Results compared based on % of Length
• gROADS generally present a smaller proportion of unclassified roads

Ingestion decision
Country
Criteria
Ingestion
decision Completeness Positional
Accuracy
Attribute
structure
RMSE < 50m Improvement
Liberia YES NO
Guinea YES NO
Ghana YES YES
Senegal YES NO
Positional accuracy
• gROADS has a 50m RMSE requirement
• Experience with gROADSindicates RMSE values as superior
Country Total RMSE
(m)
Liberia 31.57
Guinea 11.50
Senegal 7.46
Ghana 9.47
Ingestion decision
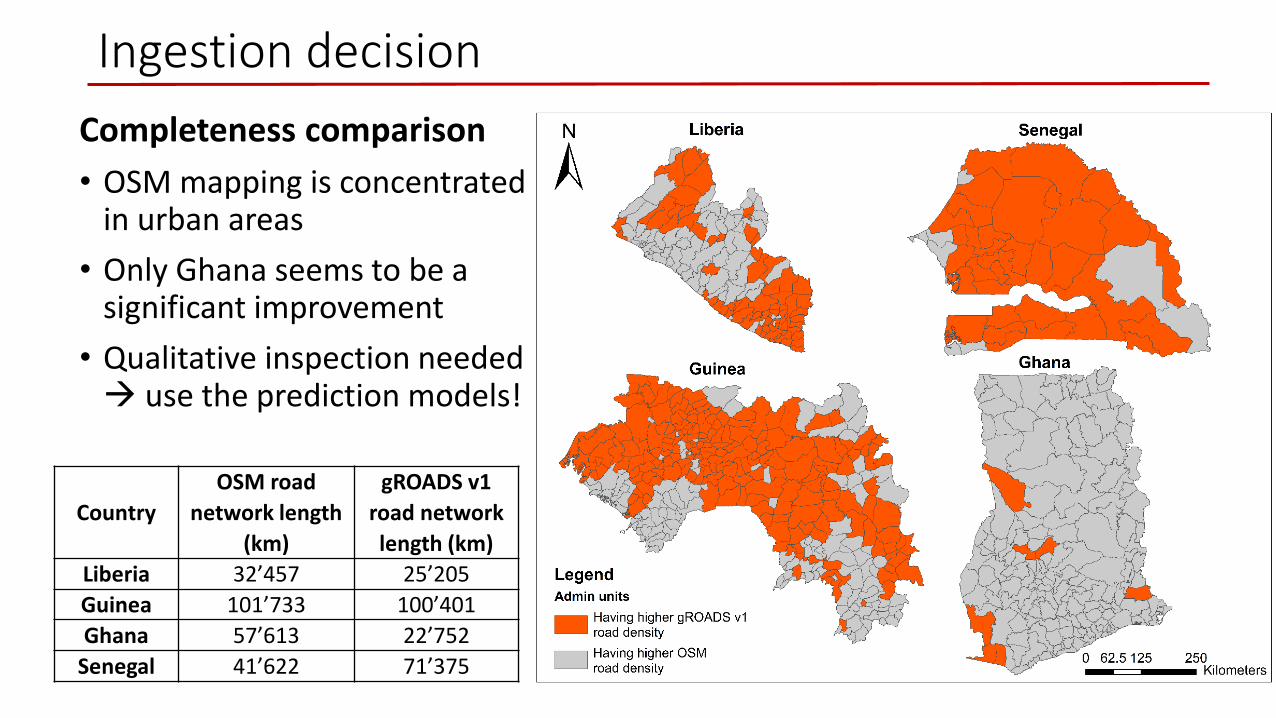
Country
OSM road
network length
(km)
gROADS v1
road network
length (km)
Liberia 32’457 25’205
Guinea 101’733 100’401
Ghana 57’613 22’752
Senegal 41’622 71’375
Completeness comparison
• OSM mapping is concentrated in urban areas
• Only Ghana seems to be a significant improvement
• Qualitative inspection needed use the prediction models!

Ingestion decision
Country
Criteria
Ingestion
decision Completeness Positional
Accuracy
Attribute
structure
Improvement RMSE < 50m Improvement
Liberia NO YES NO NO
Guinea NO YES NO NO
Ghana YES YES YES YES
Senegal NO YES NO NO
Conclusion
• Decision cannot be taken only base on quantitative aspects
• Data inspections also needed
• Only one country seems to be a clear improvement over gROADS
Questions
• How should criteria be weighed?
• Can we add other diagnostics?
Conclusion
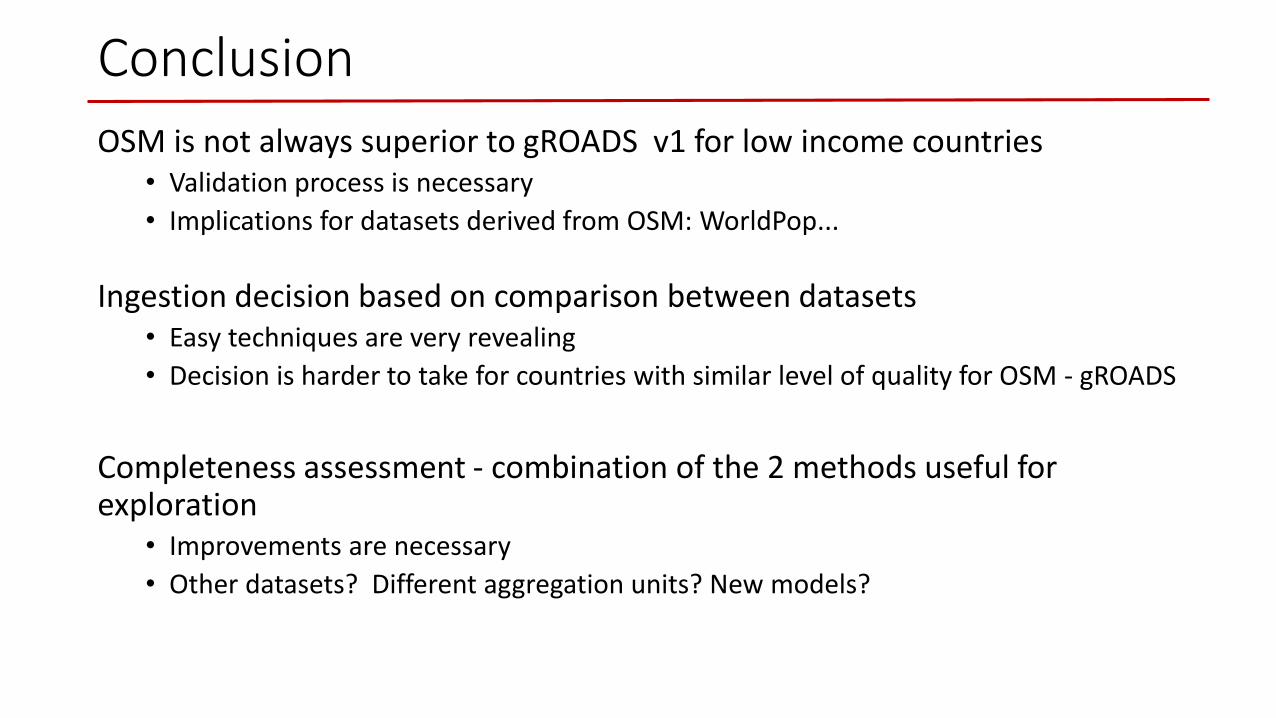
OSM is not always superior to gROADS v1 for low income countries• Validation process is necessary
• Implications for datasets derived from OSM: WorldPop...
Ingestion decision based on comparison between datasets• Easy techniques are very revealing
• Decision is harder to take for countries with similar level of quality for OSM - gROADS
Completeness assessment - combination of the 2 methods useful for exploration
• Improvements are necessary
• Other datasets? Different aggregation units? New models?
Conclusion
OSM is not always superior to gROADS v1 for low income countries• Validation process is necessary
• Implications for datasets derived from OSM: WorldPop...
Ingestion decision based on comparison between datasets• Easy techniques are very revealing
• Decision is harder to take for countries with similar level of quality for OSM – gROADS
Completeness assessment - combination of the 2 methods useful for exploration
• Improvements are necessary
• Other datasets? Different aggregation units? New models?
Thank you!Email: [email protected]

Spatial Durbin – Backup
𝑦 = 𝑥𝛽 +𝑊𝑥𝜃 + 𝜀
𝒚 - dependent variable𝒙 - set of independent variables𝑾𝒙 - spatially lagged independent variables 𝜽 - spatial coefficient,𝜺 - vector of error terms.
Durbin model:
Countries Lag Error Durbin GWR
Liberia 32.46 32.46 14.91 -97.83
Guinea 503.64 503.64 498.84 416.91
Ghana 167.26 167.26 148.21 156.04
Senegal -73.48 -73.48 -70.52 -104.74
Queen 1
AIC results Countries OLS Durbin
MI p-value MI p-value
Liberia 0.36 3.87e-13 -0.001 0.44
Guinea 0.39 6.67e-35 0.02 0.23
Ghana -0.05 8.81e-01 0.02 0.27
Senegal 0.12 6.05e-02 0.01 0.34
Moran I
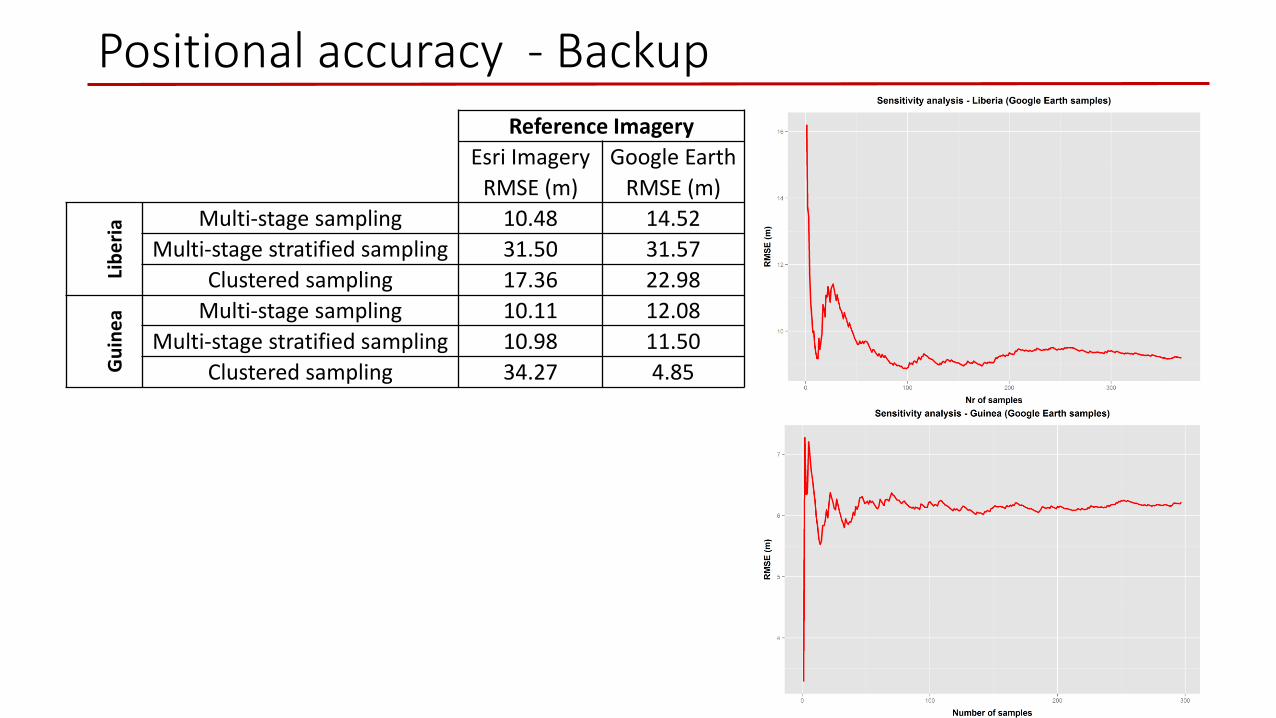
Positional accuracy - BackupReference Imagery
Esri Imagery
RMSE (m)
Google Earth
RMSE (m)
Lib
eri
a Multi-stage sampling 10.48 14.52
Multi-stage stratified sampling 31.50 31.57
Clustered sampling 17.36 22.98
Gu
ine
a Multi-stage sampling 10.11 12.08
Multi-stage stratified sampling 10.98 11.50
Clustered sampling 34.27 4.85