Action Against Hunger - Hunger Matters Annual Publication 2013

Validation of a Measure ofHousehold Hunger for Cross-Cultural Use
Megan Deitchler, Terri Ballard, Anne Swindale and Jennifer Coates
May 2010
FANTA 2 F O O D A N D N U T R I T I O N T E C H N I C A L A S S I S TA N C E
TECHNICAL REPORT
Food and Nutrition Technical Assistance II Project (FANTA-2)1825 Connecticut Ave., NW Washington, DC 20009-5721
Tel: 202-884-8000 Fax: 202-884-8432 E-mail: fanta @ .org Website: www.fanta .org

Validation of a Measure of Household Hunger for Cross-Cultural Use Megan Deitchler, Terri Ballard, Anne Swindale and Jennifer Coates May 2010
Food and Nutrition Technical Assistance II Project (FANTA-2) FHI 360 1825 Connecticut Ave., NW Washington, DC 20009-5721 Tel: 202-884-8000 Fax: 202-884-8432 E-mail: [email protected] Website: www.fantaproject.org

This report is made possible by the generous support of the American people through the support of the Office of Health, Infectious Disease, and Nutrition, Bureau for Global Health, United States Agency for International Development (USAID), under terms of Cooperative Agreement No. GHN-A-00-08-00001-00, through the Food and Nutrition Technical Assistance II Project (FANTA-2), managed by FHI 360. The contents are the responsibility of FHI 360 and do not necessarily reflect the views of USAID or the United States Government. Published May 2010
Recommended Citation: Deitchler, Megan, Terri Ballard, Anne Swindale and Jennifer Coates. Validation of a Measure of Household Hunger for Cross-Cultural Use. Washington, DC: Food and Nutrition Technical Assistance II Project (FANTA-2), FHI 360, 2010. Contact information: Food and Nutrition Technical Assistance II Project (FANTA-2) FHI 360 1825 Connecticut Avenue, NW Washington, D.C. 20009-5721 Tel: 202-884-8000 Fax: 202-884-8432 Email: [email protected] Website: www.fantaproject.org

Validation of a Measure of Household Hunger for Cross-Cultural Use
Table of Contents
Acknowledgments .......................................................................................................................................... i
Acronyms and Abbreviations ........................................................................................................................ ii
Executive Summary ...................................................................................................................................... iii Introduction ................................................................................................................................................ iii Background ............................................................................................................................................... iii Validation Analysis Methods .................................................................................................................... iv Key Results and Findings ......................................................................................................................... iv Conclusion ................................................................................................................................................. v
Introduction.................................................................................................................................................... 1
Section 1. Development of the HFIAS .......................................................................................................... 3 1.1 Operationalizing the Construct ............................................................................................................ 3 1.2 Household Food Security Survey Measure (HFSSM) Approach ........................................................ 3 1.3 Adapting the HFSSM Approach .......................................................................................................... 4 1.4 Desired HFIAS Measurement Properties and Data Used for Validation Study .................................. 6
Section 2. Validation of a Multiple Item Scale: Rasch Models ...................................................................... 8
Section 3. Methods for HFIAS Validation Testing ....................................................................................... 10 3.1 General Analysis Methods ................................................................................................................ 10 3.2 Internal Validation Analysis Methods ................................................................................................ 10 3.3 Cross-Cultural Validation Analysis Methods ..................................................................................... 12 3.4 External Validation Analysis Methods ............................................................................................... 13
Section 4. HFIAS Validation Results ........................................................................................................... 14 4.1 Descriptive Statistics ......................................................................................................................... 14 4.2 Testing the Original HFIAS: 9 Items, 4 Frequencies (9I 4F) ............................................................. 15 4.3 Testing Various Frequency Response Categories ............................................................................ 15 4.4 Testing Various Item Combinations .................................................................................................. 17
4.4.1 9 Item 3 Frequency Scale (Rarely and Sometimes Combined) (9I 3F)...................................... 17 4.4.2 5 Item 3 Frequency Scale (Rarely and Sometimes Combined) (5I 3F)...................................... 18 4.4.3 3 Item 3 Frequency Scale (Rarely and Sometimes Combined) (3I 3F)...................................... 19
4.5 Applying the Internal and Cross-Cultural Validation Results ............................................................ 19 4.5.1 Reassessing the Measurement Construct: Household Food Insecurity or Household
Hunger ............................................................................................................................................ 19 4.5.2 Creating a Categorical Measure of Household Hunger .............................................................. 20 4.5.3 Sample Estimates of Household Hunger .................................................................................... 25
4.6 External Validation Results ............................................................................................................... 25
Section 5. HFIAS Qualitative Feedback ...................................................................................................... 31
Section 6. Discussion .................................................................................................................................. 36
Section 7. Limitations .................................................................................................................................. 39
Section 8. Conclusion ................................................................................................................................. 40
References .................................................................................................................................................. 41
Annex 1. Results for Original HFIAS: 9I 4F Scale ...................................................................................... 44
Annex 2. Results for 9I 3F Scale (Rarely and Sometimes Combined) ....................................................... 49
Annex 3. Results for 5I 3F Scale (Rarely and Sometimes Combined) ....................................................... 54
Annex 4. Results for 3I 3F Scale (Rarely and Sometimes Combined) ....................................................... 58
Appendix. Partner Feedback Form ............................................................................................................. 62

Validation of a Measure of Household Hunger for Cross-Cultural Use
List of Tables Table 1. HFSSM Items and Response Codes .............................................................................................. 4 Table 2. HFIAS Items and Response Codes ................................................................................................ 5 Table 3. HFIAS Validation Study Collaborators and Data Sets Available for Analysis................................. 7 Table 4. Number of Respondents Replying to Each HFIAS Item and Frequency Response, by
Data Set ................................................................................................................................................. 14 Table 5. Standardized Item-Step Calibrations for a 9I 3F Scale (Never and Rarely Combined), by
Data Set ................................................................................................................................................. 16 Table 6. Standardized Item-Step Calibrations for a 9I 3F Scale (Rarely and Sometimes
Combined), by Data Set ......................................................................................................................... 16 Table 7. Range of Non-Standardized Household Severity Parameters and Range of Total Raw
Score Possible, by Data Set for the Frequency Response Categories Tested with a 9I Scale ............ 17 Table 8. 9I 3F Scale .................................................................................................................................... 18 Table 9. 5I 3F Scale .................................................................................................................................... 19 Table 10. 3I 3F Scale .................................................................................................................................. 19 Table 11. HHS Estimates by Data Set ........................................................................................................ 25 Table 12. Variables Used for External Validation by Data Set ................................................................... 26 Table 13. Simple Multinomial Logit Regression Results: HHS Regressed on Food Insecurity
Proxy Variable, by Data Set ................................................................................................................... 30 Table 14. Time Dedicated to Preparatory HFIAS Data Collection Activities by Data Set .......................... 32 Table 15. Collaborator Feedback Regarding the Adaptation and Translation of the Original 9
HFIAS Items to a Specific Survey Context ............................................................................................ 34 List of Figures Figure 1. Example: Items and Households (HHs) Placed on a Logit Continuum of Food Insecurity ........... 8 Figure 2. Example: Standardized Item Calibration Plot to Assess Cross-Cultural Equivalence ................ 13 Figure 3. Standardized Cross-Cultural Household Measure Plot for Raw Score Scale Values of 1
to 5, Mozambique R2 and Mozambique R1 .......................................................................................... 21 Figure 4. Standardized Cross-Cultural Household Measure Plot for Raw Score Scale Values of 1
to 5, Malawi and Mozambique R1 ......................................................................................................... 22 Figure 5. Standardized Cross-Cultural Household Measure Plot for Raw Score Scale Values of 1
to 5, West Bank/Gaza Strip and Mozambique R1 ................................................................................. 22 Figure 6. Standardized Cross-Cultural Household Measure Plot for Raw Score Scale Values of 1
to 5, Kenya and Mozambique R1 .......................................................................................................... 23 Figure 7. Standardized Cross-Cultural Household Measure Plot for Raw Score Scale Values of 1
to 5, Zimbabwe and Mozambique R1 .................................................................................................... 24 Figure 8. Standardized Cross-Cultural Household Measure Plots, for Raw Score Scale Values of
1 to 5, South Africa and Mozambique R1 .............................................................................................. 24 Figure 9. Mozambique R1: Proportion of Households Classified in each HHS Category, by
Household Wealth Score ....................................................................................................................... 27 Figure 10. Mozambique R2: Proportion of Households Classified in Each HHS Category, by
HDDS ..................................................................................................................................................... 28 Figure 11. Malawi: Proportion of Households Classified in Each HHS Category, by HDDS ...................... 28 Figure 12. Zimbabwe: Proportion of Households Classified in Each HHS Category, by HDDS ................ 29 Figure 13. West Bank/Gaza Strip and South Africa: Median Household Income in the Preceding
Month by Consumption Unit for Each Category of the HHS .................................................................. 29 List of Boxes Box 1. Description of Proxy Variables Used for External Validation Analysis ............................................ 26

Validation of a Measure of Household Hunger for Cross-Cultural Use
i
Acknowledgments This report has benefitted from the support and input of many individuals and organizations. We especially wish to acknowledge the substantial contributions made to this work by Mark Nord at the Economic Research Service, USDA. Mark Nord provided technical guidance on all aspects of analysis and provided valuable comments on an earlier version of this report. We thank Mark for so generously sharing his technical expertise with us. We would also like to thank our study collaborators who contributed HFIAS data to this study: in Mozambique, the FAO Representation through a grant from the Belgium Survival Fund; in Malawi, the Department of HIV and AIDS and Nutrition and UNICEF; in West Bank and Gaza Strip, the FAO Jerusalem office; in Kenya, Samwel Mbugua and Egerton University: Human Nutrition; in Zimbabwe, the Center for Applied Social Science at the University of Zimbabwe; and in South Africa, the South Africa Human Sciences Research Council. Without the collaboration of these individuals and organizations, this report would not have been possible. The publication was produced with technical support from Terri Ballard at the Food and Agriculture Organization of the United Nations (FAO), with financial support from the European Union (EU) through the EC-FAO programme on linking information and decision-making to improve food security (www.foodsec.org). Jennifer Coates' contributions were supported with funding from Tufts University. The publication was made possible by the generous support of the American people through the support of the Office of Health, Infectious Disease, and Nutrition, Bureau for Global Health, United States Agency for International Development (USAID), through both the Food and Nutrition Technical Assistance II Project (FANTA-2) under terms of Cooperative Agreement Number GHNA-00-08-00001-00, and the FANTA Project (1998-2008) under terms of Cooperative Agreement Number HRN-A-00-98-0046-00, managed by FHI 360. The opinions expressed herein are those of the authors and do not necessarily reflect the views of the individuals or organizations acknowledged above.

Validation of a Measure of Household Hunger for Cross-Cultural Use
ii
Acronyms and Abbreviations AIDS Acquired immune deficiency syndrome CML Conditional maximum likelihood CSI Coping Strategies Index CTT Classical test theory EC European Commission ELCSA Latin American and Caribbean Household Food Security Scale ERS USDA Economic Research Service F Frequency FANTA Food and Nutrition Technical Assistance Project FAO Food and Agriculture Organization of the United Nations FCS Food Consumption Score HDDS Household Dietary Diversity Score HEA Household Economy Approach HFIAS Household Food Insecurity Access Scale HFSSM Household Food Security Survey Module HHS Household Hunger Scale HIV Human immunodeficiency virus I Item IRT Item response theory MVAC Malawi Vulnerability Assessment Committee NIS (New Israeli) Shekel R1 Round 1 R2 Round 2 UNICEF United Nations Children’s Fund US United States USAID United States Agency for International Development USDA United States Department of Agriculture

Validation of a Measure of Household Hunger for Cross-Cultural Use
iii
Executive Summary INTRODUCTION Food security occurs when “all people at all times have physical and economic access to sufficient food to meet their dietary needs for a productive and healthy life.”1
This definition of food security is founded on three fundamental elements: adequate food availability, adequate access to food by all people and appropriate food utilization/consumption. Food availability is derived from domestic agricultural output and net food imports at the national level. Food access is the ability of a household to acquire sufficient quality and quantity of food to meet all household members’ nutritional requirements for productive lives. Food utilization/consumption is determined by how much a person eats and how well a person converts food to nutrients, all of which affect proper biological use of food, nutritional status and growth.
In light of the complex, multi-dimensional nature of food security, it is generally agreed that separate indicators and data collection methods are needed to assess each of the three elements underlying food security attainment.2 Food balance sheets and anthropometric indicators provide well-established methods for attaining comparable measures of the availability and utilization/consumption components of food security.3
However, cross-culturally equivalent methods for assessing the access component are either unavailable or lack field practicality.
This report describes the findings from a validation study of the Household Food Insecurity Access Scale (HFIAS), a 9 item 4 frequency (9I 4F) measurement scale to assess the access component of household food insecurity in resource-poor areas. The United States Agency for International Development (USAID)-funded Food and Nutrition Technical Assistance (FANTA) project developed the HFIAS in 2006 with the aim to provide a simple tool that would provide statistically valid (internally valid), accurate and reliable information about the prevalence of food insecurity at a population level (externally valid) and directly comparable data upon use of the tool in diverse settings (cross-culturally valid). In this study, we examine empirically the extent to which the objectives of internal, external and cross-cultural validity have been achieved. To do so, we use seven HFIAS data sets collected in diverse contexts and countries: Mozambique (two data sets), Malawi, West Bank/Gaza Strip, Kenya, Zimbabwe and South Africa. We apply statistical methods based on the Rasch measurement model to assess the performance of the HFIAS and use the results of these analyses to revise the HFIAS, as necessary. To help interpret the empirical results, we also refer to qualitative feedback on the HFIAS provided by collaborators who contributed data to the study. BACKGROUND The HFIAS is an adaptation of the Household Food Security Survey Module (HFSSM), used by the United States Department of Agriculture (USDA) and other United States (US) agencies to measure the access component of food insecurity in the US. The HFSSM approach is based on the idea that the experience of food insecurity causes predictable reactions that can be captured through a survey and summarized in a scale. Respondents are asked directly whether or not the household has experienced conditions typical of a food-insecure household during a specified recall period, including experiences related to anxiety about the household food supply; insufficient quality of food; and insufficient food supply, food intake and the physical consequences.4
Sometimes referred to as an “experiential” or “perception-based” method of collecting data on food insecurity, the approach has been used by USDA to monitor food assistance programs and estimate the prevalence of food insecurity since 1995, and has consistently been validated as a statistically meaningful measure of food insecurity in the US.
1 USAID 1992. 2 FAO 2002. 3 FAO n.d.; de Onis et al 2006. 4 Swindale and Bilinsky 2006.

Validation of a Measure of Household Hunger for Cross-Cultural Use
iv
To explore the possibility of using the HFSSM approach in a developing country context, FANTA initiated field studies (2000-2003) with Tufts University and World Vision in Bangladesh and Cornell University and Africare in Burkina Faso. At each study site, a set of culturally specific food insecurity questions were elaborated, using qualitative information about the experience of food insecurity in that setting. The food insecurity questions were integrated into representative population-based surveys carried out in World Vision’s and Africare’s program area. The results demonstrated the feasibility and usefulness of the approach. Using the evidence base available from these and similar other studies5, and in consultation with academics, program managers, governments and donors, a 9I 4F scale, the HFIAS, was developed.6
Although the underlying approach of the HFSSM and HFIAS is the same, the intended purpose and range of application for each tool is different. Whereas the HFSSM was developed exclusively for application in the US, the HFIAS was developed to provide a universally-applicable tool that would allow for a cross-culturally equivalent measure of food insecurity in resource-poor areas in a developing country context. Due to these differences in intended scope, the HFIAS was made to be distinct from the HFSSM in several ways, including the number of items comprising the scale and the wording for these items, the recall period used, and the inclusion of frequency questions in the HFIAS to account for how often a condition was experienced (never, rarely, sometimes or often) in the scale score. With the release of the HFIAS in 2006, FANTA disseminated a set of publications to describe the theoretic and evidence base that supported the development of the tool. An operational guide was also prepared to provide instruction on how to collect and tabulate HFIAS data. A systematic validation of the HFIAS was not possible at that time, however, due to the lack of HFIAS data available. This study is the first to empirically assess the validity of the HFIAS using multiple data sets from diverse sites. VALIDATION ANALYSIS METHODS Because a measurement scale rarely fulfills the a priori measurement criteria upon initial validation, the objective of this validation study was not to simply test the HFIAS in its 9I 4F form, but to use the results from the validation analyses to inform revisions to the set of items and frequency categories comprising the scale so that a tool meeting the established measurement criteria could be identified. This being the case, we applied the internal and cross-cultural analyses first to the original 9I 4F HFIAS instrument. Thereafter, analyses continued iteratively on reduced versions of the scale. We made modifications to the scale as indicated by results from the internal and cross-cultural analyses. The same internal, cross-cultural and external validation procedures were carried out on each data set included in the study. We analyzed the HFIAS data against the Rasch model using conditional maximum likelihood (CML) estimation in SAS v9.1 and assessed external validity only after a scale demonstrating internal and cross-cultural validity was identified. KEY RESULTS AND FINDINGS Based on the results of our validation analyses, we recommend a new scale. Although the results from our empirical analyses showed several scales to have reasonable internal validity for some data sets, not all scales tested showed internal validity for all data sets. Only one scale demonstrated the potential for cross-cultural equivalence. Items 1 thru 6 of the HFIAS (1: worry, 2: not able to eat preferred foods, 3: eat limited variety of foods, 4: eat foods that don’t want to, 5: eat smaller meal, 6: eat fewer meals) performed weakest with respect to cross-cultural comparability, whereas items 7, 8 and 9 (7: no food in house, 8: go to sleep hungry, 9: whole day without eating) showed important consistencies across data sets. The qualitative feedback about items 1 thru 6 corroborated the cross-cultural comparability results we obtained through quantitative analysis. Of the various scales tested, we identified a 3I 3F scale comprised of items 7, 8 and 9 (7: no food in house, 8: go to sleep hungry, 9: whole day without eating) and the 3
5 Coates 2004; Frongillo and Nanama 2004; Melgar-Quinonez 2004; Perez-Escamilla et al 2004. 6 Coates et al 2006b; Coates et al 2007b.

Validation of a Measure of Household Hunger for Cross-Cultural Use
v
frequency response category: never; rarely or sometimes; or often as most appropriate for our measurement purposes. While the 3I 3F scale appears to be an internally and cross-culturally valid measurement tool, the scale is much reduced from its original form. Typically, a larger set of items comprising a scale will allow for more precise measurement. The 9 items comprising the original HFIAS had been designed so that each domain perceived as integral to the access component of household food insecurity was reflected in the scale: 1) anxiety about household food supply ; 2) insufficient quality, which includes variety, preferences and social acceptability; and 3) insufficient food supply and intake and the physical consequences. The items remaining in the reduced 3I 3F scale reflect only the domain of insufficient food supply and intake and the physical consequences. We therefore defined the construct being measured by the 3I 3F scale as food deprivation and changed the name of the scale accordingly, from the HFIAS to the Household Hunger Scale (HHS). To facilitate use of the HHS at the population level, we created a categorical variable of household hunger. First we calculated a raw score scale value for each household by summing the households responses to items 7, 8 and 9 of the original HFIAS where never=0, rarely or sometimes=1, and often=2. From this, we derived three categories: little to no household hunger (scores 0-1), moderate household hunger (scores 2-3) and severe household hunger (scores 4-6). We used this categorical variable for our external validation analyses to assess the direction and strength of the association of the categorical variable with proxy measures of food insecurity. The external validation results were consistent with our analysis expectations, but as a next step we recommend that further research be carried out to test the external validity of the indicator against additional indicators of food insecurity and expected outcomes of food insecurity. Several other scales we tested appeared to have potential as measures of food insecurity within a particular context or setting; however, these scales did not show potential for cross-cultural comparability. Cross-cultural equivalence is a high level measurement criterion to achieve. To develop a tool that is culturally invariant, some cultural specificity must be lost. As a result, the HHS may not be the most sensitive measurement tool to use in every context. Other tools may provide a more culturally-specific measure of food deprivation and it is certain that other tools are required to obtain a more complete measure of food insecurity. The use of the HHS should therefore not preclude the concurrent use of a culturally-specific measure of food insecurity or food deprivation in those contexts or settings where a valid, culturally-specific measure of food insecurity or food deprivation is available, or in the process of being developed. A case in point is the recently launched Latin American and Caribbean Household Food Security Scale (ELCSA), which has been tested for internal and external validity and applied within research studies and national surveys in several countries in the Latin American and Caribbean region7
. In these settings, the HHS should not be used alone but in combination with ELCSA so that a validated measure of food insecurity can also be obtained, when survey resources allow.
CONCLUSION The HHS we recommend here addresses many of the challenges reported by users of the HFIAS. From the HFIAS field experience to-date, it appears that many of the items in the original 9 item instrument are experiences that are either culturally specific or culturally variable with respect to when the experience would be expected to manifest (i.e., at what level of food insecurity). “Worry” (item 1), for example, is not a common concept in all cultures, and if worry is experienced, it may occur at different levels of food insecurity severity across cultures. Additionally, the similarity among items 2, 3 and 4 (2: not able to eat preferred foods, 3: eat limited variety of foods, 4: eat foods that don’t want to) and the absence of specific concepts, such as meal portion (item 5) and meal frequency (item 6), in some local languages caused difficulties in the translation of several surveys. While the results from this validation study suggest the 3 items comprising the HHS are more severe conditions of household food insecurity than the 6 excluded HFIAS items, our results also suggest that 7 Pérez -Escamilla et al 2007; Bermudez et al 2010; Pérez -Escamilla et al 2009; Pérez -Escamilla et al 2008.

Validation of a Measure of Household Hunger for Cross-Cultural Use
vi
the range of severity covered by the HHS is in a policy-relevant range in settings with substantial food insecurity. In all of the HFIAS data sets collected in sub-Saharan Africa, more than 45 percent of the households in the sample were classified as having moderate or severe household hunger according to the HHS (i.e., a raw scale score > 1). In the West Bank/Gaza Strip, approximately 25 percent of households in the sample were classified as having moderate or severe household hunger. Forty percent of households in the West Bank/Gaza Strip data set had a raw scale score > 0. The results from this study suggest that the HHS provides a useful method for assessing household hunger cross-culturally, using a validated and field-practical approach. The development of the HHS has spanned nine years of exploratory, theoretic and evidence-based research, and in this last stage of validation testing, a practical tool to measure household hunger at the population level is now available. The HHS is highly relevant in the current global environment and can facilitate improved geographic targeting of food insecurity interventions and monitoring and evaluation of food security policies and programs. More broadly speaking, the HHS can help to advance evidence-based research to improve food insecurity and household hunger globally while also strengthening the ability of governments and international and national agencies to advocate for policies and programs to prevent and address household hunger.

Validation of a Measure of Household Hunger for Cross-Cultural Use
1
Introduction Governments and international and national agencies implementing food and nutrition programs need information on the population’s food insecurity to inform decision making, monitor change and evaluate impact. Often, comparative data on food insecurity are also needed. Whether it is to make comparisons about the food insecurity situation over time, between sub-groups of a population or cross-nationally, having comparable information on food insecurity enriches the interpretation and broadens the potential use of the data. Few recognized measures of food insecurity allow for making such comparisons, however, resulting in a dearth of important information needed for geographic targeting, prioritization of interventions, and cross-country evaluation of policies and programs. The gap in available information is not due to lack of interest or use for such data; the challenge is the rigor demanded of the measurement instrument used to collect the data. Comparable data on food insecurity requires the use of a common data collection instrument and a standard metric for interpreting the data. Both the instrument and metric must produce valid measures in the range of contexts in which they are applied. The measurement of food insecurity has long been a challenge.8 Although complex approaches, such as food consumption and expenditure surveys, can provide reliable and reasonably comparable information, these methods are highly quantitative, time and resource intensive, and, as a result, lack field practicality. Recently, substantial effort has been directed to the development of alternative methods for measuring food insecurity in developing countries. Some of the more common methods include the Coping Strategies Index (CSI) (in both its original and reduced form), the Household Economy Approach (HEA), the Food Consumption Score (FCS) and the Household Dietary Diversity Score (HDDS). Each of these tools provides a relatively simple method for assessing food insecurity while also fulfilling certain measurement objectives. The original CSI and HEA provide a measure of food insecurity at a community level. Due to the context-specific nature of the instruments, however, the results obtained are not comparable to data collected in other settings or among other populations.9 While the reduced form of the CSI, the FCS and the HDDS use a standardized instrument for data collection, no studies have been carried out to assess whether a standard scale metric can be used for interpreting data collected cross-culturally with the instruments.10 It is not clear, for example, that a HDDS score of 3 in one culture reflects the same level of food insecurity as a score of 3 in another culture.11 In the absence of cross-cultural validation,12
data collected using a standardized instrument cannot be reliably interpreted for comparative purposes.
Recognizing the need to increase the availability of comparable data on food insecurity, the United States Agency for International Development (USAID)-funded Food and Nutrition Technical Assistance (FANTA) project at FHI 360 initiated a multi-year activity to develop a simple, standardized method for comparablemeasurement of food insecurity at the population level. The aim was to develop a tool appropriate forgovernments and international and national agencies to use for comparison of food insecurity levels overtime, across geographic areas, among different population groups and in diverse cultural settings. The activity comprised of two phases: 1) theoretic and evidence-based development of a food insecurity measurement instrument; and 2) validation and refinement of the instrument based on empirical data. Phase 1 was carried out in collaboration with Cornell University, Tufts University, Africare and World
8 Webb et al 2006. 9 Maxwell and Caldwell 2008; SC/UK 2000. 10 Maxwell et al 2008; WFP 2008; Hoddinott and Yohannes 2002; Swindale and Bilinsky 2006b. 11 A study assessing the ability of the HDDS to predict caloric adequacy among five populations suggested that data collected in different contexts are not directly comparable (Coates et al 2007b). 12 A measurement instrument that is cross-culturally valid is also often referred to as being cross-culturally invariant or cross-culturally equivalent. For a measurement instrument to be cross-culturally equivalent there must not be important cultural differences in the meaning of the items comprising the instrument nor in the severity of those items in relation to the construct being measured, in this case, food insecurity.

Validation of a Measure of Household Hunger for Cross-Cultural Use
2
Vision, and involved consultation, research and consensus building that brought together academics, program managers, governments and donors, and led to the development of the Household Food Insecurity Access Scale (HFIAS).13, 14
Phase 2 was carried out in collaboration with the Food and Agriculture Organization of the United Nations (FAO) through the European Commission (EC)/FAO Food Security Information for Action Programme, and involved testing the internal, cross-cultural and external validity of the HFIAS using empirical data collected by governments, international and national agencies in a variety of countries and operational contexts.
This paper reports on the results of the Phase 2 activities. Results from the empirical validation of the HFIAS are reported and, on that basis, a revised, standard instrument is recommended. The paper is organized into eight sections. Section 1 describes the approach and methods used to develop the HFIAS. Section 2 provides an explanation of the statistical properties that should be met by a scale used for measurement purposes. Section 3 describes the methods used to test the internal, cross-cultural and external validity of the HFIAS and Section 4 presents the results of these analyses. Section 5 presents qualitative feedback provided by collaborators who shared HFIAS data with FANTA and FAO for validation purposes. Sections 6, 7 and 8 of the paper include a discussion of the study findings, limitations and conclusions, respectively.
13 Swindale and Bilinsky 2006a. 14 Several publications report on the activities carried out under Phase 1 activities. See, for example, Wolfe and Frongillo 2001, Coates et al 2003, FANTA 2004, Frongillo and Nanama 2004, FANTA 2005, Coates et al 2006a, Coates et al 2006b and Coates et al 2007b.

Validation of a Measure of Household Hunger for Cross-Cultural Use
3
Section 1. Development of the HFIAS 1.1 OPERATIONALIZING THE CONSTRUCT The first step in developing a measurement instrument is to establish a clear definition of the construct to be measured. Food security occurs when “all people at all times have physical and economic access to sufficient food to meet their dietary needs for a productive and healthy life.”15
This definition of food security is founded on three fundamental elements: adequate food availability, adequate access to food by all people and appropriate food utilization/consumption. Food availability is derived from domestic agricultural output and net food imports at the national level. Food access is the ability of a household to acquire sufficient quality and quantity of food to meet all household members’ nutritional requirements for productive lives. Food utilization/consumption is determined by how much a person eats and how well a person converts food to nutrients, all of which affect proper biological use of food, nutritional status and growth.
In light of the complex, multi-dimensional nature of food security, it is generally agreed that separate indicators and data collection methods are needed to assess each of the three elements underlying food security attainment.16 For the purpose of FANTA’s activity, we identified household food access as the construct of interest to measure. We based this decision on the existing gaps among food security measurement tools available. Whereas food balance sheets and anthropometric indicators provide well-established methods for attaining comparable measures of the availability and utilization components of food security,17
cross-culturally equivalent methods for assessing the access component are either unavailable or lack field practicality.
1.2 HOUSEHOLD FOOD SECURITY SURVEY MEASURE (HFSSM) APPROACH The HFIAS is an adaptation of the HFSSM, used by the United States Department of Agriculture (USDA) and other United States (US) agencies to measure the access component of food security in the US. The HFSSM approach is based on the idea that the experience of food insecurity causes predictable reactions that can be captured through a survey and summarized in a scale. Sometimes referred to as an “experiential” or “perception-based” method of collecting data on food insecurity, the approach has been used by USDA to monitor food assistance programs and estimate the prevalence of food insecurity in the US since 1995. The measure has consistently been validated as a statistically reliable and meaningful measure of food insecurity in the US.18
The HFSSM is comprised of a set of separate but interrelated items to enquire directly if the household has experienced events typical of a food-insecure household, including worry about the procurement of food and reduction of the quality and/or quantity of food consumption over the 12 months preceding the survey (Table 1).19, 20 The 18 items comprising the tool function as a scale: a household’s responses across the questions are summed (where yes = 1; no = 021
15 USAID 1992.
) and this raw score value represents the household’s food insecurity score. Predetermined cut-points on the scale’s score continuum are used to
16 FAO 2002. 17 FAO n.d.; de Onis et al 2006. 18 Nord et al 2007. 19 Nord et al 2008. 20 Although the HFSSM was designed with the primary objective of assessing food insecurity among US households during the 12 month period prior to the survey, beginning in 2005 the Economic Research Service (ERS)/USDA began also using a 30 day recall period for the full set of HFSSM questions. This enables more accurate information to be available about the level of food insecurity at the time of data collection as opposed to the level of food insecurity in the year preceding data collection (Nord et al 2008). 21 For some items, the yes/no response for scale score calculation is a transformed variable, created from more detailed information provided by the respondent (see response codes listed for HFSSM items in Table 1).

Validation of a Measure of Household Hunger for Cross-Cultural Use
4
classify each household’s food insecurity score into one of three categories: food secure, low food security, very low food security.22, 23
Table 1. HFSSM Items and Response Codes24
Recall period: 12 months Items25 Response Codes
Household Items: Worry food would run out before (I/we) got money to buy more Never, Sometimes, Often Food bought didn’t last and (I/we) didn’t have money to get more Never, Sometimes, Often Couldn’t afford to eat balanced meals Never, Sometimes, Often Adult Items: Adult(s) cut size of meals or skipped meals Yes, No Adult(s) cut size or skipped meals in three or more months26 Yes, No Respondent ate less than felt he/she should Yes, No Respondent hungry but didn’t eat Yes, No Respondent lost weight Yes, No Adult(s) did not eat for whole day Yes, No Adult(s) did not eat for whole day in three or more months26 Yes, No Child Items: Relied on few kinds of low-cost food to feed child(ren) Never, Sometimes, Often Couldn’t feed child(ren) balanced meals Never, Sometimes, Often Child(ren) were not eating enough Never, Sometimes, Often Cut size of child(ren’s) meals Yes, No Child(ren) were hungry Yes, No Child(ren) skipped meals Yes, No Child(ren) skipped meals in three or more months26 Yes, No Child(ren) did not eat for whole day Yes, No
1.3 ADAPTING THE HFSSM APPROACH To explore the possibility of using the HFSSM approach in a developing country context, FANTA initiated field studies in 2000-2003 with Tufts University and World Vision in Bangladesh and Cornell University and Africare in Burkina Faso. At each study site, a set of culturally-specific food insecurity questions were elaborated using qualitative information about the experience of food insecurity in that setting. The food insecurity questions were integrated into representative population-based surveys carried out in World Vision’s and Africare’s program area. The results demonstrated the feasibility and usefulness of the
22 Nord et al 2007. 23The ERS/USDA 2006 Report on Household Food Insecurity in the US (Nord et al 2007) describes the HFSSM classification of households into a food security category as follows: Households are classified as food secure if they report no food-insecure conditions or report only one or two food-insecure conditions. A household is classified as food insecure if three or more food-insecure conditions are reported. (Food-insecure conditions are indicated by responses of “often” or “sometimes;” “almost every month” or “some months but not every month;” and “yes”). Food-insecure households are further classified as having either low food security or very low food security. The very low food security category identifies households in which food intake of one or more members was reduced and eating patterns disrupted because of insufficient money and other resources for food. Households without children are classified as having very low food security if they report six or more food-insecure conditions. Households with children are classified as having very low food security if they report eight or more food-insecure conditions, including conditions among both adults and children. Households with children are further classified as having very low food security among children if they report five or more food-insecure conditions among children. 24 Table 1 is adapted from Table A-1 in Nord et al 2007. 25 Scale items are abbreviated to describe the main concept represented by each question. The complete wording of each item includes additional details and an explicit reference to resource limitation, e.g., “…because (I was/we were) running out of money to buy food,” or “…because there wasn’t enough money for food” (Nord et al 2007). 26 These items are asked only if the respondent replies “yes” to the previous question. The actual wording of the question is: “How often did this happen – almost every month, some months but not every month, or in only 1 or 2 months?” (Nord et al 2007).

Validation of a Measure of Household Hunger for Cross-Cultural Use
5
approach. The evidence base available from those and other similar studies27 ultimately led to the development of the HFIAS in 2006.28
Like the HFSSM, the HFIAS is comprised of a set of separate but interrelated items to assess if the household has experienced events typical of a food-insecure household. Rather than using a set of 18 items, some of which are applicable only to certain households (e.g., households with children), the HFIAS is comprised of a set of 9 items, each of which was designed to be universally and equally applicable to all households in a range of developing country settings (Table 2).29
The 9 items comprising the HFIAS were designed to capture experiences associated with varying levels of food insecurity severity and to reflect three domains perceived as central to the experience of food insecurity cross-culturally: 1) anxiety about household food supply; 2) insufficient quality, which includes variety, preferences and social acceptability; and 3) insufficient food supply and intake and the physical consequences.30
The set of HFIAS items are, like the HFSSM, intended to function as a scale, providing a single measure of the household’s ability to access food.
Table 2. HFIAS Items and Response Codes31
Recall period: 4 weeks Items Response Codes32
Household Items:
1. Worry that the household would not have enough food Never, Rarely, Sometimes, Often 2. Not able to eat the kinds of food preferred33 Never, Rarely, Sometimes, Often 3. Eat a limited variety of foods33 Never, Rarely, Sometimes, Often 4. Eat some foods that you really did not want to eat33 Never, Rarely, Sometimes, Often 5. Eat a smaller meal than you felt you needed33 Never, Rarely, Sometimes, Often 6. Eat fewer meals in a day33 Never, Rarely, Sometimes, Often 7. No food to eat of any kind in your household33 Never, Rarely, Sometimes, Often 8. Go to sleep at night hungry33 Never, Rarely, Sometimes, Often 9. Go a whole day and night without eating33 Never, Rarely, Sometimes, Often
Although the underlying approach of the HFSSM and HFIAS is the same, the intended purpose and range of application for each tool is different. Whereas the HFSSM was developed exclusively for application in the US, the HFIAS was developed with the intention of providing a cross-culturally equivalent measure of food insecurity in resource-poor areas in a developing country context. Due to these differences in intended scope, the HFIAS is distinct from the HFSSM in several ways, including the recall period used (4 weeks vs. 12 months), the inclusion in the scale of information on how often (never, rarely, sometimes, often) an item was experienced34 and a modified tabulation scheme for classifying a household’s level of food insecurity.35, 36
27 Coates 2004; Frongillo and Nanama 2004; Melgar-Quinonez 2004; Perez-Escamilla et al 2004.
28 Coates et al 2006b; Coates et al 2007b. 29 FANTA 2005. 30 Swindale and Bilinsky 2006a. 31 Coates et al 2007b. 32 In the HFIAS questionnaire, each item is administered initially as a yes/no question. If a respondent replies yes to any item, a follow up question is administered to ask how often the item had been experienced in the 4 weeks preceding the survey (e.g., Scale Item 1. In the past four weeks did you worry that your household would not have enough food? If yes: How often did this happen? Rarely (once or twice in the past four weeks); Sometimes (three to ten times in the past four weeks); Often (more than ten times in the past four weeks) (Coates et al 2007b). 33 The actual wording of this item includes explicit reference to resource limitation, e.g., “…because there was not enough food,” or “because of a lack of resources” (Coates et al 2007b). 34 Although the HFSSM also collects frequency information for some items, ultimately this information is used to create categories about whether the item was or was not experienced. The actual frequency information is not used in the scale score. Each item in the HFSSM scale score only has two possible scale values: 1 if yes or 0 if no. Due to the higher proportion of food-insecure households in the developing country context, information about the frequency with which a household reports experiencing an item was expected to provide useful information for distinguishing households from one another and determining the severity of food insecurity experienced. 35 Coates et al 2007b.

Validation of a Measure of Household Hunger for Cross-Cultural Use
6
1.4 DESIRED HFIAS MEASUREMENT PROPERTIES AND DATA USED FOR VALIDATION STUDY From the outset, FANTA identified several measurement criteria that were necessary for the HFIAS to fulfill. The tool should provide: 1) information about the current37 state of food insecurity (rather than past or future state of food insecurity); 2) statistically valid (i.e., internally valid), accurate and reliable information about prevalence of food insecurity at a population level (i.e., externally valid); and 3) directly comparable data upon use of the tool in diverse settings to enable a consistent interpretation across contexts (i.e., cross-culturally valid).38
To explore empirically the extent to which these intentions were achieved, FANTA partnered with the EC/FAO Food Security Information for Action Programme to organize and carry out a validation study of the HFIAS. The purpose of the study was to assess the performance of the HFIAS and use information from the validation analyses to revise and improve the HFIAS if necessary. From 2006 to 2008, FANTA and FAO invited governments, international and national agencies, and researchers known to have collected data using the HFIAS to participate in the validation study. As of July 2008, six collaborators had confirmed their participation in the study and shared a total of seven HFIAS data sets with FANTA and FAO (Table 3). All seven data sets were used for empirical validation, to test the internal, cross-cultural and external validity of the HFIAS. One co-author on this paper (T. Ballard) was heavily involved in the preparatory data collection activities, including linguistic adaptation for three of these surveys (Mozambique Round 1 [R1], Mozambique Round 2 [R2] and Malawi). Qualitative information about the preparatory HFIAS data collection activities undertaken, such as adaptation and translation of the HFIAS items to the local context, interviewer training and pre-testing, was collected for all datasets. This information was used to further inform and interpret the empirical results from the validation analyses.
36 The modified tabulation scheme developed for creation of categorical indicators using the HFIAS was hypothesized to be meaningful and useful in the developing country context. The methods used to validate the HFIAS do not support this tabulation method, however, and therefore we no longer recommend its use. 37 Because a 4 week recall period is used with the HFIAS, the data on food insecurity collected is, by definition, determined by events that have occurred in the past. The intention of the word “current” is therefore not to reflect the immediate present, but to differentiate from a tool that provides information about food insecurity over a very long recall period (e.g., 12 months) and therefore may no longer represent the situation in the present, and from a tool aiming to capture vulnerability to food insecurity or to predict the future food insecurity situation. 38 FANTA 2005; Coates 2006.

Validation of a Measure of Household Hunger for Cross-Cultural Use
7
Table 3. HFIAS Validation Study Collaborators and Data Sets Available for Analysis
Collaborator Name of Data Set/Survey
How Data Set Referred to in
this Report Geographic Area Represented
(Sample Size) Objective of Survey Season of Data
Collection
Dates of Data
Collection
Mozambique - FAO
FAO project funded by Belgium Survival Fund:
Protecting and Improving Household Food Security and Nutrition in HIV/AIDS-Affected Areas of Manica
and Sofala Provinces
Mozambique Round 1 (R1)
Central Mozambique: Nhamatanda and Chibabava districts in Manica Province and Gondola and Tambara districts in Sofala Province; Sampling design for the survey was stratified to allow for district-level results to be reported
(n=591)
Baseline survey to assess the nutrition and food security situation in
vulnerable areas
Pre-harvest December 2006
Mozambique - FAO FAO project funded by
Belgium Survival Fund (see above).
Mozambique Round 2 (R2)
Central Mozambique: Chibabava and Gondola districts; Sampling design for the survey was stratified to allow for district-level results to be reported
(n=299)
Assess the nutrition and food security situation of two
vulnerable districts assessed in the baseline survey (see above) in a different season
Post-harvest July 2007
Malawi - Department of HIV and AIDS and
Nutrition, and UNICEF
Malawi Vulnerability Assessment Committee (MVAC) Nutrition Survey
Malawi
North, Central and South Malawi: Karonga, Lilongwe and Lowershire
districts (n=1,161)
Assess the nutrition and food security situation in
vulnerable areas Pre-harvest December
2007
West Bank and Gaza Strip - FAO
Palestinian Public Perceptions of their Living
Conditions
West Bank/ Gaza Strip
National: urban and rural areas in the West Bank and Gaza Strip
(n=1,973)
Assess Palestinian perceptions of their living
conditions Pre-harvest April - May
2007
Kenya - Samwel Mbugua and Egerton
University: Human Nutrition
Livelihoods, Food and Nutrition Insecurity Status
of HIV Affected Households in Nakuru Municipality
Kenya
Data collected among HIV affected households in Nakuru municipality; Data
not statistically representative (n=152)
Assess the livelihood, food and nutrition insecurity status of HIV-affected households
in Nakuru Municipality
Dry season, short-rain harvest
(widespread drought at time of data collection)
January 2007
Zimbabwe - Center for Applied Social Science, University of Zimbabwe
Risk and Vulnerability Reduction in Zimbabwe: the Role of Humanitarian Food
Security Responses to HIV/AIDS
Zimbabwe HIV affected beneficiary households in
three districts (n=176)
Assess the role of humanitarian food security
responses to risk and vulnerability reduction
among beneficiary HIV-affected households
Post-harvest (widespread crop
failure) May 2007
South Africa - South Africa Human Sciences
Research Council
Greater Sekhukhune District Municipality Livelihood Survey
South Africa Greater Sekhukhune district
municipality (n=491)
Assess the nutrition and food security status in vulnerable
areas Post-harvest August 2006

Validation of a Measure of Household Hunger for Cross-Cultural Use
8
Section 2. Validation of a Multiple Item Scale: Rasch Models Validation of a multiple item scale, such as the HFIAS, requires a statistical assessment of how the scale items relate to one another and to the construct being measured – household food insecurity in this case. A variety of statistical methods are available to validate a multiple item scale, most of these based on classical test theory (CTT) or item response theory (IRT). The Rasch family of statistical models is among the more common IRT approaches and was selected for this study to assess the internal and cross-cultural validity of the HFIAS. Rasch models are a class of measurement models that use probability theory to estimate severity parameters (in this case food insecurity) for each item comprising the measurement scale and for each household administered the scale. The models are based on the idea that the construct being measured – food insecurity – exists in less and more severe forms and that the scale items also vary with regard to level of severity. The models assume that households are more likely to answer “yes” to less-severe items than to more-severe items and that items are more likely to be answered “yes” by households of more-severe food insecurity than by households of less-severe food insecurity.39 The mathematical form of the relationships assumed by the model is logistic,40
which allows both the item and household severity measures to be placed on an equal interval scale (logit-based) of the construct being measured (see Figure 1 for an example).
Figure 1. Example: Items and Households (HHs) Placed on a Logit Continuum of Food Insecurity41
Rasch models have certain advantages over CTT and other IRT models, which make them particularly appropriate for this study: 1) The severity value for each item and each household are estimated separately, resulting in item and household estimates that are sample and item independent; 2) The models are appropriate to analyze both dichotomous (yes; no) and polytomous (i.e., multiple response or rating scale, likert type response) data; and 3) Once validated, the statistical properties of the model justify summing the responses to the scale items to provide an ordinal measure of the latent trait (food insecurity in this case). Although originally developed to validate scales for educational assessment, Rasch models are increasingly used to validate scales for use in health research and to explore facets of cross-cultural
39 Bond and Fox 2001. 40 Ibid. 41 In the example shown in Figure 1, there are 9 items comprising the scale. Item 1 was the least severe item and item 9 the most severe. Three households responded to all items comprising the scale. Based on the item and household calibrations, household 2 would have been expected to reply “yes” to items estimated as less severe than its household calibration (i.e., items 1, 2 and 3). Similarly, household 3 would have been expected to reply “yes” to every item except those estimated as more severe than its calibration value (i.e., items 8 and 9). These expectations are probabilistic, not absolute. They are increasingly probable as the distance between the severity of the household and item increases. In other words, household 3 would be expected to have a higher probability of replying “yes” to item 6 than “yes” to item 7 and a higher probability of replying “no” to item 9 than “no” to item 8.
Item 1
-6.5
Item 3
-4.6
Item 4
-3.3
Item 2
-5.8
Item 6
0.2
Item 5
-1.4
Item 7
2.1
Item 8
4.1
Item 9
6.3
HH 1 -2.1
HH2 -3.8
HH 3 2.5
More Food Secure
-6 -5 -4 -3 -2 -1 0 1 2 3 4 5 6
More Food Insecure

Validation of a Measure of Household Hunger for Cross-Cultural Use
9
comparability.42 In recent years, Rasch models have also been applied widely to the validation of food security measurement scales.43, 44
A number of criteria must be met by response data in order for the raw scale score to fully represent the underlying latent trait.45
If these assumptions are not met, the scale may not be a valid measure of the construct. Key assumptions of the Rasch model include equal discrimination of items and conditional item independence (that is, independence conditional on the severity of the latent trait). To have equal item discrimination means that each item comprising the scale is associated equally strongly with the construct being measured. Conditional item independence means that the items comprising the scale are correlated, but only because of their mutual association with the latent trait. When the severity level of the latent trait is controlled for, items should be independent. One way independence can be violated is by the presence of more than one dimension in the response data.
Depending on how a scale will ultimately be used, other assumptions may also need to be verified. In the case of the HFIAS, cross-cultural equivalence is desired. To achieve cross-cultural equivalence, not only is internal and external validation of the scale required for each population on which the scale is applied, but the meaning of the scale results (that is, the objective conditions in households with the same measured severity) must also be equivalent across populations. This property is referred to as metric equivalence. Until metric equivalence is validated for a measurement instrument, it is impossible to know if data collected from two populations using the instrument can be compared in a meaningful way.
42 Smith et al 2008. 43 Melgar-Quinonez et al 2008. 44 Not only has USDA successfully validated the HFSSM administered in the US using the dichotomous Rasch model, but more recently, food security scales based on the HFSSM approach have been validated using Rasch model-based statistics in many other country settings. 45 Smith et al 2008.

Validation of a Measure of Household Hunger for Cross-Cultural Use
10
Section 3. Methods for HFIAS Validation Testing 3.1 GENERAL ANALYSIS METHODS Rarely does a measurement scale developed from a theoretic framework immediately fulfill the a priori desired measurement properties upon empirical validation. The objective of this validation study was therefore not simply to test the HFIAS in its 9 item 4 frequency (9I 4F) form, but to use the results from the validation analyses to inform revisions to the set of items and frequency categories comprising the scale so that a tool that met the established measurement criteria could be identified. This being the case, the internal and cross-cultural analysis procedures described below were applied first to the original 9I 4F HFIAS instrument. Thereafter, analyses continued iteratively. Modifications were made to the scale as indicated by results from the internal and cross-cultural analyses. Analyses to evaluate external validity were undertaken only after a scale demonstrating internal and cross-cultural validity was identified. The same validation procedures were carried out on each data set included in the study. Dichotomous HFIAS data were analyzed against the dichotomous Rasch model and polytomous46 HFIAS data against the partial credit Rasch model, both using conditional maximum likelihood (CML) estimation in SAS v9.1. A freeware SAS macro was used to calculate the severity parameters for the HFIAS data.47
Households with missing data for any of the 9 scale items were excluded from all analyses.
For the purpose of this study, it was not necessary to account for characteristics of the sampling design (e.g., cluster sampling, sampling weights) in the analyses carried out. Our aim was to make conclusions about the sample of data collected, not to report data at the population level. It was therefore not problematic that one data set (Kenya) shared for this study was collected by purposive rather than random sampling. To test the internal, cross-cultural and external validity of a measurement scale such as the HFIAS, any sizable sample from a larger population is generally suitable so long as a sufficiently-large number of observations are available for each scale item and associated frequency response. To obtain stable estimates for Rasch analyses, it is generally recommended that at least 10 observations be available for each possible scale response.48
3.2 INTERNAL VALIDATION ANALYSIS METHODS As described earlier (refer to Table 2), the HFIAS collects information about whether or not each of 9 scale items was ever experienced by the household during a 4 week recall period, as well as information about how often the household experienced each item during the recall period. For each item included in the scale, one of four frequency responses is recorded for each household: never, rarely, sometimes or often. The first step in our validation analysis was to assess if this 4-category frequency response performed adequately for the 9 scale items or if a different set of frequency responses might be more appropriate. To explore this, we analyzed the 9 scale items using the original, polytomous 4-category response variable and by collapsing the frequency categories in various ways to create a 2-category (dichotomous) and 3-category (polytomous) response variable. Scale validation using Rasch model-based analysis begins with estimation of severity parameters for each item. For dichotomous items, a single severity parameter is estimated. For polytomous items, a severity parameter is estimated for each “item-step.” An item-step is the boundary or threshold between two adjacent ordered categories (how often a food-insecure condition occurred in the case of the HFIAS). An item with n possible frequency responses has n-1 item-steps.49
46 A polytomous scale allows for more than two ordered categories of responses to the scale items (representing different frequencies of occurrence in the case of the HFIAS).
47 Christensen and Bjorner 2003. 48 Linacre 2002. 49 In some analyses, an item severity parameter is also calculated for polytomous items as the average of the item-step parameters. For purposes of this study, however, that parameter has little or no utility and is not reported.

Validation of a Measure of Household Hunger for Cross-Cultural Use
11
For efficient scale measurement, a monotonic trend of increasing item-step severity is preferred.50
This means that the severity parameter calibrated for the item-steps ascends in the same order as the cognitive meaning of the item-steps would imply. In other words, for HFIAS item 9 (whole day without eating) we would expect the severity parameter calculated for the item-steps of moving from never to rarely, rarely to sometimes, and sometimes to often to ascend monotonically: The experience of going a whole day without eating “sometimes to often” should be calibrated as more severe than going a whole day without eating “never to rarely” and going a whole day without eating “rarely to sometimes”. When there is a monotonic trend of increasing item-step severity, a scale has ordered item-steps.
Our internal validation of the HFIAS focused on the Rasch assumption of equal item discrimination. We did not evaluate the Rasch assumption of conditional item independence because the standard analytic procedures for doing so are not well adapted for food insecurity data or for scales comprised of few items. To assess item discrimination, we reviewed the item (and item-step) infit and outfit statistics for each scale tested. These were calculated from the item response matrix generated by the SAS macro that was used to estimate the partial credit model. For this, a customized SAS program was written by Mark Nord at the Economic Research Service (ERS)/USDA. Infit and outfit statistics are chi-square-type statistics that measure the difference between the model’s theoretical expectation of how an item (or item-step) should perform and the actual performance of that item (or item-step). The fit statistics are often reported in the form of an unstandardized mean square value and can be calculated for each item (and item-step) included in a scale. Infit statistics give more weight to households with a calibrated severity level close to the severity level of the item (or item-step). Outfit statistics are not weighted and are therefore more easily influenced by outlying scores.51
An item (or item-step) with perfect fit will have a mean square infit value of 1 and a mean square outfit value of 1. When all items (and item-steps) have an infit and outfit value of 1, all items and (item-steps) fit the model perfectly and therefore the measurement scale itself fits the model perfectly.
Perfect model fit occurs very rarely in practice, if ever. In light of this, the range of tolerable infit and outfit values used in a validation study warrants consideration. Scientific consensus regarding acceptable item infit and outfit values is currently lacking. Linacre52 suggests that item infits and outfits in the range of 0.5-1.5 are useful for measurement purposes, Bond and Fox53 cite 0.6-1.4 as a reasonable rule of thumb for evaluating item fits for rating scale instruments, and Nord54 suggests a range of 0.7-1.3 as desirable for instrument development. At the same time, many researchers and measurement specialists advocate that the rules for model fit cannot be rigidly established because the performance of empirical data must be evaluated independently. It is often argued that determination of model fit is largely a function of a researcher’s experience working with similar data and measurement tools and her/his independent, scientific judgment.55
What is well established is that an item (or item-step) with an infit value much above 1.5 performs poorly with respect to the expectations of the model and that an item (or item-step) with an infit or outfit value less than 0.5 is more-strongly associated with the latent trait.56 Measurement experts also tend to agree that infit statistics are of greater concern for instrument development than outfit statistics and, moreover, that underfitting items (or item-steps) (i.e., mean square values > 1) are of more concern than overfitting items (or item-steps) (i.e., mean square values < 1).57, 58
50 Casillas et al 2006; Linacre 2002; Linacre 2006.
While a high outfit may indicate an item that is
51 Bond and Fox 2001. 52 2006 53 2001. 54 Personal communication, August 10, 2009. 55 Bond and Fox 2001; Embretson and Reise 2000. 56 Ideally, all items (and item steps) are equally associated with the latent trait. When this is the case, all item (and item step) infit and outfit values are equal to 1. 57 Bond and Fox 2001; Linacre 2006.

Validation of a Measure of Household Hunger for Cross-Cultural Use
12
misunderstood by some respondents, the statistic is very sensitive to highly-improbable responses. A very-high outfit value (10 or more) can result from just two or three highly unexpected responses out of several thousand.59
Given the lack of consensus regarding acceptable infit and outfit values and the likely variable quality of data analyzed in this study60
(which can also affect fit statistics), we chose to focus on the fit statistics of greatest concern to measurement specialists: underfitting items (and item-steps) with large mean square infit values. For the purpose of our analysis, we were most concerned with identifying item (and item-step) infit values > 1.5.
3.3 CROSS-CULTURAL VALIDATION ANALYSIS METHODS Cross-cultural validation, or assessing the cross-cultural equivalence of a measure, involves testing the data collected from different populations to assess if the items (and item-steps) comprising the scale appear to refer to the same objective conditions and function the same way relative to the construct being measured (food insecurity) in each population. In measurement terms, cross-cultural equivalence exists when the internal results for scale validation are consistent among culturally- or linguistically-distinct groups of individuals. Since the Rasch model supports objective, non-sample-specific item (and item-step) parameter estimates (i.e., the estimates are not influenced by the level of food insecurity of the sample), the model is well suited for evaluating item (and item-step) equivalence for a measurement scale applied in different settings.61
To evaluate cross-cultural equivalence, item (or item-step) calibrations were compared across data sets.62 All estimates were standardized to ensure that the item (or item-step) calibrations for different data sets were on the same metric and directly comparable. The mean of the item (or item-step) calibrations for all data sets was set at 0. The average standard deviation among the item-step calibrations varied among data sets and was therefore adjusted in the standardization procedures. For all calibration standardization procedures, the first round of data collected in Mozambique63
was used as the standard.
Cross-cultural equivalence was evaluated visually by plotting the standardized item (or item-step) calibrations from different data sets against one another. Perfect equivalence is reflected when an item (or item-step) is plotted on the identity line (i.e., the diagonal axis) (see Figure 2 for an example). Items (or item-steps) that deviate substantially from the identity line are indicative of non-equivalence.
58 Casillas et al 2006 (p 477) explain this as follows: “Whereas underfitting tends to reflect poor performance of an item, overfitting items tend to reflect a higher than average correlation between the item score and household measure, which is not generally viewed as problematic in instrument development.” 59 Nord 2006. 60 Among the surveys included in this study, the data were collected for different objectives and were subject to varying levels of support in terms of resources and time availability for interviewer training and supervision of data collection. In all cases, the HFIAS was not the only data collected in the survey. The length of the full questionnaire varied greatly among the surveys carried out, as did sample size and the geographic area represented. For all of these reasons, it would be unrealistic to expect the HFIAS data included in this study to be of equal quality. 61 Casillas et al 2006; Salzerberger 1999. 62Overall item calibrations for polytomous items were not compared across data sets because they simply represent the mean of the step calibrations for each item. 63 Mozambique R1 was selected as the standard because EC/FAO (and T. Ballard, a co-author on this report) was closely involved in the development of the study design and linguistic adaptation of the HFIAS and could therefore provide detailed information about the data collection methods used. The HFIAS data for this data set were presumed to be of very-high quality because collection of the HFIAS data was a key focus for the survey. Interviewers received extensive training to ensure comprehension of the HFIAS questions and the correct method of administering the questionnaire. The data set was a logical choice as a standard because it was also the first data set contributed to the HFIAS validation study and had sufficient sample size for stable estimation of item-step parameters and infit and outfit statistics.

Validation of a Measure of Household Hunger for Cross-Cultural Use
13
Figure 2. Example: Standardized Item Calibration Plot to Assess Cross-Cultural Equivalence64
item1step1
item2step1item3step1item4step1item5step1
item6step1item7step1item8step1
item9step1item1step2item2step2
item3step2item4step2
item5step2item6step2
item7step2item8step2item9step2
item1step3item2step3item3step3
item4step3item5step3item6step3
item7step3item8step3
item9step3
popu
latio
n2
population1
3.4 EXTERNAL VALIDATION ANALYSIS METHODS Once an internally-valid and cross-culturally-invariant scale was identified, we analyzed the measure against proxy variables reflective of or related to food insecurity to assess the direction and strength of the association between the variables. All external validation analyses were completed in Intercooled Stata v9.0.
64 Figure 4 is theoretical, demonstrating perfect cross-cultural equivalence for a 9 item scale with 4 frequency responses administered to two different populations. All item-steps show the same calibration in each population, which is reflected by all item-steps being located on the identity line.

Validation of a Measure of Household Hunger for Cross-Cultural Use
14
Section 4. HFIAS Validation Results 4.1 DESCRIPTIVE STATISTICS The number of respondents replying to each HFIAS item and frequency response is shown in Table 4. In both the Kenya and Zimbabwe data sets less than 10 respondents reported “never” having experienced item 2 (not able to eat preferred foods) and less than 10 respondents reported “often” having experienced item 9 (whole day without eating). In addition, in the Kenya data set, less than 10 respondents reported “rarely” having experienced item 3 (eat limited variety of foods). For these data sets, the Rasch results for these items should be interpreted cautiously. Table 4. Number of Respondents Replying to Each HFIAS Item and Frequency Response, by Data Set65
Q1 Q2 Q3 Q4 Q5 n r s o n r s o n r s o n r s o n r s o
MozR1 (n=591) 91 169 236 95 63 174 263 91 74 154 271 92 73 150 280 88 132 156 229 74
MozR2 (n=299) 25 110 131 33 18 85 150 46 30 86 141 42 16 85 150 48 40 66 161 32
Malawi (n=1,161) 315 224 321 301 308 282 386 185 201 222 335 403 312 325 362 162 363 214 376 208
West Bank/ Gaza Strip (n=1,973)
854 402 356 361 811 399 434 329 875 364 415 319 931 361 399 282 1067 390 305 211
Kenya (n=152) 15 12 48 77 8 14 55 75 10 7 53 82 21 19 53 59 16 12 57 67
Zim (n=176) 28 19 41 88 9 11 51 105 10 13 51 102 19 24 53 80 29 20 53 74
South Africa (n=491)
129 111 168 83 111 105 181 94 119 100 186 86 113 104 183 91 120 111 172 88
(continued)
Q6 Q7 Q8 Q9 n r s o n r s o n r s o n r s o MozR1 (n=591) 148 119 257 67 208 102 220 61 255 105 182 49 291 97 160 43
MozR2 (n=299) 57 62 147 33 100 67 110 22 126 78 79 16 181 60 46 12
Malawi (n=1,161) 371 210 351 229 497 260 272 132 574 257 239 91 759 192 152 58
West Bank/ Gaza Strip (n=1,973)
1157 352 282 182 1236 297 266 174 1543 208 129 93 1586 193 116 78
Kenya (n=152) 24 14 61 53 50 33 48 21 59 43 40 10 112 29 10 1
Zim (n=176) 20 17 41 98 72 27 47 30 95 26 45 10 112 29 29 6
South Africa (n=491) 116 108 177 90 124 103 172 92 157 77 163 94 155 84 159 93
65 n = never; r = rarely; s = sometimes; o = often; Item/frequency pairs with less than 10 respondents are highlighted in grey.

Validation of a Measure of Household Hunger for Cross-Cultural Use
15
4.2 TESTING THE ORIGINAL HFIAS: 9 ITEMS, 4 FREQUENCIES (9I 4F) Validation results for the original 9I 4F HFIAS showed high infit values for item 1 (worry) (Mozambique R1 and West Bank/Gaza Strip) and for step 1 (step of moving from never to rarely) of item 2 (not able to eat preferred foods) (Zimbabwe) (see Annex1, Table A1.2). Review of the standardized item-step calibrations revealed that the step thresholds did not increase monotonically (Table A1.1). Steps 1 and 2 (the respective steps of moving from never to rarely and from rarely to sometimes) were disordered for several items in the Mozambique R1 data set, as well as in the Malawi, Kenya and Zimbabwe data sets. Step 3 (the step of moving from sometimes to often) was also out of order for several items in the Zimbabwe data set. The plots to assess cross-cultural equivalence confirmed that the 9I 4F scale did not meet the established measurement criteria (Figures A1.1-A1.6). The standardized item-step calibrations deviated substantially from the equivalence line for the Kenya/Mozambique R1 (Figure A1.4) and Zimbabwe/Mozambique R1 (Figure A1.5) comparisons. In many instances a difference of more than 3.0 logits was shown for the same item-step. 4.3 TESTING VARIOUS FREQUENCY RESPONSE CATEGORIES Before exploring the validity of scales comprised of a different (reduced) set of items, we first examined how various frequency response categories performed using the 9 item scale. We used three criteria to determine the most appropriate frequency response category to use for a revised scale: 1) monotonic item-step calibration, 2) the range of household severity measured and 3) the range of raw scale score possible. We tested two sets of alternative polytomous response categories, each using 3 frequency responses. In the first response category, we collapsed the never and rarely responses into one response so that the response category tested for each item was never or rarely, sometimes, and often. For the second response category, we collapsed the rarely and sometimes responses into one response. This resulted in the response category never, rarely or sometimes, and often.66
Three dichotomous response categories were also tested: 1) never vs. rarely, sometimes, or often; 2) never or rarely vs. sometimes or often; and 3) never, rarely, or sometimes vs. often.
Both polytomous response categories67 met the criterion of monotonic item-step calibration (Tables 5 and 6). The range of (non-standardized) household measures (in logits) for each response category tested is shown by data set in Table 7. We calculated the range as the difference between the largest and smallest household measure for each data set and scale, for raw scale scores of 1 to S-1, where S = number of scale items x (number of frequency responses for each item-1). The larger the range (from very food insecure to very food secure) the scale can measure, the more useful it is for measurement applications in which it is important to differentiate within both mild and severe ranges of food insecurity.68
Among the response categories tested, the polytomous 3F response category (with rarely and sometimes collapsed into one response) measured the broadest range of food insecurity severity. This result was consistent across all data sets. Apart from the 4F response category, the 3F response category (rarely and sometimes combined) also provides the largest possible total raw scale score. We therefore identified the 3F response category (rarely and sometimes combined) as the most appropriate to use. Accordingly, all subsequent analyses to identify the best performing scale form used this response category for all scale items.
66 The polytomous response category comprised of never, rarely, sometimes or often was not tested since the calibration results as well as the empirical item response curves (results not shown) clearly indicated the rarely response to be most problematic in terms of monotonic progression of severity calibration. 67 The alternative dichotomous response categories did not need to be evaluated for monotonicity of item steps because it is not possible to have disordered items steps when the response category is dichotomous. As explained in Section 3.2, there are, in fact, no item-steps in the case of dichotomous items. 68 Refer back to Figure 1, for an illustration of how the household measure relates to the item measures.
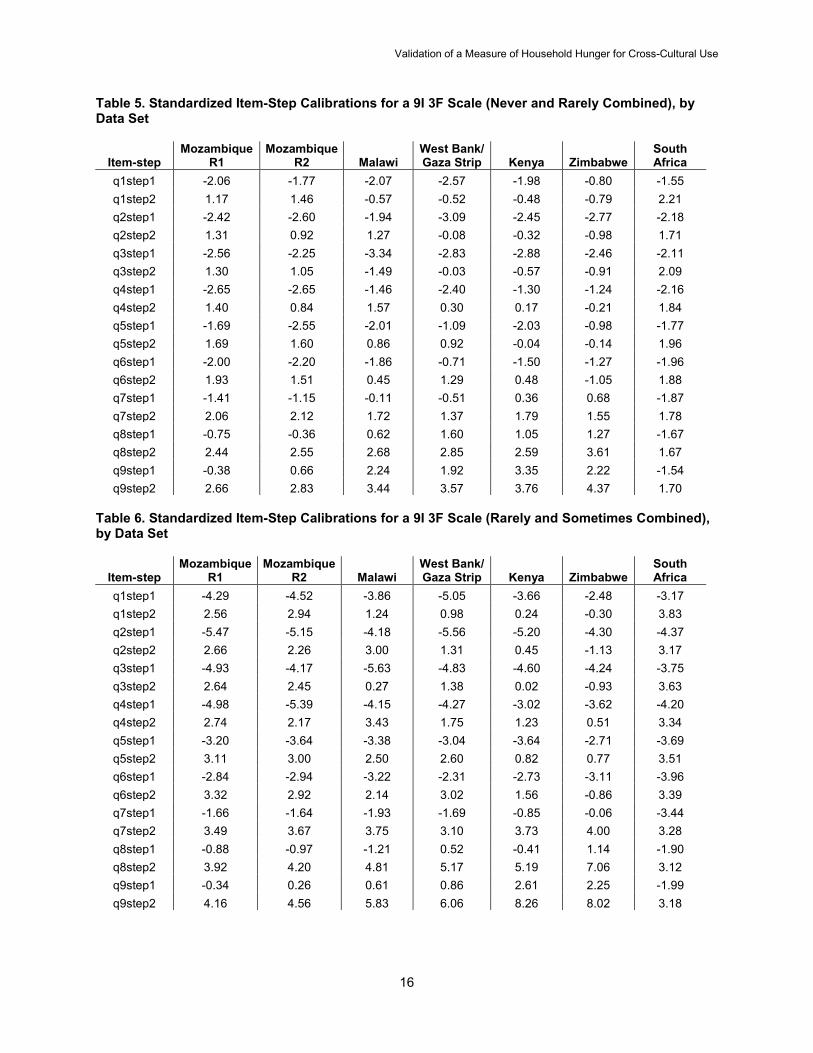
Validation of a Measure of Household Hunger for Cross-Cultural Use
16
Table 5. Standardized Item-Step Calibrations for a 9I 3F Scale (Never and Rarely Combined), by Data Set
Item-step Mozambique
R1 Mozambique
R2 Malawi West Bank/ Gaza Strip Kenya Zimbabwe
South Africa
q1step1 -2.06 -1.77 -2.07 -2.57 -1.98 -0.80 -1.55 q1step2 1.17 1.46 -0.57 -0.52 -0.48 -0.79 2.21 q2step1 -2.42 -2.60 -1.94 -3.09 -2.45 -2.77 -2.18 q2step2 1.31 0.92 1.27 -0.08 -0.32 -0.98 1.71 q3step1 -2.56 -2.25 -3.34 -2.83 -2.88 -2.46 -2.11 q3step2 1.30 1.05 -1.49 -0.03 -0.57 -0.91 2.09 q4step1 -2.65 -2.65 -1.46 -2.40 -1.30 -1.24 -2.16 q4step2 1.40 0.84 1.57 0.30 0.17 -0.21 1.84 q5step1 -1.69 -2.55 -2.01 -1.09 -2.03 -0.98 -1.77 q5step2 1.69 1.60 0.86 0.92 -0.04 -0.14 1.96 q6step1 -2.00 -2.20 -1.86 -0.71 -1.50 -1.27 -1.96 q6step2 1.93 1.51 0.45 1.29 0.48 -1.05 1.88 q7step1 -1.41 -1.15 -0.11 -0.51 0.36 0.68 -1.87 q7step2 2.06 2.12 1.72 1.37 1.79 1.55 1.78 q8step1 -0.75 -0.36 0.62 1.60 1.05 1.27 -1.67 q8step2 2.44 2.55 2.68 2.85 2.59 3.61 1.67 q9step1 -0.38 0.66 2.24 1.92 3.35 2.22 -1.54 q9step2 2.66 2.83 3.44 3.57 3.76 4.37 1.70
Table 6. Standardized Item-Step Calibrations for a 9I 3F Scale (Rarely and Sometimes Combined), by Data Set
Item-step Mozambique
R1 Mozambique
R2 Malawi West Bank/ Gaza Strip Kenya Zimbabwe
South Africa
q1step1 -4.29 -4.52 -3.86 -5.05 -3.66 -2.48 -3.17 q1step2 2.56 2.94 1.24 0.98 0.24 -0.30 3.83 q2step1 -5.47 -5.15 -4.18 -5.56 -5.20 -4.30 -4.37 q2step2 2.66 2.26 3.00 1.31 0.45 -1.13 3.17 q3step1 -4.93 -4.17 -5.63 -4.83 -4.60 -4.24 -3.75 q3step2 2.64 2.45 0.27 1.38 0.02 -0.93 3.63 q4step1 -4.98 -5.39 -4.15 -4.27 -3.02 -3.62 -4.20 q4step2 2.74 2.17 3.43 1.75 1.23 0.51 3.34 q5step1 -3.20 -3.64 -3.38 -3.04 -3.64 -2.71 -3.69 q5step2 3.11 3.00 2.50 2.60 0.82 0.77 3.51 q6step1 -2.84 -2.94 -3.22 -2.31 -2.73 -3.11 -3.96 q6step2 3.32 2.92 2.14 3.02 1.56 -0.86 3.39 q7step1 -1.66 -1.64 -1.93 -1.69 -0.85 -0.06 -3.44 q7step2 3.49 3.67 3.75 3.10 3.73 4.00 3.28 q8step1 -0.88 -0.97 -1.21 0.52 -0.41 1.14 -1.90 q8step2 3.92 4.20 4.81 5.17 5.19 7.06 3.12 q9step1 -0.34 0.26 0.61 0.86 2.61 2.25 -1.99 q9step2 4.16 4.56 5.83 6.06 8.26 8.02 3.18

Validation of a Measure of Household Hunger for Cross-Cultural Use
17
Table 7. Range of Non-Standardized Household Severity Parameters and Range of Total Raw Score Possible, by Data Set for the Frequency Response Categories Tested with a 9I Scale* Frequency response
categories: Range of total raw score possible69
Mozambique R1
Range
Mozambique R2
Range Malawi Range
West Bank/Gaza Strip Range
Kenya Range
Zimbabwe Range
South Africa Range
4F (never, rarely, sometimes, often): 26 9.8 10.4 6.4 7.7 7.1 5.8 11.5
3F (never and rarely combined): 17 8.0 8.4 5.8 7.0 7.6 7.0 8.6
3F (rarely and sometimes combined): 17 11.6 12.0 7.7 9.6 8.8 7.2 11.6
2F (never vs. all others): 8 6.5 7.2 5.0 6.9 6.5 7.0 4.8 2F (never or rarely vs. sometimes or often): 8 4.6 5.2 4.9 6.1 7.7 6.6 4.2
2F (often vs. all others): 8 4.5 5.1 4.9 6.1 6.4 6.7 4.2 *The frequency category capturing the broadest range of severity for each data set is highlighted in bold.
4.4 TESTING VARIOUS ITEM COMBINATIONS 4.4.1 9 Item 3 Frequency Scale (Rarely and Sometimes Combined) (9I 3F) Internal and cross-cultural validation analyses of the 9I 3F scale (Table 8) suggested the scale required further revision to meet the measurement criteria established (see Annex 2). The infit value for step 1 of item 1 (the step of moving from never to rarely or sometimes for item 1: worry) was higher than 1.5 in two data sets (Mozambique R1 and West Bank/Gaza Strip), which suggested the item-step deteriorated the measurement ability of the scale (Table A2.2). In addition, cross-cultural equivalence was clearly not demonstrated (see cross-cultural comparison plots for, e.g., Malawi/Mozambique R1 [Figure A2.2], Kenya/Mozambique R1 [Figure A2.4], Zimbabwe/Mozambique R1 [Figure A2.5]). Across data sets, the ordering of items 2, 3 and 4 was particularly inconsistent and the severity calibration for the steps of these items showed important differences. Several of the item-step severity differences remained greater than 3.0 logits between data sets. To assess if a modified scale, using a smaller set of items, would meet the measurement objectives set forth, we tested several alternative item sets.70 Although many of the scales tested showed reasonable internal validity for use within any one context, few demonstrated potential for cross-cultural comparability.71
The results for the two scales with the strongest potential for cross-cultural comparability are presented in Annexes 3 and 4 and discussed below.
69 Range of total raw score possible is calculated with a raw score beginning at 1 and ending at the highest raw score possible, when a response of “never” is coded as 0. Therefore, the range of total raw score possible = [number of items in scale x (number of frequency categories per item-1)] – 1. 70 These scales were identified for testing through an iterative process in which results for each scale tested were evaluated against the measurement criteria established. Once the frequency categories were identified, we identified the subset of items to test by first excluding items with infits > 1.5 and then considering exclusion of items that showed strong cross cultural variance. We hoped to identify the largest set of items possible that would allow for efficient measurement of the construct and fulfill the measurement criteria established. 71 Cross-cultural comparability is a difficult measurement property to achieve. While most of the scales tested did not meet the cross-cultural equivalence criterion of our study, several of the scales tested did meet the internal validation criteria and appeared to have potential as measures of food insecurity within a particular context or setting. The primary purpose of this study was to identify a cross-culturally equivalent measure of food insecurity, however, so those scales were not considered further here, and their external validity was not tested.

Validation of a Measure of Household Hunger for Cross-Cultural Use
18
Table 8. 9I 3F Scale
Recall Period: Four weeks Scale Items Response Codes
Household Items: Step 1 Step 2 1. Worry that the household would not have enough food Never, Rarely or Sometimes, Often 2. Not able to eat the kinds of food preferred Never, Rarely or Sometimes, Often 3. Eat a limited variety of foods Never, Rarely or Sometimes, Often 4. Eat some foods that you really did not want to eat Never, Rarely or Sometimes, Often 5. Eat a smaller meal than you felt you needed Never, Rarely or Sometimes, Often 6. Eat fewer meals in a day Never, Rarely or Sometimes, Often 7. No food to eat of any kind in your household Never, Rarely or Sometimes, Often 8. Go to sleep at night hungry Never, Rarely or Sometimes, Often 9. Go a whole day and night without eating Never, Rarely or Sometimes, Often
4.4.2 5 Item 3 Frequency Scale (Rarely and Sometimes Combined) (5I 3F) Among the stronger scales we identified was a 5 item scale comprised of items 5-9 of the original HFIAS using the 3F response category: never, rarely or sometimes, and often (Table 9). With this scale, internal validity was demonstrated across all data sets. Item-steps were ordered monotonically and item (and item-step) infit values were in the desired range (i.e., none higher than the Linacre limit of 1.5) for all data sets. Across data sets, 85 percent of infit values were within the narrow range of 0.7-1.3, and 94 percent were within the range of 0.6-1.4. While the 5I 3F scale showed potential for meaningful measurement in a variety of contexts, there were, however, limitations demonstrated with respect to cross-cultural comparability. Across data sets, the ordering of the five items and associated item-steps (as ranked by severity calibration) was inconsistent. Using the Mozambique R1 data set as the standard for comparison, reversals of one or more item-steps was apparent for five of the six other data sets: Mozambique R2, Malawi, Kenya, Zimbabwe and South Africa. For the South Africa data set the reversals involved several items and item-steps. For all other data sets, the extent of the reversals was limited and revolved around the severity calibrations for items 5 (eat smaller meal) and 6 (eat fewer meals). In the case of Mozambique R2 and Malawi, the reversal was slight, involving a reversal of order for step 2 (the step of moving from rarely or sometimes to often) for items 5 and 6. For these data sets (Mozambique R1, Mozambique R2 and Malawi), the cross cultural comparability for the 5I 3F scale was substantially improved over that demonstrated for the 9I 4F and 9I 3F scales. With the 5I 3F scale, all item-step parameters for these three data sets showed a difference < 1.3 logits (as opposed to < 2.6 logits). The Kenya and Zimbabwe data set showed more important variation in item-step calibration. In these data sets, the second step (the step of moving from rarely or sometimes to often) of items 5 and 6 was calibrated as less severe than the first step (the step of moving from never to rarely or sometimes) of item 9 (whole day without eating); whereas in all other data sets the first step of item 9 was calibrated as less severe than the second step of items 5 and 6 (by a difference of at least 1.5 logits).72
Even between the Kenya and Zimbabwe datasets, step 2 of items 5 and 6 were ordered differently. Apart from sample size or potential data quality issues, these differences suggest that the items may be interpreted or experienced differently in diverse cultural contexts.
72 In Zimbabwe, step 2 (the step of moving from rarely or sometimes to often) of item 6 (eat fewer meals) was also calibrated as less severe than step 1 (the step of moving from never to rarely or sometimes) of items 7 (no food in house) and 8 (go to sleep hungry), whereas in all other data sets the first step of items 7 and 8 was less severe than step 2 of item 6.

Validation of a Measure of Household Hunger for Cross-Cultural Use
19
Table 9. 5I 3F Scale
Recall period: 4 weeks Scale Items Response Codes
Household Items: Step 1 Step 2 5. Eat a smaller meal than you felt you needed Never, Rarely or Sometimes, Often 6. Eat fewer meals in a day Never, Rarely or Sometimes, Often 7. No food to eat of any kind in your household Never, Rarely or Sometimes, Often 8. Go to sleep at night hungry Never, Rarely or Sometimes, Often 9. Go a whole day and night without eating Never, Rarely or Sometimes, Often
4.4.3 3 Item 3 Frequency Scale (Rarely and Sometimes Combined) (3I 3F) With respect to cross-cultural validity, the best-performing scale we identified was a 3I 3F scale, which excluded items 5 and 6. The 3I 3F scale is comprised of items 7, 8 and 9 of the original HFIAS and uses the three frequency response category: never, rarely or sometimes, and often (Table 10). This scale showed reasonable internal validity and improved cross-cultural comparability. The highest item (or item-step) infit value among the data sets was 1.47 (South Africa). Although certain item (and item-step) infits appeared low (i.e., overfitting), this was also true for the 9I 3F and 5I 3F scales (Annex 2 Table A2.2 and Annex 3 Table A3.2), though to a lesser extent. With the 3I 3F scale, most of the infits tabulated were within the narrow range of 0.7-1.3 recommended by Nord73 (Annex 4 Table A4.2). In addition, the ordering of item-steps for the 3I 3F scale was consistent across nearly all data sets (the exception is the South Africa74
data set), and the comparative calibration plots revealed potential cross-cultural equivalence (Annex 4 Table A4.1 and Figures A4.1-A4.6). The cross-cultural results from Mozambique R1, Mozambique R2 and Malawi data sets were particularly consistent. Across data sets, the largest difference in severity parameter was 0.7 logits. Most item-steps were within 0.3 logits of one another.
Although output from the Rasch analyses indicated that the model convergence criterion of <0.001 was not met for the Kenya data, this is likely due to the distribution of the Kenya sample. The Kenya sample had only one observation in the “often” cell for item 9.
Table 10. 3I 3F Scale
Recall period: Four weeks Scale Items Response Codes
Household items: Step 1 Step 2 7. No food to eat of any kind in your household Never, Rarely or Sometimes, Often 8. Go to sleep at night hungry Never, Rarely or Sometimes, Often 9. Go a whole day and night without eating Never, Rarely or Sometimes, Often
4.5 APPLYING THE INTERNAL AND CROSS-CULTURAL VALIDATION RESULTS 4.5.1 Reassessing the Measurement Construct: Household Food Insecurity or Household Hunger Based on these results, we identified the 3I 3F scale as most appropriate for our measurement purposes. While several other scales showed reasonable item discrimination, the 3I 3F scale is the only scale we tested that demonstrated potential for cross-cultural equivalence. Admittedly, the 3I 3F scale is not entirely congruent with our original validation intentions. We had hoped to identify a scale with a large, yet efficient, set of items to measure the access component of household food insecurity. While the 3I 3F scale appears to be an internally- and cross-culturally-valid measurement 73 Personal communication, August 10, 2009. 74 In general, the South Africa data set showed an unusually-small amount of differentiation between items and item-steps. Given this pattern in the data set, it is not surprising that a consistent ordering with the other data sets was not achieved.

Validation of a Measure of Household Hunger for Cross-Cultural Use
20
tool, the scale is much reduced from its original form. As such, it is not clear that the items comprising the scale provide a complete measure of the original construct intended. The 9 items comprising the original HFIAS had been designed so that each domain perceived as integral to the access component of household food insecurity was reflected in the scale; these domains are: 1) anxiety about household food supply; 2) insufficient quality, which includes variety, preferences and social acceptability; and 3) insufficient food supply and intake and the physical consequences. The questions comprising the reduced 3I 3F scale reflect only one of these domains: insufficient food supply and intake and the physical consequences. This being the case, it no longer seemed correct to define the construct measured by the 3I 3F scale as household food insecurity. Instead, we defined the construct as food deprivation, or more simply as household hunger. Though we did not meet our objective of identifying a cross-culturally equivalent measure of food insecurity, it is clear that a tool to measure household hunger is not without relevance. A cross-culturally valid scale to measure household hunger provides a means to assess the more severe manifestations of food insecurity (i.e., food deprivation) and has utility to help track progress towards reducing global hunger. Moreover, our results suggest that the range of severity covered by the 3I 3F scale is in a policy-relevant range in settings with substantial food insecurity. In all of the HFIAS data sets collected in Sub-Saharan Africa, more than 60 percent of households in the sample had a raw score > 0 on the 3I 3F scale. In the West Bank/ Gaza Strip, 40 percent of households in the West Bank/Gaza Strip data set had a raw scale score > 0. In light of this perceived utility, we did not abandon our efforts to externally validate the 3I 3F scale, but did feel it important to highlight the distinction in the construct being measured. We therefore changed the name of the scale accordingly, from the Household Food Insecurity Access Scale (HFIAS) to the Household Hunger Scale (HHS), to more accurately reflect the underlying construct being measured. 4.5.2 Creating a Categorical Measure of Household Hunger To facilitate use of the HHS at the population level, we created a categorical measure of household hunger using the household raw scale score. First, we calculated the raw score scale value for each household by summing the household’s responses to items 7, 8 and 9, where never=0, rarely or sometimes=1, and often=2. We then used these raw score scale values along with the item and item-step calibrations to identify cut-points that would allow us to define a cross-culturally equivalent categorical variable of household hunger. Both conceptual and empirical results informed the cut-point decisions. Based on the range of household hunger the HHS was shown to measure, it seemed appropriate to create three categories from the range of raw score scale values possible (0 to 6). Conceptually, it was deemed important for any categorical variable developed to account for the frequency with which the items were experienced. In particular, we thought that a household that reported having experienced any item “often” should not be classified in the least severe category. So that the categories would preserve cross-cultural equivalence, we also thought it important that within the logit75
range identified for each hunger category, the same raw score scale value should be represented for each data set. Using this framework to guide our decision making, we identified cut-points between the raw score scale values of 1 and 2 (at a logit value of -3.0) and the raw score scale values of 3 and 4 (at a logit value of 0.75) as appropriate.
From the cross-cultural comparison plots for the HHS (see Annex 4, Figures A4.1-4.6), a consistent pattern of behavior was evident across data sets: Households experience hunger in a variety of ways, including having no food in the house, going to bed hungry and going a whole day without eating. As would be expected, more households report each of these experiences occurring rarely or sometimes while only a subset of households will have these experiences often. Given this response pattern, it was relatively-straightforward to create a categorical variable with three categories which accounted for the
75 Recall that the Rasch model estimates severity parameters for items (and item-steps) and households using logits as the unit of measure. Refer back to Section 2 and Figure 1 for further detail.

Validation of a Measure of Household Hunger for Cross-Cultural Use
21
frequency with which the item was experienced and, at the same time, reflected approximate cross-cultural equivalence. We named the categories “little to no household hunger” (scores 0-1), “moderate household hunger” (scores 2-3) and “severe household hunger” (scores 4-6). How this translates in terms of cross-culturally-equivalent categories is demonstrated in Figures 3-8, where the cut-points for the categorical household hunger variable are overlaid (by dotted lines) on standardized cross-cultural household measure plots, for raw score scale values of 1 to 5.76
In each figure, the household measure falls very near to the identity line, exemplifying the cross-cultural comparability of the HHS. And as desired, within each category of household hunger defined (by cut-points at -3.0 and 0.75 logits), the same range of raw scale score is included for all data sets.
Figure 3. Standardized Cross-Cultural Household Measure Plot for Raw Score Scale Values of 1 to 5, Mozambique R2 and Mozambique R1
1
2
3
4
5
-4-3
-2-1
01
23
4M
ozam
biqu
e R
2
-4 -3 -2 -1 0 1 2 3 4Mozambique R1
76 Household measures for raw scale score values of 0 and 6 are not shown because measures for the minimum and maximum raw scale score values cannot be precisely estimated with the Rasch model.

Validation of a Measure of Household Hunger for Cross-Cultural Use
22
Figure 4. Standardized Cross-Cultural Household Measure Plot for Raw Score Scale Values of 1 to 5, Malawi and Mozambique R1
1
2
3
4
5
-4-3
-2-1
01
23
4M
alaw
i
-4 -3 -2 -1 0 1 2 3 4Mozambique R1
Figure 5. Standardized Cross-Cultural Household Measure Plot for Raw Score Scale Values of 1 to 5, West Bank/Gaza Strip and Mozambique R1
1
2
3
4
5
-4-3
-2-1
01
23
4W
est B
ank
Gaz
a S
trip
-4 -3 -2 -1 0 1 2 3 4Mozambique R1
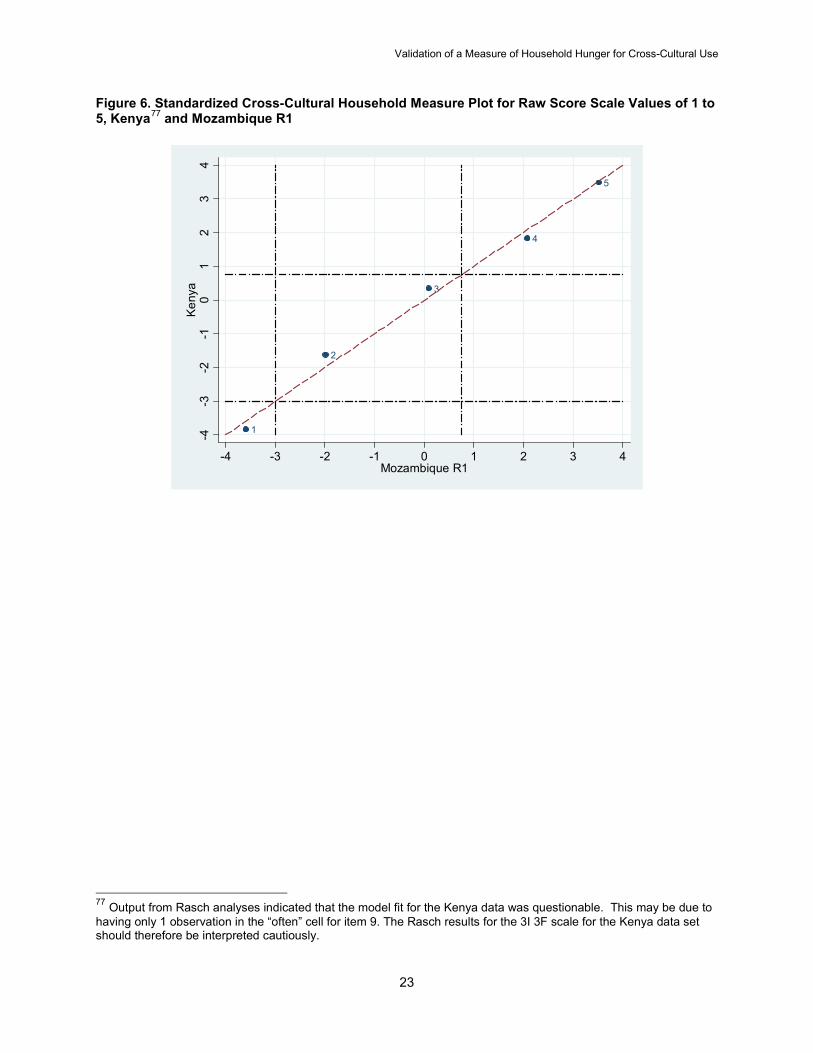
Validation of a Measure of Household Hunger for Cross-Cultural Use
23
Figure 6. Standardized Cross-Cultural Household Measure Plot for Raw Score Scale Values of 1 to 5, Kenya77
and Mozambique R1
1
2
3
4
5
-4-3
-2-1
01
23
4K
enya
-4 -3 -2 -1 0 1 2 3 4Mozambique R1
77 Output from Rasch analyses indicated that the model fit for the Kenya data was questionable. This may be due to having only 1 observation in the “often” cell for item 9. The Rasch results for the 3I 3F scale for the Kenya data set should therefore be interpreted cautiously.

Validation of a Measure of Household Hunger for Cross-Cultural Use
24
Figure 7. Standardized Cross-Cultural Household Measure Plot for Raw Score Scale Values of 1 to 5, Zimbabwe and Mozambique R1
1
2
3
4
5
-4-3
-2-1
01
23
4Zi
mba
bwe
-4 -3 -2 -1 0 1 2 3 4Mozambique R1
Figure 8. Standardized Cross-Cultural Household Measure Plots, for Raw Score Scale Values of 1 to 5, South Africa and Mozambique R1
1
2
3
4
5
-4-3
-2-1
01
23
4S
outh
Afri
ca
-4 -3 -2 -1 0 1 2 3 4Mozambique R1

Validation of a Measure of Household Hunger for Cross-Cultural Use
25
4.5.3 Sample Estimates of Household Hunger The percentage of the sample estimated to fall within each HHS category provides a relative picture of the household hunger situation for the samples of data used in this study (Table 11). Data were not analyzed to account for weights or cluster designs, therefore, these results are not representative of the populations sampled by the surveys. However, in most cases, accounting for weights in the analysis would make little difference to the results. For the Kenya data set, purposive rather than probability sampling was used. Although a sample estimate could be calculated for the data set, it is not clear what a sample estimate would mean in this case. Therefore, results for Kenya are excluded from the Table 11. While most sample estimates were consistent with our expectations, the proportion of households classified with moderate or severe hunger in the South Africa data set was higher than expected. Table 11. HHS Estimates by Data Set
Partner Data set
Little to no household hunger (%)
Moderate household hunger (%)
Severe household hunger (%)
Mozambique - FAO (n=591) Mozambique R1 42.8 46.4 10.8 Mozambique - FAO (n=299) Mozambique R2 43.1 48.8 8.0 Malawi - Department of HIV and AIDS and Nutrition and UNICEF (n=1,161) Malawi 51.9 37.2 10.9
West Bank and Gaza Strip - FAO (n=1,973) West Bank/ Gaza Strip 74.9 18.7 6.5
Zimbabwe - Center for Applied Social Science, University of Zimbabwe (n=176) Zimbabwe 51.7 33.5 14.8
South Africa - South Africa Human Sciences Research Council (n=491) South Africa 31.2 46.4 22.4
4.6 EXTERNAL VALIDATION RESULTS External validation of a measurement instrument generally implies that data collected from that instrument are tested against a gold standard measure of the construct of interest. In our case, external validation of the HHS would ideally be carried out against a “true” measure of household hunger. Food consumption and expenditure data, often considered a gold standard measure of the access component of food insecurity, could have the potential to be used as a measure of household hunger, provided the data were analyzed with this intention. However, neither food consumption nor expenditure data were available in any of the data sets used in this study, which precluded any such analyses from being undertaken. As an alternative, we thought it reasonable to assume that household hunger is integral to the broader experience of food insecurity. If this is true, we would then expect a predictable relationship (in terms of the direction of the association) between the HHS and other food insecurity variables to be demonstrated. To explore this, we used proxy measures of food insecurity or other information generally recognized as strongly correlated with measures of food insecurity and assessed the direction and strength of the association of the HHS with those variables. The variable used in each data set is shown in Table 12. Descriptions of the methods used to generate each variable are provided in Box 1.

Validation of a Measure of Household Hunger for Cross-Cultural Use
26
Table 12. Variables Used for External Validation by Data Set Partner Data set Variables Mozambique - FAO Mozambique R1 Household wealth score Mozambique - FAO Mozambique R2 Household dietary diversity score Malawi - Department of HIV and AIDS and Nutrition and UNICEF Malawi Household dietary diversity score
West Bank and Gaza Strip - FAO West Bank/Gaza Strip Household income by consumption unit Kenya - Samwel Mbugua and Egerton University: Human Nutrition Kenya NA (No appropriate variable available in
the data set shared with FANTA and FAO) Zimbabwe - Center for Applied Social Science, University of Zimbabwe
Zimbabwe Household dietary diversity score
South Africa - South Africa Human Sciences Research Council South Africa Household income by consumption unit
Box 1. Description of Proxy Variables Used for External Validation Analysis Household Wealth Score The Mozambique R1 data set collected socioeconomic information on sampled households using the “household wealth” method described by FAO.78
The variable is derived by combining information on the quality of a household’s residential structure, main source of income, possessions, land holdings and animal holdings. The method generates a household wealth score for each household. A range of scores from 0 to 11 is possible, with a higher score indicative of higher socio-economic status.
Household Dietary Diversity Score (HDDS) Three of the data sets used in this study (Mozambique R2, Malawi, Zimbabwe) collected data on the HDDS using the method described by Swindale and Bilinsky79 and FAO.80
The HDDS involves collecting information about foods consumed by household members in the day preceding the interview. A household diversity score is tabulated using information about the number of different food groups consumed by household members (out of a total of 12 possible food groups). One point is scored for each food group consumed by the household, resulting in a possible HDDS score of 0 to 12, with a higher score indicative of higher dietary diversity and, presumably, greater household food security. The HDDS has been validated as a meaningful measure of household food access. Households consuming a more diverse diet (as assessed by the HDDS) were shown to have greater access to food, as indicated by food consumption and expenditure data.81
Household Income by Consumption Unit The West Bank/Gaza Strip and South Africa data sets included a standardized household income variable, which we used for the external validation analyses. In both cases, data for the variable were collected by asking the respondent to report the average household income for the month preceding the survey. The data were recorded in ranges of 500 Shekel (NIS) in the West Bank/Gaza Strip data set and ranges of 250; 500; 1,000; 2,000; 2,500; 5,000 and 10,000 Rand in the South Africa data set (narrow ranges were used for the lower incomes reported and wider ranges were used for the higher incomes reported). In each data set, the mean of the defined range was used to calculate the household’s income per consumption unit, where a consumption unit value of 1 was given for the first adult in the household, 0.7 for each additional adult and 0.5 for all children.
78 See: http://www.foodsec.org/tr/nut/moz_diet.pdf; FAO 2008, p 6. 79 2006b; see: http://www.fantaproject.org/publications/hdds_mahfp.shtml. 80 2008; see: http://www.foodsec.org/tr/nut/guidelines.pdf. 81 Hoddinott and Yohannes 2002.

Validation of a Measure of Household Hunger for Cross-Cultural Use
27
To assess the relationship between the HHS and the proxy variables identified, we first ran simple cross-tabulations for each data set. For the proxy variables having a discrete and limited range of values possible (i.e., the household wealth score and the HDDS), we tabulated the proportion of the sample classified in each HHS category at each value of the proxy variable. For the mean household income by consumption unit variable, we tabulated the median value of the proxy variable for each category of the HHS. As described in Box 1, for all proxy variables, a higher household value was intended to represent higher household socio-economic status or less severe food insecurity. Therefore, the relationship expected for the discrete, limited-range variables was: a decreased proportion of households classified as severely or moderately hungry as the value of the proxy variable increased and an increased proportion of households classified as having little to no hunger as the value of the proxy variable increased. The relationship expected for the HHS and the mean household income by consumption unit variable was similar: a decreased median value of the proxy variable with each category of increased household hunger severity. These expected relationships were demonstrated across all data sets (Figures 9-13). Figure 9. Mozambique R1: Proportion of Households Classified in each HHS Category, by Household Wealth Score*
*Due to sample size limitations, some of the cells represented in the above figure contain very few (<5) observations. A line graph is used to illustrate the relationship between the two variables; however, it should be noted the variable on the x axis (Household Wealth Score) is not a continuous variable.
0 10 20 30 40 50 60 70 80 90
100
0 1 2 3 4 5 6 7 8 9 10 Household Wealth Score
Prop
ortio
n C
lass
ified
in H
HS
Cat
egor
y
Little to no hunger Moderate hunger Severe hunger

Validation of a Measure of Household Hunger for Cross-Cultural Use
28
Figure 10. Mozambique R2: Proportion of Households Classified in Each HHS Category, by HDDS*
*Due to sample size limitations, some of the cells represented in the above figure contain very few (<5) observations. A line graph is used to illustrate the relationship between the two variables; however, it should be noted the variable on the x axis (HDDS) is not a continuous variable. Figure 11. Malawi: Proportion of Households Classified in Each HHS Category, by HDDS*
*Due to sample size limitations, some of the cells represented in the above figure contain very few (<5) observations. A line graph is used to illustrate the relationship between the two variables; however, it should be noted the variable on the x axis (HDDS) is not a continuous variable.
0
10
20
30
40
50
60
70
80
90
100
1 2 3 4 5 6 7 8 9 10 11 HDDS
Prop
ortio
n C
lass
ified
in H
HS
Cat
egor
y
Little to no hunger Moderate hunger Severe hunger
0 10 20 30 40 50 60 70 80 90
100
1 2 3 4 5 6 7 8 9 10 HDDS
Prop
ortio
n C
lass
ified
in H
HS
Cat
egor
y
Little to no hunger
Severe hunger Moderate hunger
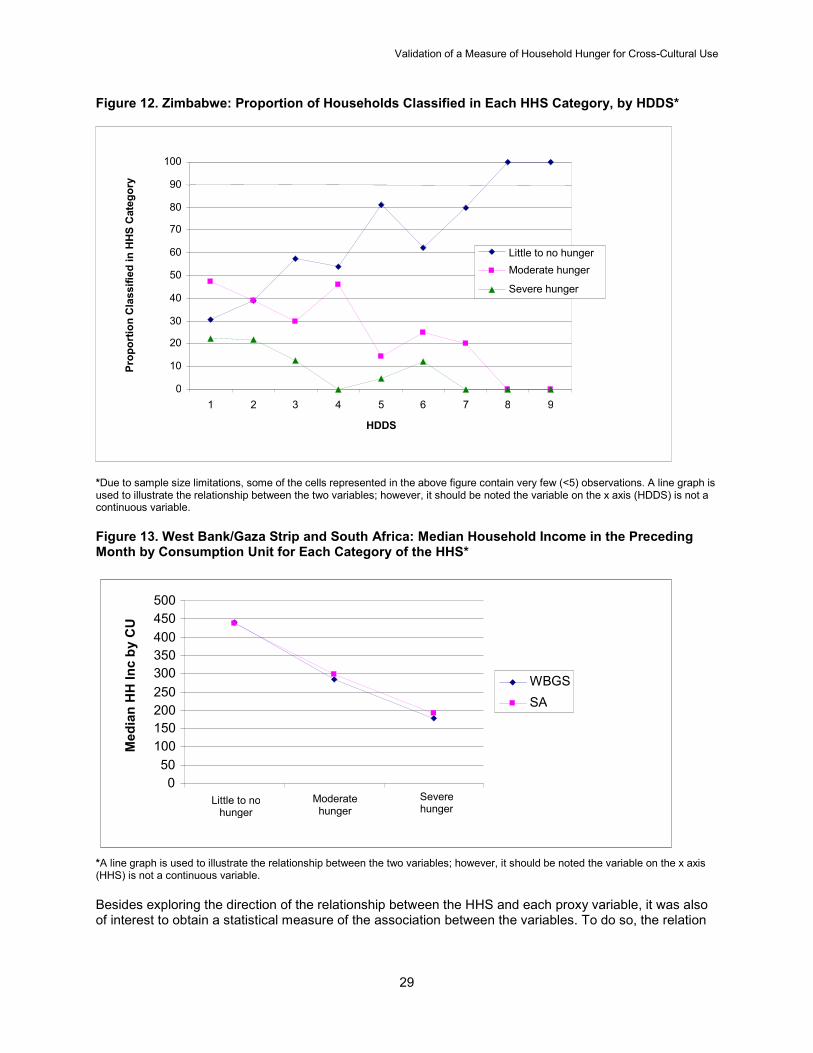
Validation of a Measure of Household Hunger for Cross-Cultural Use
29
Figure 12. Zimbabwe: Proportion of Households Classified in Each HHS Category, by HDDS*
*Due to sample size limitations, some of the cells represented in the above figure contain very few (<5) observations. A line graph is used to illustrate the relationship between the two variables; however, it should be noted the variable on the x axis (HDDS) is not a continuous variable. Figure 13. West Bank/Gaza Strip and South Africa: Median Household Income in the Preceding Month by Consumption Unit for Each Category of the HHS*
*A line graph is used to illustrate the relationship between the two variables; however, it should be noted the variable on the x axis (HHS) is not a continuous variable. Besides exploring the direction of the relationship between the HHS and each proxy variable, it was also of interest to obtain a statistical measure of the association between the variables. To do so, the relation
0 50
100 150 200 250 300 350 400 450 500
Little to no hunger
Moderate hunger
Severe hunger
Med
ian
HH
Inc
by C
U
WBGS SA
0
10
20 30
40
50
60
70 80
90
100
1 2 3 4 5 6 7 8 9 HDDS
Little to no hunger Moderate hunger Severe hunger
Prop
ortio
n C
lass
ified
in H
HS
Cat
egor
y

Validation of a Measure of Household Hunger for Cross-Cultural Use
30
of the HHS to each proxy variable was assessed using a simple multinomial logit regression model,82
where the categorical HHS was regressed on the proxy variable available in each data set. The advantage of using a multinomial logit model over the more familiar logistic model for these analyses is that the strength of the association of the proxy variable with each distinct category of the HHS could be assessed. With logistic regression, it would only have been possible to assess the relationship of each proxy variable with a reduced dichotomized form of the HHS.
With the least-severe category of the HHS (i.e., little to no hunger) defined as the base outcome against which comparisons were made, we expected the independent proxy variable in the multinomial logit regression model to have progressively-decreasing coefficients with increasing severity of the HHS categories. In each data set and for all proxy variables tested, a statistically-significant association (p ≤ 0.001 for all models) was observed with each HHS category (Table 13). All relationships were in the expected direction, and for each increasing HHS level of severity, there was a progressive decrease in the coefficient of the independent variable. Although the independent variables did not account for a large proportion of the variability in the HHS, as indicated by the low pseudo R-square values, this is not surprising, given that all independent and dependent variables used in this analysis were proxy rather than gold standard measures, and that, in each case, the pair of variables analyzed represent different underlying constructs. Table 13. Simple Multinomial Logit Regression Results: HHS Regressed on Food Insecurity Proxy Variable, by Data Set
Independent Proxy Variable Data set Dependent Variable Household Hunger Scale Model Results
Moderate Hunger vs. Little to No Hunger Coefficient (95% CI), Odds Ratio, P value
Severe Hunger vs. Little to No Hunger Coefficient (95% CI), Odds Ratio, P value
LR Chi Square, Prob > Chi Square Pseudo R-Square
Household “wealth score”
Mozambique R1 n=591
-0.293 (-0.385, -0.201) 0.746, P < 0.001
-0.469 (-0.632, -0.306) 0.626, P < 0.001
61.79, p < 0.001 0.0544
HDDS
Mozambique R2 n=299
-0.468 (-0.635, -0.301) 0.626, P < 0.001
-1.030 (-1.485, -0.575) 0.357, P < 0.001
53.16, p < 0.001 0.0971
Malawi n=1,160
-0.273 (-0.345, -0.201) 0.761, P < 0.001
-0.671 (-0.828, -0.515) 0.511, P < 0.001
134.13, p < 0.001 0.0608
Zimbabwe n=175
-0.380 (-0.603, -0.157) 0.684, P = 0.001
-0.619 (-0.978, -0.260) 0.538, P = 0.001
22.56, p < 0.001 0.0650
Household income (in thousands) in the preceding month, by consumption unit
West Bank/Gaza Strip n=1,895
-0.618 (-0.890, -0.347) 0.539, P < 0.001
-2.930 (-3.812, -2.047) 0.053, P < 0.001
92.44, p < 0.001 0.0348
South Africa n=486
-1.228 (-1.761, -0.695) 0.293, P < 0.001
-3.231 (-4.351, -2.112) 0.040, P < 0.001
66.35, p < 0.001 0.0647
82 Despite the ordinality of the HHS food insecurity categories, we chose not to use an ordinal model for this analysis due to concerns that the assumption of parallel slopes would be violated (Long and Freese 2006).

Validation of a Measure of Household Hunger for Cross-Cultural Use
31
Section 5. HFIAS Qualitative Feedback Apart from the challenge of developing a tool that could capture the experience of food insecurity similarly in different cultures are the difficulties in administering the tool in different contexts while still maintaining the original meaning of the questions comprising the tool. Aware of this challenge, in 2006 FANTA published an HFIAS data collection guide. The guide recommended that a qualitative adaptation process be carried out any time the HFIAS was administered in a new language, setting, or culture. This adaptation process was seen as an essential step to ensuring that each item could be clearly and consistently understood by respondents, while, at the same time, also retaining the intention of the original item.83
However, at that time, there was no experience using the 9 HFIAS items together as a scale or in putting into practice the adaptation guidelines developed. To address this gap, FANTA carried out a two country study to assess the clarity of the 9 HFIAS items and evaluate the adaptation guidelines that had been developed. The reports of the resulting field work described a number of difficulties in adapting the HFIAS tool to the Kenyan84 and Malawian context.85
Some of these difficulties concerned a lack of clarity among study investigators regarding the original intention of the HFIAS items. Other difficulties related to finding words to accurately convey the original concept of an item in a different language and culture. The reports confirmed the importance of using focus groups and key informants to ensure that the items included in the scale are communicated accurately and in a culturally relevant way.
In light of the adaptation and translation difficulties noted during the Kenya and Malawi field work, it was deemed both useful and important to obtain qualitative feedback from validation collaborators about the clarity and relevance of the HFIAS items. Collaborators contributing data to this validation study were therefore asked to complete a standard feedback form (Appendix), in which they were requested to provide information on any adaptation, translation, and pre-testing of the HFIAS undertaken prior to data collection. The approximate time86
dedicated to each of these tasks is shown below in Table 14. Specific cultural nuances identified at any time during the adaptation, translation, pre-testing, training, or data collection process are reported in Table 15 for the seven data sets included in this study.
83 Coates et al 2006b; Coates et al 2007b. 84 The Kenya site selected for the adaptation study is different from the site at which the Kenya data used in this validation study were collected. 85 Mwangi and Mbera 2006; Mtimuni and Geresomo 2006. 86 The data reported in table 14 was reported to FANTA and FAO by the collaborators who organized data collection for the respective surveys and shared the data with FANTA and FAO for HFIAS validation purposes. The time estimates reported in table 14 should be considered as anecdotal given that the information was obtained retrospectively, long after data collection for the survey had already been completed.

Validation of a Measure of Household Hunger for Cross-Cultural Use
32
Table 14. Time Dedicated to Preparatory HFIAS Data Collection Activities by Data Set
Collaborator Data set
Preparatory HFIAS Data Collection Activity
Total Time
Focus Group/Key Informant
Qualitative Work “Adaptation” Translation
Interviewer Training Pre-Testing
Refining Item Wording
Mozambique - FAO Mozambique R1 and R287 16 hr/1 language 8 hr/1 language 8 hr/1 language 8 hr/1 language 4 hr/1 language 44 hr/1 language
Malawi - Department of HIV and AIDS and Nutrition and UNICEF
Malawi 32 hr/2 languages 16 hr/2 languages 8 hr/2 languages 24 hr/2 languages 8 hr/2 languages 88 hr/2 languages
West Bank and Gaza Strip - FAO
West Bank/Gaza Strip not carried out carried out,
time not provided carried out,
time not provided carried out,
time not provided not carried out time not provided
Kenya - Samwel Mbugua and Egerton University: Human Nutrition
Kenya carried out, time not provided
carried out, time not provided
carried out, time not provided
carried out, time not provided
carried out, time not provided time not provided
Zimbabwe - Center for Applied Social Science, University of Zimbabwe
Zimbabwe 4 hr/1 language 1 hr/1 language 3 hr/1 language 1 hr/1 language 2 hr/1 language 11 hr/1 language
South Africa - South Africa Human Sciences Research Council
South Africa not carried out carried out, time not provided
carried out, time not provided
carried out, time not provided not carried out time not
provided
87 Since the Mozambique R2 data were collected in two of the same four districts as the Mozambique R1 data, additional adaptation of items was not undertaken for R2 data collection.

Validation of a Measure of Household Hunger for Cross-Cultural Use
33
The feedback from study collaborators highlighted the substantial variation in the preparatory HFIAS data collection activities undertaken for the data sets used in this study (Table 14). For five of the seven data sets, adaptation work with key informants or focus groups was carried out, however, the time devoted to carrying out the adaptation work varied greatly. The difference in the time allocated to these tasks is likely a reflection of the extent to which the HFIAS data were a priority outcome for the survey at hand. As noted earlier, the data sets included in this study were collected for different objectives. For some surveys, the HFIAS data was of particular interest (e.g., Mozambique R1, Mozambique R2, Malawi) and therefore, with technical assistance from FAO, a generous amount of time was devoted to the preparatory HFIAS data collection activities. For many of the other surveys, the length of the questionnaire was long and, therefore, the HFIAS received relatively less focus in the preparatory data collection activities. This point is clearly demonstrated by the West Bank/Gaza Strip and South Africa data sets, for which the questionnaires were much more extensive than for the other data sets included in this study, and no HFIAS adaptation work was undertaken prior to data collection. Collaborators reported comprehension difficulties for many of the original HFIAS items (Table 15). Some of the items were reported to be repetitive and difficult to distinguish from one another. Items 2 (not able to eat preferred foods), 3 (eat limited variety of foods) and 4 (eat foods that do not want to) were particularly problematic in this regard (Mozambique R1 and Mozambique R2). There were also many problems distinguishing items 5 (eat smaller meal) and 6 (eat fewer meals). Based on the information reported by the partners, “smaller” and “fewer” are difficult words to distinguish in many languages (Malawi and Zimbabwe), and the absence of specific concepts such as meal portion and meal frequency can cause difficulty in clearly communicating the meaning of these items in certain cultures. In addition, to some respondents, it was unclear that the items referred to both staple and non-staple foods (Malawi, item 1: worry; Kenya, item 2: not able to eat preferred foods; Malawi, item 7: no food in house). In some cases, problematic items were adapted to mean different things: In the Mozambique R1 and Mozambique R2 data sets, item 4 (eat foods that do not want to) was adapted to refer to socially-unacceptable foods, whereas in Malawi and Kenya the adaptation was made to refer to foods either socially unacceptable or personally unacceptable. In Kenya, item 1 (worry) was adapted to refer to worry about a monotonous diet, whereas the intent expressed in item 1 is more about quantity, regardless of whether the diet was monotonous or not. In many ways, the collaborator feedback confirmed the results of the empirical cross-cultural validation analyses reported in Section 4. Comparing the earlier cross-cultural validation results with the feedback reported in Table 15, many of the discrepant orderings and differences in severity calibrations can be qualitatively explained. The feedback clearly indicated that some of the original 9 HFIAS items could not be made distinct from one another in local languages and were therefore ambiguous in their current expression. In some cases, the items expressed unfamiliar concepts, which were difficult to communicate in certain languages. For other items, local adaptation led to different specifications being made to the item, and therefore scales with those items included would not be expected to demonstrate cross-cultural equivalence with other data sets. These qualitative issues concerning the clarity, expression, comprehension and relevance of the items helps to explain the lack of consistent ordering of items 1 thru 6 in the cross-cultural calibration plots for the 9I 4F, 9I 3F and 5I 3F scales. At the same time, the qualitative feedback provides supporting evidence for the stronger potential of items 7 (no food in house), 8 (go to sleep hungry) and 9 (whole day without eating) to perform similarly across cultures, given that fewer issues related to clarity, expression, comprehension and relevance were reported for these items.

Validation of a Measure of Household Hunger for Cross-Cultural Use
34
Table 15. Collaborator Feedback Regarding the Adaptation88
and Translation of the Original 9 HFIAS Items to a Specific Survey Context
Collaborator Data set
HFIAS Item Number 1
Worry that the house-hold would
not have enough food
2 Not able to eat the kinds of
food preferred
3 Eat a
limited variety
of foods
4 Eat some foods that you really did not want to
eat
5 Eat a smaller meal than you
felt you needed
6 Eat fewer meals in a
day
7 No food to eat of any kind in your
household
8 Go to sleep at night hungry
9 Go a whole
day and night without eating
Mozambique - FAO
Mozambique R1 and R289
Difficulty distingui-
shing items 2, 3 and 4; the items were felt to be
too similar
Added language to emphasize that
the item was referring to "foods
not socially acceptable"; this was done partly to
try to better distinguish the
item from item 2
Malawi - Department of HIV and AIDS and Nutrition, and UNICEF
Malawi
Added a probe to
clarify that the item
referred to both staple and non-
staple foods
Needed to clarify that the
item referred
to variety and not quantity
Added a probe to clarify that the
item was referring to food eaten only when there are no other foods to eat
Added a probe to clarify that the
item was referring to whether the
amount eaten was less than the amount people in
the household would want to eat
This was the most problematic item for
this data set. In Chichewa there is no
word for meal frequency, which
caused the meaning of the item to be confused
with quantity. Considerable probing was necessary. The question had to be
administered by first asking the usual
number of times the household eats in a
day.
Added a probe to clarify that the item referred to both staple and non-staple foods
Added language to the
item to emphasize that the reason for going to bed hungry was
food shortage and not, for
example, loss of appetite
Added language to the item to emphasize
that the reason for not having
eaten was food shortage and not, for
example, loss of appetite
West Bank and Gaza Strip - FAO
West Bank/Gaza
Strip
No difficulty or problems reported for any item
Note: Adaptation of items was not undertaken in this survey.
88 For the two surveys that did not undertake adaptation of the HFIAS items (West Bank/Gaza Strip and South Africa), no item problems were reported; however, in these cases, it is likely that there were undiscovered problems in item interpretation across the households sampled. The lack of opportunity to systematically investigate the need to adapt the items may have precluded the gaining of knowledge about the difficulties and nuances inherent in understanding the items. 89 Since the Mozambique R2 data were collected in two of the same four districts as the R1 data, further adaptation of items was not undertaken.

Validation of a Measure of Household Hunger for Cross-Cultural Use
35
Collaborator Data set
HFIAS Item Number 1
Worry that the house-hold would
not have enough food
2 Not able to eat the kinds of
food preferred
3 Eat a
limited variety
of foods
4 Eat some foods that you really did not want to
eat
5 Eat a smaller meal than you
felt you needed
6 Eat fewer meals in a
day
7 No food to eat of any kind in your
household
8 Go to sleep at night hungry
9 Go a whole
day and night without eating
Kenya - Samwel Mbugua and Egerton University: Human Nutrition
Kenya
This item was adapted to
reflect worry about a
monotonous diet
Some respon-dents
interpreted a preferred food as a special treat.
This item was unclear because it
was noted that non-preferred
could be interpreted as
either culturally not preferred or
personally disliked.
Some confusion was reported for items 7, 8 and 9.
Some respondents felt
that lack of money or resources to
acquire food can be described as
having no food at all. Others thought reasons to have
no food were illness or time.
Most respondents agreed that
going to sleep hungry would
be the result of having too little
food for household
members, and the young are given priority,
leaving adults to sleep hungry.
This item was felt to reflect
that food availability is a daily pursuit, dependent on the resources secured for
that day.
Zimbabwe - Center for Applied Social Science, University of Zimbabwe
Zimbabwe
This item was difficult to explain
in the local language. The item has a very similar meaning to item 6 (i.e.,
fewer and smaller mean same thing)
This item was adapted so that the word "skip
meals” was used instead of fewer meals.
South Africa - South Africa Human Sciences Research Council
South Africa No difficulty or problems reported for any item
Note: Adaptation of items was not undertaken in this survey.

Validation of a Measure of Household Hunger for Cross-Cultural Use
36
Section 6. Discussion This study aimed to evaluate whether the HFIAS was an internally-, cross-culturally- and externally-valid instrument for assessment of the access component of household food insecurity. We first evaluated whether the original 9I 4F HFIAS tool could fulfill the a priori desired measurement properties and, upon evidence that it could not, used the results from fitting the empirical data to the Rasch model to identify a revised instrument that could. Of the various scales tested, we identified the 3I 3F HHS (Table 10) as having the most potential to achieve internal, cross-cultural and external validity. With the HHS, consistent item-step ordering was demonstrated in all but one data set tested (South Africa), the standardized household measure showed cross-cultural comparability and, across data sets, there was evidence of external validity. An acceptable level of internal validity was also demonstrated for the HHS. However, these validation results were more convincing for some data sets than for others, and this warrants some discussion. The lack of differentiation of item-step calibrations in the South Africa data set is of particular note. There was very little separation between the severity calibrations of step 1 (moving from never to rarely or sometimes) of item 8 (go to sleep hungry) and step 1 of item 9 (whole day without eating). The severity calibration of step 2 (moving from rarely or sometimes to often) of items 7 (no food in house), 8 (go to sleep hungry) and 9 (whole day without eating) were also not well differentiated. In item response theory, such a finding is often the result of ambiguous response patterns. When there are not clear patterns among households (in terms of the probability of responding to each item and item frequency), the ability of the measurement tool to predict the outcome of interest with accuracy and for a broad range of severity is precluded. As already mentioned, this lack of calibration differentiation in the South Africa data set also resulted in an ordering of items and item-steps slightly different from the consistent pattern demonstrated across the other data sets. A result that warrants further investigation is the tendency for the items and item-steps in the HHS to overfit the model (i.e., fit statistics < 1, which indicates the item or item-step is performing better than expected by the model). In several data sets, there were items with infit values below the 0.7 level, but Zimbabwe was the only data set showing an infit value below 0.5. Since the acceptable range for infit values is not well established and overfit items (and item-steps) are not generally viewed as problem items in instrument development, we did not interpret the overfitting items (and item-steps) for the Zimbabwe data set as strong evidence against the overall internal validity of the HHS.90
We also note that the low infit values for the Zimbabwe data set were for item 9, which had fewer than 10 respondents reporting the often category. However, overfit can also result from conditional dependence of two items (or item-steps), and this possible threat to internal validity should be investigated as additional data are collected.
To try to get a better sense of the quality of the data sets contributed to this study, we collected information on the number of days spent in preparatory activities related to adaptation, translation, pre-testing and training related to the HFIAS items. The greatest time devoted to these activities was for the Mozambique R1, Mozambique R2 and Malawi data sets because of FAO’s technical assistance to the projects for which data were being collected. One key question that this study aimed to answer is whether some form of the HFIAS could be empirically validated as a tool appropriate for comparative purposes. Could a form of the HFIAS be identified that would be valid for use among diverse populations and cultures and capable of providing culturally-equivalent measurement of food insecurity so that meaningful comparisons between populations in diverse cultures and settings could be made? Diverse populations and geographic settings were represented in the data sets analyzed for this validation study. Across collaborators, the HFIAS data were collected from urban and rural populations,
90 Casillas et al 2006; Linacre 2006.

Validation of a Measure of Household Hunger for Cross-Cultural Use
37
HIV-affected and non-HIV-affected households, and populations living in conflict and non-conflict areas. The cross-cultural comparison plots suggested that the items and frequency response categories comprising the HHS hold similar meaning across these settings. This was further reflected in the standardized household measures calculated for the raw score scale values (refer back to figures 3-8). Many of the longer scales we analyzed demonstrated potential as an internally-valid measurement scale for use within any one setting. Those scales have certain advantages over the HHS. Typically, a larger set of items comprising a scale will allow for more precise measurement of the construct of interest. In our case, a larger set of items might also reflect a broader set of food insecurity domains, allowing for a more complete measure of household food insecurity than is possible with the HHS. However, these longer scales had the limitation of not meeting the criterion of cross-cultural comparability. To identify an internally-, cross-culturally- and externally-valid scale of food insecurity, further studies, perhaps using a more expansive or different set of initial items, would be required. The trade-off between an intra-cultural instrument and a cross-cultural instrument on the other should be made explicit.91
Cross-cultural equivalence is a high-level requirement for a measurement instrument. To develop a tool that is culturally invariant, some cultural specificity must be lost. As a result, the HHS may not be the most sensitive measurement instrument to use in every context. Other tools may provide a more culturally-specific measure of food deprivation, and it is certain that other tools are required to obtain a more complete measure of food insecurity. Therefore, the use of the HHS should not preclude the concurrent use of a culturally-specific measure of food insecurity or food deprivation in those contexts or settings where a valid, culturally-specific measure of food insecurity or food deprivation is available, or in the process of being developed.
Operational guidance for collection and tabulation of the HHS is forthcoming and will replace the guidance that has previously been available for the HFIAS. In the meantime, we provide some preliminary recommendations here about use of the 9I 4F HFIAS, the 3I 3F HHS and other versions of the HFIAS evaluated in this report (i.e., the 9I 3F scale and the 5I 3F scale). As discussed in Section 2, meaningful use of a food insecurity (or hunger) scale in any one setting requires that the scale be internally valid in that setting. FANTA-2 will therefore not continue to recommend use of the 9I 4F HFIAS unless analyses can be undertaken to validate the internal validity of the scale in the particular setting where it has been applied. At the same time, we recognize that it is important and useful to have a complete measure of food insecurity. A case in point is the recently launched Latin American and Caribbean Household Food Security Scale (ELCSA- Escala Latinoamericana y del Caribe de Seguridad Alimentaria).92 In 2007 researchers launched the 16-item ELCSA through a coordinated Regional effort. Since then, ELCSA has been tested for internal and external validity and applied within research studies and national surveys in Mexico, Colombia, Ecuador, Guatemala, El Salvador, Honduras, Nicaragua and Haiti.93 Initial reports from these countries show positive findings in terms of the internal and external validity of ELCSA in measuring food insecurity at the local and national level. They also show the value that these measurement efforts can have for policy makers. Furthermore, a comparative analysis using Rasch modeling shows comparability of most measurement items across two of the largest countries in the Region.94
The ELCSA project built upon the USA, Brazilian and Colombian national household food security measurement efforts as well as the work that was undertaken to develop the HFIAS1. In these settings in the Latin America and Caribbean region, the HHS should not be used alone but in combination with ELCSA so that a validated measure of food insecurity can also be obtained, when survey resources allow.
In this study, a 9I 3F scale demonstrated acceptable internal validity for several data sets. However, since the internal validity results for the 9I 3F scale were not consistent across settings, we cannot recommend the use of the 9I 3F scale for all settings. While the 5 item 3 frequency scale demonstrated acceptable internal validity across all settings, the scale does not provide a replacement for what the HFIAS had
91 Salzerberger 1999. 92 Pérez -Escamilla et al 2007. 93 Bermudez et al 2010; Pérez -Escamilla et al 2009; - Pérez Escamilla et al 2009; Pérez -Escamilla et al 2008. 94 Melgar Quinonez et al 2010.

Validation of a Measure of Household Hunger for Cross-Cultural Use
38
intended to measure as it - like the 3I 3F HHS - does not capture all domains identified as universally integral to the experience of food insecurity. Researchers with specialized IRT analytic skills may wish to collect data using the 9I 4F, 9I 3F, 5I 3F, or an alternative scale to assess if a longer scale would be internally valid for the setting in which the scale is applied. The 3I 3F HHS is, however, the indicator that should be used for cross-cultural comparison as this is the only scale indicated in this study to be culturally invariant. The HHS that we recommend here addresses many of the challenges reported by users of the original HFIAS. From the HFIAS field experience to date, it appears that many of the items in the original 9 item instrument are experiences that are culturally rooted, either in their manifestation or when the experience is likely to manifest (i.e., at what level of food insecurity severity). “Worry”, for example, (item 1) is not a common concept in all cultures, and if worry is experienced, it may occur at different levels of food-insecurity severity in different cultures. Additionally, the similarity among items 2, 3 and 4 (2: not able to eat preferred foods, 3: eat limited variety of foods, 4: eat foods they don’t want to) and the absence of specific concepts, such as meal portion (item 5) and meal frequency (item 6), caused difficulties in the translation of several surveys. The qualitative feedback on items 1 thru 6 corroborates the cross-cultural comparability results we obtained through quantitative analysis. As discussed in Section 4, the results of the empirical analysis indicated that items 1 thru 6 (1: worry, 2: not able to eat preferred foods, 3: eat limited variety of foods, 4: eat foods that don’t want to, 5: eat smaller meal, 6: eat fewer meals) perform weakest with respect to cross-cultural comparability, whereas items 7, 8 and 9 (7: no food in house, 8: go to sleep hungry, 9: whole day without eating) were shown to have important consistencies across data sets in terms of the ordering of the item-steps and the standardized calibration value. Based on these results, it appears that items 7, 8 and 9 are likely to be experienced by “hungry” households in most cultural and geographic settings and in the same order of progression when coping with household food deprivation. Critics of the approach used in the HFIAS and HHS – i.e., “experiential” or “perception measures” – argue that respondents may exaggerate their responses with the expectation that they will then be eligible for aid, and therefore the data obtained by the method is biased and unreliable. This is a legitimate concern, common to most data collection tools dependent on respondents’ self-report of information (including other methods to assess food insecurity) and one that warranted attention upon the initial adoption of the approach both in the US and a developing country context. However, as of 2010, to our knowledge, no validation study has confirmed the presence of this problem, either in the US or a developing country context. This study provides corroborating evidence for the absence of an “exaggeratory effect”. The variables used for the external validation procedure, while not gold standard food consumption or food expenditure data, were reasonable proxy indicators of food insecurity. As shown in Figures 9-13, the HHS categories were substantially associated with the other variables tested and in the expected direction for all data sets. Furthermore, with exception again of the South Africa data set, the prevalence estimated for the three categories of household hunger appear to be plausible. Given the lack of differentiation in item-step calibrations for the South Africa data set, it is not surprising that the HHS sample estimate of household hunger is not in line with expectations for this data set. It is possible that the HFIAS items in this survey were not well understood by respondents. The lack of adaptation that was undertaken in preparation of data collection provides some support for this possibility.

Validation of a Measure of Household Hunger for Cross-Cultural Use
39
Section 7. Limitations There are important limitations to this study and these should be recognized. First, the range of data sets on which the validation analyses could be carried out was limited to those contributed to the study. We cannot claim, therefore, that the data tested in this study are reflective of all contexts. Among the seven data sets used for validation, there was diversity in terms of geographic setting and cultural context. Still, the data sets were limited to areas within sub-Saharan Africa with the exception of the West Bank/Gaza Strip data set. While our data suggest the HHS is substantially invariant across cultures, this cannot be assumed for every culture. Differences in translation or characteristics unique to a particular context could render the items or frequency responses incomparable across cultures. The cross-cultural validity of the HHS should therefore continue to be evaluated as data are collected in an increasing number of contexts. Second, we focused our internal validation solely on the Rasch assumption of equal item discrimination. We did not assess the Rasch assumption of conditional item independence95
. We recognize the lack of full internal validation of the HHS as an important limitation of this study. As new analytic methods become available to assess the conditional item independence in scales comprised of few items, it will be important to assess the full internal validity of the HHS.
The third limitation of this study concerns the external validation analysis. No data set included in the study had food consumption or food expenditure data, which might have provided the opportunity to validate the HHS against something more nearly approaching a “gold standard” indicator of food security. Instead, we were limited to assessing associations of household hunger with more distal proxies for food insecurity, such as household dietary diversity and household income. While the results from the external validation analyses supported our analysis expectations, as a next step, we recommend that research studies be carried out to better test the external validity of the indicator against measures of food expenditure, food consumption and nutritional status. These associations will not only provide information about the validity of the measure, but will indicate the extent to which the HHS could substitute for other measures that are more costly and time- and labor-intensive to collect. Finally, it should be noted that the 3 items and 3 frequency responses used to create the HHS were a subset of the larger set of 9 items and 4 frequency responses actually administered. Thus, what has been validated here is the HHS derived from a 9I 4F HFIAS questionnaire. While it seems unlikely that reducing the questionnaire administered from a response category comprised of 4 frequencies to a response category comprised of 3 frequencies should somehow invalidate the attained measurement properties, there is no evidence to be able to say definitively that this would not be the case. It is also possible that reducing the questionnaire from 9 items to 3 items could affect the validity of how the 3 items work together: it may be that respondents’ replies to the last three items of the HFIAS were somehow conditioned by having replied to the previous six items. As a next step, we recommend validating whether the HHS, administered as a 3I 3F scale (or a 3I 4F scale), maintains its validity or if it is necessary to embed the HHS within a broader set of items to attain the same internal-, external- and cross-cultural-validity observed for the data used in this study.96
95 Refer back to Section 2 for an explanation of the Rasch assumption of conditional item independence. 96 While it would certainly be most efficient to collect the HHS as a questionnaire comprised of three questions and three (or four) frequency responses, we acknowledge that there would, at the same time, be limitations to data collected in this manner. With the scale data collected as three items (rather than embedded in a larger number of items), it would be difficult to identify the source of an internal validity problem if poor validity were to be demonstrated. It would also be unlikely to retain any useful measurement properties with the one or two scale questions that might remain.

Validation of a Measure of Household Hunger for Cross-Cultural Use
40
Section 8. Conclusion Despite long-standing efforts to improve the food security situation of populations globally, food deprivation and its physical consequences remain a continuing problem in resource-poor areas throughout the world. To effectively address hunger, it is essential to be able to describe the status of populations in a simple yet meaningful, comparative way to assess where the efforts are needed and the relevance of the interventions to improve the situation. Recent advancements in food insecurity measurement include the availability of a number of relatively simple tools to measure food insecurity. However, it has not yet been demonstrated in the literature that these methods allow for comparisons of data across sub-groups of populations or cross-nationally in regions most severely affected by food insecurity such as sub-Saharan Africa. The development of the HHS has spanned nine years of exploratory, theoretic and evidence-based research, and in this last stage of validation testing, a practical tool to measure household hunger at the population level is now available. The HHS is highly relevant in the current global environment and can facilitate improved geographic targeting of food insecurity interventions and monitoring and evaluation of food security policies and programs. More broadly speaking, the HHS can help to advance evidence-based research to improve food insecurity and household hunger globally while also strengthening the ability of governments and international and national agencies to advocate for policies and programs to prevent and address household hunger.

Validation of a Measure of Household Hunger for Cross-Cultural Use
41
References Bermudez OI, P Palma de Fulladolsa, H Deman and H Melgar-Quinones. 2010. “Food insecurity is
prevalent in rural communities of El Salvador, Guatemala, Honduras and Nicaragua.” FASEB J. 24:104.7
Bond, TG, and CM Fox. 2001. Applying the Rasch Model. Fundamental Measurement in the Human
Sciences. Mahwah, NJ: Lawrence Erlbaum Associations, Inc. Casillas, A, EM Schulz, SB Robbins, PJ Santos, and RM Lee. 2006. “Exploring the meaning of motivation
across cultures: IRT Analysis of the Goal Instability Scale.” Journal of Career Assessment 14; 472. DOI: 10.1177/1069072705283764.
Christensen, KB, and JB Bjorner. 2003. SAS macros for Rasch based latent variable modeling. Available
at: biostat.ku.dk/reports/2003/rr-03-13.pdf (Accessed May 7, 2008). Coates, J. 2006. Household food insecurity access scale data analysis plan. Draft. Washington, DC:
FANTA at FHI 360. ---. 2004. Experience and expression of food insecurity across cultures: Practical implications for valid
measurement. Washington, DC: FANTA at FHI 360. Coates, J, EA Frongillo, A Swindale, BL Rogers, P Webb, and P Bilinsky (guest editors). 2006a.
“Advances in Developing Country Food Insecurity Measurement.” Journal of Nutrition Suppl 135 (5S).
Coates, J, B Rogers, D Maxwell, P Webb, and R Houser. 2007a. Dietary Diversity Study. World Food
Programme (WFP) Emergency Needs Assessment Service. Rome: WFP. Coates J, A Swindale, and P Bilinsky. 2007b. Household Food Insecurity Access Scale (HFIAS) for
Measurement of Household Food Access: Indicator Guide (v3). Washington, DC: FANTA at FHI 360. ---. 2006b. Household Food Insecurity Access Scale (HFIAS) for Measurement of Household Food
Access: Indicator Guide (v2). Washington, DC: FANTA at FHI 360. Coates, J, P Webb, and R Houser. 2003. Measuring food insecurity: going beyond indicators of income
and anthropometry. Washington, DC: FANTA at FHI 360. De Onis, M, C Garza, AW Onyango, and R Martorell (guest editors). 2006. “WHO Child Growth
Standards.” Acta Paedicatrica International Journal of Pediatrics Suppl 450. Embretson, SE, and SP Reise. 2000. Item response theory for psychologists. Mahwah, NJ: Lawrence
Erlbaum Associates, Inc. FAO. n.d. Food Balance Sheets: Applications and Uses. Available at: http://faostat.fao.org/ (Accessed
July 27, 2009). ---. 2008. Report on the use of the Household Food Insecurity Access Scale and Household Dietary
Diversity Score in two survey rounds in Manica and Sofala Provinces, Mozambique, 2006-2007. Version 2. FAO food security project GCP/MOZ/079/BEL. Available at: www.foodsec.org/tr/nut/moz_diet.pdf (Accessed March 12, 2010).
---. 2002. International Scientific Symposium on Measurement and Assessment of Food Deprivation and
Undernutrition: Executive Summary. Available at: http://www.fao.org/docrep/005/Y4249E/y4249e04.htm (Accessed Nov 12, 2008).

Validation of a Measure of Household Hunger for Cross-Cultural Use
42
FANTA. 2005. Measuring Household Food Insecurity Workshop II Report: October 19, 2005. Washington, DC: FANTA at FHI 360.
---. 2004. Measuring Household Food Insecurity Workshop Report: April 15-16, 2004. Washington, DC:
FANTA at FHI 360. Frongillo, E, and S Nanama. 2004. Development and Validation of an Experience-based Tool to Directly
Measure Household Food Insecurity Within and Across Seasons in Northern Burkina Faso. Washington, DC: FANTA at FHI 360.
Hoddinott, J, and Y Yohannes. 2002 Dietary Diversity as a Household Food Security Indicator.
Washington, DC: FANTA at FHI 360. Linacre, JM. 2006. A User’s Guide to WINSTEPS, MINISTEP Rasch-Model Computer Programs.
Chicago: John M. Linacre. ---. 2002. “Understanding Rasch measurement: Optimizing rating scale category effectiveness.” Journal
of Applied Measurement 3(1):85-106. Long, JS, and J Freese. 2006. Regression Models for Categorical Dependent Variables Using Stata.
Second Edition. College Station, Texas: StataCorp LP. Maxwell, D, and R Caldwell 2008. The coping strategies index field methods manual. Second Edition.
Cooperative Assistance for Relief Everywhere (CARE). Atlanta, GA: CARE. Maxwell, D, R Caldwell, and M Langworthy. 2008. “Measuring food insecurity: Can an indicator based on
localized coping behaviors be used to compare across contexts?” Food Policy 33 (6): 533-40. Doi: 10.1016/j.foodpol.2008.02.004.
Melgar Quinonez H, MC Alvarez Uribe, P Paras and R Pérez -Escamilla. 2010. “Assessing Differences
in the Psychometric Characteristics of the Latin American and Caribbean Food Security Scale in Colombia and Mexico.” FASEB J. 24:104.8
Melgar-Quinonez, HR. 2004. Testing food security scales for low-cost poverty assessment. Columbus,
OH: The Ohio State University. Melgar-Quinonez, HR, M Nord M, R Pérez -Escamilla, and AM Segall-Correa. 2008. “Psychometric
properties of a modified US-household food security survey module in Campinas, Brazil.” European Journal of Clinical Nutrition 62: 666-73.
Mwangi, A, and G Mbera. 2006. Report of the adaptation and pre-testing of household food security
monitoring tools: the Kenya experience. Rome: FAO. Available at: http://www.foodsec.org/tr/nut/kenya_adapt_hfias.pdf (Accessed ).
Mtimuni, B, and N Geresomo. 2006. Report of the adaptation and pre-testing of household food insecurity
tools in Mangochi And Mwanza, Malawi. Rome: FAO. Available at: http://www.foodsec.org/tr/nut/malawi_pretest_2006%20.pdf (Accessed: ).
Nord, M, personal communication, August 10, 2009. ---. 2006. “Exploring Item Fit Statistics and Measurement Reliability of Food Security Scales Using
Simulated Data.” Paper presented at the Annual Meeting of the American Agricultural Economics Association, July 23-26, in Long Beach, CA.
Nord M, Andrews M and Carlson S. 2008. Household Food Security in the United States, 2007. ERR-66,
2008. Washington, DC: ERS/USDA.

Validation of a Measure of Household Hunger for Cross-Cultural Use
43
---. 2007. Household Food Security in the United States, 2006. ERR-49, 2007. Washington, DC: ERS/USDA.
Pérez-Escamilla R, M Dessalines, M Finnigan, H Pachón, A Hromi-Fiedler and N Gupta. 2009.
“Household food insecurity is associated with childhood malaria in rural Haiti.” Journal of Nutrition: 139(11):2132-8.
Pérez-Escamilla R, H Melgar-Quiñonez, M Nord, MC Álvarez and AM Segall-Correa. 2007. The Latin
American and Caribbean Food Security Scale (Escala Latinoamericana y Caribeña de Seguridad Alimentaria (ELCSA)). “Proceedings of the 1st Latin American Conference on Household Food Security Measurement.” Perspectivas en Nutrición Humana, 2007(supplement):117-134.
Pérez -Escamilla R, P Paras and A Hromi-Fiedler. 2008. “Validity of the Latin American and Caribbean
Household Food Security Scale (ELCSA) in Guanajuato, Mexico.” FASEB J. 22:871.2 Pérez -Escamilla, R, AM Segall-Correa, L Kurdian Maranha, MdFA Sampaio, L Marin-Leon, and G
Panigassi. 2004. “An adapted version of the US Department of Agriculture food insecurity module is a valid tool for assessing household food insecurity in Campinas, Brazil.” Journal of Nutrition 134: 1923-8.
Salzberger T, Sinkovics RR, and BB Schlegelmilch BB. 1999. “Data equivalence in cross-cultural
research: A comparison of classical test theory and latent trait theory based approaches.” Australasian Marketing Journal 7(2): 23-8.
SAS software v9.1. Cary: SAS Institute, Inc. www.sas.com Save the Children/United Kingdom (SC/UK). 2000. The Practitioner’s Guide to the Household Economy
Approach. London: SC/UK. Available at http://www.scribd.com/doc/13484377/The-Practitioners-Guide-to-the-Household-Economy-Approach (Accessed ).
Smith, AB, R Rush, LJ Fallowfield, G Velikova, and M Sharpe. 2008. “Rasch fit statistics and sample size
considerations for polytomous data.” BMC Medical Research Methodology 8: 33. Doi: 10.1186/1471-2288-8-33.
Stata, Intercooled v9.2. StataCorp LP. 2006. Swindale, A, and P Bilinsky. 2006a. “Development of a Universally Applicable Household Food Insecurity
Measurement Tool: Process, Current Status, and Outstanding Issues.” Journal of Nutrition 136: 1449S-1452S.
---. 2006b. Household Dietary Diversity Score (HDDS) for Measurement of Household Food Access:
Indicator Guide (v.2). Washington, DC: FANTA at FHI 360. USAID. 1992. Policy Determination 19, Definition of Food Security, April 13, 1992. Washington, DC:
USAID. Webb, P, J Coates, EA Frongillo, BL Rogers, A Swindale, and P Bilinsky. 2006. “Measuring Household
Food Insecurity: Why It's So Important and Yet So Difficult to Do.” Journal of Nutrition 136: 1404S-8S.
Wolfe, WS, and EA Frongillo. 2001. “Building household food-security measurement tools from the
ground up.” Food and Nutrition Bulletin 22 (1). WFP Vulnerability Analysis and Mapping Branch (ODAV). 2008. Food consumption analysis: Calculation
and use of the food consumption score in food security analysis. Rome: WFP.

Validation of a Measure of Household Hunger for Cross-Cultural Use
44
Annex 1. Results for Original HFIAS: 9I 4F Scale Table A1.1. Standardized Item-Step Calibrations by Data Set*
Item-step Mozambique
R1 Mozambique
R2 Malawi
West Bank/Gaza
Strip Kenya Zimbabwe South Africa q1step1 -3.01 -3.36 -2.01 -3.77 -1.08 0.31 -2.32 q1step2 -0.71 -0.49 -1.76 -1.16 -2.52 -1.90 -0.14 q1step3 2.11 2.38 0.59 0.38 -0.10 -0.88 3.14 q2step1 -4.11 -3.85 -2.48 -4.21 -2.52 -0.19 -3.12 q2step2 -0.93 -1.09 -1.48 -1.57 -2.62 -3.86 -0.55 q2step3 2.24 1.89 2.49 0.86 0.11 -1.13 2.69 q3step1 -3.54 -2.95 -3.82 -3.45 -1.15 -0.40 -2.66 q3step2 -1.09 -0.88 -2.39 -1.50 -3.70 -3.48 -0.55 q3step3 2.24 2.02 -0.36 0.92 -0.17 -1.03 3.02 q4step1 -3.56 -4.08 -2.68 -2.93 -0.95 -0.71 -2.99 q4step2 -1.16 -1.12 -0.90 -1.26 -1.69 -1.99 -0.54 q4step3 2.34 1.82 2.79 1.25 0.70 -0.17 2.81 q5step1 -2.02 -2.31 -1.30 -2.01 -0.91 0.32 -2.66 q5step2 -0.53 -1.21 -2.01 -0.26 -2.70 -2.21 -0.28 q5step3 2.59 2.53 2.10 1.84 0.47 0.09 2.91 q6step1 -1.55 -1.64 -1.19 -1.34 -0.23 -0.06 -2.84 q6step2 -0.93 -1.04 -1.90 -0.09 -2.33 -2.30 -0.41 q6step3 2.85 2.45 1.67 2.23 1.13 -1.24 2.84 q7step1 -0.60 -0.58 -0.38 -0.71 0.27 1.82 -2.47 q7step2 -0.65 -0.34 -0.34 -0.13 0.05 -0.57 -0.38 q7step3 2.98 3.01 2.98 2.33 2.83 2.40 2.75 q8step1 -0.09 -0.24 0.26 1.24 0.34 2.71 -1.46 q8step2 -0.17 0.32 0.16 1.39 1.05 -0.14 -0.37 q8step3 3.33 3.42 4.01 3.96 3.94 4.95 2.67 q9step1 0.34 0.67 2.06 1.55 2.71 3.03 -1.54 q9step2 0.05 0.96 0.97 1.62 3.37 1.25 -0.24 q9step3 3.55 3.71 4.92 4.84 5.70 5.36 2.70
*Disordered item-steps are highlighted in grey

Validation of a Measure of Household Hunger for Cross-Cultural Use
45
Table A1.2. Item and Item-Step Infit and Outfit Mean Square Values by Data Set*
Item-step
Mozambique R1
Infit, Outfit
Mozambique R2
Infit, Outfit Malawi
Infit, Outfit
West Bank/Gaza
Strip Infit, Outfit
Kenya Infit, Outfit
Zimbabwe Infit, Outfit
South Africa Infit, Outfit
Item 1 1.08, 1.13 0.99, 0.99 1.17, 1.23 1.63, 1.74 1.06, 1.03 0.70, 0.71 0.92, 0.87 q1step1 1.61, 1.92 1.25, 1.61 1.08, 1.14 1.51, 1.79 0.96, 0.91 0.99, 1.07 0.95, 0.96 q1step2 0.92, 1.07 0.92, 0.83 1.03, 1.09 1.13, 1.54 0.99, 0.96 1.03, 1.15 0.79, 0.83 q1step3 0.78, 0.74 0.90, 1.25 1.10, 1.18 1.43, 2.89 1.04, 1.11 0.89, 0.78 1.10, 1.99
Item 2 1.11, 1.11 0.94, 0.92 1.02, 1.01 0.97, 0.98 0.84, 0.91 0.92, 1.33 1.16, 1.01 q2step1 0.97, 6.84 0.91, 5.92 1.06, 1.12 0.94, 1.37 0.69, 0.62 1.82, 2.09 1.29, 1.44 q2step2 1.02, 0.97 0.79, 0.65 0.92, 0.91 0.93, 0.88 1.03, 0.88 0.98, 0.85 0.96, 1.38 q2step3 1.11, 1.37 0.94, 2.97 0.98, 1.01 1.02, 1.04 0.96, 0.98 1.03, 1.04 0.90, 44.23
Item 3 1.02, 1.02 0.83, 0.80 1.19, 1.14 0.74, 0.72 1.09, 0.96 0.89, 0.95 0.92, 0.80 q3step1 0.88, 1.09 0.95, 1.26 1.02, 1.06 0.69, 0.76 1.34, 1.44 1.11, 1.09 0.90, 1.77 q3step2 1.06, 0.99 0.83, 0.76 0.99, 0.95 0.88, 0.81 0.80, 0.52 1.13, 0.96 0.78, 0.59 q3step3 0.98, 1.03 0.72, 0.70 1.18, 1.25 0.91, 0.86 1.02, 0.99 1.17, 1.20 0.97, 11.20
Item 4 1.01, 0.99 0.93, 0.89 1.05, 1.06 0.78, 0.77 1.22, 1.31 0.83, 0.97 1.05, 0.93 q4step1 0.75, 1.67 0.95, 1.11 1.13, 1.25 0.78, 0.77 1.41, 1.86 0.91, 0.89 0.99, 0.76 q4step2 0.96, 1.16 0.88, 0.81 0.91, 0.91 0.87, 0.89 0.96, 0.89 1.03, 0.97 0.97, 0.97 q4step3 1.04, 1.90 0.88, 1.77 0.98, 1.08 0.91, 0.91 1.00, 0.94 1.01, 1.21 0.93, 7.02
Item 5 0.86, 0.86 1.04, 1.11 0.79, 0.75 0.75, 0.72 0.85, 0.92 1.02, 1.03 0.86, 0.81 q5step1 0.86, 0.99 1.11, 3.39 0.86, 0.83 0.92, 0.90 1.04, 1.35 1.27, 1.32 0.84, 1.56 q5step2 0.91, 0.87 0.87, 1.41 0.90, 0.85 0.79, 0.75 0.89, 0.70 0.92, 0.89 0.83, 0.74 q5step3 0.85, 0.74 0.83, 0.61 1.00, 1.03 0.77, 0.74 0.98, 0.95 1.05, 1.06 0.76, 0.49
Item 6 0.76, 0.84 1.16, 1.27 0.87, 0.84 0.85, 0.79 0.94, 0.91 0.81, 0.74 0.87, 0.81 q6step1 0.89, 1.05 1.15, 13.48 0.90, 0.89 1.01, 0.96 1.04, 1.04 1.33, 1.38 0.77, 14.21 q6step2 0.81, 0.70 0.94, 0.82 0.94, 0.91 0.82, 0.77 0.92, 0.82 0.78, 0.67 0.76, 0.66 q6step3 0.91, 0.79 0.85, 0.84 1.02, 1.02 0.77, 0.80 1.02, 1.03 1.09, 1.05 0.91, 1.00
Item 7 1.10, 1.11 0.91, 0.92 0.88, 0.87 0.95, 0.95 0.91, 0.90 0.74, 0.69 0.78, 0.71 q7step1 1.22, 2.00 0.95, 0.90 0.97, 0.95 1.05, 0.97 0.97, 0.92 0.90, 0.81 0.81, 1.69 q7step2 0.86, 0.99 0.89, 1.08 0.94, 0.91 0.84, 0.89 0.94, 0.87 1.02, 0.97 0.69, 0.57 q7step3 0.75, 0.58 1.07, 1.05 0.89, 0.92 0.84, 1.48 0.99, 0.91 0.93, 0.87 0.86, 0.66
Item 8 0.85, 0.81 1.01, 1.16 0.98, 0.92 1.21, 0.95 0.98, 0.97 0.73, 0.63 1.20, 1.12 q8step1 1.00, 0.94 1.05, 1.28 1.01, 0.97 1.13, 0.91 1.07, 1.10 0.94, 0.82 1.10, 4.07 q8step2 0.82, 0.83 1.01, 0.92 0.93, 0.91 1.00, 0.92 0.77, 0.73 0.97, 0.91 0.97, 1.84 q8step3 0.87, 1.06 1.02, 0.82 1.04, 1.13 1.08, 1.59 1.08, 1.45 0.64, 0.48 1.05, 2.13
Item 9 1.17, 1.19 0.87, 0.96 1.10, 1.06 1.48, 1.35 1.08, 1.06 0.69, 0.57 1.24, 1.18 q9step1 1.25, 1.92 0.92, 1.03 1.00, 0.98 1.30, 1.32 1.18, 1.25 0.81, 0.67 1.23, 7.56 q9step2 0.91, 0.92 0.97, 0.87 1.05, 1.10 1.17, 1.07 0.95, 0.72 1.06, 1.06 0.89, 1.48 q9step3 1.05, 0.70 0.88, 0.98 1.27, 1.34 1.32, 2.50 1.05, 1.05 0.50, 0.40 1.13, 1.62
*Infits and outfits falling outside the 0.70-1.30 range recommended by Nord are in italics. Infits and outfits falling outside the 0.60-1.40 range recommended by Bond and Fox are underlined. Infits and outfits falling outside the 0.50-1.50 range recommended by Linacre are in bold.

Validation of a Measure of Household Hunger for Cross-Cultural Use
46
FIGURES A1.1-1.6: CROSS CULTURAL COMPARISON PLOTS Figure A1.1. Mozambique R2 and Mozambique R1
q1step1
q1step2
q1step3
q2step1
q2step2
q2step3
q3step1
q3step2
q3step3
q4step1
q4step2
q4step3
q5step1
q5step2
q5step3
q6step1q6step2
q6step3
q7step1q7step2
q7step3
q8step1q8step2
q8step3
q9step1q9step2
q9step3
-6-5
-4-3
-2-1
01
23
45
6M
ozam
biqu
e R
2
-6 -5 -4 -3 -2 -1 0 1 2 3 4 5 6Mozambique R1
Figure A1.2. Malawi and Mozambique R1
q1step1 q1step2
q1step3
q2step1
q2step2
q2step3
q3step1
q3step2
q3step3
q4step1
q4step2
q4step3
q5step1
q5step2
q5step3
q6step1
q6step2
q6step3
q7step1q7step2
q7step3
q8step1q8step2
q8step3
q9step1
q9step2
q9step3
-6-5
-4-3
-2-1
01
23
45
6M
alaw
i
-6 -5 -4 -3 -2 -1 0 1 2 3 4 5 6Mozambique R1

Validation of a Measure of Household Hunger for Cross-Cultural Use
47
Figure A1.3. West Bank/Gaza Strip and Mozambique R1
q1step1
q1step2
q1step3
q2step1
q2step2
q2step3
q3step1
q3step2
q3step3
q4step1
q4step2
q4step3
q5step1
q5step2
q5step3
q6step1
q6step2
q6step3
q7step1q7step2
q7step3
q8step1q8step2
q8step3
q9step1q9step2
q9step3-6
-5-4
-3-2
-10
12
34
56
Wes
t Ban
k G
aza
Strip
-6 -5 -4 -3 -2 -1 0 1 2 3 4 5 6Mozambique R1
Figure A1.4. Kenya and Mozambique R1
q1step1
q1step2
q1step3
q2step1 q2step2
q2step3
q3step1
q3step2
q3step3
q4step1
q4step2
q4step3
q5step1
q5step2
q5step3q6step1
q6step2
q6step3
q7step1q7step2
q7step3
q8step1
q8step2
q8step3
q9step1q9step2
q9step3
-6-5
-4-3
-2-1
01
23
45
6Ke
nya
-6 -5 -4 -3 -2 -1 0 1 2 3 4 5 6Mozambique R1

Validation of a Measure of Household Hunger for Cross-Cultural Use
48
Figure A1.5. Zimbabwe and Mozambique R1
q1step1
q1step2
q1step3q2step1
q2step2
q2step3
q3step1
q3step2
q3step3q4step1
q4step2
q4step3q5step1
q5step2
q5step3q6step1
q6step2
q6step3
q7step1
q7step2
q7step3q8step1
q8step2
q8step3
q9step1
q9step2
q9step3
-6-5
-4-3
-2-1
01
23
45
6Zi
mba
bwe
-6 -5 -4 -3 -2 -1 0 1 2 3 4 5 6Mozambique R1
Figure A1.6. South Africa and Mozambique R1
q1step1
q1step2
q1step3
q2step1
q2step2
q2step3
q3step1
q3step2
q3step3
q4step1
q4step2
q4step3
q5step1
q5step2
q5step3
q6step1
q6step2
q6step3
q7step1
q7step2
q7step3
q8step1
q8step2
q8step3
q9step1
q9step2
q9step3
-6-5
-4-3
-2-1
01
23
45
6So
uth
Afric
a
-6 -5 -4 -3 -2 -1 0 1 2 3 4 5 6Mozambique R1

Validation of a Measure of Household Hunger for Cross-Cultural Use
49
Annex 2. Results for 9I 3F Scale (Rarely and Sometimes Combined) Table A2.1. Standardized Item-Step Calibrations by Data Set*
Item-step Mozambique
R1 Mozambique
R2 Malawi
West Bank/Gaza
Strip Kenya Zimbabwe South Africa q1step1 -4.29 -4.52 -3.86 -5.05 -3.66 -2.48 -3.17 q1step2 2.56 2.94 1.24 0.98 0.24 -0.30 3.83 q2step1 -5.47 -5.15 -4.18 -5.56 -5.20 -4.30 -4.37 q2step2 2.66 2.26 3.00 1.31 0.45 -1.13 3.17 q3step1 -4.93 -4.17 -5.63 -4.83 -4.60 -4.24 -3.75 q3step2 2.64 2.45 0.27 1.38 0.02 -0.93 3.63 q4step1 -4.98 -5.39 -4.15 -4.27 -3.02 -3.62 -4.20 q4step2 2.74 2.17 3.43 1.75 1.23 0.51 3.34 q5step1 -3.20 -3.64 -3.38 -3.04 -3.64 -2.71 -3.69 q5step2 3.11 3.00 2.50 2.60 0.82 0.77 3.51 q6step1 -2.84 -2.94 -3.22 -2.31 -2.73 -3.11 -3.96 q6step2 3.32 2.92 2.14 3.02 1.56 -0.86 3.39 q7step1 -1.66 -1.64 -1.93 -1.69 -0.85 -0.06 -3.44 q7step2 3.49 3.67 3.75 3.10 3.73 4.00 3.28 q8step1 -0.88 -0.97 -1.21 0.52 -0.41 1.14 -1.90 q8step2 3.92 4.20 4.81 5.17 5.19 7.06 3.12 q9step1 -0.34 0.26 0.61 0.86 2.61 2.25 -1.99 q9step2 4.16 4.56 5.83 6.06 8.26 8.02 3.18
*Disordered item-steps are highlighted in grey

Validation of a Measure of Household Hunger for Cross-Cultural Use
50
Tables A2.2. Item and Item-Step Infit and Outfit Mean Square Values by Data Set*
Item-step
Mozambique R1
Infit, Outfit
Mozambique R2
Infit, Outfit Malawi
Infit, Outfit
West Bank/Gaza
Strip Infit, Outfit
Kenya Infit, Outfit
Zimbabwe Infit, Outfit
South Africa Infit, Outfit
Item 1 1.14, 1.41 1.00, 0.85 1.13, 1.17 1.63, 1.73 1.06, 0.99 0.75, 0.73 0.96, 0.57 q1step1 1.76, 2.38 1.21, 1.08 1.12, 1.15 1.80, 2.25 0.93, 0.68 0.79, 0.73 0.87, 0.27 q1step2 0.69, 0.39 0.83, 3.57 1.06, 1.49 1.33, 6.65 1.07, 1.20 0.93, 0.85 1.08, 0.38
Item 2 1.06, 1.32 0.98, 0.94 1.02, 1.01 0.97, 1.04 0.87, 0.88 0.88, 1.03 1.12, 0.54 q2step1 0.95, 17.55 0.93, 7.19 1.04, 1.19 0.92, 2.80 0.80, 0.44 0.76, 1.51 1.29, 0.31 q2step2 1.07, 2.09 0.95, 11.57 0.96, 0.93 0.97, 1.21 0.92, 0.86 0.99, 0.94 0.94, 32.94
Item 3 0.85, 0.97 0.75, 0.74 1.18, 1.16 0.74, 0.70 1.08, 1.01 0.92, 0.94 0.95, 0.47 q3step1 0.78, 1.76 0.81, 1.09 1.05, 1.12 0.63, 1.20 1.05, 0.89 0.59, 0.43 0.87, 0.28 q3step2 0.88, 1.27 0.70, 0.40 1.17, 1.49 0.82, 0.85 1.07, 1.14 1.15, 1.12 0.96, 12.75
Item 4 0.97, 1.12 0.88, 1.00 1.10, 1.08 0.78, 0.74 1.12, 1.14 0.76, 0.98 0.99, 0.51 q4step1 0.75, 4.16 0.95, 0.51 1.13, 1.51 0.75, 0.67 1.32, 2.41 0.70, 0.61 1.00, 0.27 q4step2 1.05, 6.90 0.84, 5.04 0.98, 1.23 0.82, 1.05 0.95, 0.80 0.90, 1.11 0.95, 7.31
Item 5 0.81, 0.72 0.95, 0.84 0.81, 0.78 0.74, 0.68 0.89, 0.90 0.94, 0.90 0.82, 0.57 q5step1 0.79, 1.56 0.91, 10.43 0.72, 0.61 0.79, 0.74 0.76, 0.88 1.00, 0.87 0.85, 8.00 q5step2 0.81, 0.47 0.88, 0.50 0.95, 1.00 0.68, 0.55 0.97, 0.92 0.98, 0.90 0.74, 0.17
Item 6 0.78, 0.74 1.06, 0.97 0.87, 0.85 0.83, 0.77 0.96, 0.94 0.87, 0.91 0.88, 0.65 q6step1 0.69, 0.91 0.95, 35.72 0.79, 0.74 0.88, 0.94 0.91, 0.73 0.87, 0.71 0.82, 10.96 q6step2 0.90, 0.46 0.86, 0.58 1.00, 0.99 0.72, 0.68 1.01, 0.99 1.00, 1.04 0.87, 0.23
Item 7 1.06, 0.83 0.78, 0.79 0.90, 0.88 0.90, 0.94 0.90, 0.90 0.81, 0.78 0.86, 0.39 q7step1 1.06, 4.47 0.65, 1.18 0.93, 0.93 0.91, 0.99 0.97, 0.87 0.85, 0.75 0.87, 3.73 q7step2 0.80, 0.33 1.11, 1.87 0.85, 0.90 0.80, 3.10 0.90, 0.69 0.92, 0.80 0.83, 0.20
Item 8 0.74, 0.61 0.69, 1.05 0.94, 0.92 1.11, 0.86 1.04, 1.05 0.79, 0.72 0.98, 0.66 q8step1 0.61, 1.07 0.63, 1.00 0.91, 0.88 1.04, 0.86 1.04, 1.01 0.89, 0.78 0.84, 2.47 q8step2 0.93, 2.13 0.98, 0.48 1.04, 1.00 1.22, 2.80 1.02, 1.13 0.63, 0.39 1.07, 0.67
Item 9 0.98, 0.94 0.63, 0.83 1.09, 1.05 1.33, 1.32 1.13, 1.11 0.71, 0.63 1.14, 0.74 q9step1 0.85, 2.99 0.62, 0.82 1.03, 1.00 1.27, 1.40 1.12, 1.13 0.82, 0.69 0.99, 4.71 q9step2 1.14, 0.43 0.75, 0.39 1.27, 1.40 1.51, 5.28 1.22, 1.05 0.45, 0.32 1.15, 0.71
*Infits and outfits falling outside the 0.70-1.30 range recommended by Nord are in italics. Infits and outfits falling outside the 0.60-1.40 range recommended by Bond and Fox are underlined. Infits and outfits falling outside the 0.50-1.50 range recommended by Linacre are highlighted in bold.

Validation of a Measure of Household Hunger for Cross-Cultural Use
51
FIGURES A2.1-2.6: CROSS CULTURAL COMPARISON PLOTS Figure A2.1. Mozambique R2 and Mozambique R1
q1step1
q1step2
q2step1
q2step2
q3step1
q3step2
q4step1
q4step2
q5step1
q5step2
q6step1
q6step2
q7step1
q7step2
q8step1
q8step2
q9step1
q9step2
-6-5
-4-3
-2-1
01
23
45
6M
ozam
biqu
e R
2
-6 -5 -4 -3 -2 -1 0 1 2 3 4 5 6Mozambique R1
Figure A2.2. Malawi and Mozambique R1
q1step1
q1step2
q2step1
q2step2
q3step1
q3step2
q4step1
q4step2
q5step1
q5step2
q6step1
q6step2
q7step1
q7step2
q8step1
q8step2
q9step1
q9step2
-6-5
-4-3
-2-1
01
23
45
6M
alaw
i
-6 -5 -4 -3 -2 -1 0 1 2 3 4 5 6Mozambique R1

Validation of a Measure of Household Hunger for Cross-Cultural Use
52
Figure A2.3. West Bank/Gaza Strip and Mozambique R1
q1step1
q1step2
q2step1
q2step2
q3step1
q3step2
q4step1
q4step2
q5step1
q5step2
q6step1
q6step2
q7step1
q7step2
q8step1
q8step2
q9step1
q9step2
-6-5
-4-3
-2-1
01
23
45
6W
est B
ank
Gaz
a St
rip
-6 -5 -4 -3 -2 -1 0 1 2 3 4 5 6Mozambique R1
Figure A2.4. Kenya and Mozambique R1
q1step1
q1step2
q2step1
q2step2
q3step1
q3step2
q4step1
q4step2
q5step1
q5step2
q6step1
q6step2
q7step1
q7step2
q8step1
q8step2
q9step1
q9step2
-6-5
-4-3
-2-1
01
23
45
6Ke
nya
-6 -5 -4 -3 -2 -1 0 1 2 3 4 5 6Mozambique R1

Validation of a Measure of Household Hunger for Cross-Cultural Use
53
Figure A2.5. Zimbabwe and Mozambique R1
q1step1
q1step2
q2step1
q2step2
q3step1
q3step2
q4step1
q4step2
q5step1
q5step2
q6step1
q6step2q7step1
q7step2
q8step1
q8step2
q9step1
q9step2
-6-5
-4-3
-2-1
01
23
45
6Zi
mba
bwe
-6 -5 -4 -3 -2 -1 0 1 2 3 4 5 6Mozambique R1
Figure A2.6. South Africa and Mozambique R1
q1step1
q1step2
q2step1
q2step2
q3step1
q3step2
q4step1
q4step2
q5step1
q5step2
q6step1
q6step2
q7step1
q7step2
q8step1
q8step2
q9step1
q9step2
-6-5
-4-3
-2-1
01
23
45
6S
outh
Afri
ca
-6 -5 -4 -3 -2 -1 0 1 2 3 4 5 6Mozambique R1

Validation of a Measure of Household Hunger for Cross-Cultural Use
54
Annex 3. Results for 5I 3F Scale (Rarely and Sometimes Combined) Table A3.1. Standardized Item-Step Calibrations by Data Set*
Item-step Mozambique
R1 Mozambique
R2 Malawi
West Bank/Gaza
Strip Kenya Zimbabwe South Africa q5step1 -4.79 -4.98 -4.36 -5.05 -4.72 -3.68 -3.70 q5step2 2.30 2.18 1.56 1.38 -0.39 -0.46 3.15 q6step1 -4.21 -4.07 -4.20 -3.93 -3.82 -4.32 -4.04 q6step2 2.52 2.12 1.26 1.75 0.27 -1.55 3.04 q7step1 -2.57 -2.60 -2.69 -3.13 -1.93 -1.48 -3.41 q7step2 2.70 2.78 2.65 1.83 2.10 1.86 2.92 q8step1 -1.61 -1.81 -1.96 -0.57 -1.51 -0.55 -1.72 q8step2 3.16 3.24 3.56 3.54 3.26 4.31 2.77 q9step1 -0.91 -0.36 -0.26 -0.22 1.11 0.22 -1.84 q9step2 3.41 3.50 4.45 4.39 5.65 5.65 2.83
*Disordered item-steps are highlighted in grey Tables A3.2. Item and Item-Step Infit and Outfit Mean Square Values by Data Set*
Item-step Mozambique
R1 Mozambique
R2 Malawi
West Bank/Gaza
Strip Kenya Zimbabwe South Africa Item 5 1.31, 1.78 0.97, 1.32 1.04, 1.04 1.04, 1.12 1.17, 1.11 1.31, 1.26 1.14, 0.90
q5step1 1.33, 1.60 1.15, 5.07 0.96, 0.89 1.07, 2.78 1.06, 1.20 1.14, 1.37 1.25, 8.17 q5step2 1.29, 1.41 0.83, 0.72 1.07, 1.51 0.98, 3.34 1.17, 1.32 1.36, 1.30 1.04, 0.21
Item 6 1.00, 1.05 0.91, 1.04 1.03, 1.06 0.83, 0.85 1.05, 1.01 1.41, 1.44 1.06, 0.89 q6step1 0.83, 1.21 0.86, 31.35 0.91, 1.04 0.78, 1.15 0.89, 0.72 1.12, 1.49 1.17, 12.51 q6step2 1.14, 2.07 0.80, 1.47 1.09, 1.39 0.87, 1.30 1.12, 1.12 1.40, 1.52 0.97, 0.20
Item 7 0.90, 0.88 0.73, 0.67 1.02, 1.05 0.94, 0.98 0.83, 0.84 0.91, 0.91 0.75, 0.33 q7step1 1.03, 2.77 0.58, 1.02 1.06, 1.07 0.93, 0.83 0.82, 0.64 0.78, 0.66 0.71, 0.20 q7step2 0.64, 0.32 1.01, 2.36 0.93, 1.03 0.90, 3.68 0.93, 0.73 1.15, 1.10 0.79, 0.17
Item 8 0.65, 0.51 0.70, 0.79 0.91, 0.91 0.87, 0.77 0.93, 1.04 0.75, 0.63 0.78, 0.46 q8step1 0.58, 0.53 0.67, 0.74 0.90, 0.83 0.84, 0.77 0.90, 0.89 0.74, 0.53 0.55, 0.75 q8step2 0.72, 4.44 0.78, 2.46 0.97, 1.03 0.95, 1.22 1.00, 1.42 0.98, 0.47 0.98, 0.86
Item 9 0.80, 0.68 0.50, 0.60 0.95, 1.00 1.06, 1.10 1.06, 0.79 0.68, 0.48 0.99, 0.57 q9step1 0.74, 1.75 0.46, 0.54 0.94, 1.02 1.02, 1.23 1.05, 0.81 0.66, 0.44 0.78, 1.57 q9step2 0.83, 0.24 0.73, 1.66 1.02, 0.89 1.24, 2.27 1.19, 1.05 0.94, 0.93 1.15, 0.87
*Infits and outfits falling outside the 0.7-1.3 range recommended by Nord are in italics. Infits and outfits falling outside the 0.6-1.4 range recommended by Bond and Fox are underlined. Infits and outfits falling outside the 0.5-1.5 range recommended by Linacre are in bold.

Validation of a Measure of Household Hunger for Cross-Cultural Use
55
FIGURES A3.1-3.6: CROSS CULTURAL COMPARISONS Figure A3.1. Mozambique R2 and Mozambique R1
5step1
5step2
6step1
6step2
7step1
7step2
8step1
8step2
9step1
9step2
-6-5
-4-3
-2-1
01
23
45
6M
ozam
biqu
e R
2
-6 -5 -4 -3 -2 -1 0 1 2 3 4 5 6Mozambique R1
Figure A3.2. Malawi and Mozambique R1
5step1
5step2
6step1
6step2
7step1
7step2
8step1
8step2
9step1
9step2
-6-5
-4-3
-2-1
01
23
45
6M
alaw
i
-6 -5 -4 -3 -2 -1 0 1 2 3 4 5 6Mozambique R1

Validation of a Measure of Household Hunger for Cross-Cultural Use
56
Figure A3.3. West Bank/Gaza Strip and Mozambique R1
5step1
5step2
6step1
6step2
7step1
7step2
8step1
8step2
9step1
9step2
-6-5
-4-3
-2-1
01
23
45
6W
est B
ank
Gaz
a St
rip
-6 -5 -4 -3 -2 -1 0 1 2 3 4 5 6Mozambique R1
Figure A3.4. Kenya and Mozambique R1
5step1
5step2
6step1
6step2
7step1
7step2
8step1
8step2
9step1
9step2
-6-5
-4-3
-2-1
01
23
45
6K
enya
-6 -5 -4 -3 -2 -1 0 1 2 3 4 5 6Mozambique R1

Validation of a Measure of Household Hunger for Cross-Cultural Use
57
Figure A3.5. Zimbabwe and Mozambique R1
5step1
5step2
6step1
6step27step1
7step2
8step1
8step2
9step1
9step2
-6-5
-4-3
-2-1
01
23
45
6Zi
mba
bwe
-6 -5 -4 -3 -2 -1 0 1 2 3 4 5 6Mozambique R1
Figure A3.6. South Africa and Mozambique R1
5step1
5step2
6step1
6step2
7step1
7step2
8step1
8step2
9step1
9step2
-6-5
-4-3
-2-1
01
23
45
6So
uth
Afric
a
-6 -5 -4 -3 -2 -1 0 1 2 3 4 5 6Mozambique R1

Validation of a Measure of Household Hunger for Cross-Cultural Use
58
Annex 4. Results for 3I 3F Scale (Rarely and Sometimes Combined)
Table A4.1. Standardized Item-Step Calibrations by Data Set*
Item-step Mozambique
R1 Mozambique
R2 Malawi
West Bank/Gaza
Strip Kenya1 Zimbabwe South Africa q7step1 -3.90 -4.06 -3.82 -4.83 -4.09 -4.32 -4.04 q7step2 2.08 1.94 1.76 0.98 1.19 0.85 2.86 q8step1 -2.68 -2.97 -3.08 -1.53 -3.36 -2.28 -2.07 q8step2 2.85 2.65 2.70 2.74 2.17 2.87 2.72 q9step1 -1.73 -1.03 -1.20 -1.08 0.22 -1.03 -2.27 q9step2 3.37 3.47 3.64 3.73 3.87 3.90 2.79
*Disordered item-steps are highlighted in grey 1 Output from Rasch analyses indicated that the model convergence criterion of <0.001 was not met for the Kenya data. This may be due to having only 1 observation in the “often” cell for item 9. The Rasch results for the 3I 3F scale for the Kenya data set should therefore be interpreted cautiously. Tables A4.2. Item and Item-Step Infit and Outfit Mean Square Values by Data Set*
Item-step Mozambique
R1 Mozambique
R2 Malawi
West Bank/Gaza
Strip Kenya1 Zimbabwe South Africa Item 7 1.06, 1.01 1.09, 1.54 1.13, 1.19 1.24, 1.56 1.09, 1.45 1.30, 1.92 1.37, 0.65
q7step1 1.22, 2.18 1.11, 1.04 1.15, 1.16 1.05, 4.79 1.00, 0.67 1.01, 0.35 1.17, 0.43 q7step2 0.80, 1.03 1.06, 7.98 1.08, 1.67 1.28, 2.22 1.14, 2.38 1.40, 3.23 1.47, 8.02
Item 8 0.78, 0.59 0.84, 0.46 0.93, 0.88 0.64, 0.51 0.97, 1.00 0.96, 0.75 0.67, 0.13 q8step1 0.69, 0.52 0.80, 0.39 0.90, 0.76 0.66, 0.44 1.05, 0.72 0.98, 0.56 0.56, 0.05 q8step2 0.99, 3.65 0.97, 0.12 0.94, 2.70 0.65, 0.35 0.89, 0.56 0.94, 0.37 0.74, 0.10
Item 9 0.94, 0.60 0.64, 0.34 0.81, 0.78 0.84, 1.06 0.93, 0.67 0.43, 0.52 0.72, 0.17 q9step1 0.90, 2.04 0.61, 1.08 0.78, 0.79 0.84, 1.15 0.91, 0.67 0.38, 0.49 0.62, 0.09 q9step2 0.94, 0.11 0.72, 0.05 0.98, 0.75 0.88, 0.51 1.14, 0.37 0.73, 0.11 0.78, 0.11
*Infits and outfits falling outside the 0.7-1.3 range recommended by Nord are in italics. Infits and outfits falling outside the 0.6-1.4 range recommended by Bond and Fox are underlined. Infits and outfits falling outside the 0.5-1.5 range recommended by Linacre are in bold. 1 Output from Rasch analyses indicated that the model convergence criterion of <0.001 was not met for the Kenya data. This may be due to having only 1 observation in the “often” cell for item 9. The Rasch results for the 3I 3F scale for the Kenya data set should therefore be interpreted cautiously.

Validation of a Measure of Household Hunger for Cross-Cultural Use
59
FIGURES A4.1-4.6: CROSS CULTURAL COMPARISONS Figure A4.1. Mozambique R2 and Mozambique R1
q7step1
q7step2
q8step1
q8step2
q9step1
q9step2
-6-5
-4-3
-2-1
01
23
45
6M
ozam
biqu
e R
2
-6 -5 -4 -3 -2 -1 0 1 2 3 4 5 6Mozambique R1
Figure A4.2. Malawi and Mozambique R1
q7step1
q7step2
q8step1
q8step2
q9step1
q9step2
-6-5
-4-3
-2-1
01
23
45
6M
alaw
i
-6 -5 -4 -3 -2 -1 0 1 2 3 4 5 6Mozambique R1

Validation of a Measure of Household Hunger for Cross-Cultural Use
60
Figure A4.3. West Bank Gaza Strip and Mozambique R1
q7step1
q7step2
q8step1
q8step2
q9step1
q9step2
-6-5
-4-3
-2-1
01
23
45
6W
est B
ank
Gaz
a St
rip
-6 -5 -4 -3 -2 -1 0 1 2 3 4 5 6Mozambique R1
Figure A4.4. Kenya and Mozambique R1
q7step1
q7step2
q8step1
q8step2
q9step1
q9step2
-6-5
-4-3
-2-1
01
23
45
6K
enya
-6 -5 -4 -3 -2 -1 0 1 2 3 4 5 6Mozambique R1

Validation of a Measure of Household Hunger for Cross-Cultural Use
61
Figure A4.5. Zimbabwe and Mozambique R1
q7step1
q7step2
q8step1
q8step2
q9step1
q9step2
-6-5
-4-3
-2-1
01
23
45
6Zi
mba
bwe
-6 -5 -4 -3 -2 -1 0 1 2 3 4 5 6Mozambique R1
Figure A4.6. South Africa and Mozambique R1
q7step1
q7step2
q8step1
q8step2
q9step1
q9step2
-6-5
-4-3
-2-1
01
23
45
6So
uth
Afric
a
-6 -5 -4 -3 -2 -1 0 1 2 3 4 5 6Mozambique R1

Validation of a Measure of Household Hunger for Cross-Cultural Use
62
Appendix. Partner Feedback Form Introduction Thank you for providing FANTA and FAO your survey data set, which included the Household Food Insecurity Access Scale (HFIAS). We will be analyzing your data for internal validity of the scale through use of the Rasch Model, a statistical method based on the Item Response Theory. This work is being done by FANTA and FAO exclusively for the purpose of evaluating the performance of the scale questions in response to each other and not to analyze the data as part of survey results or levels of food insecurity of the respondents. We will be running a series of tests on datasets from a number of countries, including yours. For each country, we will supply a summary of the results of the tests and will provide an interpretation of what these tests show. In order to make this information most useful to you, we would like to have some details on the context of your survey and any preliminary work you may have done to adapt the HFIAS to your situation. We therefore ask you to please take the time to fill out the following questionnaire and send it back to Terri Ballard as soon as possible. 1. Information on the Survey
Country of the survey: Title of the survey: Organization conducting the survey: Contact information (phone and email) of person filling out the questionnaire:
Geographic area covered by survey (i.e., national, regional, local, other):
Sample size: Sampling method (i.e., simple random sample, stratified, cluster sample, other):
Names of variables for sample weights, strata or clusters:

Validation of a Measure of Household Hunger for Cross-Cultural Use
63
2. Adaptation, Translation and Pretesting of the HFIAS Questions This section of the form is intended to find out specific information about the adaptation of HFIAS questions to your local context. There are three versions of questions for the HFIAS available – FANTA Guidelines Jan. 2006, FANTA Guidelines July 2006 and FAO version of the questionnaire, dated Oct. 2006. Please indicate below which version of the questionnaire you used.
Questionnaire version Tick version FANTA Jan. 2006 FANTA July 2006 FAO Oct. 2006
The following questions are intended to find out whether you implemented the different steps described in the HFIAS guide or not and the extent to which these steps were useful for your survey.
Did you imple-
ment the following steps?
(Y or N)
If no, what was the main reason
for not implementing this
step?
If yes, please give details and indicate if this step was useful
to the preparatory work of using the HFIAS.
For each option to which you replied YES in column 2 of this table, please report below the
approximate number of hours devoted to completion of this specific task. (Note: If multiple individuals were involved in carrying out the task,
these hours should not be counted separately unless the work was not carried out
simultaneously). Reviewing the questions with key informants/focus group members and asking for assistance with wording
Conducting a pretest of the HFIAS to further identify problems with comprehension or flow of the scale
Refining the HFIAS questions based on preliminary work, as described above
Providing special training of survey enumerators on administration of the HFIAS with role plays or other opportunities to assure their understanding of the questions
Translation of HFIAS questions from English into local language(s)
Other method(s)

Validation of a Measure of Household Hunger for Cross-Cultural Use
64
3. Question Wording Please complete the table below and answer, for each question in the HFIAS, whether the question was difficult to adapt to your context or if respondents seemed to have difficulty understanding at any point during the process. If a question was problematic, please describe how you resolved this issue (e.g., by rewording the question to say “…”). Note that the following questions come from the FAO version, but the meaning of the questions is the same, regardless of which version of the HFIAS was used.
Difficulty in adapting this question or in respondent
understanding How was the difficulty resolved (eg., question omitted or revised as “…”)
1. In the past [4 weeks], did you worry that your household would not have enough food?
2. In the past [4 weeks], did it happen that you or any household member were not able to eat the kinds of foods you would have preferred to eat because of lack of resources?
3. In the past [4 weeks], did it happen that you or any household member had to eat a limited variety of foods because of lack of resources?
4. In the past [4 weeks], did it happen that you or any household member had to eat some foods that you really did not want to eat because of lack of resources?
5. In the past [4 weeks], did it happen that you or any household member had to eat a smaller meal than you felt you needed because there was not enough food?
6. In the past [4 weeks], did it happen that you or any household member had to eat fewer meals in a day because there was not enough food?
7. In the past [4 weeks], did it happen that there was no food to eat of any kind in your house, because of lack of resources to get food?
8. In the past [4 weeks], did it happen that you or any household member went to sleep at night hungry because there was not enough food?
9. In the past [4 weeks], did it happen that you or any household member went a whole day and night without eating anything at all because there was not enough food?

Validation of a Measure of Household Hunger for Cross-Cultural Use
65
4. Recall Reference Period Please indicate which reference period you used and if this was a topic of adaptation, i.e., choosing the words to use to convey a recall period of a month.
Options Please tick the time period used past one month past 4 weeks past 30 days other
If the wording for what to call the reference period was a topic for adaptation, please describe how you chose the appropriate term.
5. Frequency Response
For each of the nine questions, if the respondent indicates that the event occurred in the past 4 weeks, s/heis asked how often this occurred.
If yes: ask respondent “how often did this happen?” 1 = Rarely (1-2 times) 2 = Sometimes (3-10 times) 3 = Often (more than 10 times)
Please indicate which of the following methods you used to ask about frequency and if the way to obtain the frequency responses was a topic of adaptation.
Options Please tick the method used to obtain frequency responses Asking the NUMBER of times the event occurred in past 4 weeks, with enumerator filling in the questionnaire with the appropriate code 1, 2 or 3.
Prompting with “rarely, sometimes, often” with enumerator filling in the questionnaire with the appropriate code 1, 2 or 3
Other methods (describe)
If the wording for obtaining frequency responses was a topic for adaptation, please describe how you chose the appropriate terms.
Please attach the version of the HFIAS that was used in your survey. If not in English, please include a back-translated English version (ideally back-translated by someone not affiliated with the original translation).