Valencia College Osceola/Lake ona Campus Experimental...
107
1 Valencia College Osceola/Lake ona Campus Experimental Laboratory Manual for General Chemistry-II First Edition 2012 Timothy Barnett
-
Upload
nguyenlien -
Category
Documents
-
view
222 -
download
0
Transcript of Valencia College Osceola/Lake ona Campus Experimental...

1
Valencia College
Osceola/Lake �ona Campus
Experimental Laboratory Manual
for General Chemistry-II
First Edition
2012
Timothy Barnett
2
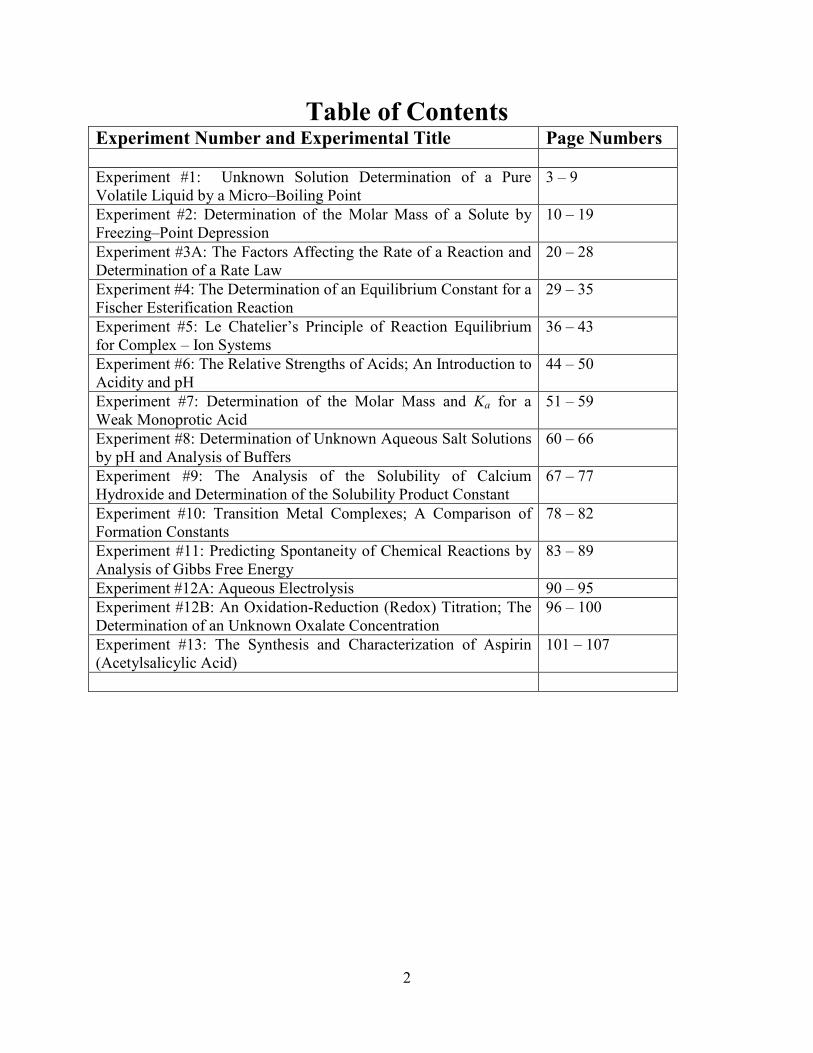
Table of Contents Experiment �umber and Experimental Title Page �umbers
Experiment #1: Unknown Solution Determination of a Pure
Volatile Liquid by a Micro–Boiling Point
3 – 9
Experiment #2: Determination of the Molar Mass of a Solute by
Freezing–Point Depression
10 – 19
Experiment #3A: The Factors Affecting the Rate of a Reaction and
Determination of a Rate Law
20 – 28
Experiment #4: The Determination of an Equilibrium Constant for a
Fischer Esterification Reaction
29 – 35
Experiment #5: Le Chatelier’s Principle of Reaction Equilibrium
for Complex – Ion Systems
36 – 43
Experiment #6: The Relative Strengths of Acids; An Introduction to
Acidity and pH
44 – 50
Experiment #7: Determination of the Molar Mass and Ka for a
Weak Monoprotic Acid
51 – 59
Experiment #8: Determination of Unknown Aqueous Salt Solutions
by pH and Analysis of Buffers
60 – 66
Experiment #9: The Analysis of the Solubility of Calcium
Hydroxide and Determination of the Solubility Product Constant
67 – 77
Experiment #10: Transition Metal Complexes; A Comparison of
Formation Constants
78 – 82
Experiment #11: Predicting Spontaneity of Chemical Reactions by
Analysis of Gibbs Free Energy
83 – 89
Experiment #12A: Aqueous Electrolysis 90 – 95
Experiment #12B: An Oxidation-Reduction (Redox) Titration; The
Determination of an Unknown Oxalate Concentration
96 – 100
Experiment #13: The Synthesis and Characterization of Aspirin
(Acetylsalicylic Acid)
101 – 107

3
Experiment #1:
Unknown Determination of a Pure Volatile Liquid by a
Micro–Boiling Point
Introduction to Vapor Pressure and Boiling Point: 1) Liquids (along with some solids) are continuously vaporizing.
a. Vaporization is the endothermic process by which energy is absorbed to convert a
liquid into a vapor/gas.
b. If this process occurs in a closed system, the partial pressure of the gas builds up
in the space above the liquid.
2) The vapor pressure of a liquid is the partial pressure of the vapor over the liquid,
measured at equilibrium at a given temperature.
a. The vapor pressure of a liquid depends on its temperature.
b. As the temperature increases, the kinetic energy of the molecular motion becomes
greater and the vapor pressure increases.
c. Liquids and solids with relatively high vapor pressures at normal temperatures are
said to be volatile.
3) The temperature at which the vapor pressure of a liquid equals the pressure exerted on the
liquid is called the boiling point.
a. As the temperature of a liquid increases, the vapor pressure increases until it
reaches atmospheric pressure.
b. At this point, stable bubbles of vapor form within the liquid; this is called boiling.
c. The normal boiling point is the boiling point measured at 1 atm (or 760 mm Hg).
4) To summarize, liquids with high vapor pressures have low boiling points and are
considered volatile.
5) All pure liquids have a distinct boiling point (and vapor pressure) and this characteristic
physical property is attributed to the intermolecular forces of the liquid.
Introduction to Intermolecular Forces: 1) Some liquids require more energy to be added to boil than others due to a number of
attractive intermolecular forces between neighboring molecules.
a. Dipole–dipole interactions: the attractive intermolecular force resulting from the
tendency of polar molecules to align themselves such that the positive end of one
molecule is in proximity to the negative end of another and vice versa.
δ– δ+ i. Example: H–Cl H–Cl
b. London (dispersion) forces: the weak attractive forces between molecules
resulting from small, instantaneous dipoles that occur due to varying positions of
electrons during their motion around nuclei.
i. London forces increase with molecular weight; the larger atoms are more
polarizable (or their large electron cloud can easily become distorted.)
ii. Example:
1. Boiling point of CH4: –161.45oC
2. Boiling point of CH2Cl2: 39.8oC
Experiment #1 Barnett
4
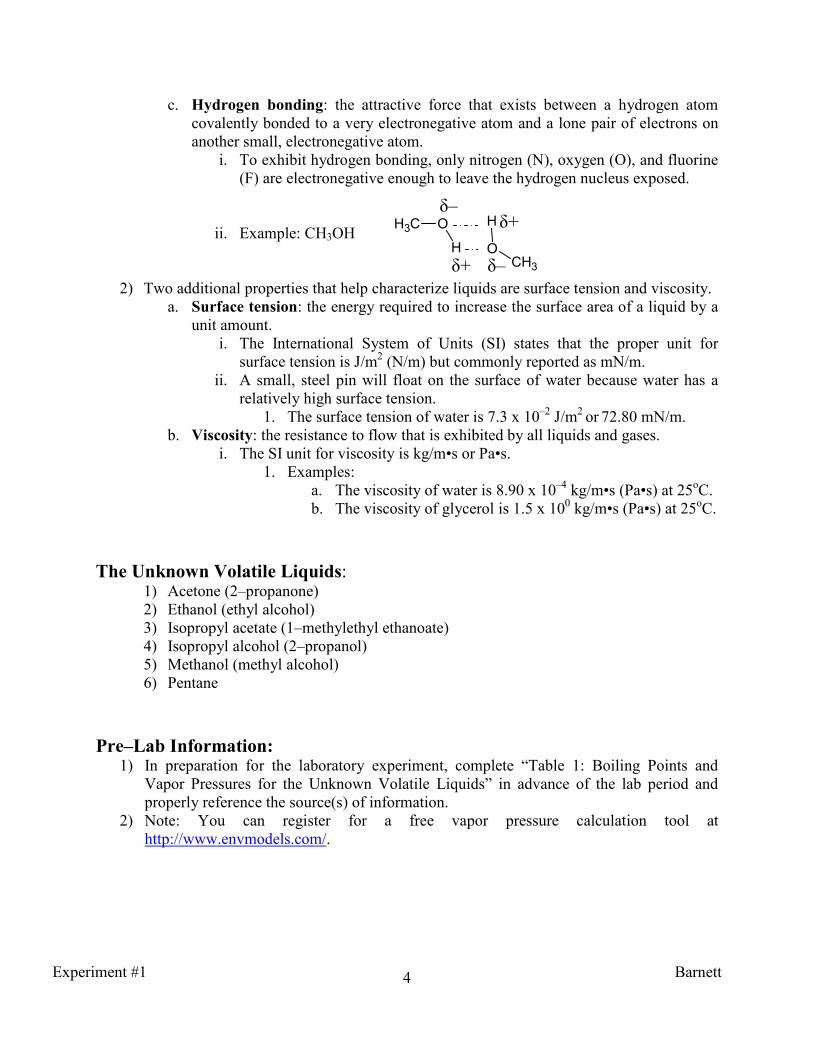
c. Hydrogen bonding: the attractive force that exists between a hydrogen atom
covalently bonded to a very electronegative atom and a lone pair of electrons on
another small, electronegative atom.
i. To exhibit hydrogen bonding, only nitrogen (N), oxygen (O), and fluorine
(F) are electronegative enough to leave the hydrogen nucleus exposed.
ii. Example: CH3OH
2) Two additional properties that help characterize liquids are surface tension and viscosity.
a. Surface tension: the energy required to increase the surface area of a liquid by a
unit amount.
i. The International System of Units (SI) states that the proper unit for
surface tension is J/m2 (N/m) but commonly reported as mN/m.
ii. A small, steel pin will float on the surface of water because water has a
relatively high surface tension.
1. The surface tension of water is 7.3 x 10⁻²
J/m2
or 72.80 mN/m.
b. Viscosity: the resistance to flow that is exhibited by all liquids and gases.
i. The SI unit for viscosity is kg/m•s or Pa•s.
1. Examples:
a. The viscosity of water is 8.90 x 10⁻⁴
kg/m•s (Pa•s) at 25oC.
b. The viscosity of glycerol is 1.5 x 100 kg/m•s (Pa•s) at 25
oC.
The Unknown Volatile Liquids: 1) Acetone (2–propanone)
2) Ethanol (ethyl alcohol)
3) Isopropyl acetate (1–methylethyl ethanoate)
4) Isopropyl alcohol (2–propanol)
5) Methanol (methyl alcohol)
6) Pentane
Pre–Lab Information: 1) In preparation for the laboratory experiment, complete “Table 1: Boiling Points and
Vapor Pressures for the Unknown Volatile Liquids” in advance of the lab period and
properly reference the source(s) of information.
2) Note: You can register for a free vapor pressure calculation tool at
http://www.envmodels.com/.
CH3 O
HCH3
O
Hδ–
δ+ δ–
δ+
Experiment #1 Barnett

5
The Experimental Procedure: 1) Clean and completely dry two 25 mL graduated cylinders (that are marked with 0.2 mL
increments), two evaporating dishes, and one 16 x 150mm test tube.
2) Obtain 25.0 mL of an unknown volatile liquid. Record the unknown number/letter in
your lab notebook.
a. Place the liquid into one of the 25 mL graduated cylinders. Record volume in lab
notebook.
3) To the other 25 mL graduated cylinder, add 25.0 mL of deionized/distilled water.
Record volume in lab notebook.
4) Simultaneously and from the same height, drop a boiling bead into each graduated
cylinder.
a. Record results in your observations. Repeat at least five times to ensure
reproducibility.
b. Speculate on the viscosity of your unknown solution in comparison with water.
5) Carefully, pour your unknown solution into one clean evaporating dish without allowing
the boiling beads to transfer into the dish.
6) Carefully, pour your deionized/distilled water into the other clean evaporating dish
without allowing the boiling beads to transfer into the dish.
7) Gently, place a steel desk pin onto the surface of each liquid.
a. Record results in your observations.
b. Remove pin with a clean pair of tweezers or forceps and repeat at least five times
to ensure reproducibility.
c. Speculate on the surface tension of your unknown solution in comparison with
water.
8) Carefully transfer approximately 5.0 mL of the unknown liquid into the clean and
completely dried 16 x 150mm test tube.
9) Secure the test tube onto a ring stand or the metal scaffolding with a clamp.
10) Obtain a capillary tube with one open end and one closed end.
11) Rubber band the capillary tube open end down to the bulb end of a thermometer.
a. The open end of the tube should be next to the thermometer bulb.
b. Make certain that the rubber band does not occlude the test tube.
c. Make sure the rubber band does not come into contact with the liquid.
12) Place the thermometer with capillary tube into the solution and secure. (See model
attached.)
a. Record the initial temperature of the unknown solution.
b. Report observations of the liquid in the capillary tube.
13) Immerse test tube into a water bath heated on a hotplate.
14) Heat until a steady stream of bubbles can be observed from the open end of the capillary
tube.
15) As soon as the steady stream of bubbles is observed, turn off heat and wait.
a. You should notice that as the water/sample cools, the bubbles will become less
frequent.
16) Record the temperature at which the liquid reenters the capillary tube.
a. This is the first value for your boiling point range.
b. Record all temperatures to at least the tenths place (1 decimal place.)
Experiment #1 Barnett
6
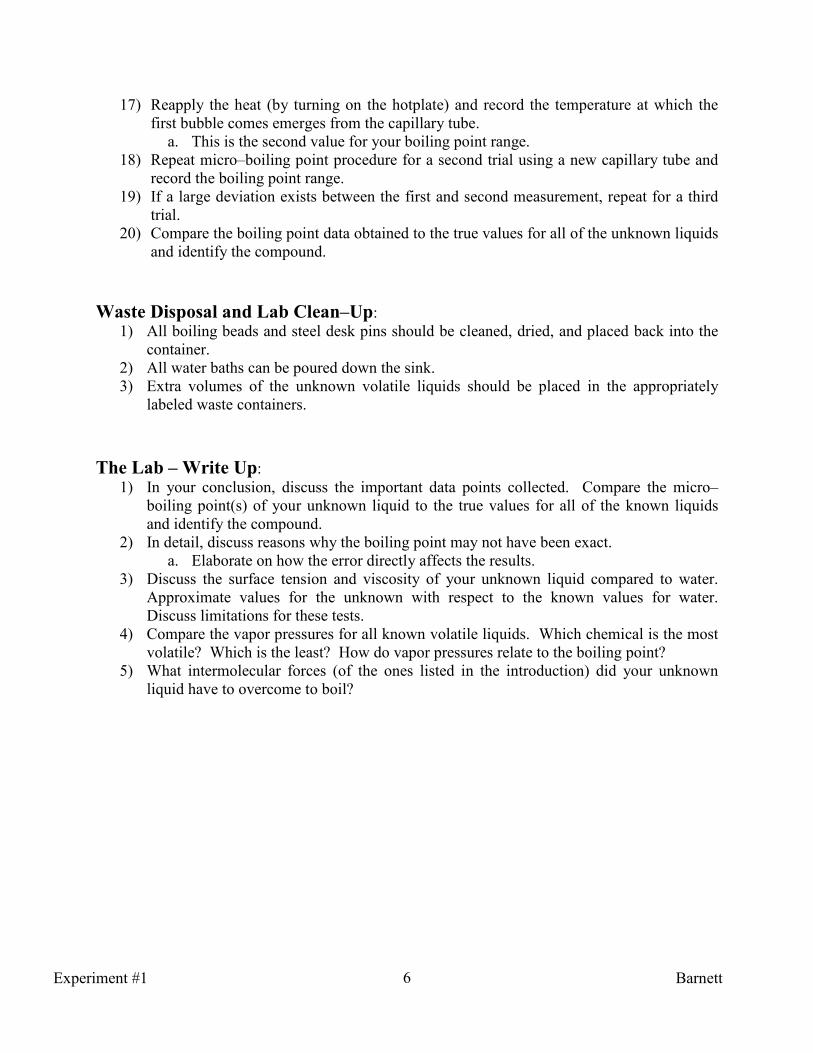
17) Reapply the heat (by turning on the hotplate) and record the temperature at which the
first bubble comes emerges from the capillary tube.
a. This is the second value for your boiling point range.
18) Repeat micro–boiling point procedure for a second trial using a new capillary tube and
record the boiling point range.
19) If a large deviation exists between the first and second measurement, repeat for a third
trial.
20) Compare the boiling point data obtained to the true values for all of the unknown liquids
and identify the compound.
Waste Disposal and Lab Clean–Up:
1) All boiling beads and steel desk pins should be cleaned, dried, and placed back into the
container.
2) All water baths can be poured down the sink.
3) Extra volumes of the unknown volatile liquids should be placed in the appropriately
labeled waste containers.
The Lab – Write Up:
1) In your conclusion, discuss the important data points collected. Compare the micro–
boiling point(s) of your unknown liquid to the true values for all of the known liquids
and identify the compound.
2) In detail, discuss reasons why the boiling point may not have been exact.
a. Elaborate on how the error directly affects the results.
3) Discuss the surface tension and viscosity of your unknown liquid compared to water.
Approximate values for the unknown with respect to the known values for water.
Discuss limitations for these tests.
4) Compare the vapor pressures for all known volatile liquids. Which chemical is the most
volatile? Which is the least? How do vapor pressures relate to the boiling point?
5) What intermolecular forces (of the ones listed in the introduction) did your unknown
liquid have to overcome to boil?
Experiment #1 Barnett

7
Table 1: Boiling Points and Vapor Pressures for the Unknown
Volatile Liquids:
�ame of Volatile
Liquid
Boiling Point (oC) Vapor Pressure
(mm Hg)* *at 20.0
oC or 293.15 K
Acetone (2–propanone)
Ethanol (ethyl alcohol)
Isopropyl alcohol
(2–propanol)
Isopropyl acetate
(1–methylethyl
ethanoate)
Methanol
(methyl alcohol)
Pentane
References: ______________________________________________________________
______________________________________________________________
______________________________________________________________
Experiment #1 Barnett

8
Sample Data Table:
Data Recorded/Calculated Data Point
a) Unknown volatile liquid number/letter:
b) Volume of unknown liquid in milliliters:
c) Volume of deionized/distilled water in
milliliters:
d) Viscosity of unknown liquid in comparison with
water; select from higher, lower, or equivalent
e) Surface tension of unknown liquid in
comparison with water; select from higher, lower,
or equivalent
f) Initial temperature of unknown liquid in degrees
Celsius:
g) Boiling point range of unknown liquid in
degrees Celsius:
Trial 1: ____________
Trial 2: ____________
Trial 3: _____________
h) Identity of unknown volatile liquid:
Experiment #1 Barnett

9
1
2
3
45 6
7
8
9
1 10
2
3
45 6
7
8
9
11
Model Apparatus Set – Up:
Water Fill Line
Unknown Liquid Fill Line
Experiment #1 Barnett
10
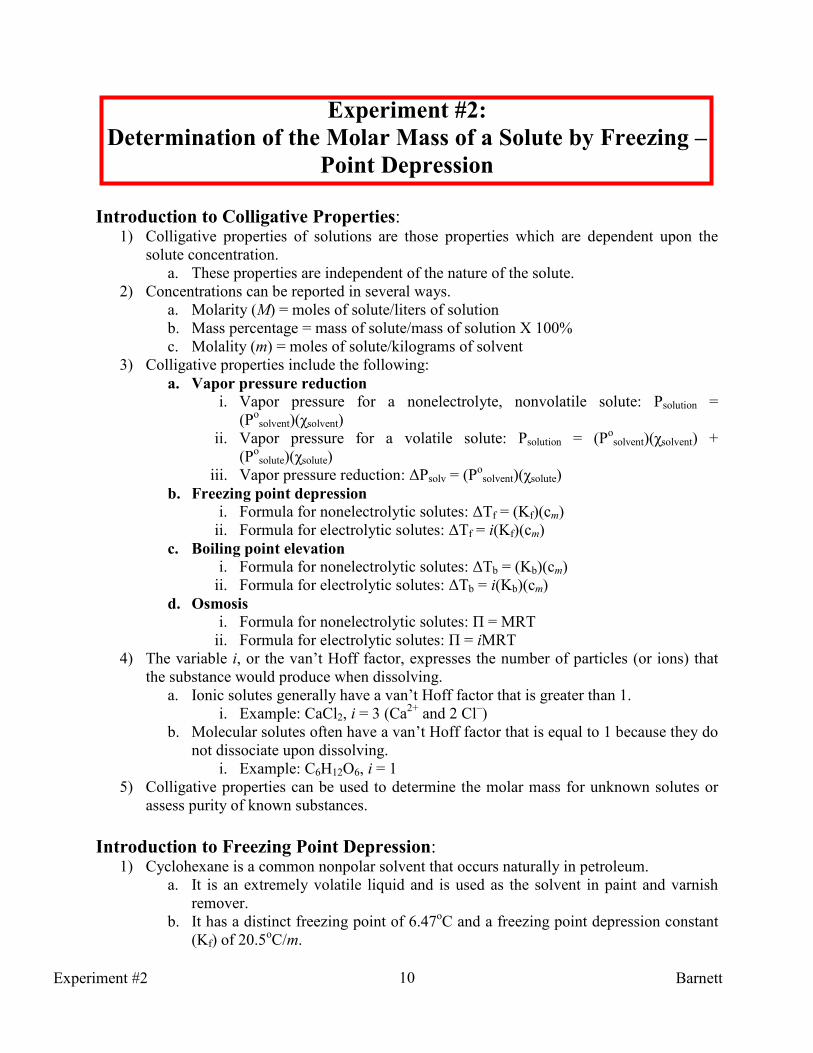
Experiment #2:
Determination of the Molar Mass of a Solute by Freezing –
Point Depression
Introduction to Colligative Properties:
1) Colligative properties of solutions are those properties which are dependent upon the
solute concentration.
a. These properties are independent of the nature of the solute.
2) Concentrations can be reported in several ways.
a. Molarity (M) = moles of solute/liters of solution
b. Mass percentage = mass of solute/mass of solution X 100%
c. Molality (m) = moles of solute/kilograms of solvent
3) Colligative properties include the following:
a. Vapor pressure reduction
i. Vapor pressure for a nonelectrolyte, nonvolatile solute: Psolution =
(Posolvent)(χsolvent)
ii. Vapor pressure for a volatile solute: Psolution = (Posolvent)(χsolvent) +
(Posolute)(χsolute)
iii. Vapor pressure reduction: ∆Psolv = (Posolvent)(χsolute)
b. Freezing point depression
i. Formula for nonelectrolytic solutes: ∆Tf = (Kf)(cm)
ii. Formula for electrolytic solutes: ∆Tf = i(Kf)(cm)
c. Boiling point elevation
i. Formula for nonelectrolytic solutes: ∆Tb = (Kb)(cm)
ii. Formula for electrolytic solutes: ∆Tb = i(Kb)(cm)
d. Osmosis
i. Formula for nonelectrolytic solutes: Π = MRT
ii. Formula for electrolytic solutes: Π = iMRT
4) The variable i, or the van’t Hoff factor, expresses the number of particles (or ions) that
the substance would produce when dissolving.
a. Ionic solutes generally have a van’t Hoff factor that is greater than 1.
i. Example: CaCl2, i = 3 (Ca2+
and 2 Cl–)
b. Molecular solutes often have a van’t Hoff factor that is equal to 1 because they do
not dissociate upon dissolving.
i. Example: C6H12O6, i = 1
5) Colligative properties can be used to determine the molar mass for unknown solutes or
assess purity of known substances.
Introduction to Freezing Point Depression: 1) Cyclohexane is a common nonpolar solvent that occurs naturally in petroleum.
a. It is an extremely volatile liquid and is used as the solvent in paint and varnish
remover.
b. It has a distinct freezing point of 6.47oC and a freezing point depression constant
(Kf) of 20.5oC/m.
Experiment #2 Barnett
11
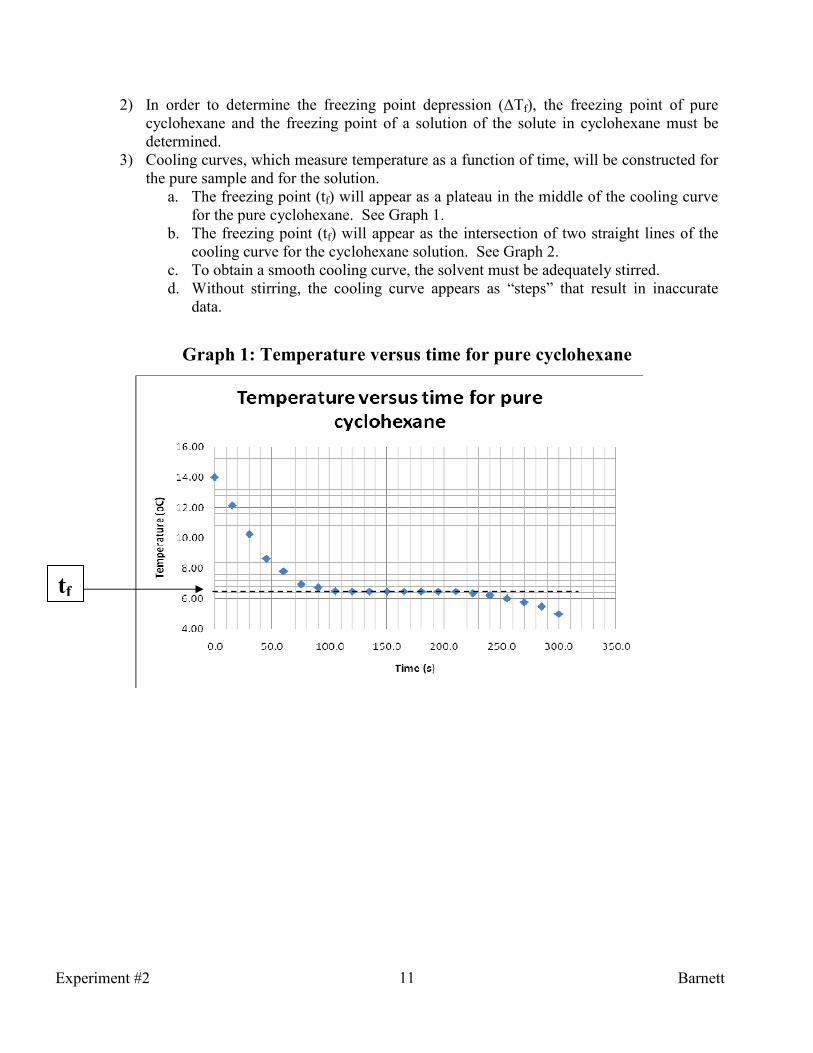
2) In order to determine the freezing point depression (∆Tf), the freezing point of pure
cyclohexane and the freezing point of a solution of the solute in cyclohexane must be
determined.
3) Cooling curves, which measure temperature as a function of time, will be constructed for
the pure sample and for the solution.
a. The freezing point (tf) will appear as a plateau in the middle of the cooling curve
for the pure cyclohexane. See Graph 1.
b. The freezing point (tf) will appear as the intersection of two straight lines of the
cooling curve for the cyclohexane solution. See Graph 2.
c. To obtain a smooth cooling curve, the solvent must be adequately stirred.
d. Without stirring, the cooling curve appears as “steps” that result in inaccurate
data.
Graph 1: Temperature versus time for pure cyclohexane
tf
Experiment #2 Barnett

12
Graph 2: Temperature versus time for cyclohexane solution
The Possible Solutes:
1) Biphenyl
2) Camphor (or DL–Camphor)
3) 1,4–Dichlorobenzene (or para–Dichlorobenzene)
4) Diphenylamine
5) Menthol
6) Naphthalene
7) 2–Nitrobiphenyl
8) Thymol
Part 1
Procedure for Measuring the Freezing Point of Pure Cyclohexane: 1) Obtain a clean and completely dry 25 mL volumetric flask, a small magnetic stir bar, and
a long mercury thermometer*.
a. *An alternative set–up can be implemented using temperature probes in place of
thermometers.
b. If small magnetic stir bars are unavailable, a copper wire can be placed used for
manual stirring.
2) Pipet exactly 20.0 mL of cyclohexane into the volumetric flask.
a. Never pipet by mouth; use a bulb or pipetting device/pump.
b. Calculate and record the mass of cyclohexane in your lab notebook. Hint: Obtain
the density of cyclohexane.
3) Carefully, insert a small magnetic stir bar into the cyclohexane.
tf
Experiment #2 Barnett
13
a. Ensure no solvent splashes out!
b. If a small stir bar is not available, use a copper wire.
4) Carefully, insert the thermometer into the volumetric flask and ensure the bulb is
completely submerged in the cyclohexane.
5) Clamp the volumetric flask to a ring stand or to the lab scaffolding.
6) Obtain a hot plate with stirring capabilities.
a. Place beneath volumetric flask and turn on stir knob to ensure that the stir bar
circulates the cyclohexane.
b. You will NOT need the heating function for the hot plate.
7) In a 400–600 mL beaker, create an ice–water bath.
a. Make sure you have a large volume of ice in the water.
b. You will need to replenish the ice throughout the experiment so fill a separate
beaker with ice and have it readily available.
8) Place the ice–water bath onto the hot plate.
9) Immerse the volumetric flask into the ice–water bath.
a. Ensure that the stir bar is actively stirring the cyclohexane.
b. Also, ensure that no water gets into the volumetric flask.
10) Once the temperature has dropped to about 14oC, begin recording the temperature to
the nearest 0.01oC (or 0.1
oC depending on the sensitivity of the instrument) every 15
seconds.
a. In general, approximately up to ten minutes is required for this recording step.
11) After the cyclohexane has frozen and the temperature has begun to decline below the
freezing point plateau, remove the volumetric flask from the ice–water bath.
12) Allow the cyclohexane to warm up to room temperature and melt completely.
a. The volumetric flask can be cupped in a gloved hand to warm up quickly.
13) Repeat steps 9 – 12 for a second trial.
14) Construct a temperature as a function of time curve to adequately calculate the mean
freezing point for both trials.
a. Ensure major and minor gridlines are turned on.
15) Calculate the mean freezing point.
a. The freezing point (tf) will appear as a plateau in the middle of the cooling curve
for the pure cyclohexane.
16) This cyclohexane will be used for the next part of the experiment; do not discard.
Part 2
Procedure for Measuring the Freezing Point of a Cyclohexane Solution: 1) You will be assigned one known solute; record this information in your lab notebook.
2) Obtain two pieces of waxed weighing paper.
3) Weigh out approximately 0.25 g of solute onto the first weighing paper using an
analytical balance.
a. Record the exact mass of solute in the lab notebook.
b. Label weighing paper as #1 or with the mass with a wax pencil.
c. DO NOT allow the mass of any solute to touch the plate of the balance.
d. Never add solute to the weighing paper INSIDE of the balance; do this outside the
balance and then place onto the balance.
Experiment #2 Barnett

14
4) Weigh out approximately 0.10 g of solute onto the second weigh paper using the same
analytical balance.
a. Record the exact mass of solute in the lab notebook.
b. Label weighing paper as #2 or with the mass with a wax pencil.
5) Transfer the first solute sample (weighing paper #1) into the pure cyclohexane sample.
6) Stir until all solute has dissolved.
7) After the solute has dissolved, place the ice–water bath onto the hot plate.
a. You may have to replenish the ice in the bath.
8) Immerse the volumetric flask into the ice–water bath.
a. Ensure that the stir bar is actively stirring the cyclohexane solution.
9) Once the temperature has dropped to about 14oC, begin recording the temperature to the
nearest 0.01oC (or 0.1
oC depending on the sensitivity of the instrument) every 15
seconds.
10) Continue collecting data until the solution is completely frozen.
11) After the cyclohexane solution has frozen, remove the volumetric flask from the ice–
water bath and allow the solution to melt completely.
a. The volumetric flask can be cupped in a gloved hand to warm up quickly.
12) As the solution is melting, check data to ensure that the temperature has fallen
smoothly. If a stair–step effect can be observed, repeat steps 8 – 11.
13) Add the second sample of solute to the solution (weigh paper #2) and allow to dissolve
completely.
a. Record data under the “Sample #1 + #2” section since you are using a combined
mass of solute.
14) Repeat steps 8 – 11 with the new solution.
15) Once complete, construct a temperature as a function of time curve to adequately
calculate the freezing point for the solution for both trials.
a. The freezing point (tf) will appear as the intersection of two straight lines of the
cooling curve for the cyclohexane solution.
b. Ensure major and minor gridlines are turned on.
16) Calculate the freezing point depression (∆Tf) and the molar mass (Mm) of the solute for
each solution.
17) Calculate the average molar mass and compare to the true molar mass of your known
solute.
Waste Disposal and Lab Clean–Up:
1) All ice water baths can be discarded down the drain UNLESS contaminated with
cyclohexane.
2) All cyclohexane solutions should be place into the appropriately labeled waste container.
a. DO NOT discard these solutions down the drain!
The Lab Write – Up: 1) Determine all values in your data table and discuss relevant data points in your
conclusion.
2) Determine the molar mass of your solute and compare the experimental mean molar mass
to that of the true molar mass.
3) Calculate the percent error and discuss reasons for possible deviations in detail.
Experiment #2 Barnett
15
a. Percent error = [(true value – experimental value)/true value] * 100%
b. Percent error cannot be a negative value. Take the absolute value of the number if
necessary.
6) What would happen to the calculated molar mass if some cyclohexane was allowed to
evaporate?
7) What would happen to the calculated molar mass if the cyclohexane was contaminated
with another solute?
8) If the solutes assigned were unknown, determination of the molar mass via freezing–
point depression could determine the identity. What other tests could have been
performed on the unknown solute to determine identity?
Experiment #2 Barnett

16
Sample Data Table:
Data Recorded/Calculated Data Point(s) a) Solute name:
b) Volume of cyclohexane used in milliliters:
c) Mass of cyclohexane used in grams:
d) Mass of cyclohexane used in kilograms:
e) Freezing point of pure cyclohexane via graph in degrees Celsius: Trial 1: ____________
Trial 2: ____________
f) Mean freezing point of pure cyclohexane in degrees Celsius
([Trial 1 + Trial 2]/2):
g) Mass of solute in sample #1 in grams:
h) Mass of solute in sample #2 in grams:
i) Combined mass of solute (sample #1 + #2) in grams (g + h):
j) Freezing point of solution via graph for sample #1 in degrees
Celsius:
k) Freezing point depression (∆Tf) of solution for sample #1 in
degrees Celsius (f–j):
l) Molality (cm) of solute in cyclohexane solution for sample #1 in
mol/kg†:
m) Moles of solute in cyclohexane solution for sample #1 in mol
(d* l):
n) Molar mass (Mm) of solute for sample #1 in grams per mole
(g/m):
o) Freezing point of solution via graph for sample #1 + #2 in
degrees Celsius:
p) Freezing point depression (∆Tf) of solution for sample #1 + #2 in
degrees Celsius (f–o):
q) Molality (cm) of solute in cyclohexane solution for sample #1 +
#2 in mol/kg†:
r) Moles of solute in cyclohexane solution for sample #1+2 (d*q):
s) Molar mass (Mm) of solute for sample #1 + #2 in grams per mole
(i/r):
t) Mean (average) molar mass (Mm) of solute in grams per mole
([n+s]/2):
u) True molar mass (Mm) of solute in grams per mole:
v) Percent error from true molar mass in percent:
†Use the following formula and solve for molality: ∆Tf = i(Kf)(cm)
Experiment #2 Barnett

17
Freezing Point Data of Pure Cyclohexane:
Trial #1 Trial #2 Time (s) Temp. (
oC) Time (s) Temp. (
oC)
Experiment #2 Barnett

18
Freezing Point Data of Cyclohexane Solution:
Sample #1 Sample #1 + #2 Time (s) Temp. (
oC) Time (s) Temp. (
oC)
Experiment #2 Barnett
19
1
2
3
45 6
7
8
9
1 10
2
3
45 6
7
8
9
11
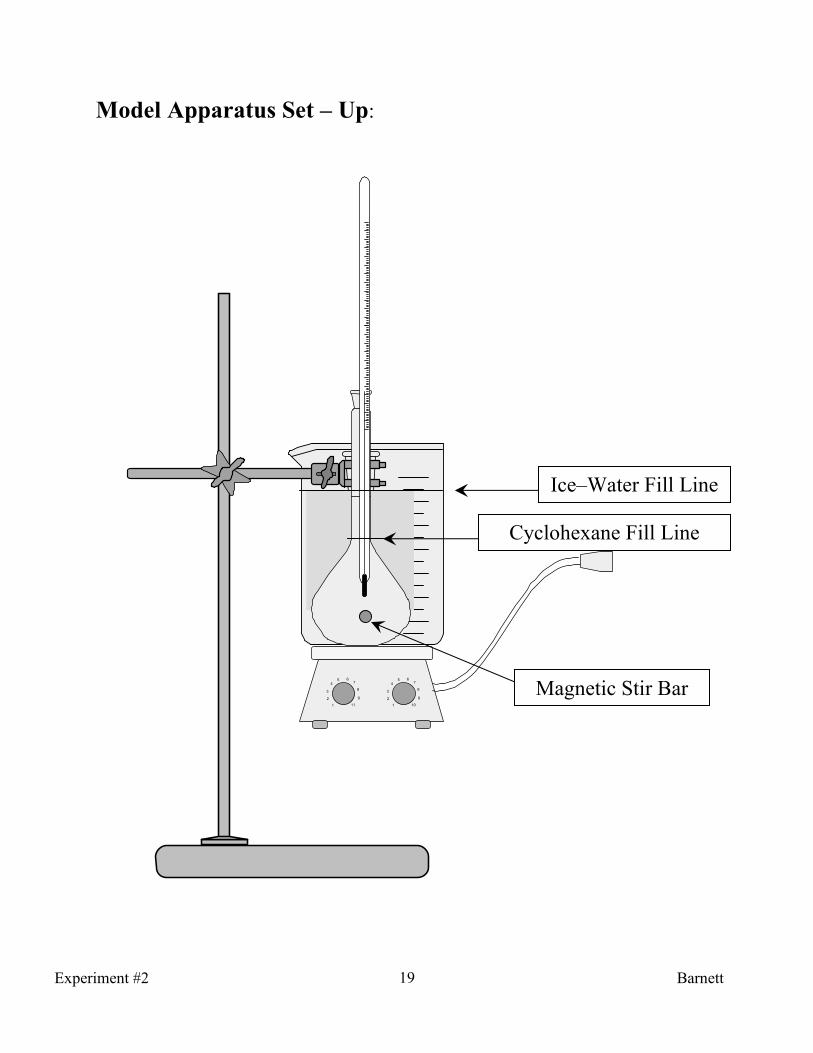
Model Apparatus Set – Up:
Ice–Water Fill Line
Cyclohexane Fill Line
Magnetic Stir Bar
Experiment #2 Barnett
20
Experiment #3A:
The Factors Affecting the Rate of a Reaction and
Determination of the Rate Law
Introduction to Chemical Kinetics:
1) Chemical reactions require varying lengths of time for completion.
a. This reaction rate depends on the characteristics of the reactants and products and
the conditions under which the reaction is run.
2) Chemical kinetics is the study of reaction rates, how reaction rates change under varying
conditions, and what molecular events occur during the overall reaction.
a. The following variables affect the reaction rate:
i. The concentration of the reactants
ii. The concentration of the catalyst
iii. Temperature of the reaction mixture
iv. Surface area of a solid reactant or catalyst
The Factors Affecting Reaction Rates: 1) The concentration of reactants:
a. Often, the rate of a reaction increases when the concentration of a reactant is
increased.
b. Increasing the population of reactants increases the likelihood of a successful
“collision” or interaction between reactants.
c. In some reactions, however, the rate is unaffected by the concentration of a
particular reactant, as long as it is present at some concentration.
2) The concentration of the catalyst:
a. A catalyst is a substance that increases the rate of a reaction without being
consumed in the overall reaction.
b. The catalyst generally does not appear in the overall balanced chemical equation
(although its presence may be indicated by writing its formula over the arrow).
3) The temperature of the reaction mixture:
a. Commonly, the rate of the reaction increases as the temperature increases.
b. A good “rule of thumb” is that reactions approximately double in rate with a 10 oC rise in temperature.
i. Note: This is only a generalization and is not applicable for all reactions!
c. For reactions in solution in a fixed volume, as temperature increases, the kinetic
energy of the reactants also increase causing more “collisions”.
4) The surface area of a solid reactant or catalyst:
a. Because the reaction occurs at the surface of the solid, the rate increases with
increasing surface area.
b. Examples:
i. Wood combusts (burns) faster if the pieces are smaller.
ii. Granular calcium carbonate reacts faster with hydrochloric acid than large
pieces of marble or limestone.
1. CaCO3(s) + 2 HCl(aq) � CaCl2(aq) + 2 H2O(l) + CO2(g)
Experiment #3A Barnett

21
Introduction to Reaction Rates: 1) The reaction rate is the increase in molar concentration of a product of a reaction per unit
time.
a. It can also be expressed as the decrease in molar concentration of a reactant per
unit time.
2) A rate law is an equation that relates the rate of a reaction to the concentration of
reactants (and catalyst) raised to various powers.
a. Example reaction: 2NO2(g) + F2(g) � 2NO2F(g)
i. The rate law: Rate = k[NO2][F2]
ii. Since the rate is directly proportional to the concentrations of NO2 and F2,
the exponents are one for each (and are not shown).
1. When the concentration of nitrogen dioxide is doubled, the
reaction rate doubles.
2. Doubling the concentration of fluorine also doubles the rate of the
reaction.
b. The following chart shows how the rate will change for certain reaction orders as
the concentration of a reactant is doubled:
Reaction Order Rate Change –1 Rate decreases by ½
0 Rate does not change
1 Rate doubles
2 Rate quadruples
Introduction to the Reactions: 1) Part 1: The first reaction is between sodium thiosulfate and hydrochloric acid to produce
colloidal sulfur and salt water.
a. The balanced equation: Na2S2O3(aq) + 2 HCl(aq) � 2 NaCl(aq) + H2O(l) + S(s)
+ SO2(g).
b. The concentration of both reactants will be changed individually to determine the
rate law.
2) Part 2: The second reaction is the oxidation of glucose by potassium permanganate to
carbon dioxide and water.
a. The balanced equation: 3 KMnO4(aq) + C6H12O6(aq) � 3 Mn2+
(aq) + 3 K+(aq) +
6 CO2(g) + 6 H2O(l)
a. The reaction rate will be determined by analyzing this reaction under different
temperatures.
b. Sulfuric acid is used as a catalyst for this reaction.
An Introduction to the Graphs:
1) For part 1, there will be 2 graphs to construct.
a. Graph #1: Plot of the thiosulfate concentration (M) versus the rate of the reaction
(s–1
).
b. Graph #2: Plot the hydrochloric acid concentration (M) versus the rate of the
reaction (s–1
).
Experiment #3A Barnett

22
2) For part 2, there will be 1 graph.
a. Graph #1: Plot of the temperature (oC) versus the rate (s
–1).
Concentration of _____ Versus Rate
0.0
2.0
4.0
6.0
8.0
10.0
12.0
14.0
0.0000 0.0020 0.0040 0.0060 0.0080 0.0100 0.0120 0.0140 0.0160 0.0180
Rate (s-1)
Concentration (M)
Concentration of _____ Versus Rate
0.0
2.0
4.0
6.0
8.0
10.0
12.0
14.0
0.00 50.00 100.00 150.00 200.00
Rate x 10-4 (s-1)
Concentration (M)
First order plot �otice: At a concentration of 4.0 M, the rate is 0.0064 s
–1 and when the concentration is doubled to
8.0 M, the rate increases to 0.0114 s–1
. This is 1.8 times the rate which is approximately doubled.
Second order plot �otice: At a concentration of 4.0 M, the rate is 30 x 10
–4 s
–1 and when the concentration is doubled to
8.0 M, the rate increases to 120 x 10–4
s–1
. This is a 4–fold increase which is second order.
Experiment #3A Barnett
23
Concentration of _____ Versus Rate
0.0
2.0
4.0
6.0
8.0
10.0
12.0
14.0
40.0 45.0 50.0 55.0 60.0 65.0 70.0
Rate x 10-4 (s-1)
Concentration (M)
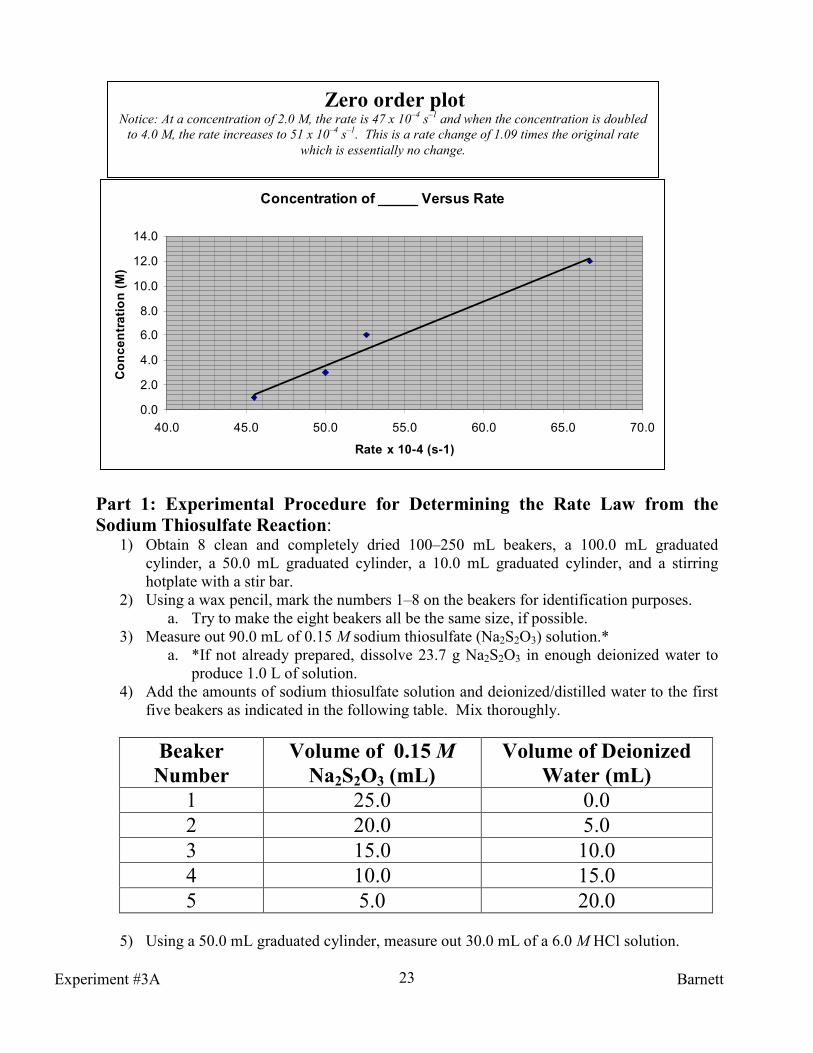
Part 1: Experimental Procedure for Determining the Rate Law from the
Sodium Thiosulfate Reaction: 1) Obtain 8 clean and completely dried 100–250 mL beakers, a 100.0 mL graduated
cylinder, a 50.0 mL graduated cylinder, a 10.0 mL graduated cylinder, and a stirring
hotplate with a stir bar.
2) Using a wax pencil, mark the numbers 1–8 on the beakers for identification purposes.
a. Try to make the eight beakers all be the same size, if possible.
3) Measure out 90.0 mL of 0.15 M sodium thiosulfate (Na2S2O3) solution.*
a. *If not already prepared, dissolve 23.7 g Na2S2O3 in enough deionized water to
produce 1.0 L of solution.
4) Add the amounts of sodium thiosulfate solution and deionized/distilled water to the first
five beakers as indicated in the following table. Mix thoroughly.
Beaker
�umber
Volume of 0.15 M
�a2S2O3 (mL)
Volume of Deionized
Water (mL)
1 25.0 0.0
2 20.0 5.0
3 15.0 10.0
4 10.0 15.0
5 5.0 20.0
5) Using a 50.0 mL graduated cylinder, measure out 30.0 mL of a 6.0 M HCl solution.
Zero order plot �otice: At a concentration of 2.0 M, the rate is 47 x 10
–4 s
–1 and when the concentration is doubled
to 4.0 M, the rate increases to 51 x 10–4
s–1
. This is a rate change of 1.09 times the original rate
which is essentially no change.
Experiment #3A Barnett

24
a. Place the HCl solution into a small beaker and label with a wax pencil.
b. Wear goggles, gloves, and appropriate attire when handling strong acids.
6) Place the first beaker (beaker number 1) on the stirring hotplate, insert the magnetic stir
bar, and set to a moderate stir.
7) Make a small “X” on a white sheet of paper with a pencil and place under the first
beaker.
8) Using a 10.0 mL graduated cylinder, measure out 5.0 mL of 6.0 M HCl solution and
transfer into the first beaker.
a. As soon as the acid touches the sodium thiosulfate solution, immediately start
timing with a stop watch.
9) Cease timing when the “X” is no longer visible through the solution and record this time
(in seconds) in the data table.
10) Calculate the rate of the reaction by taking the inverse of the time recorded.
11) Repeat steps 7 – 11 with the remaining beakers.
a. Ensure that you rinse off and completely dry stir bar before proceeding to the next
beaker.
12) Obtain an additional 75.0 mL of 0.15 M sodium thiosulfate solution.
13) Place 25.0 mL of the sodium thiosulfate solution into beakers 6–8.
a. Do NOT add deionized/distilled water to any of the beakers.
b. Using the same procedure discussed previously, perform the experiment under the
conditions shown in the table below:
Beaker
�umber
Volume of 0.15 M
�a2S2O3 (mL)
Volume (mL) & Concentration
(M) of HCl
6 25.0 5.0 mL 1.0 M HCl
7 25.0 5.0 mL 3.0 M HCl
8 25.0 5.0 mL 12.0 M HCl
14) As soon as the acid touches the sodium thiosulfate solution, immediately start timing
with a stop watch and cease timing when the “X” is no longer visible through the solution
and record this time (in seconds) in the data table.
15) Calculate the rate of the reaction by taking the inverse of the times recorded.
16) After completion, construct the following graphs:
a. Graph #1: Plot of the thiosulfate concentration (M) versus the rate of the reaction
(s–1
).
b. Graph #2: Plot the hydrochloric acid concentration (M) versus the rate of the
reaction (s–1
).
c. Note: The concentration should go on the y–axis and the rate should be placed on
the x–axis.
d. Using linear regression, produce the best fit straight line.
17) Determine the rate equation using the data obtained from the two graphs constructed.
Experiment #3A Barnett

25
Part 2: Experimental Procedure for the Oxidation of Glucose by Potassium
Permanganate: 1) You will be assigned one or more of the temperature ranges in the scheme below. The
entire class must share this information in order to have enough data construct the graph.
2) Obtain a 250 mL Erlenmeyer flask, a 100.0 mL graduated cylinder, a 600 mL beaker, a
ring stand, a 25 mL graduated cylinder, a 2.0 mL pipette with pipetting device/pump, a
10 mL graduated cylinder, a thermometer, a ring stand, a clamp, and a stirring hotplate
with a stir bar.
3) Measure out 75.0 mL of deionized/distilled water using a 100.0 mL graduated cylinder
and place into a 250 mL Erlenmeyer flask.
a. With a wax/grease pencil, label as “reaction flask.”
4) Next, using a 25.0 mL graduated cylinder, carefully measure out 25.0 mL of 2.0 M
sulfuric acid and place into the reaction flask.
5) Using a 2.0 mL pipette with a pipetting device/pump, pipet exactly 4.0 mL of the 0.10 M
potassium permanganate solution into the reaction flask.
a. Ensure pipette is thoroughly cleaned after use!
6) Using a 10.0 mL graduated cylinder, measure out 5.0 mL of 2% glucose solution but do
not add to the flask. It will be added later when a stable temperature range of the
reaction flask is achieved.
7) Add an appropriate amount of water to the 600 mL beaker and place onto the hotplate.
Turn on hotplate to achieve designated temperature range.
8) Immerse the reaction flask into the water bath and clamp to a ring stand.
9) Insert stir bar into the reaction flask and allow for a moderate stirring.
10) Use a thermometer to achieve the temperature range assigned.
11) Once a reasonably stable temperature range has been achieved and has been recorded,
add 5.0 mL of 2% glucose solution and start the timer.
a. Ensure that the temperature is stable (±2.0oC) as the reaction proceeds.
b. Do not allow the sample to boil.
12) Record the time it takes for the purple/pink color to disappear.
13) Repeat steps 1–10 with the following temperature schemes as indicated by your
instructor and share results with class:
Beaker
�umber
Volume of
2.0 M H2SO4
(mL)
Volume of
0.10 M
KMnO4 (mL)
Volume of
2% glucose
solution
(mL)
Temperature
Range to
Achieve (oC)
1 25.0 4.0 5.0 50 – 60
2 25.0 4.0 5.0 60 – 70
3 25.0 4.0 5.0 70 – 80
4 25.0 4.0 5.0 80 – 90
5 25.0 4.0 5.0 90 – 99
Experiment #3A Barnett

26
14) After completion, construct a graph of the temperature (oC) versus the rate (s
–1).
a. The temperature should go on the y–axis and the rate should be placed on the x–
axis.
b. Using linear regression, produce the best fit straight line.
Waste Disposal and Lab Clean–Up: 1) Hot water baths can be discarded down the sink.
2) Place all acidic thiosulfate solutions into the appropriately labeled waste container under
the fume hood.
3) Place all permanganate solutions into the appropriately labeled waste container.
The Lab Write – Up: 1) Determine all values in your data table and discuss relevant data in your conclusion.
2) For part 1, after constructing Graph #1: Plot of the thiosulfate concentration (M) versus
the rate of the reaction (s–1
), discuss the reaction order with respect to this reactant.
3) For part 1, after constructing Graph #2: Plot the hydrochloric acid concentration (M)
versus the rate of the reaction (s–1
), discuss the reaction order with respect to this reactant.
4) For part 1, determine the rate equation for the thiosulfate experiment based on both
Graph #1 and Graph #2 and discuss in your conclusion. Explain using graphical data.
5) For part 2, after constructing a graph of the temperature (oC) versus the rate (s
–1), make a
quantitative statement about how the rate of glucose oxidation varies with the
temperature. Compare to the general “rule of thumb” regarding the reaction rate as
temperature is increased.
6) Discuss all sources of error during this experiment and how they directly affected the
data.
Experiment #3A Barnett
27
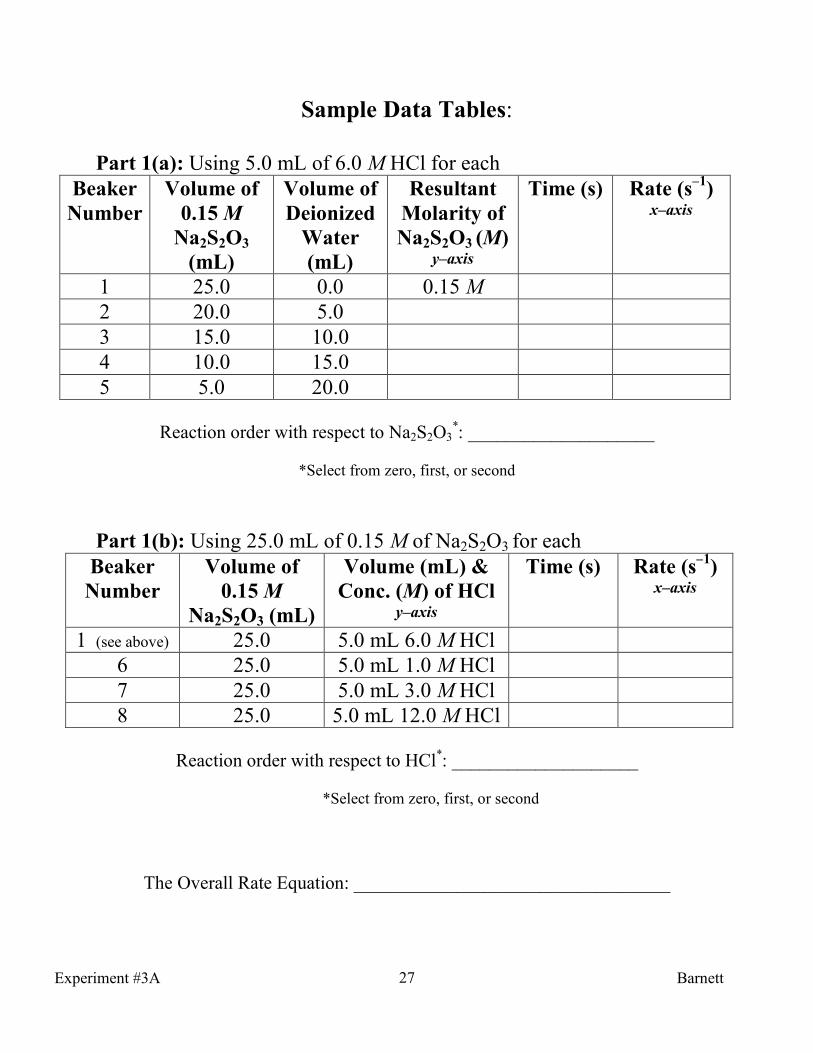
Sample Data Tables:
Part 1(a): Using 5.0 mL of 6.0 M HCl for each
Beaker
�umber
Volume of
0.15 M
�a2S2O3
(mL)
Volume of
Deionized
Water
(mL)
Resultant
Molarity of
�a2S2O3 (M) y–axis
Time (s) Rate (s–1
) x–axis
1 25.0 0.0 0.15 M
2 20.0 5.0
3 15.0 10.0
4 10.0 15.0
5 5.0 20.0
Reaction order with respect to Na2S2O3*: ____________________
*Select from zero, first, or second
Part 1(b): Using 25.0 mL of 0.15 M of Na2S2O3 for each
Beaker
�umber
Volume of
0.15 M
�a2S2O3 (mL)
Volume (mL) &
Conc. (M) of HCl y–axis
Time (s) Rate (s–1
) x–axis
1 (see above) 25.0 5.0 mL 6.0 M HCl
6 25.0 5.0 mL 1.0 M HCl
7 25.0 5.0 mL 3.0 M HCl
8 25.0 5.0 mL 12.0 M HCl
Reaction order with respect to HCl*: ____________________
*Select from zero, first, or second
The Overall Rate Equation: __________________________________
Experiment #3A Barnett

28
Sample Data Tables (Continued):
Part 2: Oxidation of Glucose by Potassium Permanganate:
Beaker
�o.
Volume
of 2.0 M
H2SO4
(mL)
Volume
of 0.10 M
KMnO4
(mL)
Volume
of 2%
glucose
solution
(mL)
Temperature
Range to
Achieve (oC)
Actual
Temp.
(oC)
y–axis
Time
(s)
Rate
(s–1
) x–axis
1 25.0 4.0 5.0 50 – 60
2 25.0 4.0 5.0 60 – 70
3 25.0 4.0 5.0 70 – 80
4 25.0 4.0 5.0 80 – 90
5 25.0 4.0 5.0 90 – 99
Experiment #3A Barnett

29
R C O R1
O
Experiment #4:
The Determination of an Equilibrium Constant for a Fischer
Esterification Reaction
Introduction to the Ester:
1) The ester functional group has this generic structure:
2) Most low molecular weight esters have a pleasant odor that comprises the major flavors
or fragrances of fruits and other pleasing aromatics called “essential oils.”
a. Esters are used commercially in artificial flavors or fragrances.
3) Esters are also main components in some pheromones which elicit a social response in
same species animals.
The Esterification Process: 1) Esters can be prepared in a multitude of ways.
2) The classic ester synthesis is via a Fischer esterification by which a carboxylic acid reacts
with an alcohol in the presence of one a of the following catalysts:
a. A concentrated acid such as sulfuric acid
b. An “alcohol activator” such as p–toluenesulfonic acid
c. The acidic form of an ion exchange resin such as polymeric sulfonic acids
3) The Fischer esterification process requires a long equilibrium based reflux.
a. By manipulating Le Châtelier’s principle, the reaction equilibrium can be shifted
toward product formation.
Introduction to the Equilibrium Constant:
1) A dynamic equilibrium consists of a forward reaction, in which substances react to give
products, and a reverse reaction, in which products react to give the original reactants.
a. Chemical equilibrium is the state reached by a reaction mixture when the rates
of the forward and reverse reactions have become equal.
2) Every reversible system has its own “position of equilibrium” under any given set of
conditions.
a. The ratio of products produced to unreacted reactants for any given reversible
reaction remains constant under constant conditions of pressure and temperature.
b. The numerical value of this ratio is called the equilibrium constant for the given
reaction.
3) The equilibrium-constant expression for a reaction is obtained by multiplying the
concentrations of products, dividing by the concentrations of reactants, and raising each
concentration to a power equal to its coefficient in the balanced chemical equation.
a. Consider the following general equation: aA + bB yY + zZ
4) The equilibrium constant, Kc (or Keq), is the value obtained for the equilibrium–constant
expression when equilibrium concentrations are substituted.
a. The equilibrium constant for the general equation above is:
b. A large Kc (or Keq) indicates large concentrations of products at equilibrium.
Experiment #4 Barnett
ba
zy
eqBA
ZYK
][][
][][=
30
CH3
COH
O
CH3
CHCH3
OH
CH3
CO
O
CHCH3
CH3
+ + H2O
acetic acid
CH3CO2H
HAc
isopropyl alcohol
(2–propanol)
i–PrOH
isopropyl acetate
i–PrAc
water
H2O
c. A small Kc (or Keq) indicates large concentrations of unreacted reactants at
equilibrium.
5) The law of mass action states that the value of the equilibrium constant expression, Kc,
is constant for a particular reaction at a given temperature, whatever equilibrium
concentrations are substituted.
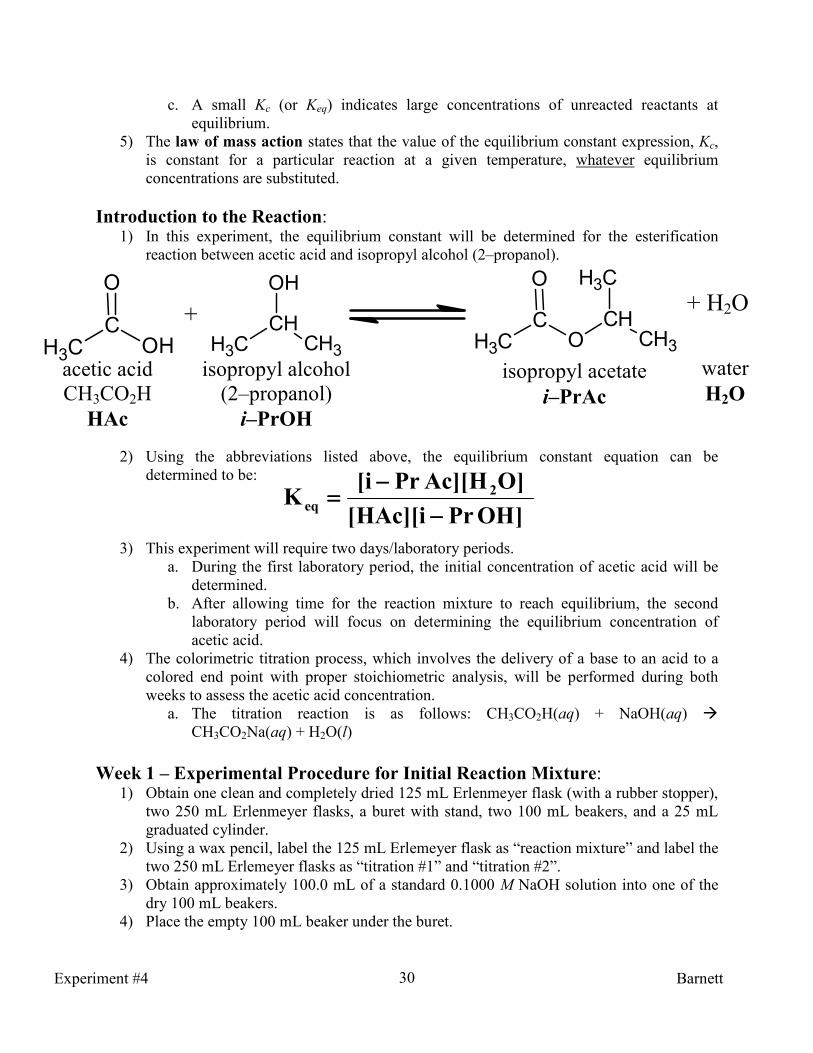
Introduction to the Reaction: 1) In this experiment, the equilibrium constant will be determined for the esterification
reaction between acetic acid and isopropyl alcohol (2–propanol).
2) Using the abbreviations listed above, the equilibrium constant equation can be
determined to be:
3) This experiment will require two days/laboratory periods.
a. During the first laboratory period, the initial concentration of acetic acid will be
determined.
b. After allowing time for the reaction mixture to reach equilibrium, the second
laboratory period will focus on determining the equilibrium concentration of
acetic acid.
4) The colorimetric titration process, which involves the delivery of a base to an acid to a
colored end point with proper stoichiometric analysis, will be performed during both
weeks to assess the acetic acid concentration.
a. The titration reaction is as follows: CH3CO2H(aq) + NaOH(aq) �
CH3CO2Na(aq) + H2O(l)
Week 1 – Experimental Procedure for Initial Reaction Mixture: 1) Obtain one clean and completely dried 125 mL Erlenmeyer flask (with a rubber stopper),
two 250 mL Erlenmeyer flasks, a buret with stand, two 100 mL beakers, and a 25 mL
graduated cylinder.
2) Using a wax pencil, label the 125 mL Erlemeyer flask as “reaction mixture” and label the
two 250 mL Erlemeyer flasks as “titration #1” and “titration #2”.
3) Obtain approximately 100.0 mL of a standard 0.1000 M NaOH solution into one of the
dry 100 mL beakers.
4) Place the empty 100 mL beaker under the buret.
]OHPri][HAc[
]OH][AcPri[K 2
eq−−−−
−−−−====
Experiment #4 Barnett

31
5) Rinse the buret with approximately 10.0 mL of 0.1000 M NaOH solution and discard
into the sink.
6) After rinsing, fill the buret with the remaining 0.1000 M NaOH solution to the 0.00 mL
mark.
a. Keep any remaining NaOH solution for later.
b. Label beaker with “NaOH” with a wax pencil.
7) Place approximately 25.0 mL of deionized water into both titration Erlenmeyer flasks
and set aside with the buret.
8) Using the 25 mL graduated cylinder (marked with 0.2 mL increments), measure 14.3 mL
of glacial acetic acid and transfer into the 125 mL Erlemeyer flask.
a. Record the volume with the highest accuracy.
9) Rinse and completely dry the graduated cylinder.
10) Using the 25 mL graduated cylinder (marked with 0.2 mL increments), measure 19.1
mL of isopropyl alcohol (2–propanol) and transfer into the 125 mL Erlemeyer flask.
a. Record the volume with the highest accuracy.
11) Affix stopper to reaction flask and swirl for several minutes to mix reactants.
12) Using a 1.00 mL volumetric pipette with pipetting device or bulb, transfer 1.00 mL of
the reaction mixture to each of the 250 mL Erlenmeyer flasks labeled “titration #1” and
“titration #2”.
13) Immediately restopper reaction flask to prevent evaporation.
14) Add 5–6 drops of phenolphthalein indicator to each titration flask.
a. Note the initial color of both solutions in your lab notebook.
15) Record the initial level of the NaOH solution in the burette.
16) Place titration flask #1 under the tip of the burette and slowly begin to deliver the
solution into the reaction mixture.
a. Swirl the flask continually.
b. You may add it quickly at first but slow the addition of NaOH when the pink
color lingers.
c. The endpoint of the titration is when the addition of a single added drop of NaOH
solution produces a faint but permanent pink color.
17) Once the endpoint has been reached, record the final level of NaOH solution on the
burette.
18) Refill the buret with NaOH to the 0.00 mL mark and repeat steps 15 – 17 with titration
flask #2.
a. Determine the average volume of NaOH used to titrate 1.00 mL of reaction
mixture.
19) Determine the molarity of acetic acid (HAc) in the reaction mixture.
a. Moles of NaOH = [Molarity (moles/L)][Volume (L)]
b. Moles of HAc = moles of NaOH used
c. Molarity of HAc = (moles of HAc)/(volume of reaction mixture in Liters)
20) Discard titration flasks #1 & #2 into the sink.
21) Refill the burette with 0.1000 M NaOH solution.
22) Clean and dry the 1.00 mL volumetric pipette and both 250 mL Erlenmeyer flasks.
23) Add approximately 25.0 mL of deionized water to each titration flask.
24) Create an ice–water bath large enough to accommodate the 125 mL Erlenmeyer flask
(reaction flask).
Experiment #4 Barnett

32
a. Add reaction flask to the ice–water bath and keep well stoppered.
b. This step will retard the rate of reaction as you add the sulfuric acid.
25) While swirling, add 5 drops of concentrated sulfuric acid to the reaction mixture.
a. Swirl well to ensure mixture becomes homogeneous.
26) Immediately after, pipette 1.00 mL of the reaction mixture to each of the 250 mL
Erlenmeyer flasks labeled “titration #1” and “titration #2”.
a. Note: These titrations should be done with some expedience because the reaction
is proceeding more rapidly.
27) Re–stopper reaction mixture to prevent evaporation.
28) Repeat steps 14–18 above.
29) Calculate the volume of NaOH solution necessary to titrate the sulfuric acid by
subtracting the mean volume used for acetic acid alone from the mean volume of the
mixture of acids.
a. Note: The total volume of NaOH solution needed to titrate this new mixture
should be LARGER than the mixture without the catalyst.
30) Do NOT discard the stoppered 125 mL Erlemeyer flask containing the “reaction
mixture.”
a. Store this mixture until next lab period as instructed by your professor.
31) Discard titration flasks #1 & #2 into the sink.
Week 2 – Experimental Procedure for Equilibrium Reaction Mixture:
1) Obtain two clean and completely dried 250 mL Erlenmeyer flasks, a buret with stand,
two 100 mL beakers, and a 25 mL graduated cylinder.
2) Using a wax pencil, label the two 250 mL Erlemeyer flasks as “titration #1” and
“titration #2”.
3) Obtain approximately 100.0 mL of a standard 0.1000 M NaOH solution into one of the
dry 100 mL beakers.
4) Place the empty 100 mL beaker under the buret.
5) Rinse the buret with approximately 10.0 mL of 0.1000 M NaOH solution and discard
into the sink.
6) After rinsing, fill the buret with the remaining 0.1000 M NaOH solution to the 0.00 mL
mark.
a. Keep any remaining NaOH solution for later.
b. Label beaker with “NaOH” with a wax pencil.
7) Place approximately 25.0 mL of deionized water into both titration Erlenmeyer flasks
and set aside with the buret.
8) Using a 1.00 mL volumetric pipette with pipetting device or bulb, transfer 1.00 mL of the
reaction equilibrium mixture to each of the 250 mL Erlenmeyer flasks labeled “titration
#1” and “titration #2”.
a. Using the waft test, note the odor of the reaction equilibrium mixture.
9) Immediately re–stopper reaction mixture to prevent evaporation.
10) Add 5–6 drops of phenolphthalein indicator to each titration flask.
a. Note the initial color of both solutions in your lab notebook.
11) Record the initial level of the NaOH solution in the burette.
12) Place titration flask #1 under the tip of the burette and slowly begin to deliver the
solution into the reaction mixture.
Experiment #4 Barnett
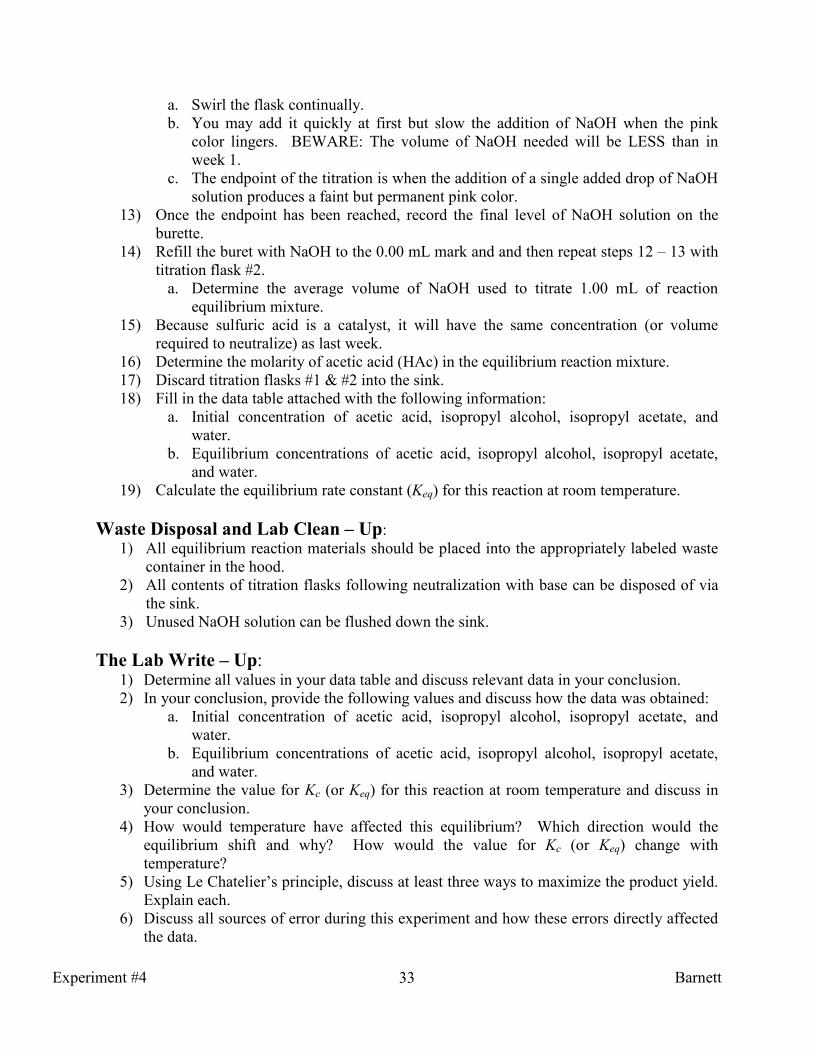
33
a. Swirl the flask continually.
b. You may add it quickly at first but slow the addition of NaOH when the pink
color lingers. BEWARE: The volume of NaOH needed will be LESS than in
week 1.
c. The endpoint of the titration is when the addition of a single added drop of NaOH
solution produces a faint but permanent pink color.
13) Once the endpoint has been reached, record the final level of NaOH solution on the
burette.
14) Refill the buret with NaOH to the 0.00 mL mark and and then repeat steps 12 – 13 with
titration flask #2.
a. Determine the average volume of NaOH used to titrate 1.00 mL of reaction
equilibrium mixture.
15) Because sulfuric acid is a catalyst, it will have the same concentration (or volume
required to neutralize) as last week.
16) Determine the molarity of acetic acid (HAc) in the equilibrium reaction mixture.
17) Discard titration flasks #1 & #2 into the sink.
18) Fill in the data table attached with the following information:
a. Initial concentration of acetic acid, isopropyl alcohol, isopropyl acetate, and
water.
b. Equilibrium concentrations of acetic acid, isopropyl alcohol, isopropyl acetate,
and water.
19) Calculate the equilibrium rate constant (Keq) for this reaction at room temperature.
Waste Disposal and Lab Clean – Up:
1) All equilibrium reaction materials should be placed into the appropriately labeled waste
container in the hood.
2) All contents of titration flasks following neutralization with base can be disposed of via
the sink.
3) Unused NaOH solution can be flushed down the sink.
The Lab Write – Up: 1) Determine all values in your data table and discuss relevant data in your conclusion.
2) In your conclusion, provide the following values and discuss how the data was obtained:
a. Initial concentration of acetic acid, isopropyl alcohol, isopropyl acetate, and
water.
b. Equilibrium concentrations of acetic acid, isopropyl alcohol, isopropyl acetate,
and water.
3) Determine the value for Kc (or Keq) for this reaction at room temperature and discuss in
your conclusion.
4) How would temperature have affected this equilibrium? Which direction would the
equilibrium shift and why? How would the value for Kc (or Keq) change with
temperature?
5) Using Le Chatelier’s principle, discuss at least three ways to maximize the product yield.
Explain each.
6) Discuss all sources of error during this experiment and how these errors directly affected
the data.
Experiment #4 Barnett

34
Sample Data Tables:
Initial Volumes/Concentration:
Volume of acetic acid (mL): _____________________________
Volume of isopropyl alcohol (mL): ________________________
Concentration of standard NaOH solution (M): _______________
WEEK O�E
(Acetic Acid Only)
Titration #1 Titration #2
Volume of reaction
mixture titrated (mL)
1.00 mL 1.00 mL
Volume of NaOH
solution used (mL)
Mean volume of NaOH
solution (mL)
Moles of NaOH
solution used (mol)
Moles of HAc present
(mol)
Molarity of HAc
(mol/L)
WEEK O�E
(Acetic + Sulfuric)
Titration #1 Titration #2
Volume of reaction
mixture titrated (mL)
1.00 mL 1.00 mL
Volume of NaOH
solution used (mL)
Mean volume of NaOH
solution (mL)
Volume correction to be
applied in week 2 (mL)
(Volume of NaOH
necessary to react with
sulfuric acid catalyst)
Experiment #4 Barnett
35
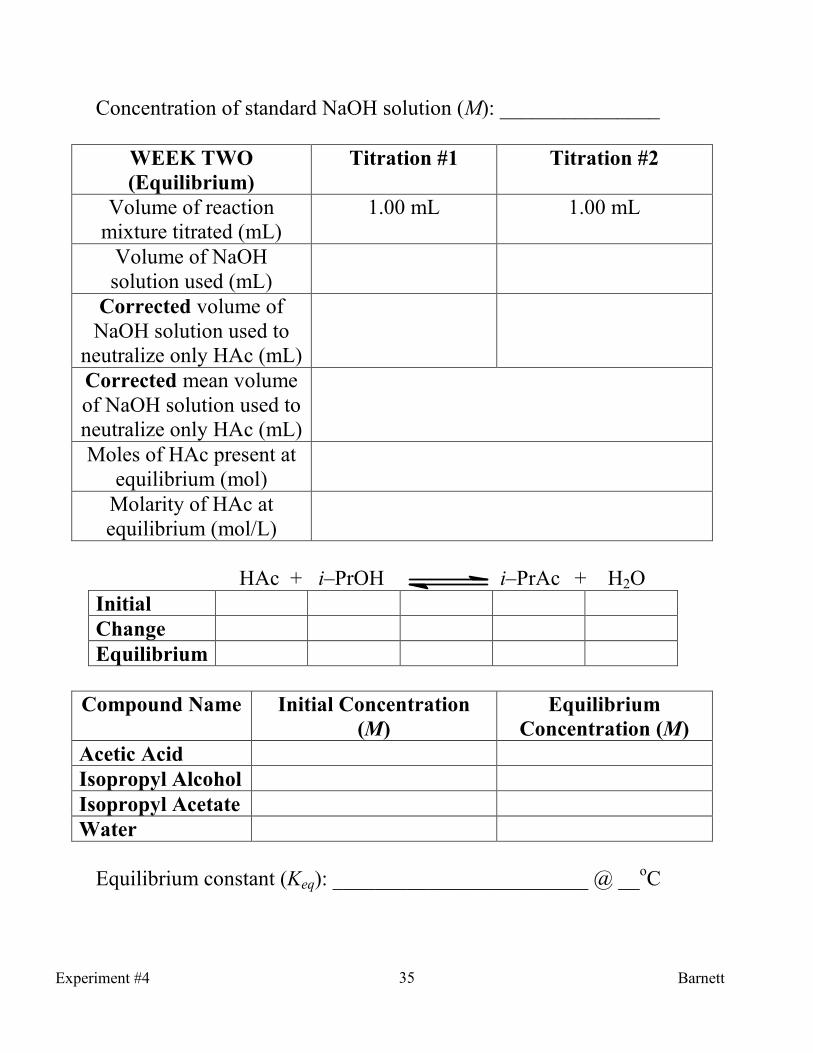
Concentration of standard NaOH solution (M): _______________
WEEK TWO
(Equilibrium)
Titration #1 Titration #2
Volume of reaction
mixture titrated (mL)
1.00 mL 1.00 mL
Volume of NaOH
solution used (mL)
Corrected volume of
NaOH solution used to
neutralize only HAc (mL)
Corrected mean volume
of NaOH solution used to
neutralize only HAc (mL)
Moles of HAc present at
equilibrium (mol)
Molarity of HAc at
equilibrium (mol/L)
HAc + i–PrOH i–PrAc + H2O
Initial
Change
Equilibrium
Compound �ame Initial Concentration
(M)
Equilibrium
Concentration (M)
Acetic Acid
Isopropyl Alcohol
Isopropyl Acetate
Water
Equilibrium constant (Keq): ________________________ @ __oC
Experiment #4 Barnett

36
Experiment #5:
Le Chatelier’s Principle of Reaction Equilibrium for
Complex–Ion Systems
An Introduction to Le Chatelier’s Principle: 1) All undisturbed reactions are at chemical equilibrium.
a. Example: CO(g) + 3 H2(g) CH4(g) + H2O(g)
2) Chemists attempt to maximize product yields by running the reaction under proper
conditions.
a. This will require a “disturbance” of the equilibrium to shift the reactions to favor
the product side of the reaction.
b. The following conditions can be changed to maximize product yields:
i. Changing the concentrations of the product(s) by removal
ii. Changing the concentrations of the reactant(s) by adding additional
amounts
iii. Changing the partial pressure of the gaseous reactants and products by
modifying the volume
iv. Changing the temperature of the reaction mixture
3) Le Chatelier’s principle states that when a system at chemical equilibrium is disturbed
by a change in temperature, pressure, or concentration, the equilibrium will shift to
counteract this disturbance.
The Conditions of Le Chatelier’s Principle: 1) There are a number of conditions that can be changed that will disturb the equilibrium of
a reaction.
2) Consider the equilibrium reaction depicted above: CO(g) + 3 H2(g) CH4(g) +
H2O(g)
3) Reactant and product concentrations:
a. If the products (methane or water) were removed from the system at equilibrium,
the reaction would shift to the right to produce more product.
b. If additional amounts of reactants (carbon monoxide and/or hydrogen) were
added, the reaction would again shift to the right to produce more product.
c. Alternatively, the addition of additional amounts of product(s) or removal of
reactant(s) would shift the equilibrium to the left.
4) Volume effects:
a. A pressure change caused by changing the volume of the reaction vessel can
affect the yield of products in a gaseous reaction only if the reaction involves a
change in the total moles of gas present.
i. In the equilibrium reaction above, four moles of gaseous reactants (1 mole
of CO and 3 moles of H2) are producing two moles of gaseous products (1
mole of CH4 and 1 mole of H2O).
1. Thus, the products require less space than the reactants so reducing
the volume of the reaction vessel would, therefore, favor the
products.
Experiment #5 Barnett
37
2. The reverse holds if there are fewer moles of gaseous reactants
than products.
5) Pressure effects:
a. Increasing the pressure (or “squeezing”) of the reaction mixture will cause a shift
in the equilibrium toward the fewer moles of gas.
i. Thus, in this equilibrium reaction above, increasing the pressure would
shift the equilibrium left and increase concentrations of products.
b. Conversely, reducing the pressure in the reaction vessel by increasing its volume
would have the opposite effect.
c. In the event that the number of moles of gaseous product equals the number of
moles of gaseous reactant, vessel volume (and pressure) will have no effect on the
position of the equilibrium.
6) Temperature effects:
a. Temperature has a significant effect on most reactions.
i. Reaction rates generally increase with an increase in temperature.
Consequently, equilibrium is established sooner.
ii. In addition, the numerical value of the equilibrium constant, Kc, varies
with temperature.
b. For an exothermic process:
i. The change in enthalpy (∆H) is negative meaning that heat is released;
heat, therefore, can be considered a product.
ii. Increasing temperature would be analogous to adding more product,
causing the equilibrium to shift left.
iii. Since “heat” does not appear in the equilibrium-constant expression, this
change would result in a smaller numerical value for Kc.
c. For an endothermic process:
i. The change in enthalpy (∆H) is positive meaning that heat is absorbed;
heat, therefore, can be considered a reactant.
ii. Increasing temperature would be analogous to adding more reactant,
causing the equilibrium to shift right.
iii. This change results in more product at equilibrium, and a larger numerical
value for Kc.
List of the Reactants: 1) 0.10 M Fe(NO3)3
2) 0.10 M KSCN
3) 0.10 M AgNO3
4) 0.10 M Cu(NO3)2
5) 6.0 M NH4OH
6) 14.8 M HNO3 (concentrated)
7) 0.50 M Co(NO3)2
8) 12.0 M HCl (concentrated)
Experiment #5 Barnett
38
Introduction to the Equilibrium Reactions:
Part 1: The equilibrium between Fe
3+ and SC�
– with [FeSC�]
2+:
1) The equilibrium between Fe3+
(aq) and SCN–(aq) with [FeSCN]
2+(aq) will be studied.
a. The equilibrium will be assessed following the addition of extra Fe3+
(aq) and
SCN–(aq) compared to the reference.
b. In addition, Ag+(aq) will be introduced to form the complex [Ag(SCN)4]
3–
i. An assessment to which thiocyanate complex (the iron or the silver) is
more stable will be performed.
ii. The most stable complex will have the largest value for the formation
constant, Kf.
Part 2: The equilibrium between [Cu(H2O)4]2+
and [Cu(�H3)4]2+
: 1) A copper (II) complex with water and NH3 will be studied and compared.
a. The equilibrium between [Cu(H2O)4]2+
(aq) and [Cu(NH3)4]2+
(aq) will be
established.
i. Water and ammonia will be added to disturb the equilibrium.
ii. In addition, nitric acid will be added and the observed shift of equilibrium
will be assessed.
Part 3: The equilibrium between [Co(H2O)6]2+
and [CoCl4]2–
: 1) The equilibrium between [Co(H2O)6]
2+(aq)
and [CoCl4]
2–(aq)
will be studied.
a. The equilibrium will be assessed at different temperatures to determine which
complex is dominant.
Experimental Procedure–Part 1
The equilibrium between Fe3+
and SC�– with [FeSC�]
2+:
1) Obtain 4 clean and completely dried test tubes, a 100 – 150 mL beaker, a 10.0 mL
graduated cylinder, a 25.0 mL graduated cylinder, and a glass stirring rod.
2) Using a wax/grease pencil, mark the numbers 1–4 on the test tubes for identification
purposes.
3) Measure out 25.0 mL of deionized water in a graduated cylinder and transfer into the
beaker.
4) Add 25 drops of 0.10 M Fe(NO3)3 and 25 drops of 0.10 M KSCN to the beaker.
5) Stir thoroughly with a stirring rod.
6) Add 4.0 mL of this solution into each of the test tubes using the 10.0 mL graduated
cylinder.
7) To test tube #1, add 10 drops of deionized water and stir thoroughly. This is considered
your reference point at which the equilibrium is undisturbed.
a. Record color and clarity of solution.
8) To test tube #2, add 10 drops of 0.10 M Fe(NO3)3 and mix thoroughly.
a. Record color and clarity of solution.
9) To test tube #3, add 10 drops of 0.10 M KSCN and mix thoroughly.
Experiment #5 Barnett

39
a. Record color and clarity of solution.
10) To test tube #4, add 10 drops of 0.10 M AgNO3 and mix thoroughly.
a. Record color and clarity of solution.
11) Compare all four test tubes to one another by analyzing the intensity of the color.
a. The larger the concentration of Fe(SCN)2+
, the more intense the original color.
b. If results are unclear, place test tubes against a background of plain white paper.
12) To test tube #4, add 10 drops of 0.10 M Fe(NO3)3 and mix thoroughly.
a. Record color and clarity of solution.
b. Note if the solution returns to the original color and make an assessment to which
thiocyanate complex (the iron or the silver) is more stable.
Experimental Procedure – Part 2
The equilibrium between [Cu(H2O)4]2+
and [Cu(�H3)4]2+
: 1) Obtain 8 clean and completely dried test tubes, a glass stirring rod, and a 10 mL
graduated cylinder.
a. Label the test tubes with a wax pencil as #1 – #8.
2) Note the color and clarity of the original copper (II) nitrate solution.
3) To all eight test tubes, add 20 drops of the 0.10 M Cu(NO3)2.
4) To test tubes #1 – #4, add 20 drops of deionized water.
a. Record color and clarity of solution.
b. This is considered your reference point at which the equilibrium is undisturbed for
[Cu(H2O)4]2+
.
5) To test tube #2, add 1.0 mL of deionized water.
a. Record color and clarity of solution.
b. Compare to reference.
6) To test tube #3, add 1.0 mL of the 0.10 M Cu(NO3)2.
a. Record color and clarity of solution.
b. Compare to reference.
7) To test tube #4, add 1.0 mL of a 6.0 M NH4OH (source of NH3).
a. Record color and clarity of solution.
b. Compare to reference.
8) To test tubes #5 – #8, add 20 drops of a 6.0 M NH4OH (source of NH3).
a. Record color and clarity of solution.
b. This is considered your reference point at which the equilibrium is undisturbed for
[Cu(NH3)4]2+
.
9) To test tube #6, add 1.0 mL of deionized water.
a. Record color and clarity of solution.
b. Compare to reference.
10) To test tube #7, add 1.0 mL of a 6.0 M NH4OH (source of NH3).
a. Record color and clarity of solution.
b. Compare to reference.
11) To test tube #8, add 1.0 mL of a 14.8 M HNO3.
a. Record color and clarity of solution.
b. Compare to reference.
Experiment #5 Barnett

40
Procedure – Part 3
The equilibrium between [Co(H2O)6]2+
and [CoCl4]2–
: 1) Obtain two clean and completely dried test tubes, a glass stirring rod, two 250 mL
beakers, and a hot plate.
a. Label test tubes as #1 and #2 with a wax pencil.
2) Create a hot water bath by filling the first 250 mL beaker to the 200 mL mark with water
and placing onto the hot plate.*
a. Heat until a moderate boil is achieved.
b. *An alternate heating set–up can be implemented by using a ring stand and a
Bunsen burner.
3) Create an ice water bath with the second 250 mL beaker by adding ice and water to the
200 mL mark.
4) Add 20 drops of 0.50 M Co(NO3)2 to test tube #1.
a. Record the color and clarity of the solution.
5) Add 20 drops of deionized water to test tube #1.
a. Record the color and clarity of the solution.
b. At room temperature, this is considered your reference point at which the
equilibrium is undisturbed for the formation of [Co(H2O)6]2+
.
6) Add 20 drops of 0.50 M Co(NO3)2 to test tube #2.
a. Record the color and clarity of the solution.
7) Add 20 drops of concentrated 12.0 M HCl to test tube #2 and swirl until homogeneous.
a. Use glass stirring rod if necessary. Ensure that the glass rod is rinsed and dried
after use due to the presence of concentrated acid.
b. Record the color and clarity of the solution.
c. Compare color & clarity to that of test tube #1.
8) To test tube #1, add 20 drops of deionized water and swirl until homogeneous.
a. Use glass stirring rod if necessary. Ensure that the glass rod is rinsed and dried
after use.
b. Record the color and clarity of the solution.
9) To test tube #2, add 20 drops of deionized water and swirl until homogeneous.
a. Use glass stirring rod if necessary. Ensure that the glass rod is rinsed and dried
after use due to the presence of concentrated acid.
b. At room temperature, consider this the equilibrium between [CoCl4]2–
and
[Co(H2O)6]2+
. Compare color & clarity to that of test tube #1.
10) Using clamps, secure both test tubes to a ring stand and/or the metal scaffolding.
11) Place the test tubes into the boiling water for a few minutes until a color change has
occurred.
a. Record the color and clarity of each solution.
12) Allow test tubes to cool briefly but not to room temperature.
13) Next, immerse the test tubes into the ice water bath for a few minutes until a color
change has occurred.
a. Record the color and clarity of the solution.
14) Considering all data observed, determine how temperature affected the equilibrium and
determine whether the formation of [Co(H2O)6]2+
and [CoCl4]2–
are endothermic or
exothermic.
Experiment #5 Barnett

41
Waste Disposal and Lab Clean – Up:
1) Place all heavy metal solutions into labeled waste containers.
2) Hot water and ice–water baths can be poured down the drain.
The Lab Write – Up: 1) Determine all values in your data table and discuss relevant data in your conclusion.
2) Provide equilibrium equations for each reaction under the balanced equation section.
3) For all parts, use Le Chatelier’s principle to explain the different color and clarities and
how they relate to the disturbance of the equilibrium in your conclusion.
a. Discuss how the equilibrium was disturbed by each reaction process.
b. For each reaction process, where the reactants or products favored?
4) For part 1, determine which thiocyanate complex (the iron or the silver) is more stable.
Which has a larger Kf? Explain.
5) For part 2, which complex has a larger Kf, [Cu(H2O)4]2+
(aq) or [Cu(NH3)4]2+
(aq)? How
did HNO3 affect the equilibrium for [Cu(NH3)4]2+
(aq)? Provide a reaction to explain.
6) For part 3, is the formation of [Co(H2O)6]2+
(aq) endothermic or exothermic? Is the
formation of [CoCl4]2–
(aq) endothermic or exothermic? Explain by how temperature
modified the color.
7) Discuss all sources of error during this experiment and how they directly affected the
data.
The Balanced Equilibrium Equations:
Part Reactant(s) Product(s)
1 ___ Fe3+
(aq) + ___ SC�–(aq)
1 ___ Ag+(aq) + ___ SC�
–(aq)
1 ___ [FeSC�]2+
(aq) + ___ Ag+(aq)
1 ___ [Ag(SC�)4]3–
(aq) +___ Fe3+
(aq)
2 ___ Cu2+
(aq) + ___ H2O(l)
2 ___ Cu2+
(aq) + ___ �H3(aq)
2 ___ [Cu(H2O)4]2+
(aq) + ___ �H3(aq)
2 ___ [Cu(�H3)4]2+
(aq) + ___ H2O(l)
2 ___ H�O3(aq) + ___ �H3(aq)
2* ___ �H4OH(aq)
3 ___ Co2+
(aq) + ___ H2O(l)
3 ___ Co2+
(aq) + ___ Cl–(aq)
3 ___ [Co(H2O)6]2+
(aq) + ___ Cl–(aq)
3 ___ [CoCl4]2–
(aq) + ___ H2O(l)
*Side reaction
Experiment #5 Barnett
42
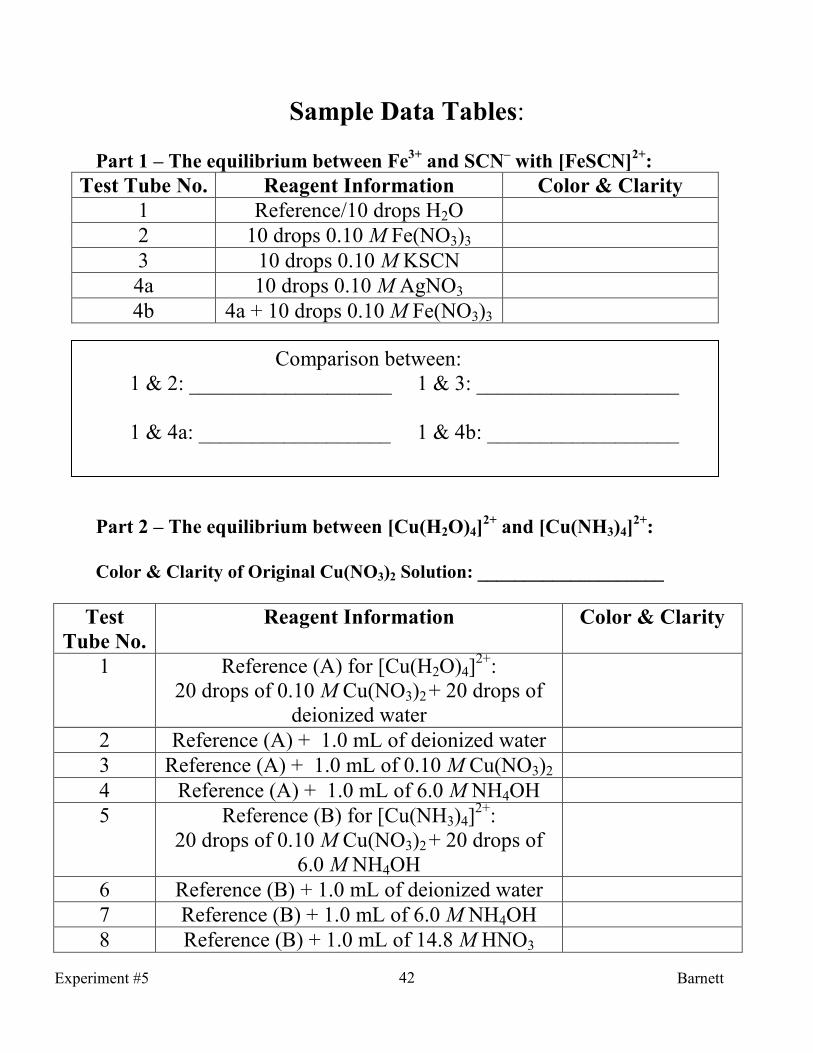
Sample Data Tables:
Part 1 – The equilibrium between Fe3+
and SC�– with [FeSC�]
2+:
Test Tube �o. Reagent Information Color & Clarity
1 Reference/10 drops H2O
2 10 drops 0.10 M Fe(NO3)3
3 10 drops 0.10 M KSCN
4a 10 drops 0.10 M AgNO3
4b 4a + 10 drops 0.10 M Fe(NO3)3
Part 2 – The equilibrium between [Cu(H2O)4]2+
and [Cu(�H3)4]2+
:
Color & Clarity of Original Cu(�O3)2 Solution: ____________________
Test
Tube �o.
Reagent Information Color & Clarity
1 Reference (A) for [Cu(H2O)4]2+
:
20 drops of 0.10 M Cu(NO3)2 + 20 drops of
deionized water
2 Reference (A) + 1.0 mL of deionized water
3 Reference (A) + 1.0 mL of 0.10 M Cu(NO3)2
4 Reference (A) + 1.0 mL of 6.0 M NH4OH
5 Reference (B) for [Cu(NH3)4]2+
:
20 drops of 0.10 M Cu(NO3)2 + 20 drops of
6.0 M NH4OH
6 Reference (B) + 1.0 mL of deionized water
7 Reference (B) + 1.0 mL of 6.0 M NH4OH
8 Reference (B) + 1.0 mL of 14.8 M HNO3
Comparison between:
1 & 2: ___________________ 1 & 3: ___________________
1 & 4a: __________________ 1 & 4b: __________________
Experiment #5 Barnett
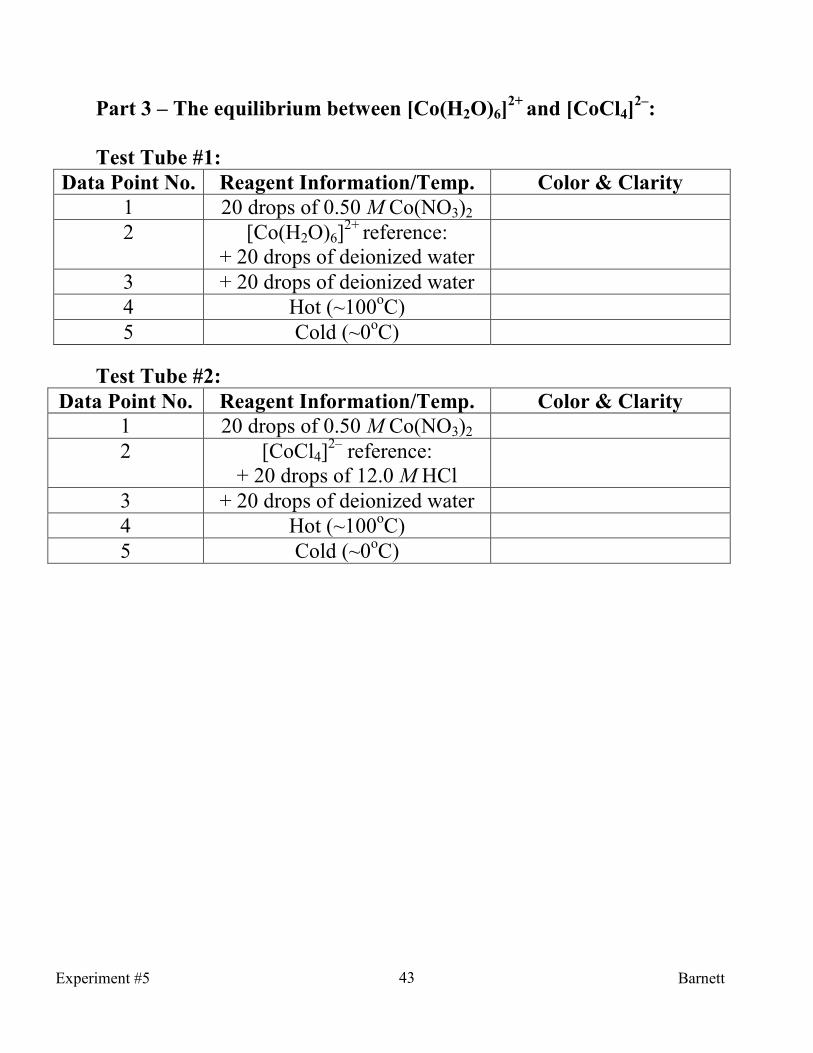
43
Part 3 – The equilibrium between [Co(H2O)6]2+
and [CoCl4]2–
:
Test Tube #1:
Data Point �o. Reagent Information/Temp. Color & Clarity
1 20 drops of 0.50 M Co(NO3)2
2 [Co(H2O)6]2+
reference:
+ 20 drops of deionized water
3 + 20 drops of deionized water
4 Hot (~100oC)
5 Cold (~0oC)
Test Tube #2:
Data Point �o. Reagent Information/Temp. Color & Clarity
1 20 drops of 0.50 M Co(NO3)2
2 [CoCl4]2–
reference:
+ 20 drops of 12.0 M HCl
3 + 20 drops of deionized water
4 Hot (~100oC)
5 Cold (~0oC)
Experiment #5 Barnett

44
Experiment #6:
The Relative Strengths of Acids;
An Introduction to Acidity and pH
An Introduction to the Acid–Base Theories: 1) There are three theories that classify acids and bases.
a. The Arrhenius concept
i. In this theory, an acid is a substance that, when dissolved in water,
increases the concentration of hydronium ion (H3O+).
ii. A base, in the Arrhenius concept, is a substance that, when dissolved in
water, increases the concentration of hydroxide ion, OH–(aq).
b. The Brønstead–Lowry concept
i. An acid is the species donating a proton in a proton–transfer reaction.
ii. A base is the species accepting a proton in a proton–transfer reaction.
c. The Lewis concept
i. In the Lewis concept, an acid is defined as an electron pair acceptor and a
base is an electron pair donor.
2) The Brønsted–Lowry concept introduces the idea of conjugate acid–base pairs in
proton–transfer reactions.
3) A conjugate acid – base pair consists of two species in an acid–base reaction, the first an
acid and the second a base, that differ by the loss or gain of a proton.
4) When the acid–base reaction is reversible, both forward and backward directions involve
proton transfer reactions.
a. Example: NH3(aq) + H2O(l) NH4+(aq) +
–OH(aq)
i. In the forward direction, the ammonia (NH3) functions as a base and water
(H2O) as the acid.
ii. In the forward direction, the ammonium ion (NH4+) functions as a
conjugate acid and hydroxide ion (–OH) as the conjugate base.
iii. NH4+ and NH3 is an example of a conjugate acid–base pair.
The Self – Ionization of Water and an Introduction to pH: 1) Although it has a small equilibrium constant, water autoionizes into the hydroxide and
hydronium ions as shown by the following equilibrium reaction:
a. H2O(l) + H2O(l) H3O+(aq) + OH
–(aq)
2) With this equation, the equilibrium express for the self–ionization is as follows:
a.
3) The concentration of ions is extremely small, so the concentration of H2O remains
essentially constant; thus, the equilibrium expression can be written as:
a. [H2O]2
Kc = [H3O+][OH
–]
b. [H2O]2
Kc is a constant and is called the ion–product constant for water, which
is depicted as Kw.
c. Kw = [H3O+][OH
–]
d. At 25 oC, the value of Kw is 1.0 x 10
–14.
2
2
3
][
]][[
OH
OHOHKc
−+
=
Experiment #6 Barnett
45
i. Like any equilibrium constant, Kw varies with temperature.
4) Because of this self–ionization, all aqueous solutions, whether they are acidic, neutral, or
basic, can be compared by expressing their hydronium ion concentration.
a. For acidic solutions: [H3O+] > 1.0 x 10
–7 M
b. For neutral solutions: [H3O+] = 1.0 x 10
–7 M
c. For basic solutions: [H3O+] < 1.0 x 10
–7 M
5) These concentrations are small so it is more convenient to express acidity in terms of pH.
a. pH is defined as the negative logarithm of the molar hydronium ion concentration.
b. pH = –log[H3O+]
The Relative Strength of Acids: 1) In the Brønsted–Lowry concept, it is practical to consider acid–base reactions as a
competition for protons.
2) Acids can be ranked by their relative strengths as proton donors.
3) Stronger acids will lose protons more effectively than weaker ones.
a. Thus, strong acids completely ionize when dissolved in water and the reverse
reaction only occurs to a small extent.
b. Example: HClO4(aq) + H2O(l) � ClO4–(aq) + H3O
+(aq)
4) There are two factors that govern the strength of an acid; bond polarity and bond strength.
a. The more polarized the bond, the more the electrons within the sigma bond are
unequally distributed, and the easier the hydrogen can be removed.
i. Bond polarity is directly related to the dipole created from differences in
atomic electronegativities. The larger the electronegativity difference, the
stronger the acid.
b. The weaker the bond, the easier the proton is removed, and the stronger the acid.
i. Bond strength is inversely proportional to the size of the atom bonded to
the hydrogen.
ii. The larger the atom bonded to the hydrogen, the weaker the bond, and the
stronger the acid.
5) For a series of oxoacids, the acid strengths increase as the number of oxygen atoms
bonded to the central atom attached to the hydrogen.
a. Because the central atom becomes more electronegative with increasing oxygens,
the oxoacid becomes stronger.
The Acids to Assess: 1) B(OH)3 (0.10 M and 0.50 M)
2) HNO3 (0.10 M and 0.50 M)
3) H2SO4 (0.10 M and 0.50 M)
4) H3PO4 (0.10 M and 0.50 M)
5) HC2H3O2 (0.10 M and 0.50 M)
6) H2O
7) Fruit Juices (Apple, Grapefruit, Orange, Tomato)
8) Vinegar
9) Ultra Bleach
10) Diet Pepsi®
Experiment #6 Barnett
46
Pre–Lab Information: 1) Obtain the values for electronegativity for hydrogen, oxygen, nitrogen, phosphorus,
carbon, sulfur, and boron. Record in data table and provide an appropriate reference.
2) Determine the IUPAC names for the first five acids listed and provide the Lewis–Dot
structures for each. Record in data table.
3) Note: Proper lab attire is required for this experiment. Students not dressed appropriately
will not be permitted into the lab.
Procedure for Assessing pH: 1) Obtain 17 clean and completely dried test tubes, one clean and dried 10.0 mL graduated
cylinder, and one glass stirring rod.
a. It would be advisable to line your workspace with paper towels.
2) Obtain wide range pH paper and a pH probe (or pH meter).
a. If advised, calibrate the pH probe with the buffer solutions provided.
3) Remove the pH probe from the electrode storage solution and rinse well with
deionized/distilled water to achieve a pH of around 7.0.
a. Do not discard electrode solution unless advised.
4) Soak the pH probes in deionized/distilled water in a 250 mL beaker.
a. Record the pH value in the data table.
5) With a wax pencil, label each of the test tubes by their molarity and acidic identity.
6) Place approximately 5–10 mL of each acid into their labeled test tube.
7) Obtain a paper towel on which to place a piece of pH paper.
8) Insert the glass stirring rod into the first solution and transfer a drop of the acid onto the
pH paper.
9) With the color guide attached, record the pH with the greatest accuracy.
a. Place this value in the data table.
10) Next, carefully dry off the probe with a Kimwipe, insert the pH probe into the solution,
and allow the for a stable pH value.
a. Record this value in the data table.
11) Using deionized/distilled water, thoroughly rinse off the pH probe and then store in a
250 mL beaker of deionized water with the probe completely immersed.
12) Repeat steps 8–11 with all remaining solutions, including the household solutions.
a. Do not forget to rinse off probe and dry with a Kimwipe between each
measurement.
13) For all of the acids (and molarities), calculate the hydronium ion concentrations based
on the probe measurements.
Waste Disposal: 1) All acids should be placed into the appropriately labeled waste container for
neutralization and disposal.
2) Return pH probe to the electrode storage solution.
3) All household products can be placed down the sink.
Experiment #6 Barnett
47
The Lab Write – Up: 1) Determine all values in your data table and discuss relevant data in your conclusion.
2) Discuss the precision and accuracy of using pH paper versus the pH probes providing
empirical evidence.
3) For each set of molarities (0.10 M and 0.50 M), place the following acidic solutions in
order of increasing acidity: B(OH)3, HNO3, H2SO4, H3PO4, HC2H3O2.
a. Place them in the correct order if above is incorrect.
b. Discussing molecular structure, bond polarity, and bond strength, provide reasons
how and why this order of acidity can be predicted.
4) Place the fruit juices in order of increasing acidity. Which fruit juice would be most
troublesome for patients suffering from acid–reflux disease?
5) How does the acidity of household vinegar compare to the 0.10 M and 0.50 M solutions?
Speculate on an approximate molarity.
6) The active ingredient in household bleach is sodium hypochlorite. Show the balanced
equilibrium reaction by which this produces hypochlorous acid. In this concentration,
how does it compare to the acids in question #3?
7) There are three main acidic compounds in Diet Pepsi®. What are these compounds?
Show the balanced equation by which the one gaseous acidic oxide produces an acid
when dissolved in water. Based on the pH and other factors, what health consequences
are in store for those that drink this beverage regularly?
8) Discuss all sources of error during this experiment and how the error directly affects the
results.
Experiment #6 Barnett

48
Pre–Lab Sample Data Tables:
Element Electronegativity H
B
C
N
O
S
P Reference(s): ________________________________________________
____________________________________________
Molecular Formula IUPAC �ame Lewis–Dot Structure
B(OH)3
HNO3
H2SO4
H3PO4
HC2H3O2
Experiment #6 Barnett
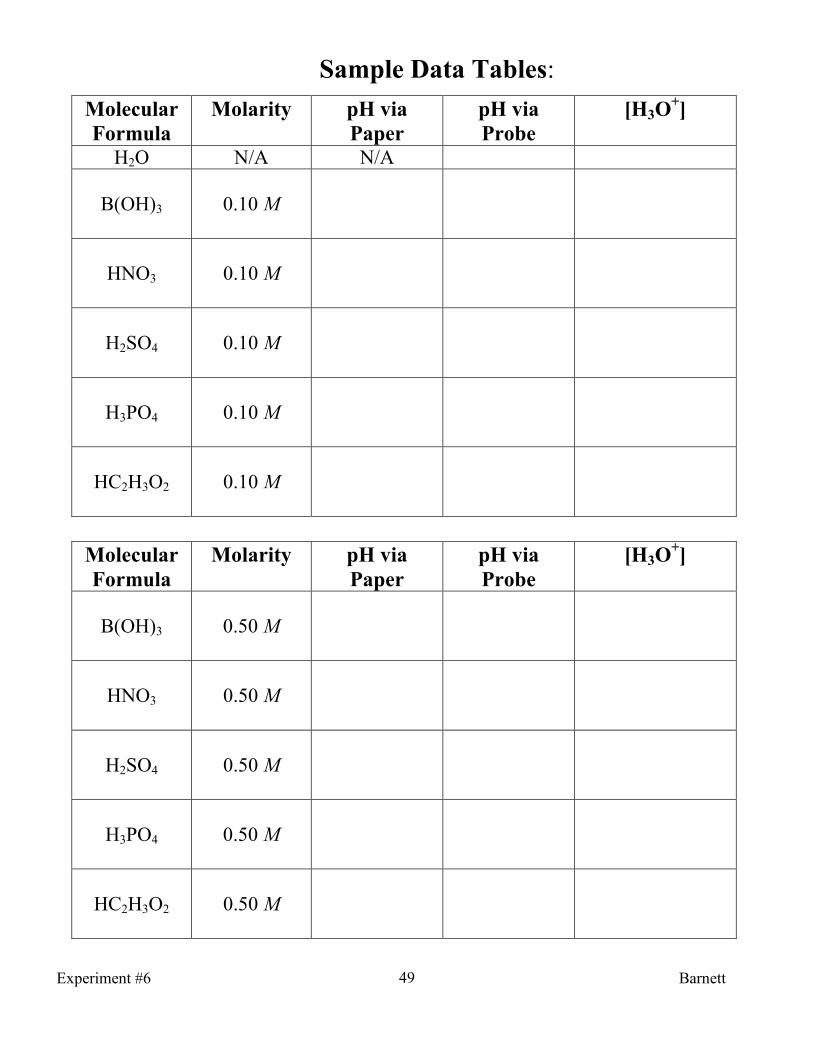
49
Molecular
Formula
Molarity pH via
Paper
pH via
Probe
[H3O+]
H2O N/A N/A
B(OH)3
0.10 M
HNO3
0.10 M
H2SO4
0.10 M
H3PO4
0.10 M
HC2H3O2
0.10 M
Molecular
Formula
Molarity pH via
Paper
pH via
Probe
[H3O+]
B(OH)3
0.50 M
HNO3
0.50 M
H2SO4
0.50 M
H3PO4
0.50 M
HC2H3O2
0.50 M
Sample Data Tables:
Experiment #6 Barnett

50
Sample Data Tables Continued:
Juice pH via Paper pH via Probe [H3O+]
Apple
Grapefruit
Orange
Tomato
Increasing order of fruit juice acidity from least acidic to the most acidic:
__________ < __________ < __________ < __________
Household
Material
pH via Paper pH via Probe [H3O+]
Vinegar
Bleach
Diet Pepsi®
Experiment #6 Barnett
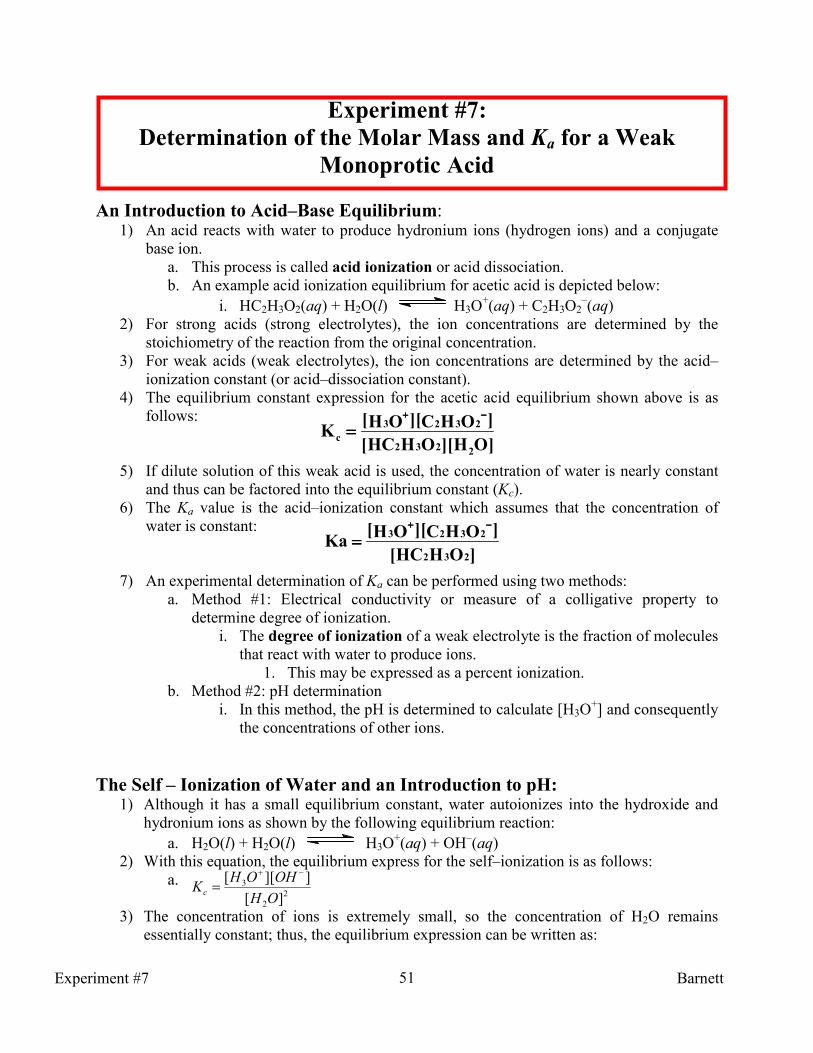
51
Experiment #7:
Determination of the Molar Mass and Ka for a Weak
Monoprotic Acid
An Introduction to Acid–Base Equilibrium: 1) An acid reacts with water to produce hydronium ions (hydrogen ions) and a conjugate
base ion.
a. This process is called acid ionization or acid dissociation.
b. An example acid ionization equilibrium for acetic acid is depicted below:
i. HC2H3O2(aq) + H2O(l) H3O+(aq) + C2H3O2
–(aq)
2) For strong acids (strong electrolytes), the ion concentrations are determined by the
stoichiometry of the reaction from the original concentration.
3) For weak acids (weak electrolytes), the ion concentrations are determined by the acid–
ionization constant (or acid–dissociation constant).
4) The equilibrium constant expression for the acetic acid equilibrium shown above is as
follows:
5) If dilute solution of this weak acid is used, the concentration of water is nearly constant
and thus can be factored into the equilibrium constant (Kc).
6) The Ka value is the acid–ionization constant which assumes that the concentration of
water is constant:
7) An experimental determination of Ka can be performed using two methods:
a. Method #1: Electrical conductivity or measure of a colligative property to
determine degree of ionization.
i. The degree of ionization of a weak electrolyte is the fraction of molecules
that react with water to produce ions.
1. This may be expressed as a percent ionization.
b. Method #2: pH determination
i. In this method, the pH is determined to calculate [H3O+] and consequently
the concentrations of other ions.
The Self – Ionization of Water and an Introduction to pH: 1) Although it has a small equilibrium constant, water autoionizes into the hydroxide and
hydronium ions as shown by the following equilibrium reaction:
a. H2O(l) + H2O(l) H3O+(aq) + OH
–(aq)
2) With this equation, the equilibrium express for the self–ionization is as follows:
a.
3) The concentration of ions is extremely small, so the concentration of H2O remains
essentially constant; thus, the equilibrium expression can be written as:
]OH][OHHC[
]OHC][OH[K
2232
2323
c
−−−−++++
====
]OHHC[
]OHC][OH[Ka
232
2323−−−−++++
====
2
2
3
][
]][[
OH
OHOHKc
−+
=
Experiment #7 Barnett
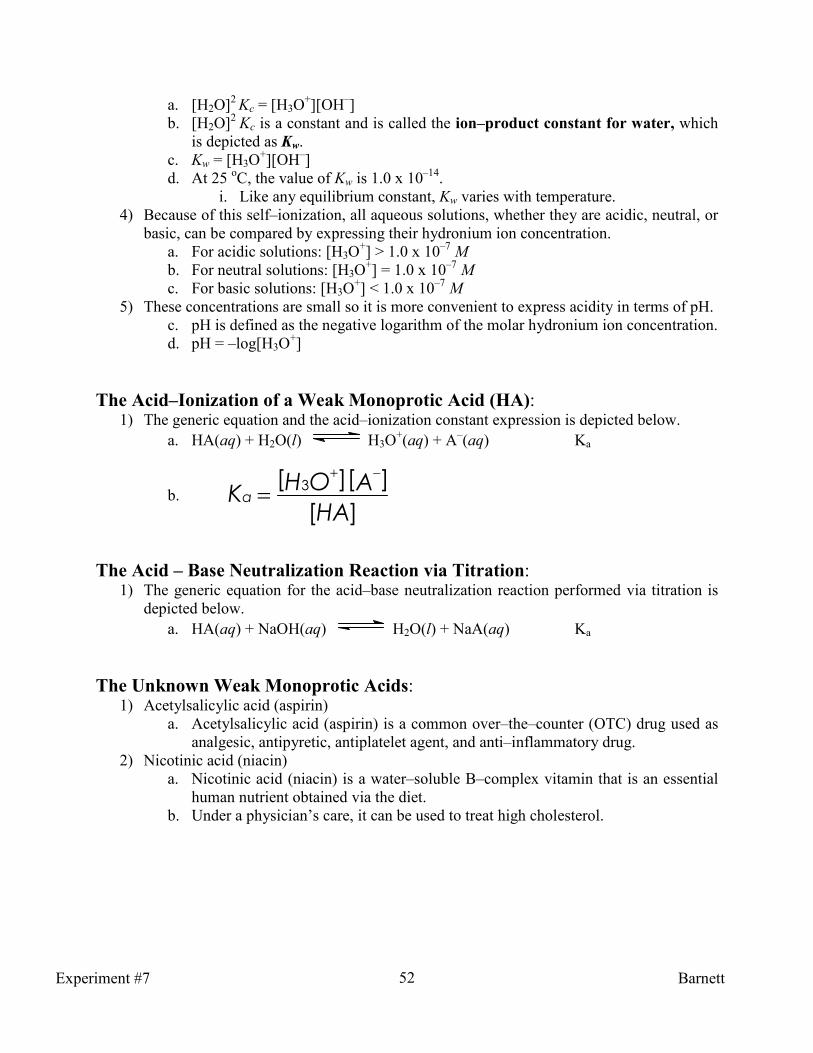
52
a. [H2O]2
Kc = [H3O+][OH
–]
b. [H2O]2
Kc is a constant and is called the ion–product constant for water, which
is depicted as Kw.
c. Kw = [H3O+][OH
–]
d. At 25 oC, the value of Kw is 1.0 x 10
–14.
i. Like any equilibrium constant, Kw varies with temperature.
4) Because of this self–ionization, all aqueous solutions, whether they are acidic, neutral, or
basic, can be compared by expressing their hydronium ion concentration.
a. For acidic solutions: [H3O+] > 1.0 x 10
–7 M
b. For neutral solutions: [H3O+] = 1.0 x 10
–7 M
c. For basic solutions: [H3O+] < 1.0 x 10
–7 M
5) These concentrations are small so it is more convenient to express acidity in terms of pH.
c. pH is defined as the negative logarithm of the molar hydronium ion concentration.
d. pH = –log[H3O+]
The Acid–Ionization of a Weak Monoprotic Acid (HA): 1) The generic equation and the acid–ionization constant expression is depicted below.
a. HA(aq) + H2O(l) H3O+(aq) + A
–(aq) Ka
b.
The Acid – Base �eutralization Reaction via Titration: 1) The generic equation for the acid–base neutralization reaction performed via titration is
depicted below.
a. HA(aq) + NaOH(aq) H2O(l) + NaA(aq) Ka
The Unknown Weak Monoprotic Acids: 1) Acetylsalicylic acid (aspirin)
a. Acetylsalicylic acid (aspirin) is a common over–the–counter (OTC) drug used as
analgesic, antipyretic, antiplatelet agent, and anti–inflammatory drug.
2) Nicotinic acid (niacin)
a. Nicotinic acid (niacin) is a water–soluble B–complex vitamin that is an essential
human nutrient obtained via the diet.
b. Under a physician’s care, it can be used to treat high cholesterol.
][
]][[ 3
HA
AOHKa
−+
=
Experiment #7 Barnett
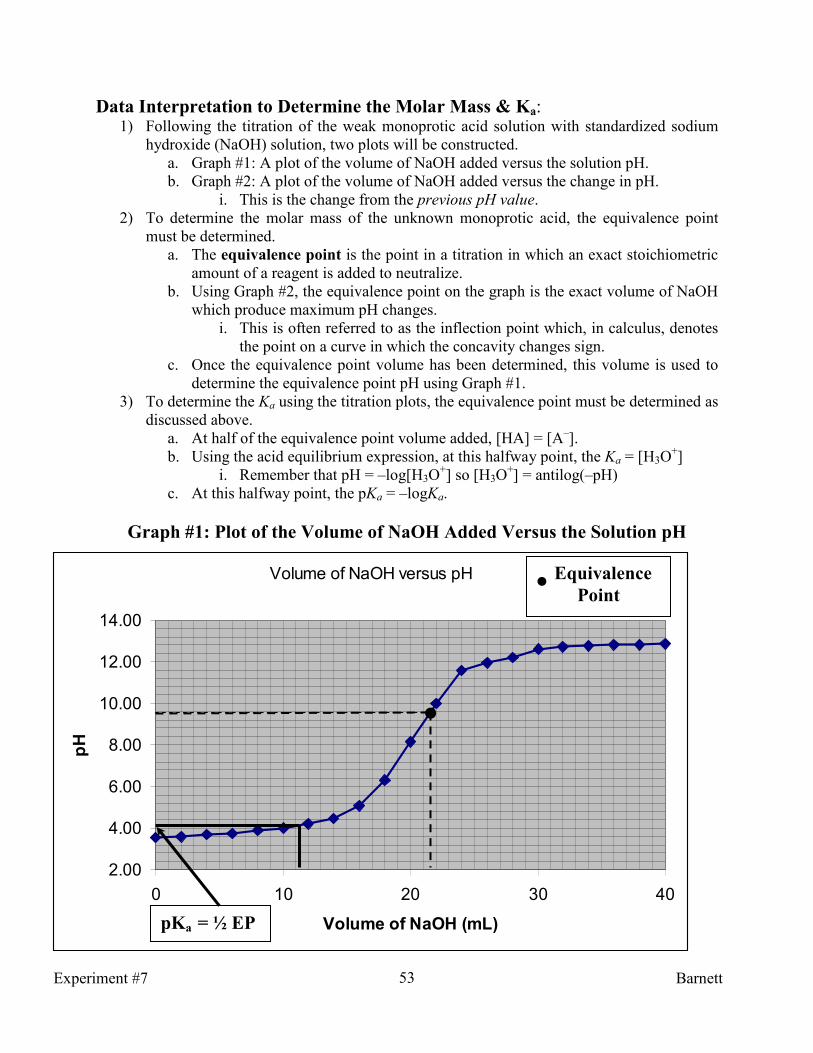
53
Volume of NaOH versus pH
2.00
4.00
6.00
8.00
10.00
12.00
14.00
0 10 20 30 40
Volume of NaOH (mL)
pH
Data Interpretation to Determine the Molar Mass & Ka: 1) Following the titration of the weak monoprotic acid solution with standardized sodium
hydroxide (NaOH) solution, two plots will be constructed.
a. Graph #1: A plot of the volume of NaOH added versus the solution pH.
b. Graph #2: A plot of the volume of NaOH added versus the change in pH.
i. This is the change from the previous pH value.
2) To determine the molar mass of the unknown monoprotic acid, the equivalence point
must be determined.
a. The equivalence point is the point in a titration in which an exact stoichiometric
amount of a reagent is added to neutralize.
b. Using Graph #2, the equivalence point on the graph is the exact volume of NaOH
which produce maximum pH changes.
i. This is often referred to as the inflection point which, in calculus, denotes
the point on a curve in which the concavity changes sign.
c. Once the equivalence point volume has been determined, this volume is used to
determine the equivalence point pH using Graph #1.
3) To determine the Ka using the titration plots, the equivalence point must be determined as
discussed above.
a. At half of the equivalence point volume added, [HA] = [A–].
b. Using the acid equilibrium expression, at this halfway point, the Ka = [H3O+]
i. Remember that pH = –log[H3O+] so [H3O
+] = antilog(–pH)
c. At this halfway point, the pKa = –logKa.
Graph #1: Plot of the Volume of �aOH Added Versus the Solution pH
pKa = ½ EP
Equivalence
Point
•
•
Experiment #7 Barnett
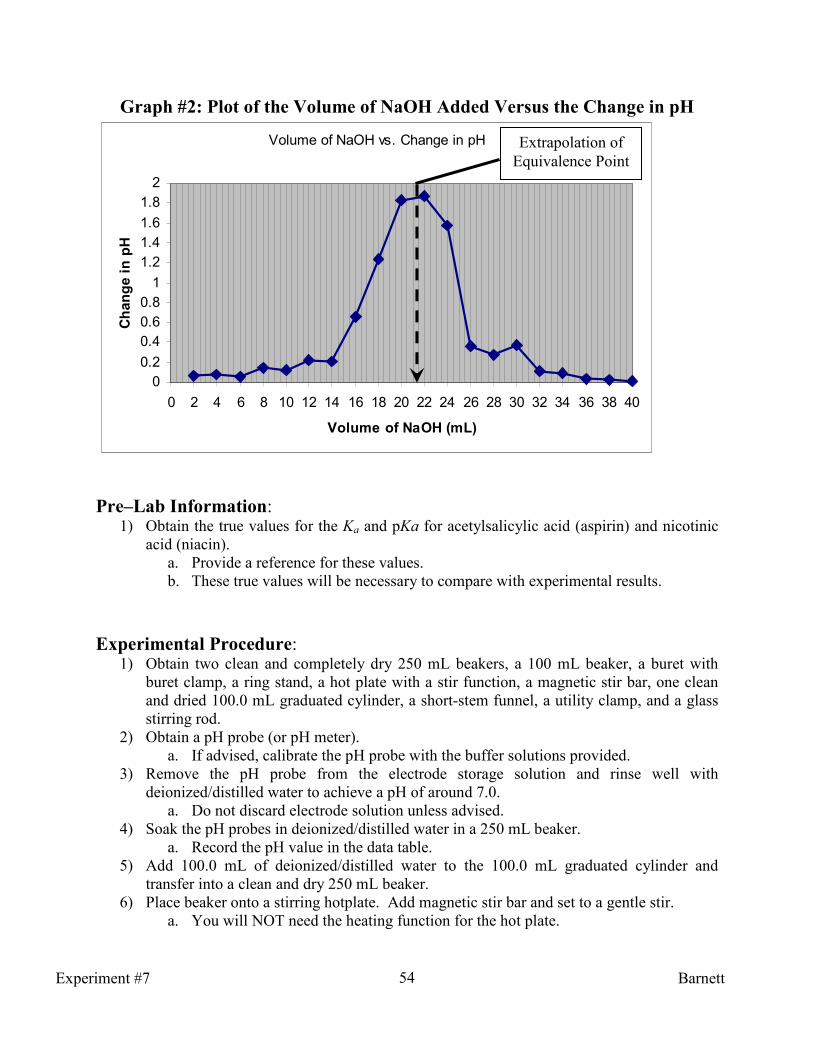
54
Graph #2: Plot of the Volume of �aOH Added Versus the Change in pH
Volume of NaOH vs. Change in pH
0
0.2
0.4
0.6
0.8
1
1.2
1.4
1.6
1.8
2
0 2 4 6 8 10 12 14 16 18 20 22 24 26 28 30 32 34 36 38 40
Volume of NaOH (mL)
Change in pH
Pre–Lab Information: 1) Obtain the true values for the Ka and pKa for acetylsalicylic acid (aspirin) and nicotinic
acid (niacin).
a. Provide a reference for these values.
b. These true values will be necessary to compare with experimental results.
Experimental Procedure: 1) Obtain two clean and completely dry 250 mL beakers, a 100 mL beaker, a buret with
buret clamp, a ring stand, a hot plate with a stir function, a magnetic stir bar, one clean
and dried 100.0 mL graduated cylinder, a short-stem funnel, a utility clamp, and a glass
stirring rod.
2) Obtain a pH probe (or pH meter).
a. If advised, calibrate the pH probe with the buffer solutions provided.
3) Remove the pH probe from the electrode storage solution and rinse well with
deionized/distilled water to achieve a pH of around 7.0.
a. Do not discard electrode solution unless advised.
4) Soak the pH probes in deionized/distilled water in a 250 mL beaker.
a. Record the pH value in the data table.
5) Add 100.0 mL of deionized/distilled water to the 100.0 mL graduated cylinder and
transfer into a clean and dry 250 mL beaker.
6) Place beaker onto a stirring hotplate. Add magnetic stir bar and set to a gentle stir.
a. You will NOT need the heating function for the hot plate.
Extrapolation of
Equivalence Point
Experiment #7 Barnett

55
7) Measure no more than 0.300 g of your unknown monoprotic acid on weighing paper
using an analytical balance.
a. Record the exact mass and unknown letter/number in your lab notebook.
b. It is advised to weigh out somewhere between 0.250 – 0.280 g of your unknown
monoprotic acid to ensure solubility.
8) Place the unknown monoprotic acid into the 250 mL beaker and allow to completely
dissolve.
9) Obtain approximately 60.0 mL of a standard 0.1000 M NaOH solution into a dry 100 mL
beaker.
a. Label beaker as “NaOH.”
b. Record this standardized concentration in your data table.
10) Ensure the stopcock is in the closed position. Using a short stem funnel, add
approximately 10.0 mL of the standardized NaOH solution to the buret.
11) Condition the buret by holding it horizontally and rotating to allow the NaOH solution to
wet the inside of the glass completely. Discard the rinse into the sink.
12) Fill the buret with standardized NaOH solution and adjust the meniscus to zero.
a. Record the initial buret reading as 0.00 mL.
13) Carefully dry off pH probe with a Kimwipe.
14) Next, using a utility clamp, suspend the pH probe to one side of the beaker into the acid
solution and allow the for a stable pH value.
b. Record this value in the data table.
c. DO NOT allow the pH probe to come into contact with the magnetic stir bar.
15) Suspend the buret over the acid solution to the side opposite the pH probe.
16) Add approximately 1.00 mL of the NaOH solution and allow the pH to stabilize.
a. Upon delivering the sodium hydroxide solution to the acid, it is critical that the
pH probe test the solution and not the dripping base.
b. Record the new buret reading and the pH in your data table.
c. In addition, calculate change in pH from the previous reading.
17) Repeat step 16 until the change in pH is greater than 0.25 or ∆pH > 0.25.
18) When the ∆pH > 0.25, begin adding only 0.25–0.5 mL allotments and allow the pH to
stabilize.
a. Record the new buret reading and the pH in your data table.
b. In addition, calculate change in pH from the previous reading.
19) Repeat step 18 until the change in pH is less than 0.25 or ∆pH < 0.25.
20) When the ∆pH < 0.25, begin adding 1.0 mL allotments and allow the pH to stabilize.
a. Record the new buret reading and the pH in your data table.
b. In addition, calculate change in pH from the previous reading.
21) Once ~30.0 mL of NaOH solution has been added and the pH is severely basic, the
titration is complete.
22) Repeat for a second trial.
23) Remove the pH probe and rinse thoroughly with deionized/distilled water. Dry with a
Kimwipe and then return to the electrode storage solution.
24) Remove the NaOH solution from the buret and carefully clean.
25) Construct a plot of the volume of NaOH added versus the solution pH.
a. Place the volume of NaOH on the x–axis and pH on the y–axis.
26) Create a graph of the change in pH (∆pH) versus volume of NaOH added.
Experiment #7 Barnett
56
a. Place the volume of NaOH on the x–axis and ∆pH on the y–axis.
b. Focus on plotting the area in which the change of pH is steep.
c. Extrapolate the equivalence point by determining the maxima.
Waste Disposal and Lab Clean–Up:
1) All acidic solutions that have been effectively neutralized with sodium hydroxide
solution can be placed down the drain.
2) Unused NaOH solution can be flushed down the sink with plenty of water.
The Lab Write – Up: 1) Determine all values in your data table and discuss relevant data in your conclusion.
2) Construct a plot of the volume of NaOH added versus the solution pH.
3) Create a graph of the change in pH (∆pH) versus volume of NaOH added.
4) Determine the molar mass and identity of the weak monoprotic acid. Calculate the
percent error and discuss reasons for error.
a. Percent error = [(true value – experimental value)/true value] * 100%
b. Percent error cannot be a negative value. Take the absolute value of the number if
necessary.
5) Determine the Ka of the weak monoprotic acid and compare to the true value.
6) Calculate the percent error, discuss all reasons for error, and include how these errors
affected the data.
7) What assumptions were made during this experiment?
8) Could this same procedure (to determine the Ka and molar mass) have been performed
using sulfuric acid (H2SO4) as the acid? Explain why or why not.
Pre–Lab Information:
Drug �ame Molar Mass
(g/mol)
Ka pKa
Acetylsalicylic
acid (Aspirin)
Nicotinic acid
(Niacin)
References: ______________________________________________________________
______________________________________________________________
Experiment #7 Barnett

57
Sample Data Tables:
Trial 1 pH ∆pH Volume of �aOH Added (mL)
0 0.00
Experiment #7 Barnett

58
Sample Data Tables Continued:
Trial 2 pH ∆pH Volume of �aOH Added (mL)
0 0.00
Experiment #7 Barnett

59
Sample Data Tables Continued:
Data Recorded/Calculated Trial #1 Trial #2 a) Unknown monoprotic acid number/letter: b) Mass of unknown monoprotic acid in grams: c) Initial pH of water soaking solution: d) Initial pH of unknown monoprotic acid solution: e) Standardized molar concentration of NaOH used in moles
per liter:
f) Equivalence point volume of NaOH (determined by graph)
in milliliters:
g) Moles of NaOH at the equivalence point in mol*: h) Moles of unknown monoprotic acid titrated in mol
†:
i) Molar mass of unknown monoprotic acid (b/h): j) Average molar mass of unknown monoprotic acid in
grams per mole ([trial 1 + 2]/2):
k) Identity of unknown monoprotic acid: l) True molar mass of unknown monoprotic acid in grams
per mole:
m) Percent error for molar mass in %: n) Equivalence point volume of NaOH (determined by
graph) in milliliters (see f):
o) Volume of NaOH at half the equivalence point in
milliliters (n/2):
p) Experimental pKa of unknown monoprotic acid††
: q) Average experimental pKa of unknown monoprotic acid
([trial 1 + 2]/2):
r) True pKa of unknown monoprotic acid: s) Percent error for the pKa in %: t) Experimental Ka of unknown monoprotic acid†††: u) Average Ka of unknown monoprotic acid ([trial 1 + 2]/2): v) True Ka of unknown monoprotic acid: w) Percent error for the Ka in %:
*Using standardized molarity of NaOH in data point e)
†Using the mole to mole ratio of NaOH to HA
††Using the pH at half of the equivalence point volume of NaOH
††† Ka = antilog(–pKa)
Experiment #7 Barnett

60
Experiment #8:
Determination of Unknown Aqueous Salt Solutions by pH
and Analysis of Buffers
Introduction to Acid–Base Properties of Salt Solutions: 1) Salts may be considered as products from an acid – base neutralization.
2) Often, these salts are acidic or basic when placed into an aqueous media due to ion
hydrolysis.
3) Ion hydrolysis is the reaction in which an ion with water produces the conjugate acid
and hydroxide ion or the conjugate base and hydronium ion.
a. Example: Sodium cyanide (NaCN)
b. A 0.10 M solution of NaCN has a pH of 11.1.
c. The processes of solvation and hydrolysis are shown below:
i. Solvation: NaCN(s)
H2O
Na+(aq) + CN
–(aq)
ii. Hydrolysis: Na+(aq) + CN
–(aq) + H2O(l) HCN(aq) +
NaOH(aq)
d. This salt can be considered one from the neutralization of a strong base (NaOH)
with a weak acid (HCN).
4) The acidity, basicity, or neutrality of a salt can be predicted from the relative strengths of
the acids and bases that underwent neutralization to produce that salt.
a. A salt of a strong base and a strong acid will yield a neutral aqueous solution.
i. Example: NaCl (A salt from NaOH & HCl)
b. A salt of a strong base and a weak acid will yield a basic solution.
i. Example: NaCN (A salt from NaOH & HCN)
c. A salt of a weak base and a strong acid will yield an acidic aqueous solution
i. Example: NH4Cl (A salt from NH3 & HCl)
d. A salt of a weak base and a weak acid will depend on the relative acid – base
strengths of the two ions.
i. The Kb and Ka must be assessed to determine acidity or basicity.
1. If the base is stronger than the acid (Kb>Ka), then the solution will
be basic (pH > 7).
2. If the acid is stronger than the base (Ka>Kb), then the solution will
be acidic (pH < 7).
ii. Example: NH4CHO2 (A salt from NH3 & HCHO2)
1. NH4+: Ka = 5.6 x 10
–10
2. CHO2–: Kb = 5.9 x 10
–11
iii. This will be slightly acidic because NH4+ is a stronger acid than HCO2
– is
a base.
Introduction to Buffers: 1) A buffer is a solution characterized by the ability to resist changes in pH when limited
amounts of acids or bases are added to it.
Experiment #8 Barnett

61
a. Buffers contain either a weak acid and its conjugate base or a weak base and its
conjugate acid.
2) Blood is a buffer solution with a pH ranging from 7.35 – 7.45.
a. The main conjugate acid–base pair is H2CO3(aq) and HCO3–(aq).
3) There are two important characteristics of buffers.
a. The Buffer capacity
i. This is the amount of acid or base that can react with the buffer before a
significant pH change is reported.
b. The Buffer pH
i. Depending on the pH range of interest, the correct buffer must be selected
to provide the optimal pH range.
The Henderson – Hasselbalch Equation: 1) The Henderson – Hasselbalch Equation is an equation that determines pH of a buffer
for different concentrations of the conjugate acid and base.
2) The equation is represented as:
3) In any buffer, the weak acid and its conjugate base do not react appreciably with one
another when the solutions are mixed.
a. Thus, their relative concentrations can be calculated from the way the buffer is
prepared.
The Unknown Aqueous Salt Solutions: 1) KI (0.10 M)
2) FeCl3 (0.10 M)
3) Na2CO3 (0.10 M)
The Known Aqueous Solutions for Buffers: 1) HC2H3O2 (0.1 M)
2) NaC2H3O2 (0.1 M)
Pre–Lab Information: 2) Provide the IUPAC names of KI, FeCl3, and Na2CO3 and determine if aqueous solutions
of each salt are acidic, basic, or neutral.
3) Obtain the true pKa value for acetic acid and provide a reference.
Part 1: Experimental Procedure for Analysis of the Unknown Aqueous Salt Solutions:
1) Obtain 3 clean and completely dried test tubes, a 250 mL beaker, and one clean and dried
10.0 mL graduated cylinder.
2) Label each of the three test tubes by their unknown identity number/letter.
3) Place approximately 5.0 mL of each unknown salt solution into their labeled test tube.
4) Obtain a pH probe (or pH meter).
++++==== apKpH]Acid[
]Base[log
Experiment #8 Barnett
62
d. If advised, calibrate the pH probe with the buffer solutions provided.
5) Remove the pH probe from the electrode storage solution and rinse well with
deionized/distilled water to achieve a pH of around 7.0.
a. Do not discard electrode solution unless advised.
6) Soak the pH probe in deionized/distilled water in a 250 mL beaker.
a. Record the pH value.
7) Remove pH from water soak and carefully dry off the probe with a Kimwipe.
8) Next, insert the pH probe into the solution and allow the for a stable pH value.
d. Record this value in the data table.
9) Using deionized/distilled water, thoroughly rinse off the pH probe and then store in a 250
mL beaker of deionized water with the probe completely immersed.
10) Repeat steps 7–8 with all remaining solutions. Do not forget to rinse off probe well
between readings and dry with a Kimwipe.
11) Calculate the pH, pOH, [H3O+], and [OH
–].
12) Determine the identity of each unknown salt solution.
Part 2:
Experimental Procedure for Formation and Analysis of Buffer Solutions: 1) Obtain five clean and completely dry 50–150 mL beakers, a glass stirring rod, one 250
mL beaker, and one clean and dried 10.0 mL and 50.0 mL graduated cylinder.
2) Obtain a pH probe (or pH meter).
a. If advised, calibrate the pH probe with the buffer solutions provided.
3) Remove the pH probe from the electrode storage solution and rinse well with
deionized/distilled water to achieve a pH of around 7.0.
a. Do not discard electrode solution unless advised.
4) Soak the pH probe in deionized/distilled water in a 250 mL beaker.
a. Record the pH value.
5) Add 30.0 mL of tap water to a 50.0 mL graduated cylinder and transfer into one of the
100 – 150 mL beakers.
6) Insert the pH probe into the water and allow the for a stable pH value.
a. Record this value in the data table.
7) Add 5 drops of 0.10 M HCl and stir thoroughly with the glass stirring rod.
8) Insert the pH probe into the solution and allow the for a stable pH value.
a. Record this value in the data table.
9) Using deionized/distilled water, thoroughly rinse off the pH probe and then store in a 250
mL beaker of deionized water with the probe completely immersed.
10) Repeat the above procedure (steps 5–8) using 5 drops of 0.10 M NaOH in place of the
hydrochloric acid. Do not forget to rinse off probe and glass stirring rod and dry with a
Kimwipe.
11) To a cleaned and dried 50.0 mL graduated cylinder, add 15.0 mL of the 0.10 M acetic
acid solution and transfer into one of the 100–150 mL beakers.
12) Rinse the graduated cylinder with deionized water and dry.
13) Add 15.0 mL of the 0.10 M sodium acetate solution to the 50.0 mL graduated cylinder
and transfer into the beaker containing the acetic acid solution.
14) Mix thoroughly with the glass stirring rod.
15) Insert the pH probe into the solution and allow the for a stable pH value.
Experiment #8 Barnett
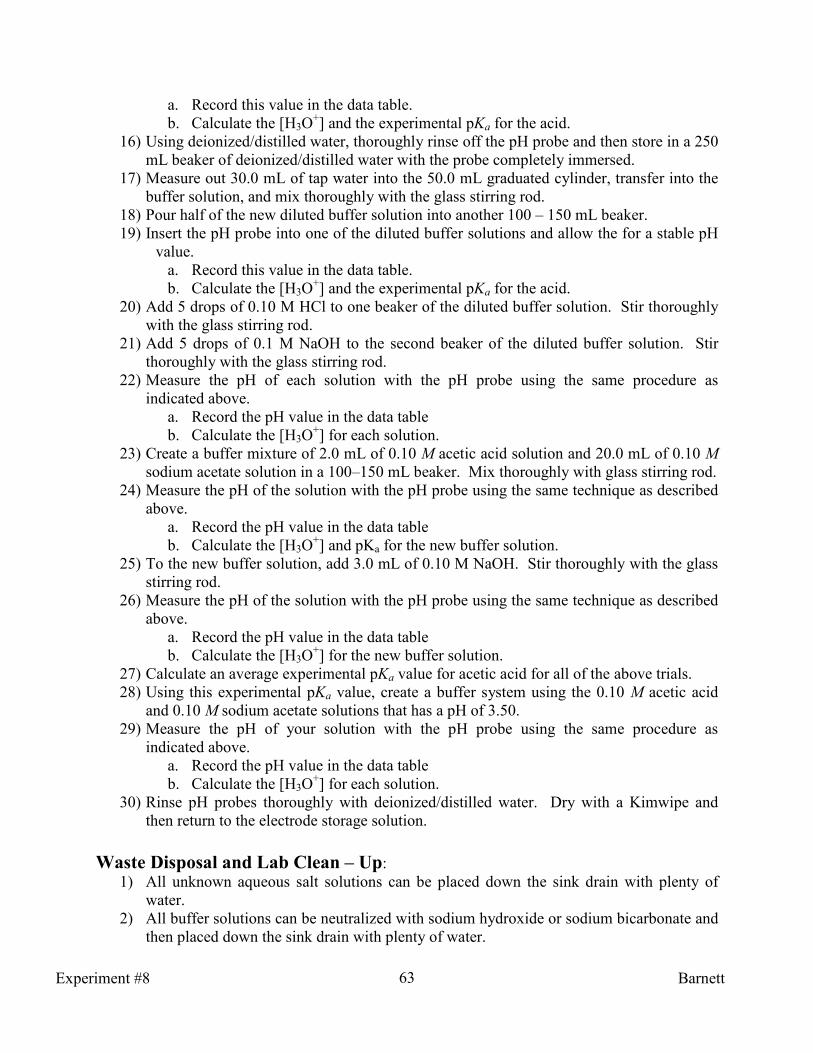
63
a. Record this value in the data table.
b. Calculate the [H3O+] and the experimental pKa for the acid.
16) Using deionized/distilled water, thoroughly rinse off the pH probe and then store in a 250
mL beaker of deionized/distilled water with the probe completely immersed.
17) Measure out 30.0 mL of tap water into the 50.0 mL graduated cylinder, transfer into the
buffer solution, and mix thoroughly with the glass stirring rod.
18) Pour half of the new diluted buffer solution into another 100 – 150 mL beaker.
19) Insert the pH probe into one of the diluted buffer solutions and allow the for a stable pH
value.
a. Record this value in the data table.
b. Calculate the [H3O+] and the experimental pKa for the acid.
20) Add 5 drops of 0.10 M HCl to one beaker of the diluted buffer solution. Stir thoroughly
with the glass stirring rod.
21) Add 5 drops of 0.1 M NaOH to the second beaker of the diluted buffer solution. Stir
thoroughly with the glass stirring rod.
22) Measure the pH of each solution with the pH probe using the same procedure as
indicated above.
a. Record the pH value in the data table
b. Calculate the [H3O+] for each solution.
23) Create a buffer mixture of 2.0 mL of 0.10 M acetic acid solution and 20.0 mL of 0.10 M
sodium acetate solution in a 100–150 mL beaker. Mix thoroughly with glass stirring rod.
24) Measure the pH of the solution with the pH probe using the same technique as described
above.
a. Record the pH value in the data table
b. Calculate the [H3O+] and pKa for the new buffer solution.
25) To the new buffer solution, add 3.0 mL of 0.10 M NaOH. Stir thoroughly with the glass
stirring rod.
26) Measure the pH of the solution with the pH probe using the same technique as described
above.
a. Record the pH value in the data table
b. Calculate the [H3O+] for the new buffer solution.
27) Calculate an average experimental pKa value for acetic acid for all of the above trials.
28) Using this experimental pKa value, create a buffer system using the 0.10 M acetic acid
and 0.10 M sodium acetate solutions that has a pH of 3.50.
29) Measure the pH of your solution with the pH probe using the same procedure as
indicated above.
a. Record the pH value in the data table
b. Calculate the [H3O+] for each solution.
30) Rinse pH probes thoroughly with deionized/distilled water. Dry with a Kimwipe and
then return to the electrode storage solution.
Waste Disposal and Lab Clean – Up:
1) All unknown aqueous salt solutions can be placed down the sink drain with plenty of
water.
2) All buffer solutions can be neutralized with sodium hydroxide or sodium bicarbonate and
then placed down the sink drain with plenty of water.
Experiment #8 Barnett
64
The Lab Write – Up: 1) Determine all values in your data table and discuss relevant data in the conclusion.
2) Predict whether aqueous solutions of KI, FeCl3, and Na2CO3 are acidic, basic or neutral.
Explain.
3) Show the solvation and hydrolysis reactions for each salt and place into your balanced
equation section.
4) Determine the identity of all unknown aqueous salt solutions and thoroughly explain
using pH data.
5) Discuss how the pH changed upon addition of 5 drops of HCl and NaOH with water.
6) Discuss how the pH changed upon addition of 5 drops of HCl and NaOH with all buffer
solutions.
7) Compare and contrast the buffering ability of pure water with all of the acetic acid–
sodium acetate buffers.
8) Determine the average experimental pKa value for acetic acid for the acetic acid–sodium
acetate buffer. Compare to true value and discuss deviations.
9) Was the pH of your home–made buffer system close to 3.50? Explain deviations.
10) What assumptions were made during this experiment?
Experiment #8 Barnett

65
Pre–Lab Data Tables:
Formula of Salt IUPAC �ame Acid, Base, or �eutral
KI
FeCl3
Na2CO3
True/Theoretical pKa value for acetic acid: __________________
Reference: ____________________________________________
_____________________________________________
Balanced Equations: Process and Salt Reactant(s) Yields Product(s)
Solvation for KI
___ KI(s)
Hydrolysis of KI ions
Solvation for FeCl3
___ FeCl3(s)
Hydrolysis of FeCl3
ions
Solvation for �a2CO3
___ �a2CO3(s)
Hydrolysis of �a2CO3
ions
H2O
H2O
H2O
Experiment #8 Barnett
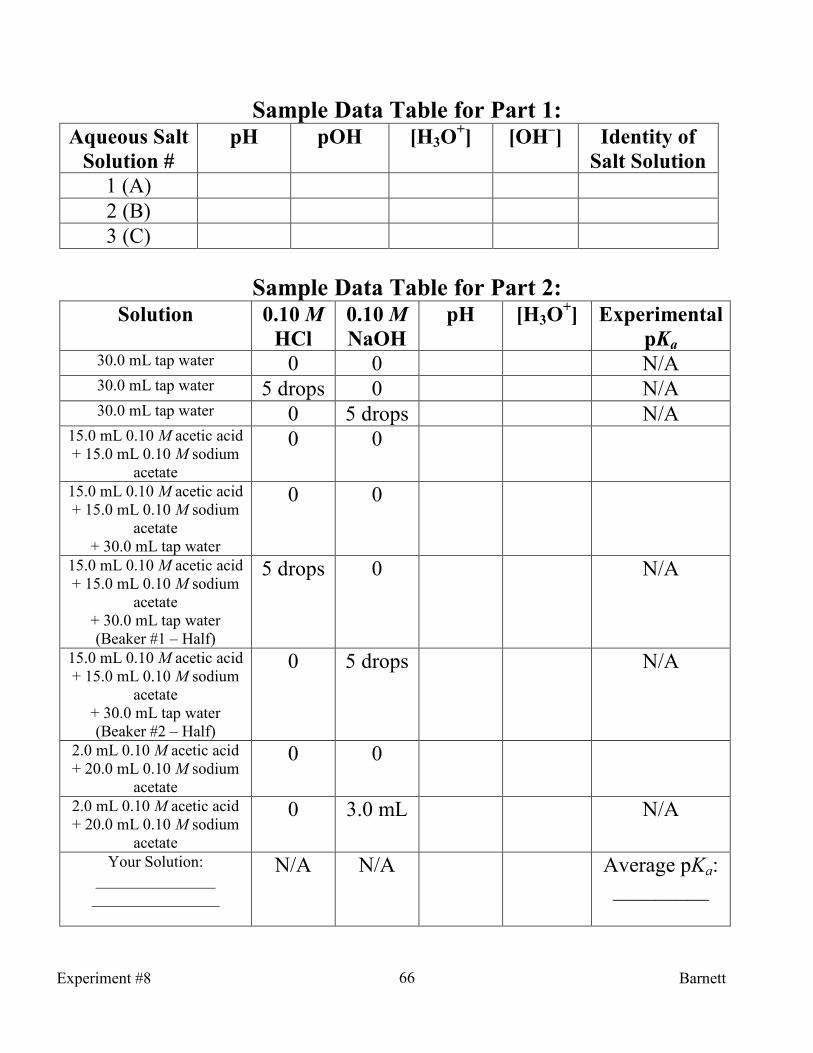
66
Sample Data Table for Part 1: Aqueous Salt
Solution #
pH pOH [H3O+] [OH
–] Identity of
Salt Solution
1 (A)
2 (B)
3 (C)
Sample Data Table for Part 2: Solution 0.10 M
HCl
0.10 M
�aOH
pH [H3O+] Experimental
pKa 30.0 mL tap water 0 0 N/A 30.0 mL tap water 5 drops 0 N/A 30.0 mL tap water 0 5 drops N/A
15.0 mL 0.10 M acetic acid
+ 15.0 mL 0.10 M sodium
acetate
0 0
15.0 mL 0.10 M acetic acid
+ 15.0 mL 0.10 M sodium
acetate
+ 30.0 mL tap water
0 0
15.0 mL 0.10 M acetic acid
+ 15.0 mL 0.10 M sodium
acetate
+ 30.0 mL tap water
(Beaker #1 – Half)
5 drops 0 N/A
15.0 mL 0.10 M acetic acid
+ 15.0 mL 0.10 M sodium
acetate
+ 30.0 mL tap water
(Beaker #2 – Half)
0 5 drops N/A
2.0 mL 0.10 M acetic acid
+ 20.0 mL 0.10 M sodium
acetate
0 0
2.0 mL 0.10 M acetic acid
+ 20.0 mL 0.10 M sodium
acetate
0 3.0 mL N/A
Your Solution:
_______________
________________
N/A N/A Average pKa:
_________
Experiment #8 Barnett

67
Experiment #9:
The Analysis of the Solubility of Calcium Hydroxide and
Determination of the Solubility Product Constant
Introduction to Solubility Equilibria: 1) Many natural processes rely upon the dissolution or precipitation of slightly soluble salts.
2) The blood contains a unique balance of slightly or sparingly soluble salts.
a. Examples:
i. Calcium phosphate: Ca3(PO4)2
ii. Calcium oxalate: CaC2O4
iii. Magnesium carbonate: MgCO3
iv. Magnesium oxalate: MgC2O4
3) When an excess of a slightly soluble ionic compound is mixed with water, an equilibrium
is established between the solid and the ions in the saturated solution.
a. When calcium oxalate is dissolved in water, the following solubility equilibrium
is achieved:
i. CaC2O4(s)
H2O
Ca2+
(aq) + C2O42–
(aq)
Introduction to the Solubility Product (Ksp): 1) Generally, the solubility product constant (Ksp) is the equilibrium constant for the
solubility equilibrium of a slightly soluble (or nearly insoluble) ionic compound.
2) The Ksp is the product of the equilibrium concentrations of the ions in the compound at a
certain temperature.
a. Like reaction equilibrium constants, the solubility product constants are
dependent on temperature.
3) Each concentration is raised to a power equal to the number of such ions in the formula
of the compound.
4) The solubility product for calcium oxalate is as follows:
Introduction to the Ion Product Quotient (Qsp): 1) Precipitation reactions can ensue by a disturbance in the solubility equilibrium.
2) To determine whether an equilibrium system will go in the forward or reverse direction
resulting in a precipitation reaction, it requires the evaluation of the ion product quotient,
Qsp.
3) To predict the direction of reaction, compare the values of Qsp with Ksp.
a. If Qsp exceeds the Ksp, precipitation occurs.
b. If Qsp is less than Ksp, more solute can dissolve (and precipitation does not occur.)
c. If Qsp equals the Ksp, the solution is saturated.
]OC][[Ca2
42
2 −+=spK
Experiment #9 Barnett
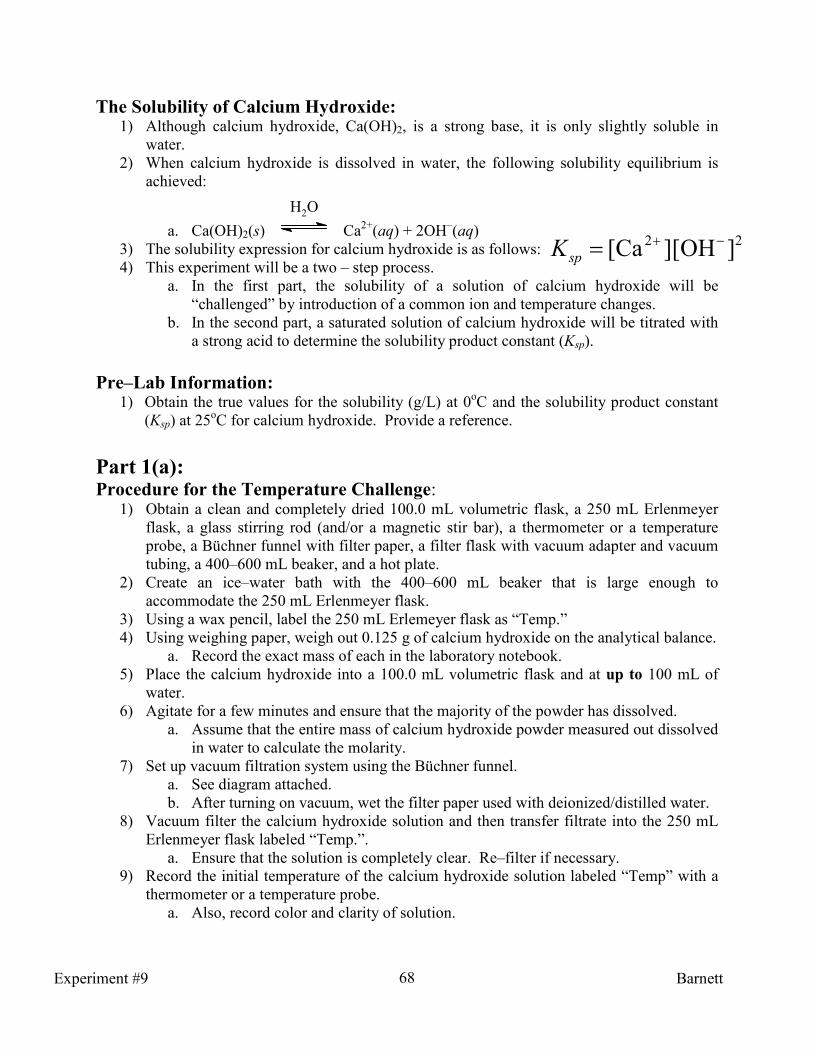
68
The Solubility of Calcium Hydroxide: 1) Although calcium hydroxide, Ca(OH)2, is a strong base, it is only slightly soluble in
water.
2) When calcium hydroxide is dissolved in water, the following solubility equilibrium is
achieved:
a. Ca(OH)2(s)
H2O
Ca2+
(aq) + 2OH–(aq)
3) The solubility expression for calcium hydroxide is as follows:
4) This experiment will be a two – step process.
a. In the first part, the solubility of a solution of calcium hydroxide will be
“challenged” by introduction of a common ion and temperature changes.
b. In the second part, a saturated solution of calcium hydroxide will be titrated with
a strong acid to determine the solubility product constant (Ksp).
Pre–Lab Information:
1) Obtain the true values for the solubility (g/L) at 0oC and the solubility product constant
(Ksp) at 25oC for calcium hydroxide. Provide a reference.
Part 1(a): Procedure for the Temperature Challenge:
1) Obtain a clean and completely dried 100.0 mL volumetric flask, a 250 mL Erlenmeyer
flask, a glass stirring rod (and/or a magnetic stir bar), a thermometer or a temperature
probe, a Büchner funnel with filter paper, a filter flask with vacuum adapter and vacuum
tubing, a 400–600 mL beaker, and a hot plate.
2) Create an ice–water bath with the 400–600 mL beaker that is large enough to
accommodate the 250 mL Erlenmeyer flask.
3) Using a wax pencil, label the 250 mL Erlemeyer flask as “Temp.”
4) Using weighing paper, weigh out 0.125 g of calcium hydroxide on the analytical balance.
a. Record the exact mass of each in the laboratory notebook.
5) Place the calcium hydroxide into a 100.0 mL volumetric flask and at up to 100 mL of
water.
6) Agitate for a few minutes and ensure that the majority of the powder has dissolved.
a. Assume that the entire mass of calcium hydroxide powder measured out dissolved
in water to calculate the molarity.
7) Set up vacuum filtration system using the Büchner funnel.
a. See diagram attached.
b. After turning on vacuum, wet the filter paper used with deionized/distilled water.
8) Vacuum filter the calcium hydroxide solution and then transfer filtrate into the 250 mL
Erlenmeyer flask labeled “Temp.”.
a. Ensure that the solution is completely clear. Re–filter if necessary.
9) Record the initial temperature of the calcium hydroxide solution labeled “Temp” with a
thermometer or a temperature probe.
a. Also, record color and clarity of solution.
22 ]OH][[Ca −+=spK
Experiment #9 Barnett

69
10) Immerse the solution into the ice–water bath and allow the temperature to decrease to
approximately 0.0oC.
a. Record a stable temperature between 0–10oC and the solubility observations.
11) Remove solution from the ice–water bath and dry off exterior of the beaker.
12) Clamp the Erlenmeyer flask labeled “Temp” into a water bath on a hot plate and
increase the temperature of the solution to greater than 70oC.
a. Record a stable temperature >70oC and the solubility observations.
Part 1(b): Procedure for the Ion Challenge:
1) Obtain a clean and completely dried 100 mL volumetric flask, a 250 mL Erlenmeyer
flask, a 100 mL graduated cylinder, a glass stirring rod (and/or a magnetic stir bar), a
thermometer or a temperature probe, a Büchner funnel with filter paper, a filter flask with
vacuum adapter and vacuum tubing, a 150 mL beaker, a 400–600 mL beaker, and a hot
plate.
2) Using a wax/grease pencil, label the 250 mL Erlemeyer flask as “Ion.”
3) Using weighing paper, weigh out 0.125 g of calcium hydroxide on the analytical balance.
a. Record the exact mass of each in the laboratory notebook.
4) Place the calcium hydroxide into a 100.0 mL volumetric flask and at up to 100 mL of
water.
5) Agitate for a few minutes and ensure that the majority of the powder has dissolved.
6) Set up vacuum filtration system using the Büchner funnel.
a. See diagram attached.
b. After turning on vacuum, wet the filter paper used with deionized/distilled water.
7) Vacuum filter the calcium hydroxide solution and then transfer filtrate into the 250 mL
Erlenmeyer flask labeled “Ion”.
a. Ensure that the solution is completely clear. Re–filter if necessary.
8) Record the initial temperature of the calcium hydroxide solution labeled “Ion” with a
thermometer or a temperature probe.
a. Also, record color and clarity of solution.
9) Measure out 100.0 mL of 6.0 M NaOH in a graduated cylinder and transfer into a 150
mL beaker. Label as “NaOH.”
10) Determine if a precipitation reaction will take place if the sodium hydroxide solution
were added to the calcium hydroxide solution.
a. This can be determined by calculating the Qsp for the mixture and comparing to
the known Ksp value for calcium hydroxide.
i. Assume that the entire mass of calcium hydroxide powder measured out
dissolved in water to calculate the molarity.
b. Perform this calculation BEFORE performing the next step.
11) Transfer the 100 mL of 6.0 M NaOH to the Erlenmeyer flask labeled “Ion” and mix
well with the glass stirring rod.
a. Record the solubility observations.
Experiment #9 Barnett
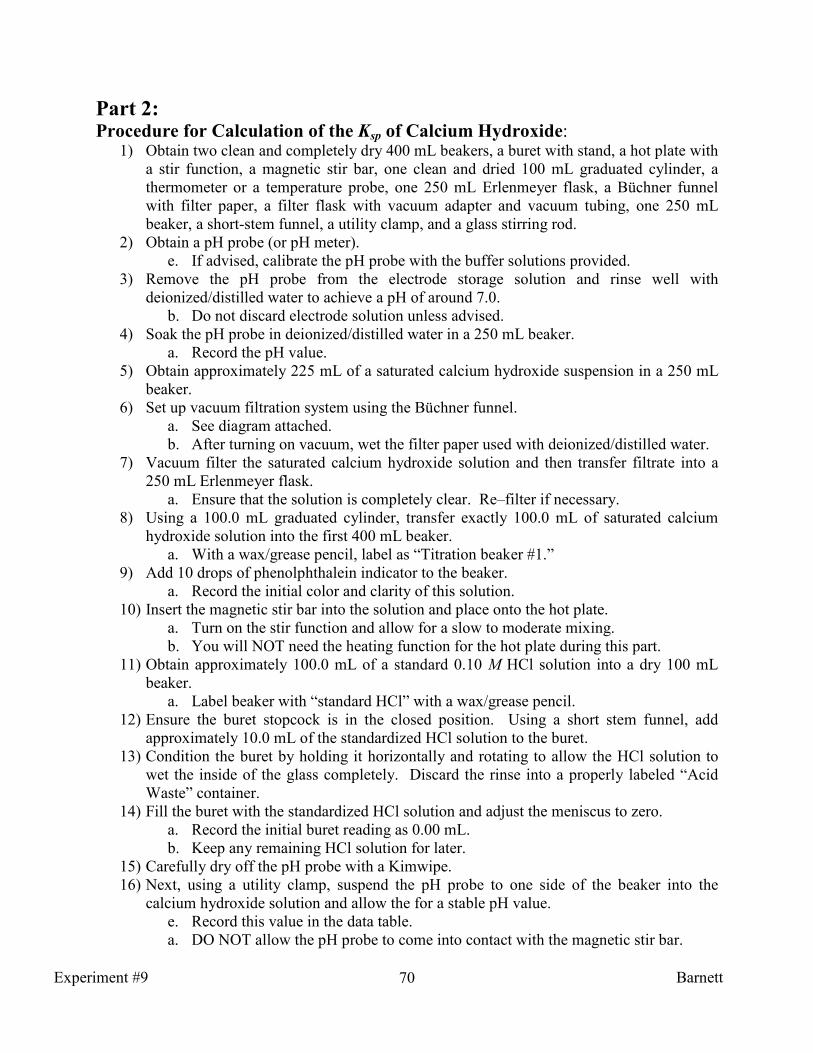
70
Part 2: Procedure for Calculation of the Ksp of Calcium Hydroxide:
1) Obtain two clean and completely dry 400 mL beakers, a buret with stand, a hot plate with
a stir function, a magnetic stir bar, one clean and dried 100 mL graduated cylinder, a
thermometer or a temperature probe, one 250 mL Erlenmeyer flask, a Büchner funnel
with filter paper, a filter flask with vacuum adapter and vacuum tubing, one 250 mL
beaker, a short-stem funnel, a utility clamp, and a glass stirring rod.
2) Obtain a pH probe (or pH meter).
e. If advised, calibrate the pH probe with the buffer solutions provided.
3) Remove the pH probe from the electrode storage solution and rinse well with
deionized/distilled water to achieve a pH of around 7.0.
b. Do not discard electrode solution unless advised.
4) Soak the pH probe in deionized/distilled water in a 250 mL beaker.
a. Record the pH value.
5) Obtain approximately 225 mL of a saturated calcium hydroxide suspension in a 250 mL
beaker.
6) Set up vacuum filtration system using the Büchner funnel.
a. See diagram attached.
b. After turning on vacuum, wet the filter paper used with deionized/distilled water.
7) Vacuum filter the saturated calcium hydroxide solution and then transfer filtrate into a
250 mL Erlenmeyer flask.
a. Ensure that the solution is completely clear. Re–filter if necessary.
8) Using a 100.0 mL graduated cylinder, transfer exactly 100.0 mL of saturated calcium
hydroxide solution into the first 400 mL beaker.
a. With a wax/grease pencil, label as “Titration beaker #1.”
9) Add 10 drops of phenolphthalein indicator to the beaker.
a. Record the initial color and clarity of this solution.
10) Insert the magnetic stir bar into the solution and place onto the hot plate.
a. Turn on the stir function and allow for a slow to moderate mixing.
b. You will NOT need the heating function for the hot plate during this part.
11) Obtain approximately 100.0 mL of a standard 0.10 M HCl solution into a dry 100 mL
beaker.
a. Label beaker with “standard HCl” with a wax/grease pencil.
12) Ensure the buret stopcock is in the closed position. Using a short stem funnel, add
approximately 10.0 mL of the standardized HCl solution to the buret.
13) Condition the buret by holding it horizontally and rotating to allow the HCl solution to
wet the inside of the glass completely. Discard the rinse into a properly labeled “Acid
Waste” container.
14) Fill the buret with the standardized HCl solution and adjust the meniscus to zero.
a. Record the initial buret reading as 0.00 mL.
b. Keep any remaining HCl solution for later.
15) Carefully dry off the pH probe with a Kimwipe.
16) Next, using a utility clamp, suspend the pH probe to one side of the beaker into the
calcium hydroxide solution and allow the for a stable pH value.
e. Record this value in the data table.
a. DO NOT allow the pH probe to come into contact with the magnetic stir bar.
Experiment #9 Barnett

71
17) Suspend the buret over the calcium hydroxide solution to the side opposite the pH probe.
a. Upon delivering the standardized HCl solution, it is critical that the pH probe test
the solution and not the dripping acid!
18) Record the initial temperature of the mixture with a thermometer and periodically
throughout the addition of the HCl solution.
19) Add approximately 1.00 mL of the HCl solution and allow the pH to stabilize.
a. Record the following information now and after each subsequent addition of HCl
solution:
i. The volume of HCl solution delivered via the buret.
ii. The pH value once stabilized.
iii. Observations, including the temperature and color/clarity of the solution.
20) Continue to add 1.00 mL of the HCl solution until the change of pH is greater than 0.50
from the previous reading.
a. Note the deep pink color should begin to fade throughout the beginning part of
this titration.
b. The colorimetric endpoint of the titration is when the addition of a single added
drop of HCl solution produces a completely colorless solution. Try to capture this
endpoint.
c. Since a strong base is being titrated with a strong acid, the equivalence point (as
recorded via the pH probe) should occur at a pH of 7.00.
21) When the change of pH is greater than 0.50 from the previous reading, begin adding only
0.25–0.50 mL increments of the HCl solution.
a. You may need to add smaller volumes, when necessary, to capture the endpoint.
22) Continue adding these smaller volumes (0.25–0.50 mL) of HCl solution until the change
of pH is less than 0.50 from the previous value.
23) Once the endpoint has been reached, add at least 5.0 mL more of the HCl solution in
0.50–1.00 mL increments.
24) Repeat the above procedure with another 100 mL of saturated calcium hydroxide
solution to ensure reproducibility.
25) Remove the pH probe and rinse thoroughly with deionized/distilled water. Dry with a
Kimwipe and then return to the electrode storage solution.
26) Remove the HCl solution from the buret and neutralize as discussed below. Carefully
clean the buret thoroughly.
27) Plot a titration curve and determine the equivalence point.
a. Place the volume of HCl on the x–axis and pH on the y–axis.
b. Compare the equivalence point to the endpoint.
28) Calculate the Ksp of calcium hydroxide and compare to the true value.
Waste Disposal and Lab Clean–Up:
1) Place all calcium hydroxide and hydrochloric acid solutions into the same waste beaker.
If neutral or slightly basic, flush down the sink with plenty of water.
2) Unused or waste HCl solution can be neutralized with the calcium hydroxide solution. If
neutral or slightly basic, flush down the sink with plenty of water.
Experiment #9 Barnett

72
The Lab Write – Up: 1) Determine all values in your data table and discuss relevant data in your conclusion.
2) For the first part of the experiment:
a. Discuss the temperature dependence on the solubility of calcium hydroxide.
b. Discuss the expected solubility of calcium hydroxide in a solution of sodium
hydroxide comparing the calculated Qsp to the theoretical Ksp.
3) For the second part of the experiment:
a. Plot a titration curve and determine the equivalence point.
b. Determine the value for Ksp and the solubility (in g/L) for this reaction at room
temperature.
c. Compare to the true values and discuss discrepancies.
4) Compare and contrast the colorimetric endpoint (via the phenolphthalein indicator) with
the equivalence point (via pH data).
5) Show the balanced equation from the reaction between calcium hydroxide with
hydrochloric acid and discuss how the solubility equilibrium for Ca(OH)2 is shifted.
6) Discuss all sources of error during this experiment and how the data is directly affected.
Pre–Lab Information:
True Ksp of Ca(OH)2 @ Temperature: ________________ @ 25oC
Reference: ______________________________________________________________
True Solubility of Ca(OH)2 (g/L) @ Temperature: _______ @ 0oC
Reference: ______________________________________________________________
Experiment #9 Barnett

73
Sample Data Tables:
Part 1(a): Temperature Challenge
Mass of Ca(OH)2 (g): ____________________________________
Moles of Ca(OH)2 (mol): _________________________________
Total volume of solution (mL): 100.0 mL (0.1000 L)
Calculated molarity of Ca(OH)2 (mol/L): ____________________
Temperature (oC) Solubility Observations
(Color/Clarity)
Initial: ________________
Cold: __________________
Hot: _________________
Part 1(b): Common Ion Challenge:
Mass of Ca(OH)2 (g): ____________________________________
Moles of Ca(OH)2 (mol): _________________________________
Total volume of solution (mL): 100.0 mL (0.1000 L)
Calculated molarity of Ca(OH)2 (mol/L): ____________________
Initial temperature (oC): _________________________________
Volume of 6.0 M NaOH (mL): ____________________________
Calculated Qsp for Ca(OH)2 + NaOH: _______________________
Will a precipitation reaction occur? (Yes/No) _________________
Solubility observations following mixing: ___________________
Experiment #9 Barnett

74
Titration of Saturated Ca(OH)2 Solution – Trial #1 pH Volume of HCl
Added (mL)
Observations
(Temperature and Color/Clarity)
0.00
Experiment #9 Barnett

75
Titration of Saturated Ca(OH)2 Solution – Trial #2 pH Volume of HCl
Added (mL)
Observations
(Temperature and Color/Clarity)
0.00
Experiment #9 Barnett

76
Sample Data Tables Continued:
Data Recorded/Calculated Trial #1 Trial #2 a) Standardized molar concentration of HCl used in
titration in moles per liter:
b) Volume of saturated calcium hydroxide solution
titrated in milliliters: 100.0 mL 100.0 mL
c) Endpoint volume of HCl solution via
phenolphthalein indicator in milliliters: (See
titration observations)
d) Equivalence point volume of HCl solution via pH
data in milliliters: (See titration curves)
e) Average equivalence point volume of HCl solution
via pH data in milliliters:
f) Average moles of HCl solution used to reach
equivalence point in mol*:
g) Average moles of OH
– upon titration to equivalence
point in mol†:
h) Average moles of Ca2+
upon titration to equivalence
point in mol††
:
i) Average molarity of OH
– upon titration to
equivalence point in mol per liter:
j) Average molarity of Ca2+
upon titration to
equivalence point in mol per liter:
k) Experimental Ksp for calcium hydroxide @
temperature in degrees Celsius†††
: ______________ @ _____
oC
k) True Ksp for calcium hydroxide @ temperature in
degrees Celsius†††
: ______________ @ _____
oC
*Using standardized molarity of HCl in data point a) †Using mole to mole ratio of HCl to OH
–
††Using: 1 mol OH
– = ½ mol Ca
2+
†††Using Ksp = [Ca
2+][OH
–]2
Experiment #9 Barnett

77
Clamp filter flask securely to a ring stand before affixing vacuum
tubing and turning on vacuum.
Model of Vacuum Filtration Using a Büchner Funnel
Büchner
Funnel
Filter
Flask
Thick Vacuum Tubing
FilterVac
Experiment #9 Barnett

78
Experiment #10:
Transition Metal Complexes; A Comparison of Formation
Constants
Introduction to Complex – Ion Equilibria: 1) Many metal ions, especially transition metals, form coordinate covalent bonds with
molecules or anions having a lone pair of electrons.
a. This type of bond formation is essentially a Lewis acid–base reaction.
b. Example: Ag+(aq) + 4 SCN
–(aq) [Ag(SCN)4]
3–(aq)
i. The silver ion is the Lewis acid (electron pair acceptor) and thiocyanate
ion is the Lewis base (electron pair donor.)
2) A complex is defined as a compound containing complex ions.
3) A ligand is a Lewis base (an electron pair donor) that bonds to a metal ion to form a
complex ion.
4) The formation constant, Kf, is the equilibrium constant for the formation of a complex
ion from the aqueous metal ion and the ligands.
a. The formation constant for [Ag(SCN)4]3–
(aq) is as follows:
b. The value for Kf for [Ag(SCN)4]3–
(aq) is 1.2 x 10¹⁰
.
c. A large value for Kf means that the complex ion is quite stable.
5) The dissociation constant, Kd, is the reciprocal, or inverse, value of Kf.
a. The dissociation constant for [Ag(SCN)4]3–
(aq) is as follows:
b. The value for Kd for [Ag(SCN)4]3–
(aq) is 8.3 x 10⁻¹¹
.
The Reagents: 1) 0.10 M AgNO3
2) 0.10 M Cu(NO3)2
3) 0.10 M Ni(NO3)2
4) 6.0 M NH4OH (source of NH3)
Pre–Lab Information:
1) In preparation for the laboratory experiment, complete “Table 1: Kf and Kd Values of the
Transition Metal Ammonia Complexes” in advance of the lab period and properly
reference the source(s) of information.
Part 1–Experimental Procedure for Formation of Ammonia Complexes: 1) Obtain 6 test tubes with a test tube rack, a glass stir rod, a 10.0 mL graduated cylinder, a
wax/grease pencil, and a deionized/distilled water bottle.
2) Using the wax/grease pencil, label the first three test tubes as “Ag+”, “Cu
2+”, and “Ni
2+”.
3) Using a 10.0 mL graduated cylinder, add 8 – 10 mL of 0.10 M AgNO3 into the test tube
labeled “Ag+”.
a. Record the color and clarity of the solution.
4) Add 8 – 10 mL of 0.10 M Cu(NO3)2 and 0.10 M Ni(NO3)2 to the properly labeled test
tubes.
a. Record the color and clarity of the solutions.
4
3
4
]][[
]])([[−+
−
=SC�Ag
SC�AgK f
]])([[
]][[13
4
4
−
−+
==SC�Ag
SC�Ag
KK
f
d
Experiment #10 Barnett
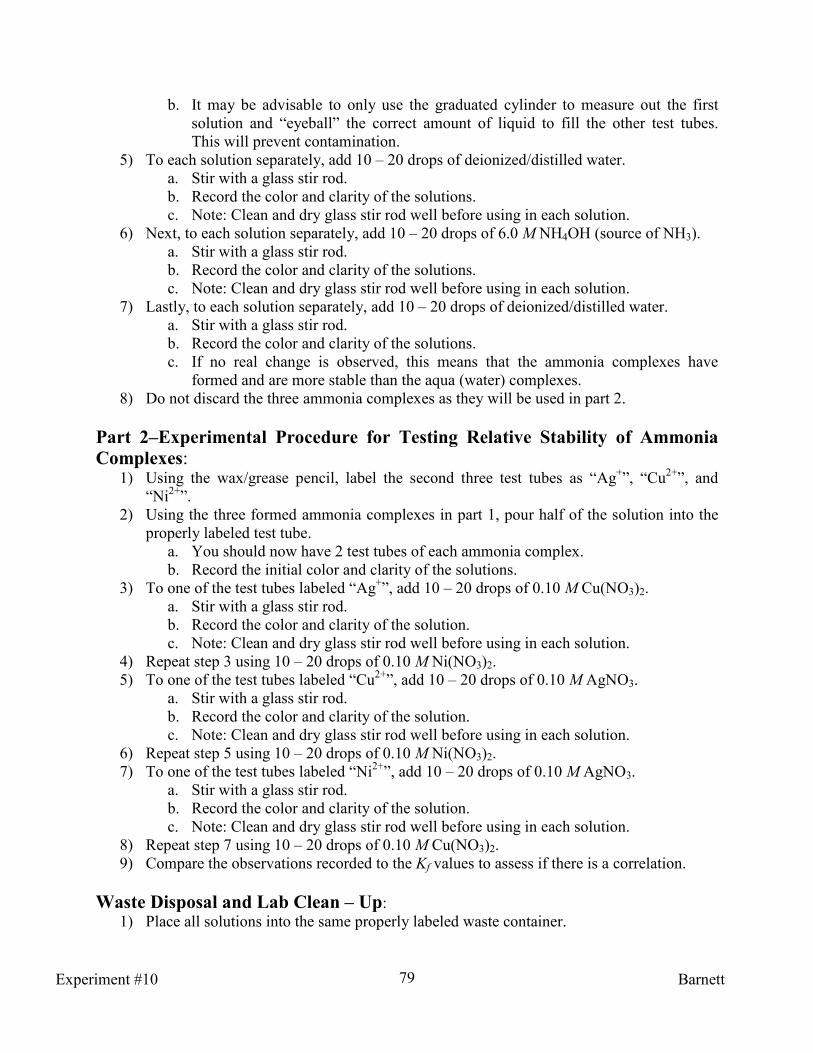
79
b. It may be advisable to only use the graduated cylinder to measure out the first
solution and “eyeball” the correct amount of liquid to fill the other test tubes.
This will prevent contamination.
5) To each solution separately, add 10 – 20 drops of deionized/distilled water.
a. Stir with a glass stir rod.
b. Record the color and clarity of the solutions.
c. Note: Clean and dry glass stir rod well before using in each solution.
6) Next, to each solution separately, add 10 – 20 drops of 6.0 M NH4OH (source of NH3).
a. Stir with a glass stir rod.
b. Record the color and clarity of the solutions.
c. Note: Clean and dry glass stir rod well before using in each solution.
7) Lastly, to each solution separately, add 10 – 20 drops of deionized/distilled water.
a. Stir with a glass stir rod.
b. Record the color and clarity of the solutions.
c. If no real change is observed, this means that the ammonia complexes have
formed and are more stable than the aqua (water) complexes.
8) Do not discard the three ammonia complexes as they will be used in part 2.
Part 2–Experimental Procedure for Testing Relative Stability of Ammonia
Complexes: 1) Using the wax/grease pencil, label the second three test tubes as “Ag
+”, “Cu
2+”, and
“Ni2+
”.
2) Using the three formed ammonia complexes in part 1, pour half of the solution into the
properly labeled test tube.
a. You should now have 2 test tubes of each ammonia complex.
b. Record the initial color and clarity of the solutions.
3) To one of the test tubes labeled “Ag+”, add 10 – 20 drops of 0.10 M Cu(NO3)2.
a. Stir with a glass stir rod.
b. Record the color and clarity of the solution.
c. Note: Clean and dry glass stir rod well before using in each solution.
4) Repeat step 3 using 10 – 20 drops of 0.10 M Ni(NO3)2.
5) To one of the test tubes labeled “Cu2+
”, add 10 – 20 drops of 0.10 M AgNO3.
a. Stir with a glass stir rod.
b. Record the color and clarity of the solution.
c. Note: Clean and dry glass stir rod well before using in each solution.
6) Repeat step 5 using 10 – 20 drops of 0.10 M Ni(NO3)2.
7) To one of the test tubes labeled “Ni2+
”, add 10 – 20 drops of 0.10 M AgNO3.
a. Stir with a glass stir rod.
b. Record the color and clarity of the solution.
c. Note: Clean and dry glass stir rod well before using in each solution.
8) Repeat step 7 using 10 – 20 drops of 0.10 M Cu(NO3)2.
9) Compare the observations recorded to the Kf values to assess if there is a correlation.
Waste Disposal and Lab Clean – Up:
1) Place all solutions into the same properly labeled waste container.
Experiment #10 Barnett

80
The Lab Write – Up: 1) Determine all values in your data table and discuss relevant data in your conclusion.
2) In the conclusion, discuss how Kf and Kd relate to the stability of a complex ion.
a. Provide the equilibrium constant expressions for the ammonia complexes
analyzed.
b. Provide the values for Kf and Kd for the ammonia complexes analyzed.
3) In the conclusion, compare the observations recorded to the Kf values to assess if there is
a correlation.
4) Provide an appropriate balanced equation for each ammonia complex formation.
5) Discuss all sources of error during this experiment and how these errors directly affected
the data.
Experiment #10 Barnett
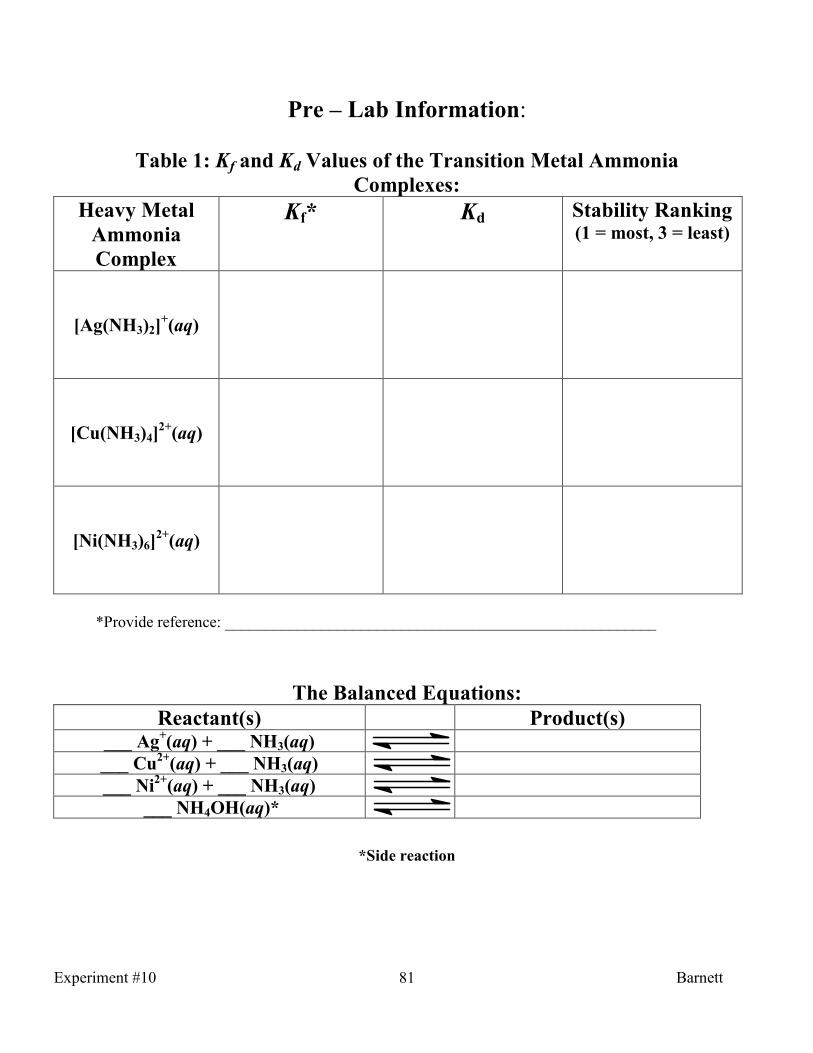
81
Pre – Lab Information:
Table 1: Kf and Kd Values of the Transition Metal Ammonia
Complexes:
Heavy Metal
Ammonia
Complex
Kf* Kd Stability Ranking (1 = most, 3 = least)
[Ag(�H3)2]+(aq)
[Cu(�H3)4]2+
(aq)
[�i(�H3)6]2+
(aq)
*Provide reference: ______________________________________________________
The Balanced Equations:
Reactant(s) Product(s) ___ Ag
+(aq) + ___ �H3(aq)
___ Cu2+
(aq) + ___ �H3(aq)
___ �i2+
(aq) + ___ �H3(aq)
___ �H4OH(aq)*
*Side reaction
Experiment #10 Barnett

82
Sample Data Tables:
Part 1: Formation of Ammonia Complexes
Heavy Metal Solution Initial Color &
Clarity
Color & Clarity
After Water
Addition
Color & Clarity
After Ammonia
Addition
Color & Clarity
After Second
Water Addition
0.10 M Ag�O3(aq)
0.10 M Cu(�O3)2(aq)
0.10 M �i(�O3)2(aq)
Part 2: Testing Relative Stability of Ammonia Complexes Heavy Metal
Ammonia Complex
Initial Color
& Clarity
Color & Clarity
After 0.10 M
Ag�O3(aq)
Addition
Color & Clarity
After 0.10 M
Cu(�O3)2(aq)
Addition
Color & Clarity
After 0.10 M
�i(�O3)2(aq)
Addition
[Ag(�H3)2]+(aq)
[Cu(�H3)4]2+
(aq)
[�i(�H3)6]2+
(aq)
Experiment #10 Barnett

83
Experiment #11:
Predicting Spontaneity of Chemical Reactions by Analysis of
Gibbs Free Energy
An Introduction to Thermodynamics and Enthalpy (H): 1) Thermodynamics is the study of the relationship between heat and other forms of energy
in a chemical or physical process.
2) The heat absorbed or evolved by a physical or chemical process depends on the
conditions under which it occurs.
a. Most processes take place in an open container, and thus are at constant pressure.
i. This change in heat at constant pressure is denoted as qp.
3) Enthalpy, denoted H, is an extensive property of a substance that can be used to obtain
the heat absorbed or evolved in a physical or chemical process.
a. Enthalpy is an extensive property of matter; it depends on the amount of a
substance.
b. Enthalpy is a state function which means that it is a property of a system that only
depends on the present state and is independent of the previous history of that
system.
4) The change in enthalpy (∆H) for a reaction at a given temperature and pressure (called
the enthalpy of reaction) is obtained by subtracting the enthalpy of the reactants from the
enthalpy of the products.
5) The term standard state refers to the standard thermodynamic conditions chosen for
substances when listing or comparing thermodynamic data; this implies 25oC, 1 atm
pressure, and a concentration of 1 M for dissolved substances.
a. A standard enthalpy is denoted as ∆Ho.
6) The standard enthalpy of formation of a substance, denoted ∆Hfo, is the enthalpy change
for the formation of one mole of a substance in its standard state from its component
elements in their standard state.
a. The standard enthalpy of formation for elements is always equal to zero kilojoules
per mole.
7) The law of summation of heats of formation states that the enthalpy of a reaction is equal
to the total formation energy of the products minus that of the reactants.
a. The equation:
b. The letters m & n are coefficients for those substances in the balanced chemical
equation.
An Introduction to Entropy (S): 1) The second law of thermodynamics states that for a totally isolated system that is not at
thermal equilibrium, the entropy will increase over time reaching a maximum.
a. Entropy, S, is a thermodynamic quantity that is a measure of the randomness or
disorder of a system.
b. The SI unit of entropy is joules per Kelvin (J/K) and, like enthalpy, is a state
function.
)reactants()products( ∑∑ ∆−∆=∆o
f
o
f
o HmHnH
Experiment #11 Barnett

84
2) The third law of thermodynamics states that a substance that is perfectly crystalline at a
temperature of 0 Kelvin has an entropy of zero joules per Kelvin.
a. When temperature is raised, however, the substance becomes more disordered as
it absorbs heat.
b. The entropy of a substance is determined by measuring how much heat is required
to change its temperature per Kelvin degree.
3) The entropy change for a reaction can be calculated by using a summation law, similar to
the way ∆Hfo is obtained.
a. The equation:
4) The entropy usually increases in the following situations:
a. A reaction in which a molecule is broken into two or more smaller molecules.
b. A reaction in which there is an increase in the moles of gases.
c. A process in which a solid changes to liquid or gas or a liquid changes to gas
An Introduction to Gibbs Free Energy (G): 1) The American physicist by the name of J. Willard Gibbs introduced the concept of free
energy (sometimes called the Gibbs free energy), G.
2) Gibbs free energy is a measurement of the thermodynamic potential for maximum work
energy at constant temperature and pressure.
a. This quantity gives a direct criterion for spontaneity of reaction.
3) Changes in enthalpy (∆H) and entropy (∆S) during a reaction result in a change in free
energy, ∆G , given by the equation:
4) Gibbs free energy can be useful in judging the spontaneity of a reaction:
a. When ∆Go is a large negative number (more negative than about –10 kJ), the
reaction is spontaneous as written, and the reactants transform almost entirely to
products when equilibrium is reached.
b. When ∆Go is a large positive number (more positive than about +10 kJ), the
reaction is nonspontaneous as written, and reactants do not give significant
amounts of product at equilibrium.
c. When ∆Go is a small negative or positive value (less than about 10 kJ), the
reaction gives an equilibrium mixture with significant amounts of both reactants
and products.
5) The table below can be used to predict the spontaneity of a reaction given temperature
considerations.
∆∆∆∆Ho ∆∆∆∆S
o ∆∆∆∆G
o Description
– + – Spontaneous at all temperatures
+ – + Nonspontaneous at all temperatures
– – + or – Spontaneous at low temperatures
Nonspontaneous at high temperatures
+ + + or – Spontaneous at high temperatures
Nonspontaneous at low temperatures
)reactants()products( ooo SmSnS ∆−∆=∆ ∑∑
STHG ∆−∆=∆
Experiment #11 Barnett
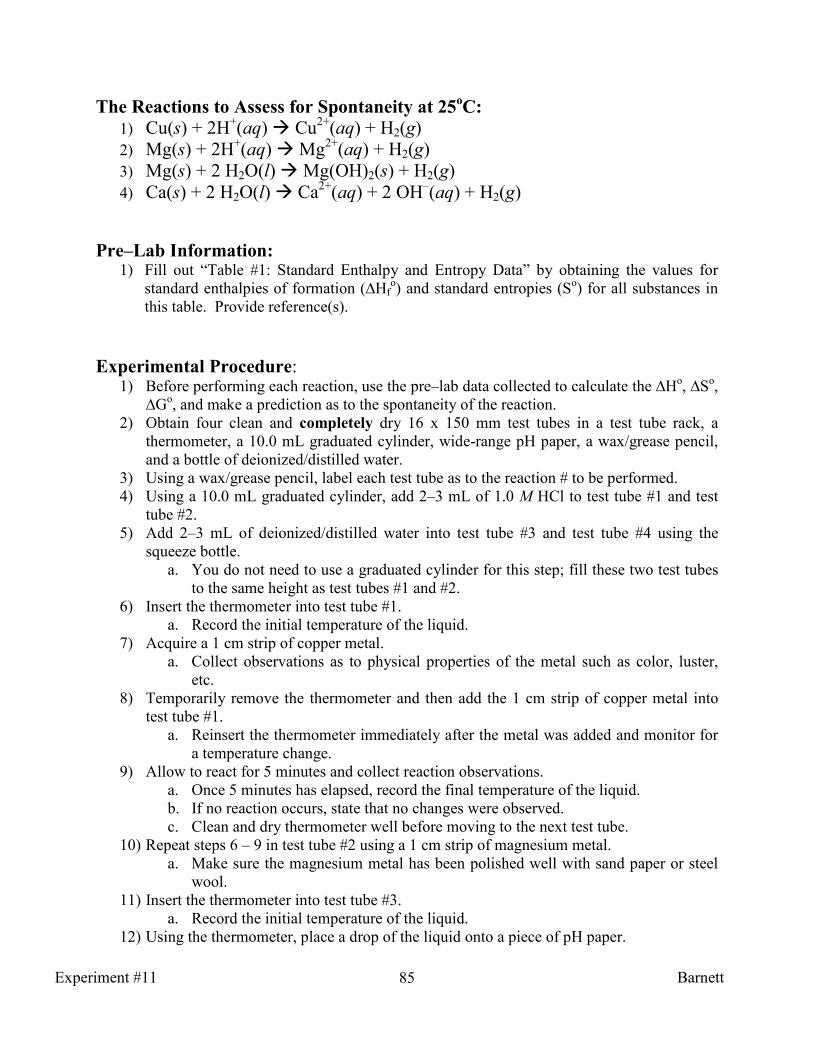
85
The Reactions to Assess for Spontaneity at 25oC:
1) Cu(s) + 2H+(aq) � Cu
2+(aq) + H2(g)
2) Mg(s) + 2H+(aq) � Mg
2+(aq) + H2(g)
3) Mg(s) + 2 H2O(l) � Mg(OH)2(s) + H2(g)
4) Ca(s) + 2 H2O(l) � Ca2+
(aq) + 2 OH–(aq) + H2(g)
Pre–Lab Information:
1) Fill out “Table #1: Standard Enthalpy and Entropy Data” by obtaining the values for
standard enthalpies of formation (∆Hfo) and standard entropies (S
o) for all substances in
this table. Provide reference(s).
Experimental Procedure: 1) Before performing each reaction, use the pre–lab data collected to calculate the ∆H
o, ∆S
o,
∆Go, and make a prediction as to the spontaneity of the reaction.
2) Obtain four clean and completely dry 16 x 150 mm test tubes in a test tube rack, a
thermometer, a 10.0 mL graduated cylinder, wide-range pH paper, a wax/grease pencil,
and a bottle of deionized/distilled water.
3) Using a wax/grease pencil, label each test tube as to the reaction # to be performed.
4) Using a 10.0 mL graduated cylinder, add 2–3 mL of 1.0 M HCl to test tube #1 and test
tube #2.
5) Add 2–3 mL of deionized/distilled water into test tube #3 and test tube #4 using the
squeeze bottle.
a. You do not need to use a graduated cylinder for this step; fill these two test tubes
to the same height as test tubes #1 and #2.
6) Insert the thermometer into test tube #1.
a. Record the initial temperature of the liquid.
7) Acquire a 1 cm strip of copper metal.
a. Collect observations as to physical properties of the metal such as color, luster,
etc.
8) Temporarily remove the thermometer and then add the 1 cm strip of copper metal into
test tube #1.
a. Reinsert the thermometer immediately after the metal was added and monitor for
a temperature change.
9) Allow to react for 5 minutes and collect reaction observations.
a. Once 5 minutes has elapsed, record the final temperature of the liquid.
b. If no reaction occurs, state that no changes were observed.
c. Clean and dry thermometer well before moving to the next test tube.
10) Repeat steps 6 – 9 in test tube #2 using a 1 cm strip of magnesium metal.
a. Make sure the magnesium metal has been polished well with sand paper or steel
wool.
11) Insert the thermometer into test tube #3.
a. Record the initial temperature of the liquid.
12) Using the thermometer, place a drop of the liquid onto a piece of pH paper.
Experiment #11 Barnett
86
a. Record the initial pH of the liquid.
13) Acquire a 1 cm strip of magnesium metal.
a. Make sure the magnesium metal has been polished well with sand paper or steel
wool.
b. Collect observations as to physical properties of the metal such as color, luster,
etc.
14) Temporarily remove the thermometer and then add the 1 cm strip of magnesium metal
into test tube #3.
a. Reinsert the thermometer immediately after the metal was added and monitor for
a temperature change.
15) Allow to react for 5 minutes and collect reaction observations.
a. Once 5 minutes has elapsed, record the final temperature of the liquid.
b. Use a glass stir rod to test pH of the resultant solution via the pH paper. Compare
the pH to pure deionized/distilled water.
c. If no reaction occurs, state that no changes were observed.
d. Clean and dry thermometer well before moving to the next test tube.
16) Repeat steps 11 – 15 in test tube #4 using a small (pea sized) piece of calcium metal.
Waste Disposal and Lab Clean – Up:
1) Place the contents of each test tube into the properly labeled waste containers.
The Lab Write – Up: 1) Determine all values in your data table and discuss relevant data in your conclusion.
2) For each reaction, discuss the following information in the conclusion:
a. Enthalpy change (∆Ho) and whether the proposed reaction was endothermic or
exothermic.
b. Entropy change (∆So) and whether the proposed reaction was becoming more
ordered or disordered.
c. Gibbs free energy change (∆Go) and whether the proposed reaction would be
spontaneous or nonspontaneous at 25oC.
d. The observations (including pH and/or temperature readings) before, during, and
after the reaction to support ∆Ho, ∆S
o, ∆G
o, and the prediction as to the
spontaneity of the reaction.
3) Discuss all sources of error during this experiment and how these errors directly affected
the data.
Experiment #11 Barnett

87
Pre – Lab Information:
Table #1: Standard Enthalpy and Entropy Data
Substance (State) Enthalpy, XHfo
(kJ/mol)
Entropy, So
(J/mol●K) Ca(s)
Ca2+
(aq)
Cu(s)
Cu2+
(aq)
Cl–(aq)
H+(aq)
H2(g)
H2O(l)
Mg(s)
Mg2+
(aq)
Mg(OH)2(s)
OH–(aq)
Reference(s): ____________________________________________________________
____________________________________________________________
Experiment #11 Barnett

88
Sample Data Tables:
Reaction #1: Cu(s) + 2 H+(aq) ���� Cu
2+(aq) + H2(g)
Data Point to be
Recorded/Calculated
Data Point
XHo (kJ/mol)
XSo (J/mol●K)
XGo (kJ/mol)
Spontaneous or �onspontaneous?
Temperature of liquid before
addition of metal in degrees Celsius:
Observations collected before
reaction of metal:
Observations collected during
reaction of metal:
Final temperature of liquid after
addition of metal in degrees Celsius:
Reaction #2: Mg(s) + 2 H+(aq) ���� Mg
2+(aq) + H2(g)
Data Point to be
Recorded/Calculated
Data Point
XHo (kJ/mol)
XSo (J/mol●K)
XGo (kJ/mol)
Spontaneous or �onspontaneous?
Temperature of liquid before
addition of metal in degrees Celsius:
Observations collected before
reaction of metal:
Observations collected during
reaction of metal:
Final temperature of liquid after
addition of metal in degrees Celsius:
Experiment #11 Barnett

89
Sample Data Tables (Continued):
Reaction #3: Mg(s) + 2 H2O(l) ���� Mg(OH)2(s) + H2(g)
Data Point to be
Recorded/Calculated
Data Point
XHo (kJ/mol)
XSo (J/mol●K)
XGo (kJ/mol)
Spontaneous or �onspontaneous?
Temperature of liquid before
addition of metal in degrees Celsius:
Initial pH of liquid:
Observations collected before
reaction of metal:
Observations collected during
reaction of metal:
Final temperature of liquid after
addition of metal in degrees Celsius:
pH of resultant solution:
Reaction #4: Ca(s) + 2 H2O(l) ���� Ca2+
(aq) + 2 OH–(aq) + H2(g)
Data Point to be
Recorded/Calculated
Data Point
XHo (kJ/mol)
XSo (J/mol●K)
XGo (kJ/mol)
Spontaneous or �onspontaneous?
Temperature of liquid before
addition of metal in degrees Celsius:
Initial pH of liquid:
Observations collected before
reaction of metal:
Observations collected during
reaction of metal:
Final temperature of liquid after
addition of metal in degrees Celsius:
pH of resultant solution:
Experiment #11 Barnett

90
Experiment #12A:
Aqueous Electrolysis
Introduction to Electrolysis: 1) Electrolysis is the production of a chemical reaction or chemical change through the use
of an electrolytic cell.
a. Commonly, a non–spontaneous process can be converted into a spontaneous one
by the introduction of an electrical current.
2) Wires, originating from a battery, are connected to two electrodes and immersed into the
material to complete an electrochemical cell.
a. The cathode is the electrode where reduction occurs.
b. The anode is the electrode where oxidation occurs.
3) Electrolysis of a molten salt, such as sodium chloride, is a relatively simple process by
which pure sodium and chlorine elements are produced from the salt.
a. A Downs cell is the commercially implemented cell.
b. The sodium ion, Na+(l), is reduced to pure sodium metal, Na(l), at the cathode.
c. The chloride ion, Cl–(l), oxidized to pure diatomic chlorine, Cl2(g) at the anode.
4) Unlike in the electrolysis of a molten salt, water can become involved in the electrolysis
of an aqueous solution.
Aqueous Electrolysis: 1) To determine what are the predominant oxidation and reduction processes in aqueous
electrolysis, all possible half – reactions must be considered.
a. At the cathode, the larger the reduction potential (more positive or less negative),
the more easily reduced.
b. At the anode, the larger the oxidation potential (more positive or less negative),
the more easily oxidized.
2) In the electrolysis of sodium chloride solutions, the possible reactions involve Na+(aq),
Cl–(aq), and H2O(l).
a. At the cathode, the two potential half – reactions are as follows:
i. Na+(aq) + e
– Na(s); E
o = –2.71 V
ii. 2H2O(l) + 2e– H2(g) + 2OH
–(aq); E
o = –0.83 V
iii. Under standard conditions, the water would be reduced over the sodium
ion because of a larger (more positive) reduction potential.
b. At the anode, the two potential half – reactions are as follows:
i. 2Cl–(aq) Cl2(g) + 2e
–; E
o = –1.36 V
ii. 2H2O(l) O2(g) + 4H+(aq) + 4e
–; E
o = –1.23 V
iii. Under standard conditions, it would appear that the water would be
oxidized over the chloride ion because of a larger (more positive)
oxidation potential.
iv. Because the potentials are close, increasing the concentration of NaCl and
creating an overvoltage could favor the oxidation of the chloride ion.
Experiment #12A Barnett
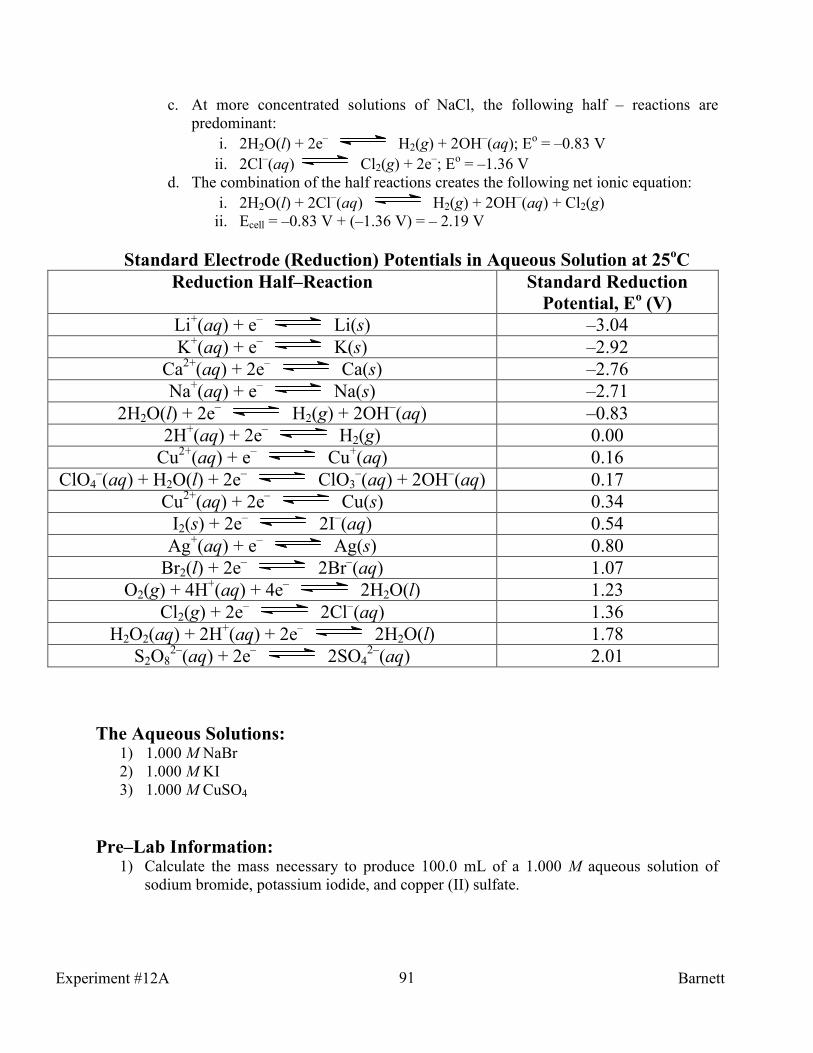
91
c. At more concentrated solutions of NaCl, the following half – reactions are
predominant:
i. 2H2O(l) + 2e– H2(g) + 2OH
–(aq); E
o = –0.83 V
ii. 2Cl–(aq) Cl2(g) + 2e
–; E
o = –1.36 V
d. The combination of the half reactions creates the following net ionic equation:
i. 2H2O(l) + 2Cl–(aq) H2(g) + 2OH
–(aq) + Cl2(g)
ii. Ecell = –0.83 V + (–1.36 V) = – 2.19 V
Standard Electrode (Reduction) Potentials in Aqueous Solution at 25oC
Reduction Half–Reaction Standard Reduction
Potential, Eo (V)
Li+(aq) + e
– Li(s) –3.04
K+(aq) + e
– K(s) –2.92
Ca2+
(aq) + 2e– Ca(s) –2.76
Na+(aq) + e
– Na(s) –2.71
2H2O(l) + 2e– H2(g) + 2OH
–(aq) –0.83
2H+(aq) + 2e
– H2(g) 0.00
Cu2+
(aq) + e– Cu
+(aq) 0.16
ClO4–(aq) + H2O(l) + 2e
– ClO3
–(aq) + 2OH
–(aq) 0.17
Cu2+
(aq) + 2e– Cu(s) 0.34
I2(s) + 2e– 2I
–(aq) 0.54
Ag+(aq) + e
– Ag(s) 0.80
Br2(l) + 2e– 2Br
–(aq) 1.07
O2(g) + 4H+(aq) + 4e
– 2H2O(l) 1.23
Cl2(g) + 2e– 2Cl
–(aq) 1.36
H2O2(aq) + 2H+(aq) + 2e
– 2H2O(l) 1.78
S2O82–
(aq) + 2e– 2SO4
2–(aq) 2.01
The Aqueous Solutions:
1) 1.000 M NaBr
2) 1.000 M KI
3) 1.000 M CuSO4
Pre–Lab Information:
1) Calculate the mass necessary to produce 100.0 mL of a 1.000 M aqueous solution of
sodium bromide, potassium iodide, and copper (II) sulfate.
Experiment #12A Barnett

92
Procedure for the Electrolysis of Three Aqueous Solutions: 1) Calculate the mass necessary to produce 100.0 mL of a 1.000 M aqueous solution of
sodium bromide, potassium iodide, and copper (II) sulfate.
2) Based on the masses determined in the pre – lab, measure out the calculated quantities of
each on a piece of weigh paper (or weigh boat) with an analytical balance and carefully
transfer into a 100.0 mL volumetric flask.
a. Record exact mass on the data table.
3) Add up to the 100.0 mL mark with deionized water.
4) Swirl to dissolve the salt completely. If necessary, carefully add a magnetic stir bar to
the flask and place onto a hotplate to stir until dissolved.
a. Do not allow the water to splash out.
5) Separately, transfer each solution into a labeled 150 mL beaker.
a. Using a grease/wax pencil, label each beaker.
6) Test the pH of each solution.
a. This can be performed by placing a glass stir rod into solution and placing a drop
onto pH paper.
b. An alternate procedure using a pH meter/probe can be implemented.
7) Clamp two alligator clips with electrical leads to each clasp of a 9 volt battery.
8) To the other end of the alligator clips, attach two graphite electrodes.
9) Separately, immerse both electrodes into each of aqueous solutions. Allow process to
occur for at least 3 minutes.
a. Do not allow both electrodes to come into contact.
b. Record observations from both electrodes for each aqueous solution.
i. Indicate colors, states of matter, etc.
c. Ensure electrodes are cleaned thoroughly between each electrolysis.
10) After electrolysis, remove electrodes and test pH of the resultant solution.
a. This can be performed by placing a glass stir rod into solution and placing a drop
onto pH paper.
b. An alternate procedure using the laptop computers with pH probes can be
implemented.
11) For each electrolysis, include the following:
a. All possible half – reactions at the cathode
i. Considering the electrode potentials and reaction conditions, select the
predominant half – reaction and provide rationale.
b. All possible half – reactions at the anode
i. Considering the electrode potentials and reaction conditions, select the
predominant half – reaction and provide rationale.
c. The net ionic equation (for each electrode)
d. Combined balanced half reactions with states of matter
Waste Disposal and Lab Clean – Up:
1) Place all solutions into the properly labeled waste containers.
2) All electrodes should be carefully rinsed with water and dried.
3) The electrode with electroplated copper should be placed into a beaker so that nitric acid
can be applied to remove.
Experiment #12A Barnett

93
The Lab Write – Up: 1) Determine all values in your data table and discuss relevant data in your conclusion.
2) For each electrolysis, include the following and discuss in the conclusion:
a. All possible half–reactions at the cathode
i. Considering the electrode potentials, select the predominant half – reaction
and provide rationale.
b. All possible half – reactions at the anode
i. Considering the electrode potentials, select the predominant half – reaction
and provide rationale.
c. The net ionic equation (for each electrode)
d. Combined balanced half reactions with states of matter
3) In the electrolysis of KI and NaBr, pure elemental iodine, potassium, and sodium cannot
be isolated. Discuss by using the appropriate balanced equations when applicable.
4) Discuss the pH changes for each solution. Reflecting back on pH of aqueous salts, do the
initial pH measurements for each aqueous solution make sense? Explain.
5) Discuss the electrolysis of calcium perchlorate. Indicate the half–reactions that occur at
each electrode. Determine the combined balanced half reaction and calculate Ecell.
a. Assume a 1.0 M concentration of calcium perchlorate and an overvoltage.
6) Discuss all sources of error during this experiment and how these errors directly affected
the data.
Experiment #12A Barnett

94
Pre – Lab Information: Data Point �aBr Solution KI Solution CuSO4
Solution Calculated mass of salt to
produce 100.0 mL of a
1.000 M solution in grams:
Sample Data Table: Data Point �aBr Solution KI Solution CuSO4
Solution Mass of salt measured via an
analytical balance in grams:
Molarity of salt solution in
moles per liter:
Initial pH (before
electrolysis):
Observations of cathode:
Observations of anode:
pH of resultant solution (after
electrolysis):
Possible reduction reactions
with Eo
Possible oxidation reactions
with Eo
Experiment #12A Barnett

95
�et Ionic Equations and Ecell for Data:
Solution Combined Balanced Half Reactions Ecell (Volts)
NaBr Solution
KI Solution
CuSO4
Solution
�et Ionic Equation & Ecell for Post–Lab Question:
Solution Combined Balanced Half Reactions Ecell (Volts)
calcium
perchlorate
solution
Experiment #12A Barnett
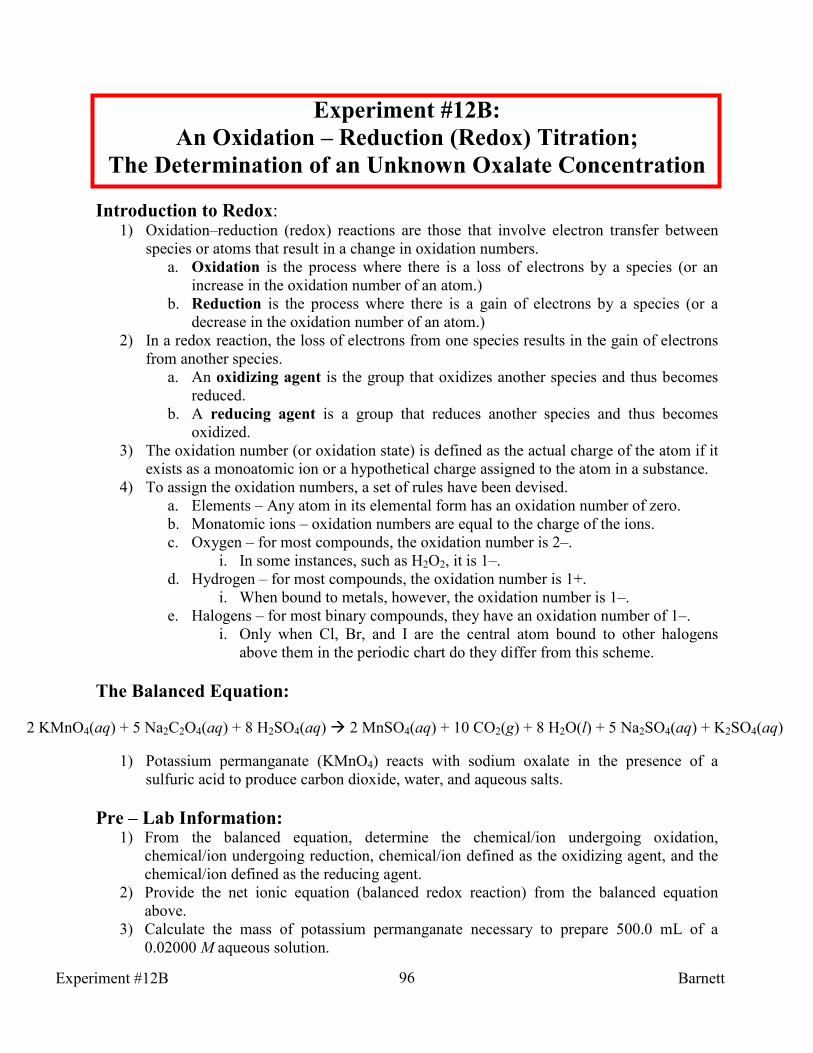
96
2 KMnO4(aq) + 5 Na2C2O4(aq) + 8 H2SO4(aq) � 2 MnSO4(aq) + 10 CO2(g) + 8 H2O(l) + 5 Na2SO4(aq) + K2SO4(aq)
Experiment #12B:
An Oxidation – Reduction (Redox) Titration;
The Determination of an Unknown Oxalate Concentration
Introduction to Redox: 1) Oxidation–reduction (redox) reactions are those that involve electron transfer between
species or atoms that result in a change in oxidation numbers.
a. Oxidation is the process where there is a loss of electrons by a species (or an
increase in the oxidation number of an atom.)
b. Reduction is the process where there is a gain of electrons by a species (or a
decrease in the oxidation number of an atom.)
2) In a redox reaction, the loss of electrons from one species results in the gain of electrons
from another species.
a. An oxidizing agent is the group that oxidizes another species and thus becomes
reduced.
b. A reducing agent is a group that reduces another species and thus becomes
oxidized.
3) The oxidation number (or oxidation state) is defined as the actual charge of the atom if it
exists as a monoatomic ion or a hypothetical charge assigned to the atom in a substance.
4) To assign the oxidation numbers, a set of rules have been devised.
a. Elements – Any atom in its elemental form has an oxidation number of zero.
b. Monatomic ions – oxidation numbers are equal to the charge of the ions.
c. Oxygen – for most compounds, the oxidation number is 2–.
i. In some instances, such as H2O2, it is 1–.
d. Hydrogen – for most compounds, the oxidation number is 1+.
i. When bound to metals, however, the oxidation number is 1–.
e. Halogens – for most binary compounds, they have an oxidation number of 1–.
i. Only when Cl, Br, and I are the central atom bound to other halogens
above them in the periodic chart do they differ from this scheme.
The Balanced Equation:
1) Potassium permanganate (KMnO4) reacts with sodium oxalate in the presence of a
sulfuric acid to produce carbon dioxide, water, and aqueous salts.
Pre – Lab Information: 1) From the balanced equation, determine the chemical/ion undergoing oxidation,
chemical/ion undergoing reduction, chemical/ion defined as the oxidizing agent, and the
chemical/ion defined as the reducing agent.
2) Provide the net ionic equation (balanced redox reaction) from the balanced equation
above.
3) Calculate the mass of potassium permanganate necessary to prepare 500.0 mL of a
0.02000 M aqueous solution.
Experiment #12B Barnett
97
Part 1–Preparation of a 0.02000 M Solution of KMnO4: 1) Using the calculated mass from the pre-lab, measure out this mass of KMnO4 on a piece
of weigh paper (or weigh boat) with an analytical balance.
a. Record exact mass in the lab notebook.
b. Never add solute to the weigh paper INSIDE of the balance; do this outside the
balance and then place onto the balance.
2) Carefully transfer powder into a 500.0 mL volumetric flask.
3) Add up to the 500.0 mL mark with deionized water.
4) Swirl to ensure potassium permanganate is completely dissolved.
Part 2–Procedure for Redox Titration of an Oxalate Solution of Unknown
Concentration: 1) Pipet exactly 25.0 mL of an unknown oxalate solution into a 400 mL beaker.
2) To the same 400 mL beaker, add about 75.0 mL of deionized water followed by 25.0 mL
of a 3.0 M H2SO4 solution which has been “spiked” with a catalytic amount (0.030 M) of
MnSO4.
3) Insert a magnetic stir bar into the solution and place onto a stirring hotplate. Turn on stir
function and heat.
4) Heat the solution to maintain a temperature of around 80oC.
a. During the titration, the oxalate solution can remain on the hotplate but ensure
that the solution does not boil.
5) While the oxalate solution is heating, place an empty 100 mL beaker under a buret
attached to a buret stand.
6) Ensure the buret stopcock is in the closed position. Using a short stem funnel, add
approximately 10.0 mL of the prepared KMnO4 solution to the buret.
7) Condition the buret by holding it horizontally and rotating to allow the KMnO4 solution
to wet the inside of the glass completely. Discard the rinse into a properly labeled
“KMnO4 waste” container.
8) Fill the buret with the prepared KMnO4 solution and adjust the meniscus to zero.
a. Record the initial buret reading as 0.00 mL.
b. Keep any remaining KMnO4 solution for later.
9) Once the oxalate solution has achieved a stable temperature of ~80oC, move the buret
into place over top of the oxalate solution.
10) Add 1.0 mL allotments of the KMnO4 solution and allow pink or purple color to
disappear.
11) Titrate until the endpoint has been reached.
a. The endpoint of the titration is when the addition of a single added drop of
KMnO4 solution produces a faint but permanent pink or purple color.
12) Record the total volume of KMnO4 added.
13) Repeat titration for a second trial.
a. If results differ significantly from the first two trials or if time permits, repeat for
a third trial.
14) Determine the oxalate concentration of the unknown solution.
Experiment #12B Barnett

98
Waste Disposal and Lab Clean – Up:
1) Place all solutions together into the properly labeled waste container.
The Lab Write – Up: 1) Determine all values in your data table and discuss relevant data in your conclusion.
2) For the first part of the experiment:
a. Calculate the molarity of the prepared KMnO4 solution. How close was it to the
desired molarity of 0.02000 M?
3) For the second part of the experiment:
a. Determine the molarity of the oxalate anion in the unknown solution.
4) Determine the the chemical/ion undergoing oxidation, chemical/ion undergoing
reduction, chemical/ion defined as the oxidizing agent, and the chemical/ion defined as
the reducing agent. Discuss this information in your conclusion.
4) Provide the net ionic equation (balanced redox reaction) from the balanced equation
above.
5) Discuss the entropy, enthalpy, and the Gibb’s free energy of this reaction using the
following equation. Predict the sign on each.
a. ∆G = ∆H – T∆S
6) Discuss all sources of error during this experiment and how these errors directly affected
the data.
Experiment #12B Barnett
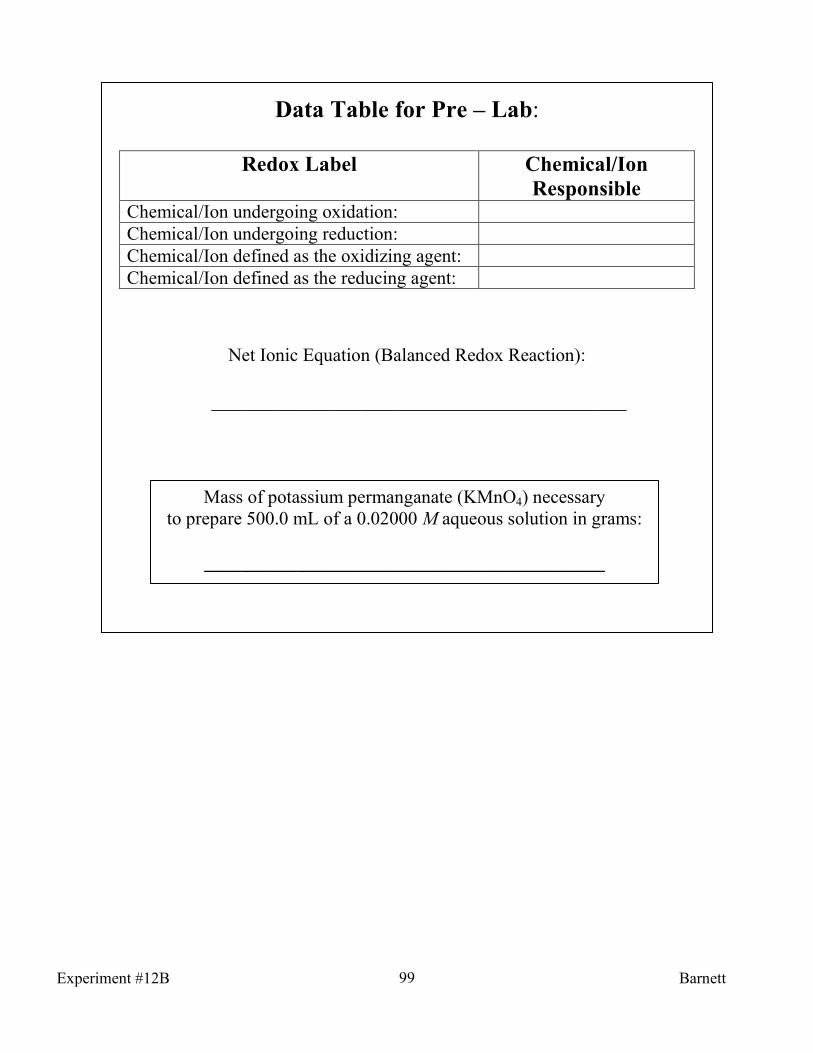
99
Data Table for Pre – Lab:
Redox Label Chemical/Ion
Responsible Chemical/Ion undergoing oxidation:
Chemical/Ion undergoing reduction:
Chemical/Ion defined as the oxidizing agent:
Chemical/Ion defined as the reducing agent:
Net Ionic Equation (Balanced Redox Reaction):
_______________________________________
Mass of potassium permanganate (KMnO4) necessary
to prepare 500.0 mL of a 0.02000 M aqueous solution in grams:
___________________________________________
Experiment #12B Barnett

100
Sample Data Tables:
Part 1–Preparation of a 0.02000 M Solution of KMnO4:
Data Point to be Recorded/Calculated Data Point a) Mass of potassium permanganate (KMnO4) measured in
grams:
b) Moles of potassium permanganate (KMnO4) measured
in mol:
c) Total volume in volumetric flask in liters: d) Molarity of potassium permanganate (KMnO4) solution
prepared in moles per liter (b/c):
Part 2–Procedure for Redox Titration of an Oxalate Solution of Unknown
Concentration:
Data Recorded/Calculated Trial #1 Trial #2 Trial #3
a) Molarity of potassium permanganate (KMnO4)
measured in moles per liter: (See d) in part 1)
b) Volume of unknown oxalate solution titrated in
milliliters: 25.00 mL
c) Volume of potassium permanganate (KMnO4)
solution added in titration of oxalate solution in
milliliters:
d) Moles of potassium permanganate (KMnO4)
added in titration of oxalate solution in mol*:
e) Moles of sodium oxalate (Na2C2O4) titrated by
potassium permanganate (KMnO4) in mol†:
f) Molarity of sodium oxalate (Na2C2O4) titrated
by potassium permanganate (KMnO4) in moles
per liter:
g) Average molarity of sodium oxalate (Na2C2O4)
titrated by potassium permanganate (KMnO4) in
moles per liter:
*Calculated by using calculated molarity from part 1
†Calculated by using the mole to mole ratio in balanced equation
Experiment #12B Barnett
101
Experiment #13:
The Synthesis and Characterization of Aspirin
(Acetylsalicylic Acid) An Introduction to Aspirin (Acetylsalicylic Acid):
1) Aspirin (acetylsalicylic acid) is one of the oldest and most versatile drugs known to
medicine.
2) Aspirin (acetylsalicylic acid) is an analgesic, antipyretic, anti–inflammatory drug.
3) It is also used as an antiplatelet agent as it inhibits platelet aggregation.
4) It works by preventing the synthesis of prostaglandins by inhibiting both the
cyclooxygenase–1 (COX–1) and cyclooxygenase–2 (COX–2) isoenzymes
a. COX–2 mediates tissue inflammation.
b. COX–1 mediates platelet aggregation, gastric protection, and induction of renal
function.
5) Aspirin is in a class of medications called salicylates.
a. Common adverse effects include: gastrointestinal (GI) distress (including upset
stomach, heartburn, nausea, vomiting).
b. Less common severe adverse effects include: tinnitus, Reye syndrome, GI
ulceration, allergic reactions (including hives, shortness of breath, swelling,
and/or anaphylaxis.)
6) Aspirin should not be taken with other salicylates, non–steroidal anti–inflammatory
drugs (NSAIDs) such as ibuprofen or naproxen sodium, or anticoagulants such as
Coumadin (warfarin).
7) Aspirin can be purchased both over–the–counter (OTC) and by prescription (Rx) from a
physician.
a. OTC preparations: Aspergum, Bayer Aspirin, Bufferin, Ecotrin, Empirin,
Halfprin, St. Joseph Aspirin, and many generics.
b. Rx preparation: ZORprin
8) Aspirin is synthesized from the acetylation (using acetic anhydride or acetyl chloride) of
salicylic acid.
a. Salicylic acid is a natural product that can be derived from the bark of a willow
tree.
b. Salicylic acid is not used as an analgesic due to the highly acidic nature as it is
damaging to mucous membranes.
i. This is why this chemical is used as a ketatolytic (peeling) agent in the
treatment of acne, corns, and warts.
c. The addition of the acetyl group to the phenolic oxygen makes the medication less
irritating to the esophagus and gastric lining.
Experiment #13 Barnett
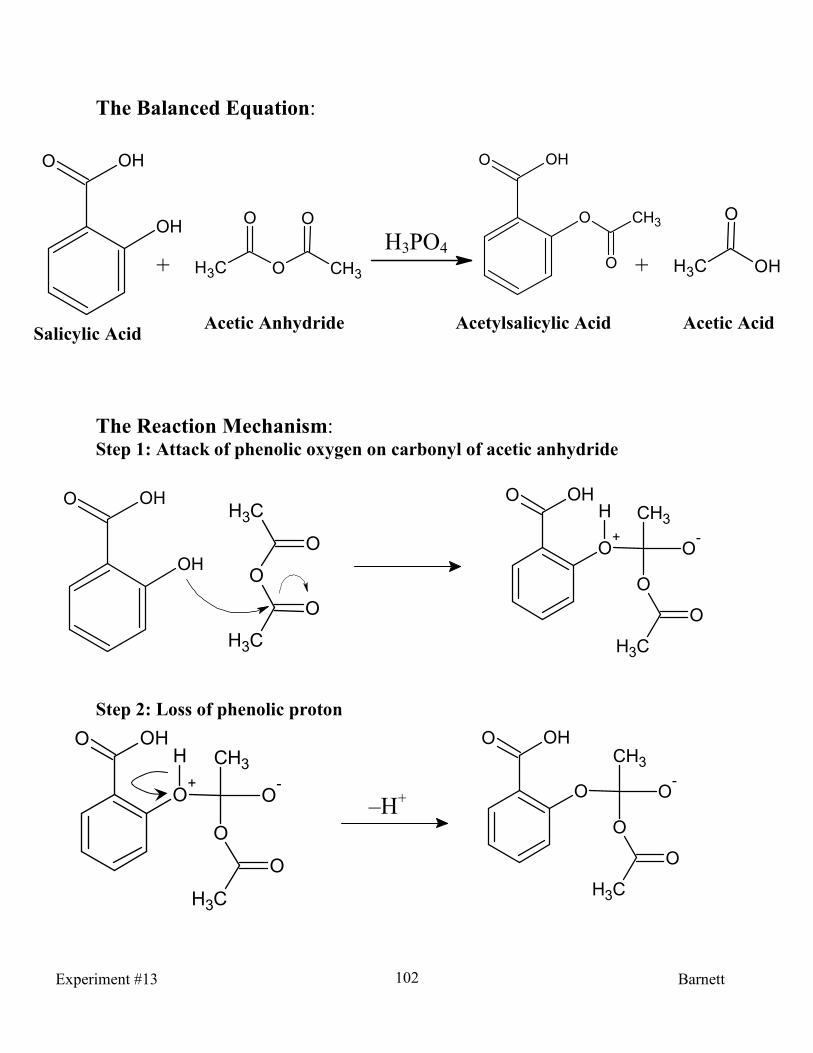
102
OH
OHO
H3C O CH3
O O O
OHO
CH3
O+ + H3C OH
O
Acetylsalicylic Acid Salicylic Acid
Acetic Anhydride Acetic Acid
OH
OHOCH3
O
CH3
O
O
OHO
O+
H
O-
O
CH3
CH3
O
OHO
O O-
O
CH3
CH3
O
–H+
The Balanced Equation:
The Reaction Mechanism: Step 1: Attack of phenolic oxygen on carbonyl of acetic anhydride
Step 2: Loss of phenolic proton
OHO
O+
H
O-
O
CH3
CH3
O
H3PO4
Experiment #13 Barnett
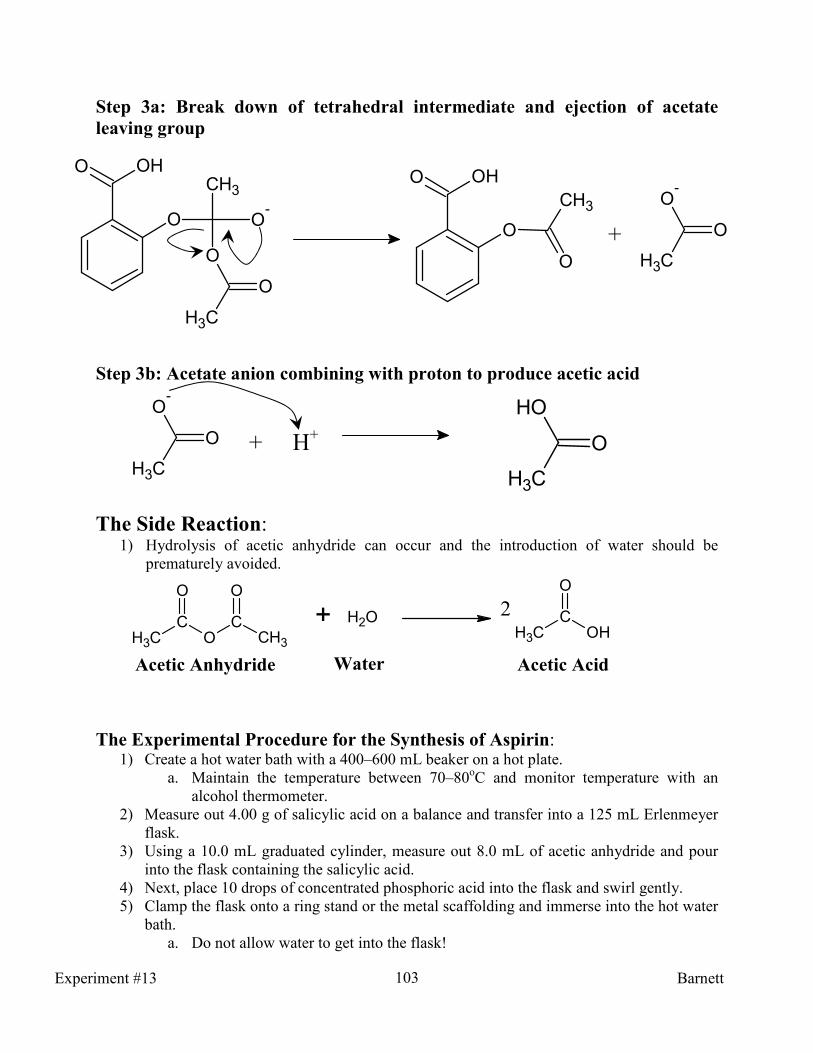
103
O-
CH3
O
OHO
O
CH3
O
+
O-
CH3
O + H+
OH
CH3
O
Acetic Anhydride
CH3
CO
O
CCH3
O
+ OH2CH3
COH
O
2
Water Acetic Acid
Step 3a: Break down of tetrahedral intermediate and ejection of acetate
leaving group
Step 3b: Acetate anion combining with proton to produce acetic acid
The Side Reaction:
1) Hydrolysis of acetic anhydride can occur and the introduction of water should be
prematurely avoided.
The Experimental Procedure for the Synthesis of Aspirin: 1) Create a hot water bath with a 400–600 mL beaker on a hot plate.
a. Maintain the temperature between 70–80oC and monitor temperature with an
alcohol thermometer.
2) Measure out 4.00 g of salicylic acid on a balance and transfer into a 125 mL Erlenmeyer
flask.
3) Using a 10.0 mL graduated cylinder, measure out 8.0 mL of acetic anhydride and pour
into the flask containing the salicylic acid.
4) Next, place 10 drops of concentrated phosphoric acid into the flask and swirl gently.
5) Clamp the flask onto a ring stand or the metal scaffolding and immerse into the hot water
bath.
a. Do not allow water to get into the flask!
OHO
O O-
O
CH3
CH3
O
Experiment #13 Barnett

104
6) Keep immersed in the hot water bath for 20 minutes and using a glass stirring rod, stir the
solution periodically.
7) After 20 minutes, carefully add 5.0 mL of deionized water to the hot solution to
decompose any excess acetic anhydride if present.
8) After five minutes, remove from the hot water bath and allow to cool on the lab bench.
9) During this cooling step, obtain 50.0 mL of deionized water.
10) In addition, create an ice–water bath with a 400–600 mL beaker.
11) After the flask has cooled for a few minutes, pour the 50.0 mL of water into the flask to
hasten crystallization.
12) Next, clamp the flask into the ice–water bath and swirl occasionally.
13) Allow at least five minutes to pass to permit maximal aspirin crystal formation.
14) Chill approximately 25.0 mL of deionized water in another ice–water bath.
15) While your crystals are forming, obtain a piece of filter paper and pre–weigh the filter
paper on a watch glass.
a. Record this value in your data table.
16) Place the filter paper into a Büchner funnel and set up a vacuum filtration system.
a. See attached diagram.
17) Turn on the vacuum and then wet the filter with a small amount of chilled deionized
water.
18) Slowly transfer the contents of the flask onto the filter paper.
a. The liquid should pass through the filter paper leaving the aspirin behind.
19) After the flask is empty, use the cold 25.0 mL deionized water to rinse out the flask and
place the contents into the Büchner funnel.
20) Once all of the water has passed through the filter and the crystals look reasonably dry,
remove the vacuum and transfer the aspirin and filter paper onto the pre–weighed watch
glass.
21) Allow the aspirin to dry in an oven as directed by your professor.
22) Once the sample is dry, run melting point determination to characterize and assess purity.
The Experimental Procedure for the Purity Assessment of Aspirin: 1) Run a melting point on the aspirin when it is completely dry.
a. Using a capillary tube (with one open and one closed end), invert the open end
into powder sample and press downward.
b. Once the required amount of powder is in the tube, invert and tap the powder
down into the closed end.
c. The column of powder in capillary tube should be 2–3 mm, tightly packed.
2) Place packed capillary tube into the melting–point apparatus and turn on the heating dial.
3) The rate of heating is important; heat no faster than 1.0oC per minute.
a. If the approximate melting point is known, the temperature can be increased more
rapidly at the beginning until the temperature is between 10.0–20.0oC below the
anticipated temperature. At this point, the rate of heating should be slowed.
b. Most melting points, even for pure substances, are reported as a range.
4) The melting point begins when the first drop of liquid is detected. The end point is when
the entire solid sample becomes a liquid.
5) Record the melting point range of aspirin in your data table.
6) Determine the limiting reactant and calculate the theoretical yield and percent yield.
Experiment #13 Barnett
105
Waste Disposal and Lab Clean – Up: 1) Combine all aqueous filtrates, dilute with plenty of water, and flush down the drain with
plenty of water.
2) The aspirin product should be placed into the appropriately labeled waste container.
The Lab Write – Up: 1) Determine the theoretical yield, actual yield, and percent yield, place all values into a
data table, and discuss all relevant data points in your conclusion.
a. Discuss potential places for error that accounted for low percent yield.
b. Percent yield = (Actual Yield/Theoretical Yield) * 100%
2) Determine the melting point of product, the true value melting point, and place into a
data table. In your conclusion, discuss this information and how this relates to the purity
of your product.
a. Calculate the percent error with the following formula: Percent error = [(true
value – experimental value)/true value] * 100%
b. Discuss potential places for error that decreased the purity of the product.
3) How would you account for the smell of vinegar upon opening a bottle of expired
aspirin?
Experiment #13 Barnett
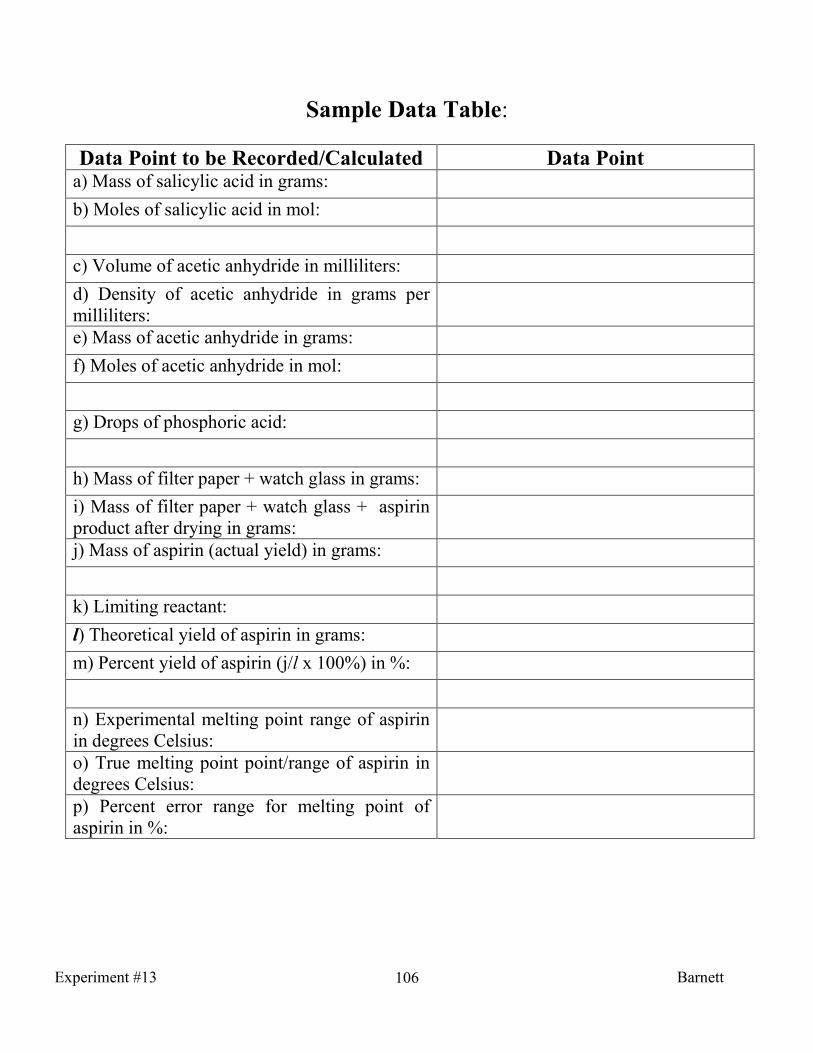
106
Sample Data Table:
Data Point to be Recorded/Calculated Data Point a) Mass of salicylic acid in grams: b) Moles of salicylic acid in mol: c) Volume of acetic anhydride in milliliters: d) Density of acetic anhydride in grams per
milliliters:
e) Mass of acetic anhydride in grams: f) Moles of acetic anhydride in mol: g) Drops of phosphoric acid: h) Mass of filter paper + watch glass in grams: i) Mass of filter paper + watch glass + aspirin
product after drying in grams:
j) Mass of aspirin (actual yield) in grams: k) Limiting reactant: l) Theoretical yield of aspirin in grams: m) Percent yield of aspirin (j/l x 100%) in %: n) Experimental melting point range of aspirin
in degrees Celsius:
o) True melting point point/range of aspirin in
degrees Celsius:
p) Percent error range for melting point of
aspirin in %:
Experiment #13 Barnett
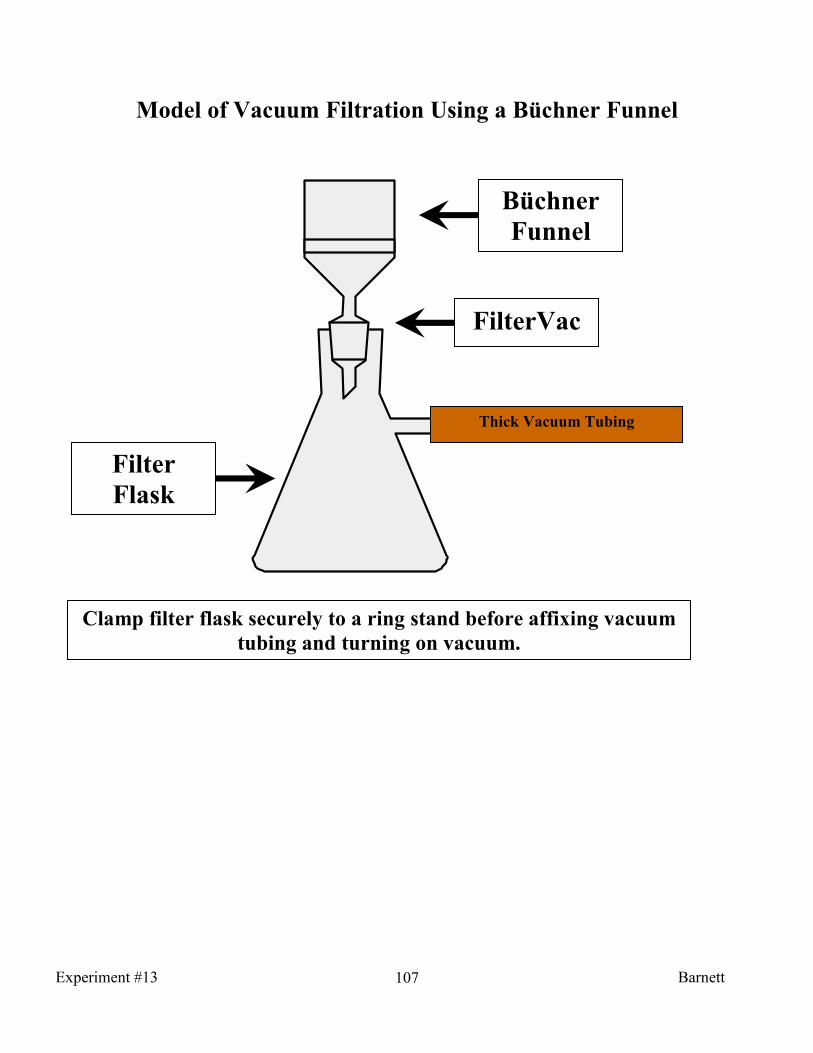
107
Clamp filter flask securely to a ring stand before affixing vacuum
tubing and turning on vacuum.
Model of Vacuum Filtration Using a Büchner Funnel
Büchner
Funnel
Filter
Flask
Thick Vacuum Tubing
FilterVac
Experiment #13 Barnett