VADILAL INDUSTRIES - vadilalgroup.com · Vadilal Industries will not be in any way ... have also...
30
Transcript of VADILAL INDUSTRIES - vadilalgroup.com · Vadilal Industries will not be in any way ... have also...
VADILAL
INDUSTRIES
Q2 & H1FY18
Results Presentation
Disclaimer
Certain statements in this document may be forward-looking statements. Such forward-looking statements are subject to certain risks and uncertainties, like regulatory changes, local political or economic developments, and many other factors that could cause our actual results to differ materially from those contemplated by the relevant forward-looking statements. Vadilal Industries will not be in any way responsible for any action taken based on such statements and undertakes no obligation to publicly update these forward looking statements to reflect subsequent events or circumstances.
2

1
2
3
4
Table of Contents
3
Q2 & H1 FY18
Financial
Performance
Financial
Performance
Trends
Vadilal
Industries
Overview
Outlook

Q2 & H1 FY18 Financial Performance

Chairman’s Message
5
“In H1FY18, we have reported 14% revenue growth*, which we believe is encouraging in the backdrop of changes in the operating environment. Domestic business revenues are up about 5% as GST implementation created some short-term impact on consumption patterns. We had to absorb some immediate costs as the 18% GST rate exceeded previously applicable VAT rates in some states. In addition, margins were impacted as cost of inputs remained high for the past few months. Our international business, that reaches several million customers from the global Indian diaspora, expanded revenues by 131% during H1 – with strong contribution from robust ice cream demand in the US – and now contributes 13.0% of overall revenues compared to 6.5% last year.
We continue to expand our distribution in India by increasing the proliferation of deep freezers in existing/new regions. We are also aggressively expanding our brand presence across the US and some other global geographies to cater to rising demand for our wide range of high quality ice creams and processed foods. We have also expanded our marketing and distribution infrastructure in the US, an investment that should deliver long-term benefits to the business in term of volumes, realizations and margins.
We have brought more cost discipline in our operations and all indirect expenses in India have remained largely stable during H1. We are focused on increasing process orientation within the business and are making cross-functional initiatives such as implementation of SAP in the distribution framework and the recent appointments of Deloitte and KPMG as statutory and internal auditors respectively. Leverage is expected to stay stable, however finance costs will go down due to improved credit ratings and induction of cheaper debt.
Currently, we see the consumption environment stabilizing, milk prices have also been more benign, which will help us as we initiate procurement for the next season. We continue to invest in upgrading manufacturing capabilities with focus on quality and efficiency parameters. We are confident on building a strong business supported by a renowned brand which is well-accepted by consumers both in India and targeted overseas markets.”
*consolidated revenues, net of excise duties
Commenting on Q2 & H1 FY18 performance, Mr. Rajesh Gandhi, Chairman and
Managing Director, Vadilal Industries Limited (VIL) said:

Financials – Q2 & H1 FY18 Performance
6
111.9 111.8
313.8 354.6
Q2 FY17 Q2 FY18 H1 FY17 H1 FY18
Revenue
Consolidated financials in Rs. Crore
In H1, VIL showed 13% y-o-y growth (14% net of excise duties) driven by 131% y-o-y higher revenues in exports business
International business has seen robust demand as we continue to expand distribution and products focused on Indian diaspora in the US and other geographies
101.0 85.4
293.5 307.6
Q2 FY17 Q2 FY18 H1 FY17 H1 FY18
Domestic
10.9
26.4
20.3
47.0
Q2 FY17 Q2 FY18 H1 FY17 H1 FY18
International
International segment includes Vadilal Industries (USA) Inc and Vadilal Cold Storage ( Partnership Firm).

Financials – Q2 & H1 FY18 Performance
7
EBITDA margin was impacted by absorption of GST-related increase in product costs in some states and elevated raw material costs. Further, expansion initiatives in India and US/other global markets have been accelerated.
Continue to focus on debt rationalization:
o Focus on reconstituting outstanding debt to expand long tenure loans and reducing cost of debt
o Overall debt as on Sep 30th 2017 was at Rs. 101 crore as compared to Rs. 97 crore as on Sep 30th 2016
o Finance costs in H1FY18 lower by 4% y-o-y at Rs. 7.2 crore versus Rs. 7.5 crore in H1FY17
PAT stood at Rs.24.2 crore, lower by 15%, based on near-term operating impact and higher growth investments made by the company.
14.2 6.0
58.0 52.4
Q2 FY17 Q2 FY18 H1 FY17 H1 FY18
EBITDA
5.0
-0.5
28.6 24.2
Q2 FY17 Q2 FY18 H1 FY17 H1 FY18
PAT
(0.5)
Consolidated financials in Rs. Crore
Note – Revenues considered, net of excise duties

Financials Performance Trends – Balance Sheet
8
Liabilitie
s A
ssets
145.8
184.7
Mar 17 Sep 17
Networth
151.5
101.2
Mar 17 Sep 17
Debt
21.6
29.3
Mar 17 Sep 17
Other Non-Current Liabilities
231.4
256.8
Mar 17 Sep 17
Net Fixed Assets
11.9 9.8
Mar 17 Sep 17
Other Non-Current Assets 75.6
48.6
Mar 17 Sep 17
Net Current Assets
Consolidated financials in Rs. Crore

Financials Performance Trends

Financials Performance Trends
10
323.6 367.3
406.3 461.7 491.7
FY13 FY14 FY15 FY16 FY17
Revenue (Rs. cr)
288.7 318.7 361.8
425.5 450.0
FY13 FY14 FY15 FY16 FY17
Domestic
34.9
48.6 44.5
36.2 41.7
FY13 FY14 FY15 FY16 FY17
International
Consolidated financials in Rs. Crore

Financials Performance Trends
11
Longer term, consumer behavior is transitioning with increasing acceptance for western desserts.
o Domestic business growth temporarily impacted by recent changes in operating environment and consumption spending
o Continued focus on developing domestic business and lower input costs expected to drive growth
Will continue to invest in production capacity, technology, brand and distribution.
As volumes enhance, existing capacity gets utilized more efficiently and margins, which were depressed in the past, are improving.
44.1 41.7 45.8
59.4 58.8
FY13 FY14 FY15 FY16 FY17
EBITDA
5.0
2.3 2.4
14.8
18.7
FY13 FY14 FY15 FY16 FY17
PAT
Consolidated financials in Rs. Crore

Financials Performance Trends – Balance Sheet
12
Liabilitie
s A
ssets
113.1 113.5 127.1
145.8
FY14 FY15 FY16 FY17
Networth
205.0 180.2
148.3 151.5
FY14 FY15 FY16 FY17
Debt
15.2 16.5 20.6 21.6
FY14 FY15 FY16 FY17
Other Non-Current Liabilities
232.3
226.1 225.1
231.4
FY14 FY15 FY16 FY17
Net Fixed Assets
14.8 15.1 14.3 11.9
FY14 FY15 FY16 FY17
Other Non-Current Assets 86.2
69.0 56.6
75.6
FY14 FY15 FY16 FY17
Net Current Assets
Consolidated financials in Rs. Crore
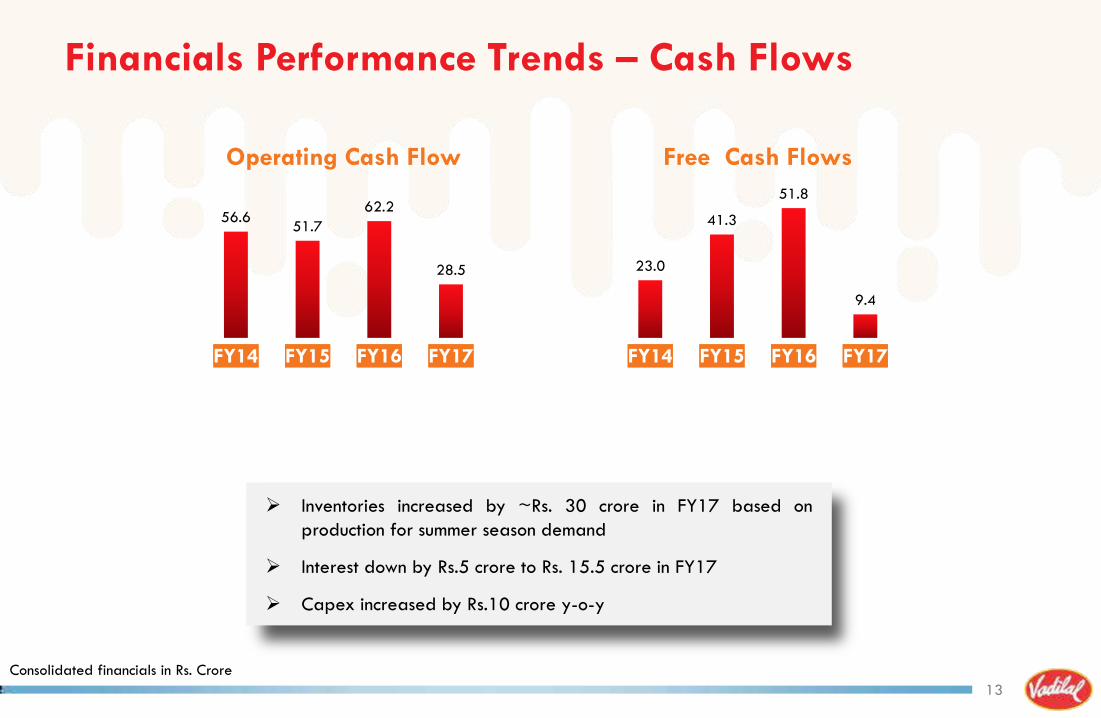
Financials Performance Trends – Cash Flows
13
56.6 51.7
62.2
28.5
FY14 FY15 FY16 FY17
Operating Cash Flow
23.0
41.3
51.8
9.4
FY14 FY15 FY16 FY17
Free Cash Flows
Inventories increased by ~Rs. 30 crore in FY17 based on production for summer season demand
Interest down by Rs.5 crore to Rs. 15.5 crore in FY17
Capex increased by Rs.10 crore y-o-y
Consolidated financials in Rs. Crore

Vadilal Industries Overview

Overview
15
Currently managed by fourth generation promoter family
Selected India‟s most trusted ice cream brand in 2013 and 2014 by the Brand Trust Report
111-year old, established ice cream
brand
Top 3 ice-cream brand in the country, 150+ flavors
300 SKU‟s of cones, candies, bars, ice lollies, cups, family packs, economy packs
Largest range of ice creams
of any company in
India
Leadership in key markets – Gujarat, Rajasthan, UP, Uttarakhand, Haryana and Chandigarh
Second largest ice
cream manufacturer
in India by volume
16 states, 61 CNF‟s, over 1200 distributors, 290 distribution vehicles, 45,000 +retail outlets
Strong distribution network in North, West
and East India
Products reach 45 countries across four continents – key markets include US, Canada, UK, Middle East, Australia and New Zealand
Exporting processed food products, ice-creams and frozen desserts
Expanding global
business presence

Vadilal: Growth Strategies
16
Geographical Expansion
Expanding footprint in North and East regions of India
New production facility expected in East India
Expanding distribution footprint in tier 3/4 cities and rural markets
Brand Building Initiatives
Seen as one of the most trusted ice cream and leading processed foods brand in India
Undertaken campaigns to strengthen social media presence
Rural marketing initiatives
Retail Investments
10,000 new sales outlets planned in FY18
100 more distributors expected to be added in FY18
Investments in new technologies
Constantly innovating to roll out new products in domestic and global markets
Targeting expansion of market share in premium/super-premium segment
New Product Development
Global Expansion
Leveraging frozen foods channels to expand ice cream exports globally
Strong distribution to Indian diaspora who have displayed affinity for the brand and differentiated products offerings

Ice Creams - Brands Portfolio
17
Largest range of ice creams of any company in India
300 SKU‟s of cones, candies, bars, ice lollies, cups, family packs, economy packs
Constantly innovating to roll out new products in ice cream segment
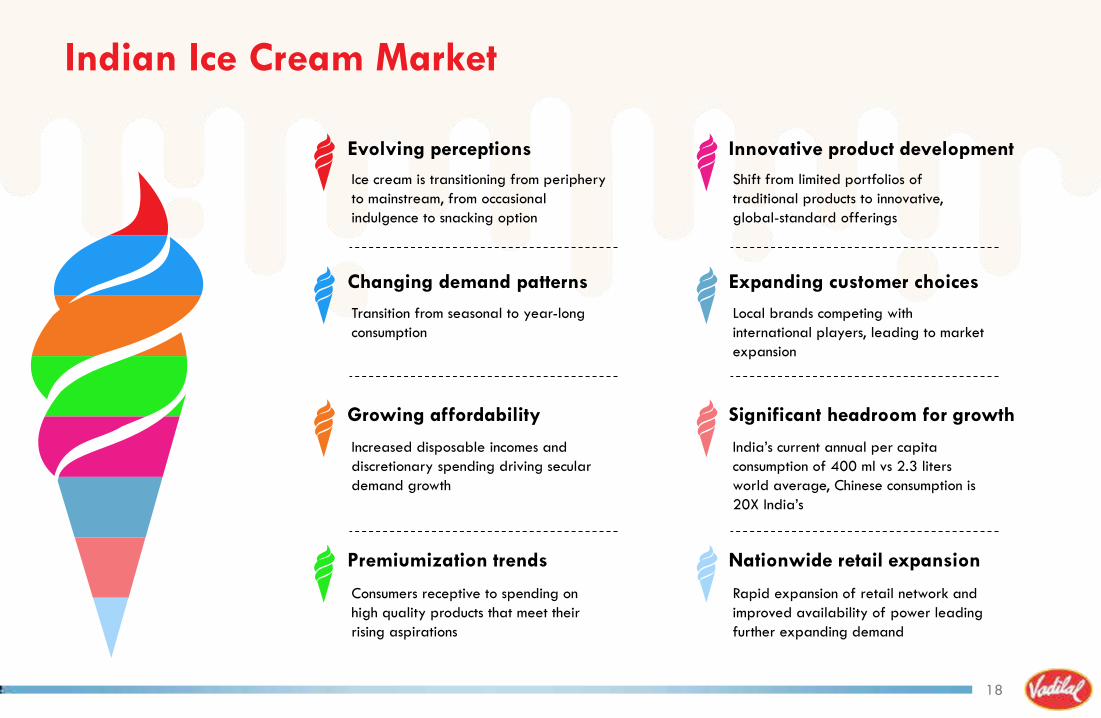
Indian Ice Cream Market
18
Evolving perceptions
Changing demand patterns
Growing affordability
Premiumization trends
Innovative product development
Expanding customer choices
Significant headroom for growth
Nationwide retail expansion
Rapid expansion of retail network and improved availability of power leading further expanding demand
Consumers receptive to spending on high quality products that meet their rising aspirations
India‟s current annual per capita consumption of 400 ml vs 2.3 liters world average, Chinese consumption is 20X India‟s
Increased disposable incomes and discretionary spending driving secular demand growth
Local brands competing with international players, leading to market expansion
Transition from seasonal to year-long consumption
Shift from limited portfolios of traditional products to innovative, global-standard offerings
Ice cream is transitioning from periphery to mainstream, from occasional indulgence to snacking option
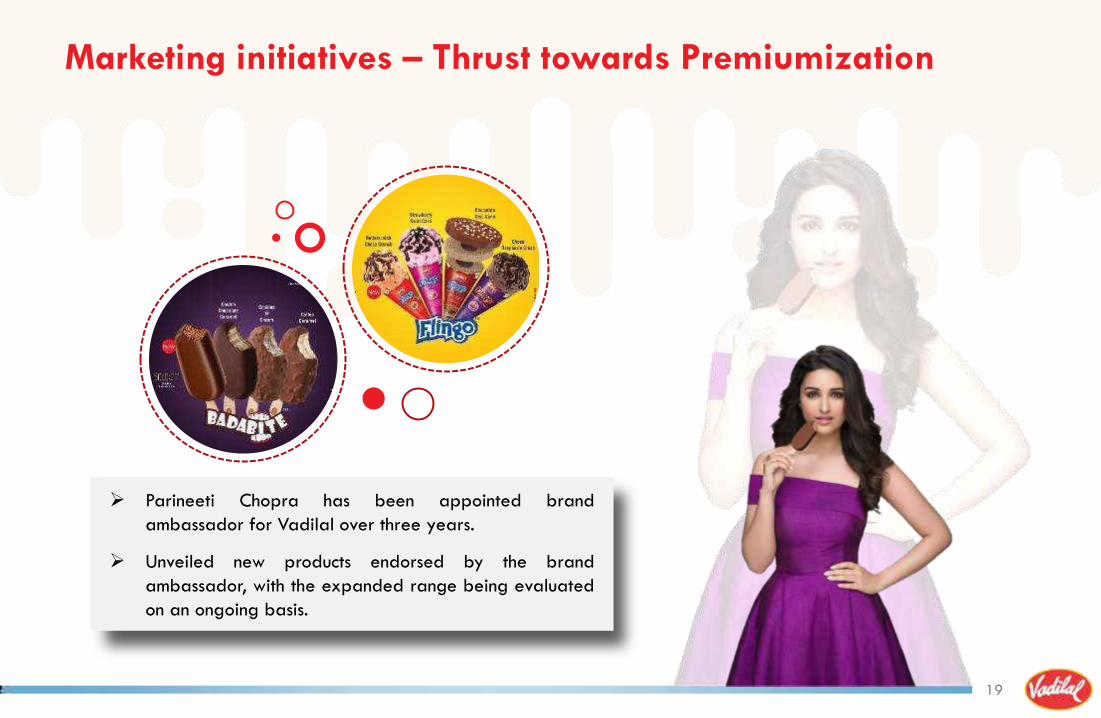
Marketing initiatives – Thrust towards Premiumization
19
Parineeti Chopra has been appointed brand ambassador for Vadilal over three years.
Unveiled new products endorsed by the brand ambassador, with the expanded range being evaluated on an ongoing basis.

Growing International Presence
20
Exporting ice-creams, frozen desserts and processed food products
Key markets – US, Canada, UK, Kuwait, Qatar, Bahrain, UAE, Singapore, Australia, New Zealand
Focused on Indian diaspora globally and adhering to international food standards
Two decades of experience selling frozen foods globally being leveraged to expand ice cream exports

Robust Expansion in U.S. market
21
Latent demand for quality Indian products driving strong volume growth in US ice cream sales
35-member team reaching 40 plus US states and ~70% of local Indian diaspora
Deriving significant benefit from the existing processed foods distribution network in the US
Expanding product base within existing categories, launching new categories such as Indian Mithai and Paneer
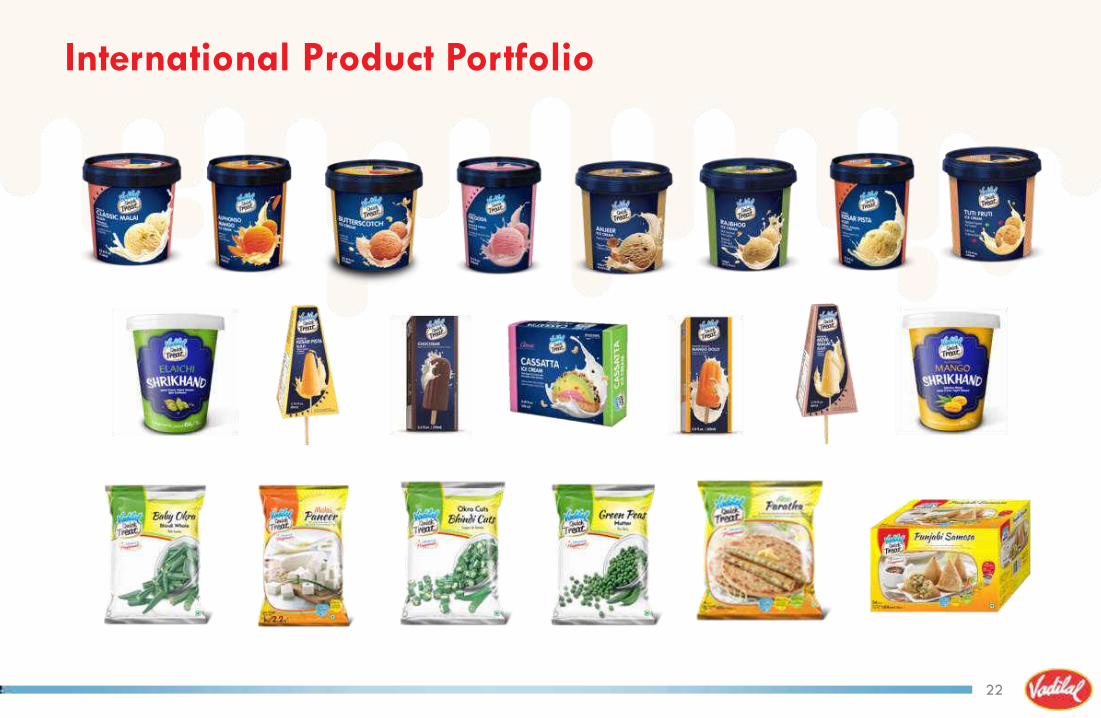
International Product Portfolio
22
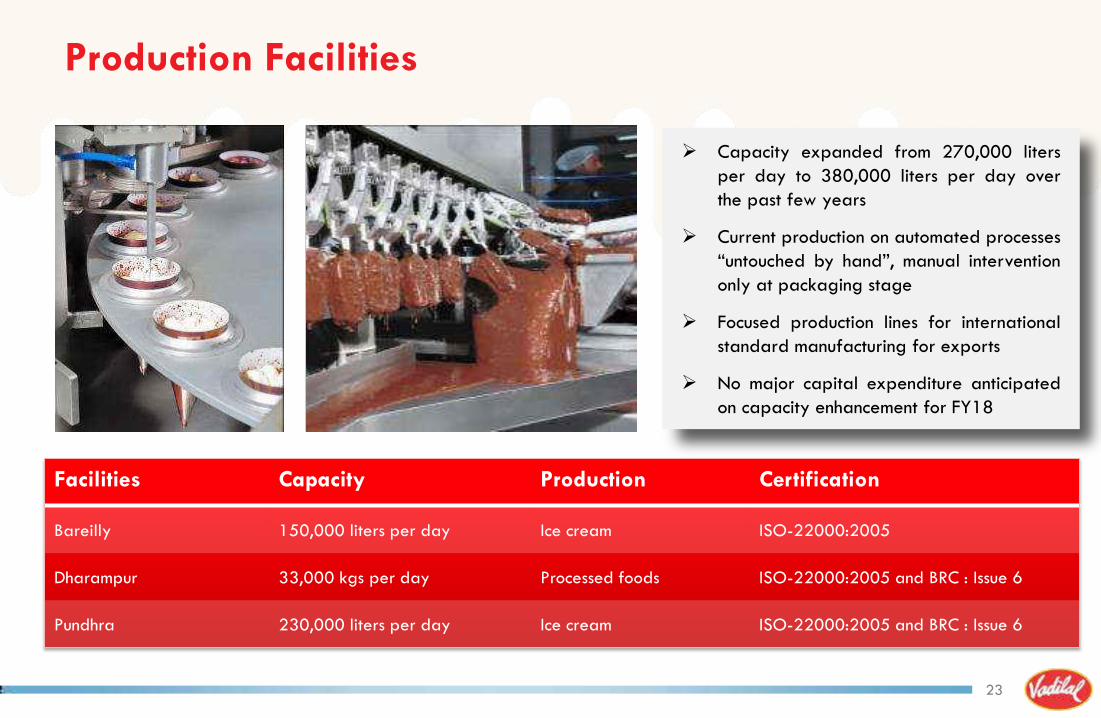
Production Facilities
23
Facilities Capacity Production Certification
Bareilly 150,000 liters per day Ice cream ISO-22000:2005
Dharampur 33,000 kgs per day Processed foods ISO-22000:2005 and BRC : Issue 6
Pundhra 230,000 liters per day Ice cream ISO-22000:2005 and BRC : Issue 6
Capacity expanded from 270,000 liters per day to 380,000 liters per day over the past few years
Current production on automated processes “untouched by hand”, manual intervention only at packaging stage
Focused production lines for international standard manufacturing for exports
No major capital expenditure anticipated on capacity enhancement for FY18

Deep Domestic Distribution Presence
24
Production Facilities
Bareilly
Pundhra
Dharampur
States Distributor
1 Gujarat 200
2 Uttar Pradesh 185
3 Madhya Pradesh 150
4 Rajasthan 138
5 West Bengal 89
6 Delhi 63
7 Bihar 58
8 Himachal Pradesh 58
9 Punjab 51
10 Uttarakhand 48
11 Haryana 44
12 Jharkhand 41
13 Orissa 37
14 Chandigarh 36
15 Chhattisgarh 18
Distribution network comprises of over 45,000 retailers, over 1,200 large distributors, 61 CNFs, 250 distribution vehicles and almost 300 SKUs.
Adopted franchisee route to further increase market penetration and established 85 ice cream parlors under „HAPPINEZZ‟ brand name
Access to the largest fleet of refrigerated vehicles in India, backed by an expanding distribution network
15 1
4
13
3
2
7
12 5
6
14
8
10 11
9
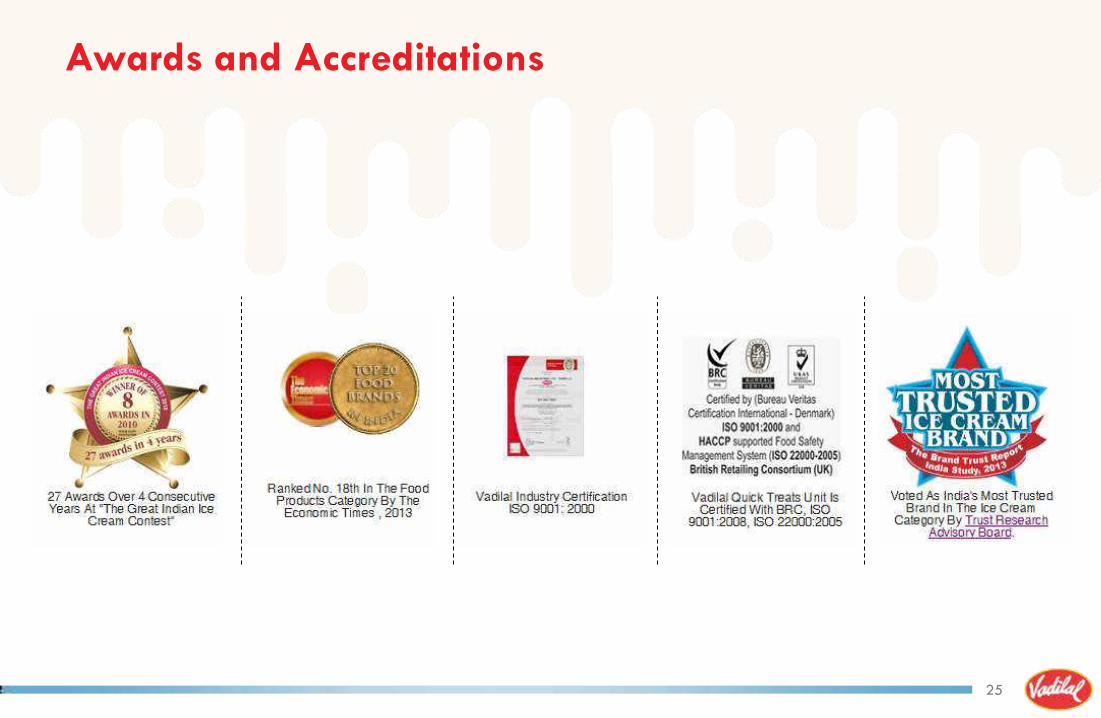
Awards and Accreditations
25

Outlook

Planned Initiatives
27
Focus on higher value products and
more sales contribution from
individualized packs
Deep penetration in US market, targeting
expanded presence in other
geographies that are home to large Indian populations
Accelerating new product
development both for domestic and
international markets and improving production processes
Aggressive expansion of sales
generating assets/cold supply
chain – annual planned addition of
~5,000 deep freezers
Leveraging surplus generated by operations to rationalize/
restructure debt and improve working
capital management
Augmenting distribution
management system that will allow
micro-control over ROI from each
business area and point of sale unit
Contact Us
28
Kalpit Gandhi
Vadilal Industries Ltd
Tel: +91 79 3015 3126
Email: [email protected]
Shiv Muttoo / Karl Kolah
CDR India
Tel: +91 22 6645 1207 / 1220
Email: [email protected]

Thank You