VA Power Point2 - Virginia Department of Education · 7/2/12 1 RtI%Process%&%Evaluaon%...
18
7/2/12 1 RtI Process & Evalua5on Virginia Beach, VA 7/13/2012 7/14/2012 St. Croix River Education District • St. Croix River Education District has six member districts. • Total population is approximately 11,500 students. • Overall special education rate ranges from 7-11%. • Number of students qualifying for F&RL varies from 18-55%. • SCRED was the first district to pilot Curriculum Based Measures (CBM) in 1979 when they were being field-tested. • Long history of over 30 years of data-based decision making. MC
Transcript of VA Power Point2 - Virginia Department of Education · 7/2/12 1 RtI%Process%&%Evaluaon%...

7/2/12
1
RtI Process & Evalua5on
Virginia Beach, VA 7/13/2012 -‐ 7/14/2012
St. Croix River Education
District
• St. Croix River Education District has six member districts.
• Total population is approximately 11,500 students.
• Overall special education rate ranges from 7-11%.
• Number of students qualifying for F&RL varies from 18-55%.
• SCRED was the first district to pilot Curriculum Based Measures (CBM) in 1979 when they were being field-tested.
• Long history of over 30 years of data-based decision making.
MC
7/2/12
2
5.29.08 3
0!
20!
40!
60!
80!
100!
120!
140!
160!
1W!1S! 2F!2W!2S! 3F!3W!3S! 4F!4W!4S! 5F!5W!5S! 6F!6W!6S! 7F!7W!7S! 8F!8W!8S!
10th
%ile
sco
re!
Grade and Period!
All-SCRED - Historical 10th percentile scores (ORF)!
2010-11!
2009-10!
2008-09!
2007-08!
2006-07!
2005-06!
2004-05!
2003-04!
2002-03!
2001-02!
2000-01!
1999-00!
1998-99!
1997-98!
1996-97!
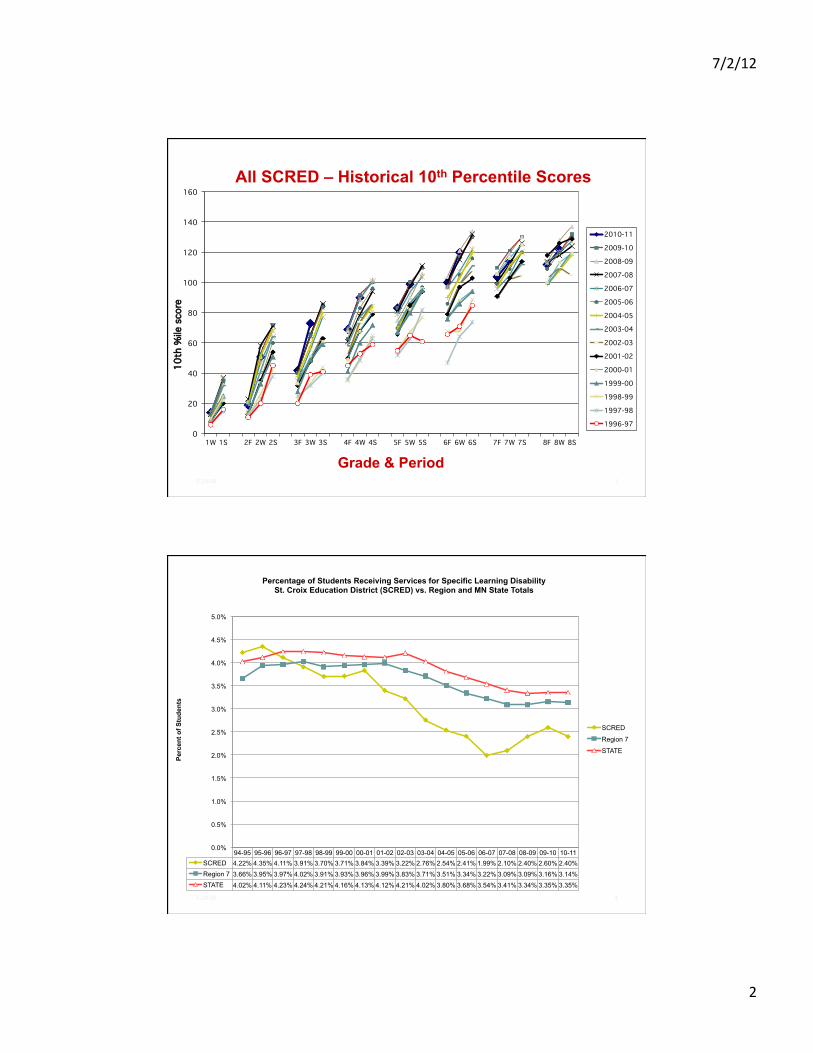
All SCRED – Historical 10th Percentile Scores
Grade & Period
5.29.08 4
94-95 95-96 96-97 97-98 98-99 99-00 00-01 01-02 02-03 03-04 04-05 05-06 06-07 07-08 08-09 09-10 10-11 SCRED 4.22% 4.35% 4.11% 3.91% 3.70% 3.71% 3.84% 3.39% 3.22% 2.76% 2.54% 2.41% 1.99% 2.10% 2.40% 2.60% 2.40% Region 7 3.66% 3.95% 3.97% 4.02% 3.91% 3.93% 3.96% 3.99% 3.83% 3.71% 3.51% 3.34% 3.22% 3.09% 3.09% 3.16% 3.14% STATE 4.02% 4.11% 4.23% 4.24% 4.21% 4.16% 4.13% 4.12% 4.21% 4.02% 3.80% 3.68% 3.54% 3.41% 3.34% 3.35% 3.35%
0.0%
0.5%
1.0%
1.5%
2.0%
2.5%
3.0%
3.5%
4.0%
4.5%
5.0%
Perc
ent o
f Stu
dent
s
Percentage of Students Receiving Services for Specific Learning Disability St. Croix Education District (SCRED) vs. Region and MN State Totals
SCRED
Region 7
STATE

7/2/12
3
Process and Assessment
1. Where are we?
2. Where do we want to go?
3. How are we going to get there?
Types of Assessments
1) Outcome measures
2) RtI Implementa5on Survey
3) Grade Level Teams
4) Problem Solving Team Monitoring
5) Individual Case Reviews

7/2/12
4
Outcomes • CBM (3-‐4x/year)
• NWEA MAP (2x/year)
• MCA (1x/year)

7/2/12
5
Ques1ons:
How did they do overall? Did they make progress over the course of the year? What were some of the high points? Where would you set priori5es? Why might these results look the way they do?
RtI Implementa1on Status Checklist
• Conducted yearly • Six sec5ons
• Many similar products available
• Web-‐based survey so[ware • Advantages/Disadvantages

7/2/12
6
Please refer to handout.
Ques1ons:
How are they doing overall? What were some of the high points? How does this relate to outcomes? Where would you set priori5es for improvement?

7/2/12
7
Sec5on Averages:
Target School Comparison Parental Involvement: 3.03 4.51 School Culture & Climate 3.38 5.12 Curriculum & Instruc5on 3.84 5.24 Measurement & Assessment 4.02 5.33 Collabora5ve Teams 3.31 5.19 Problem Solving Team 3.55 5.05
Grade Level Teams
ARE ESSENTIAL!
(It seems so obvious, NOW!)

7/2/12
8
Grade Level Team Facilitator Role
• Aaend all trainings and video conferences
-‐ Accessing and naviga5ng within the online data warehouse (TIES), PM system (AIMSweb), and interven5on documenta5on so[ware (GenEd Forms). -‐ Genera5ng grade-‐level student data reports and individual student graphs. -‐ Interpre5ng results -‐ “Next steps” and/or interven5ons based on data -‐ Other • Facilitate grade-‐level team mee5ngs -‐ Prepare materials for monthly team mee5ngs (either a Benchmark or Progress Monitor Mee2ng) -‐ Facilitate mee5ng using provided agendas. -‐ Ensure that all databases are current for students receiving interven5ons. -‐ Send mee5ngs notes to GLTF trainer.
Assessment of Grade Level Teams
• Indirect measures
o Summary of Effec5ve (SOE) o Documenta5on of interven5ons within database o Mee5ng Notes o Interven5on Implementa5on Fidelity Checklists
• Direct measures
o floridar5.usf.edu/resources/format/pdf/obs_checklist.pdf o Windram, Holly, Kerry Bollman, and Sara Johnson. How RTI Works in Secondary Schools: Building a Framework for Success. Bloomington, IN: Solu2on Tree, 2012. Print.
• Agendas & Mee5ng Documenta5on Examples
o hap://www.scred.k12.mn.us/School/Index.cfm/go:site.Page/Page:196/index.html

7/2/12
9

7/2/12
10
Ques1ons:
Overall, how did they do? Did they make progress over the course of the year? What were some of the high points? Low points? Why might these results look the way they do? If this was your outgoing class, what things would you consider doing differently? If this was your incoming class, how would you address their needs?
Typical process: 1. All students below benchmarks are progress monitored.
2. Teams first review individual student data no later than October.
• The student will be moved to a different interven5on group. • The interven5on will be changed for the en5re group. • The student is exited from the interven5on group. • The student will be referred to the problem solving team.
3. Progress monitoring data is reviewed on a monthly basis.

7/2/12
11
Background
1. Five-‐day training offered yearly
2. Five-‐step problem solving process a) Problem Iden5fica5on b) Problem Analysis c) Plan Development d) Plan Implementa5on e) Plan Evalua5on 3. Documenta5on of the problem-‐solving process is required. 4. Teams typically meet on a weekly basis for 30-‐40 minutes.
“Typical Mee1ng” • The team facilitator distributes the agenda – great agendas will include: a. the student name and grade, b. iden5fied area of concern, c. hypothesis statement d. step in the problem-‐solving process to be completed that day, and e. current interven5on, when applicable. • Team politely waits for the remaining members. (Offerings of pastry and candy are greatly appreciated at this 5me.)
7/2/12
12
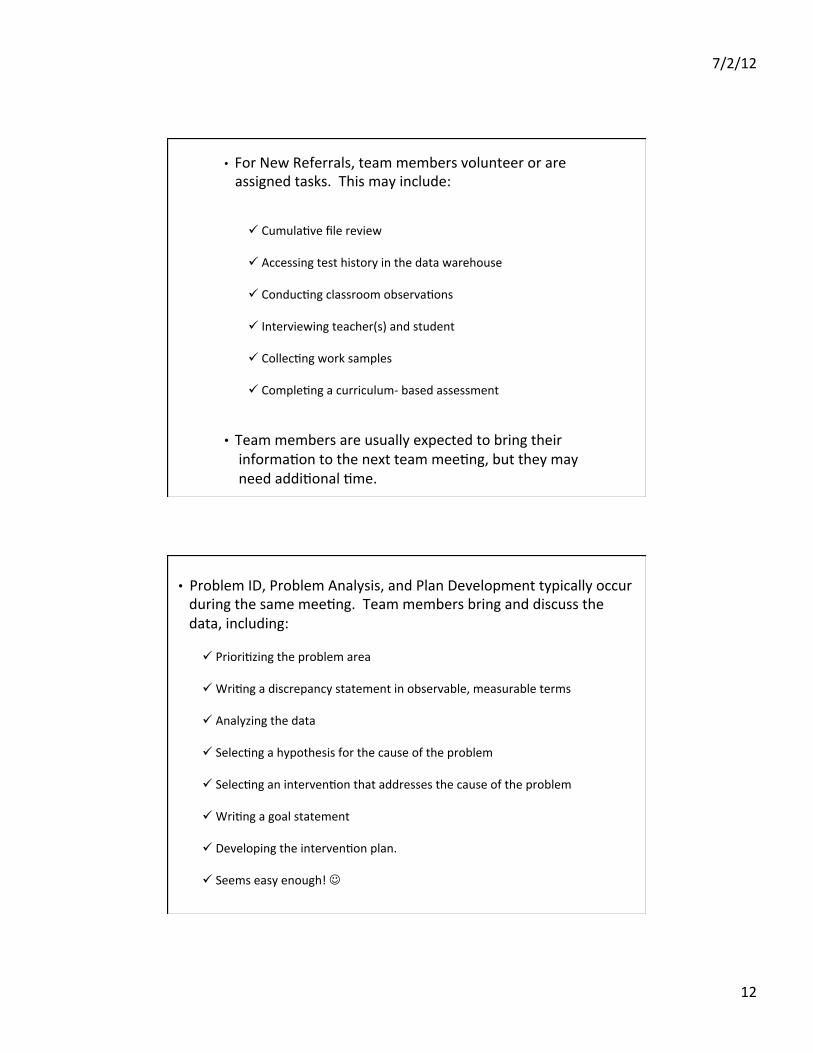
• For New Referrals, team members volunteer or are assigned tasks. This may include:
ü Cumula5ve file review
ü Accessing test history in the data warehouse
ü Conduc5ng classroom observa5ons
ü Interviewing teacher(s) and student
ü Collec5ng work samples
ü Comple5ng a curriculum-‐ based assessment
• Team members are usually expected to bring their informa5on to the next team mee5ng, but they may need addi5onal 5me.
• Problem ID, Problem Analysis, and Plan Development typically occur during the same mee5ng. Team members bring and discuss the data, including:
ü Priori5zing the problem area
ü Wri5ng a discrepancy statement in observable, measurable terms
ü Analyzing the data
ü Selec5ng a hypothesis for the cause of the problem
ü Selec5ng an interven5on that addresses the cause of the problem
ü Wri5ng a goal statement
ü Developing the interven5on plan. ü Seems easy enough! J
7/2/12
13
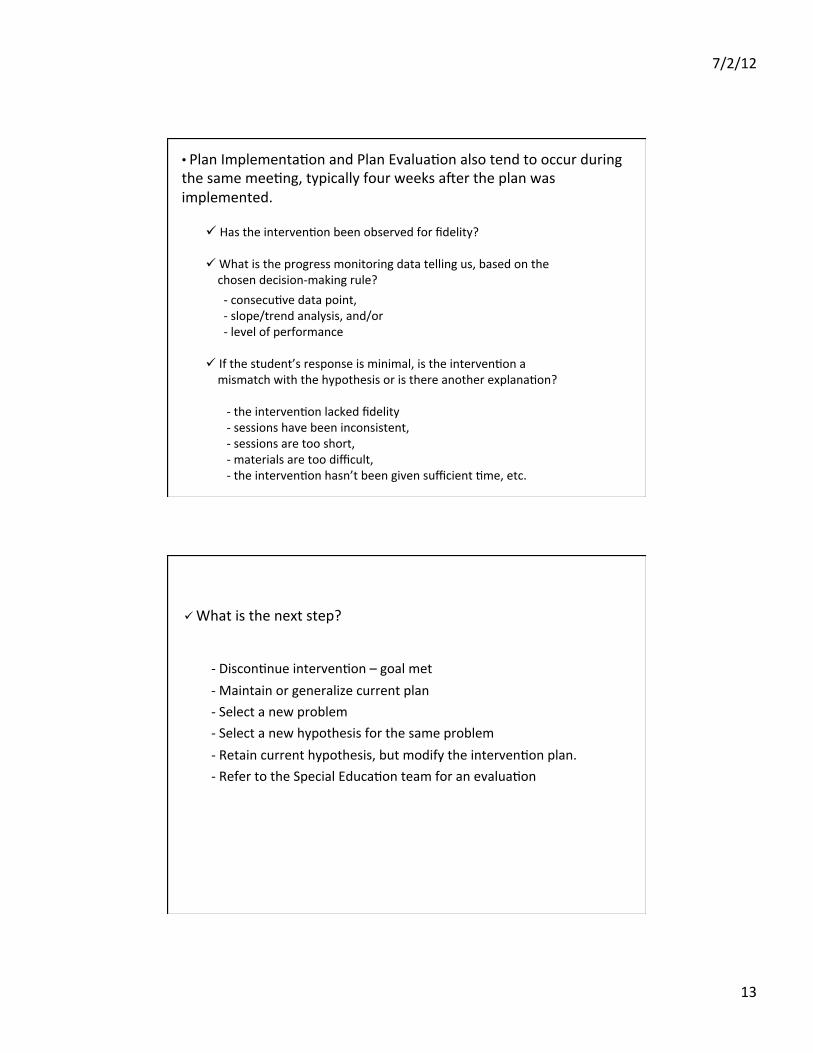
• Plan Implementa5on and Plan Evalua5on also tend to occur during the same mee5ng, typically four weeks a[er the plan was implemented.
ü Has the interven5on been observed for fidelity? ü What is the progress monitoring data telling us, based on the chosen decision-‐making rule? -‐ consecu5ve data point, -‐ slope/trend analysis, and/or -‐ level of performance ü If the student’s response is minimal, is the interven5on a mismatch with the hypothesis or is there another explana5on? -‐ the interven5on lacked fidelity -‐ sessions have been inconsistent, -‐ sessions are too short, -‐ materials are too difficult, -‐ the interven5on hasn’t been given sufficient 5me, etc.
ü What is the next step?
-‐ Discon5nue interven5on – goal met -‐ Maintain or generalize current plan -‐ Select a new problem -‐ Select a new hypothesis for the same problem -‐ Retain current hypothesis, but modify the interven5on plan. -‐ Refer to the Special Educa5on team for an evalua5on
7/2/12
14
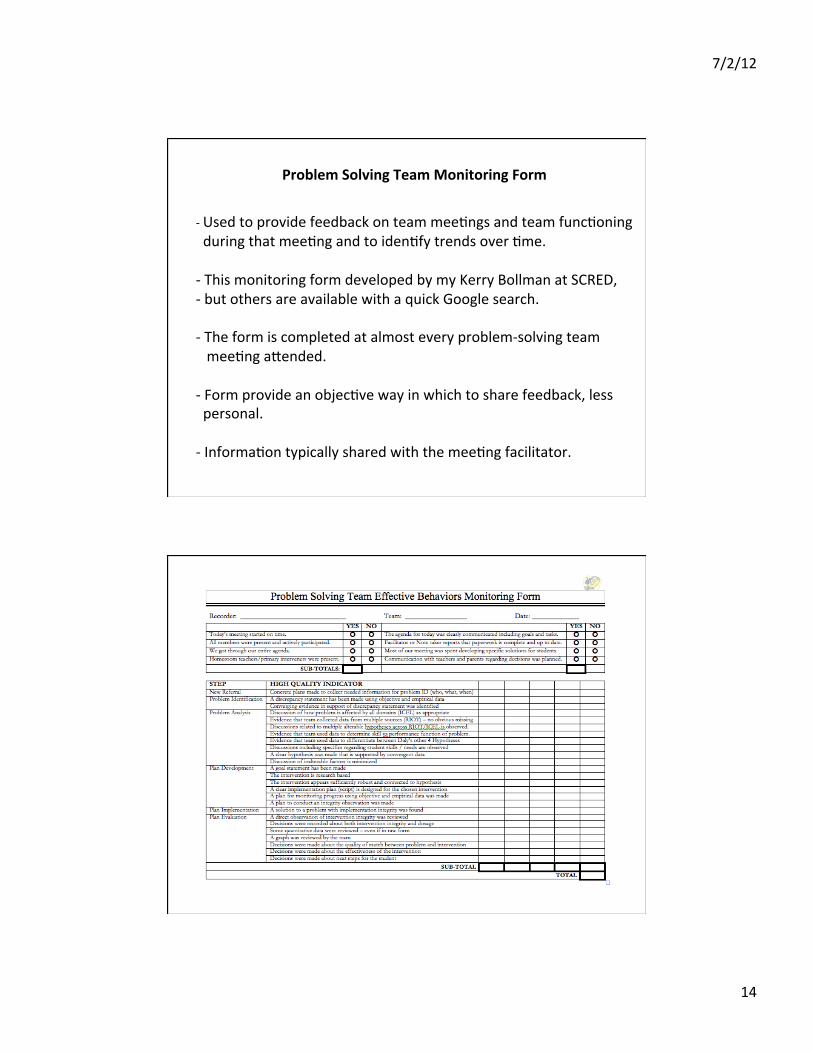
Problem Solving Team Monitoring Form -‐ Used to provide feedback on team mee5ngs and team func5oning during that mee5ng and to iden5fy trends over 5me.
-‐ This monitoring form developed by my Kerry Bollman at SCRED, -‐ but others are available with a quick Google search. -‐ The form is completed at almost every problem-‐solving team mee5ng aaended. -‐ Form provide an objec5ve way in which to share feedback, less personal. -‐ Informa5on typically shared with the mee5ng facilitator.
7/2/12
15
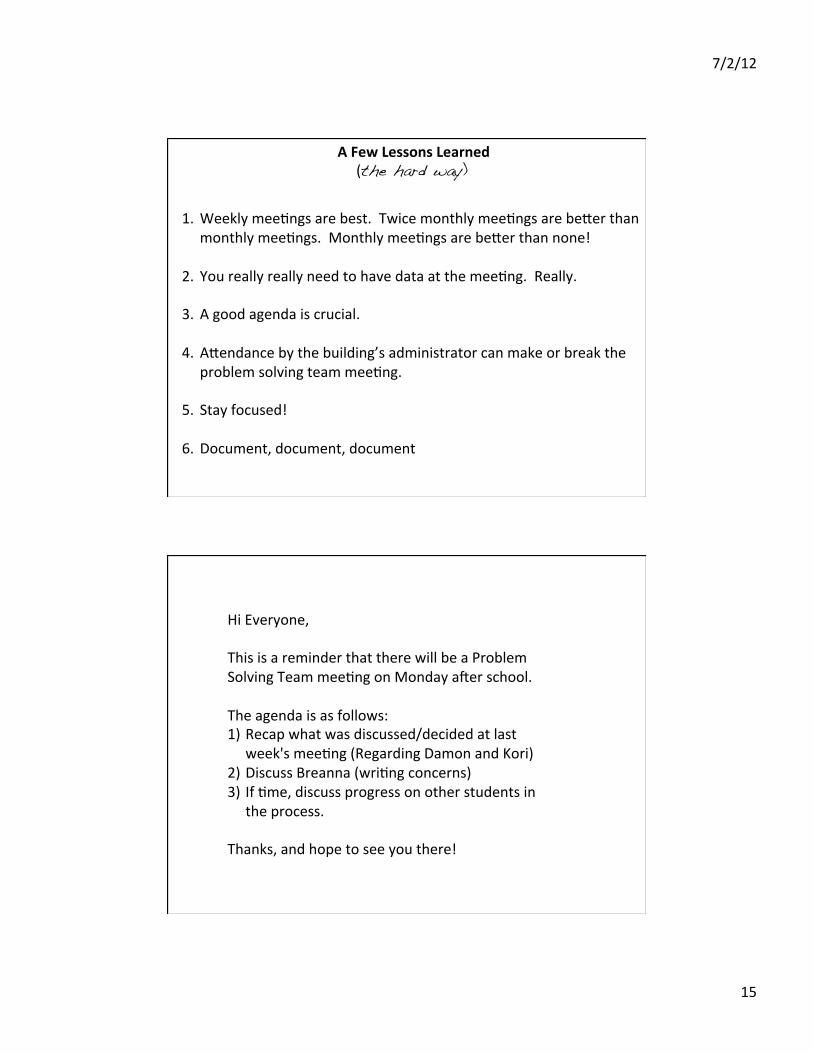
A Few Lessons Learned (the hard way)
1. Weekly mee5ngs are best. Twice monthly mee5ngs are beaer than
monthly mee5ngs. Monthly mee5ngs are beaer than none! 2. You really really need to have data at the mee5ng. Really. 3. A good agenda is crucial. 4. Aaendance by the building’s administrator can make or break the
problem solving team mee5ng.
5. Stay focused!
6. Document, document, document
Hi Everyone, This is a reminder that there will be a Problem Solving Team mee5ng on Monday a[er school. The agenda is as follows: 1) Recap what was discussed/decided at last
week's mee5ng (Regarding Damon and Kori) 2) Discuss Breanna (wri5ng concerns) 3) If 5me, discuss progress on other students in
the process.
Thanks, and hope to see you there!

7/2/12
16
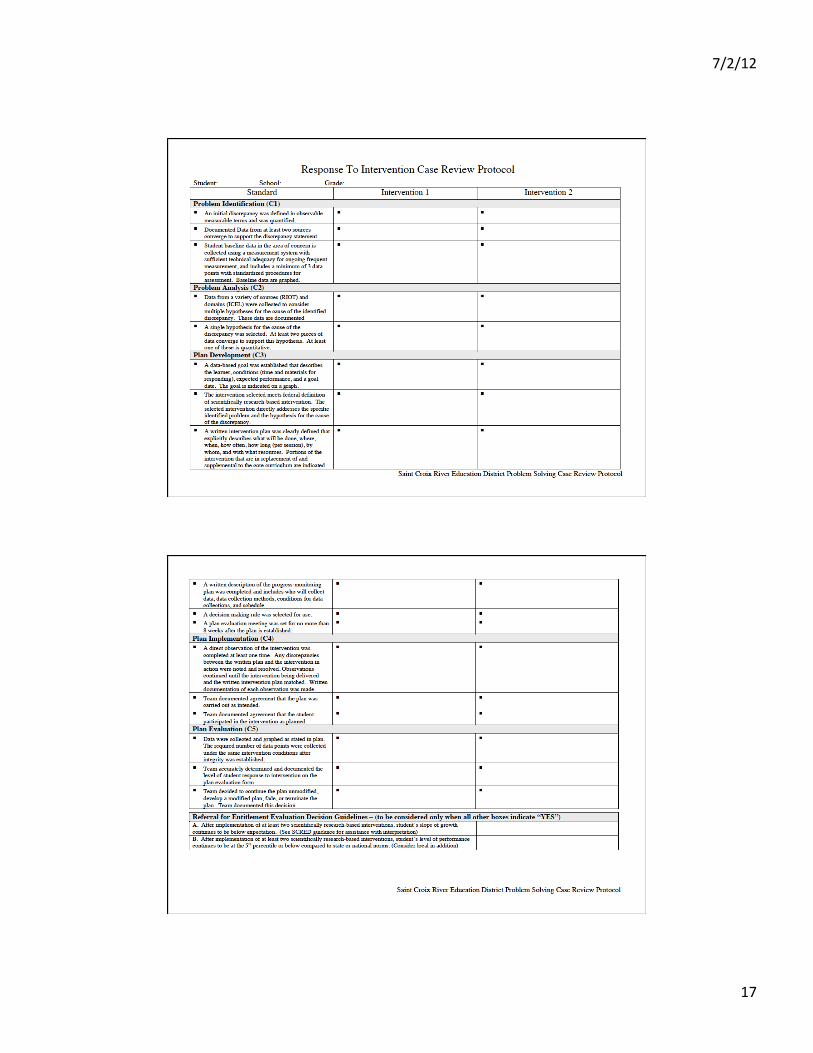
Case Review Protocol -‐ Fidelity to the problem-‐solving process is important to a successful RtI ini5a5ve.
-‐ The Case Review Protocol is used to document that the -‐ en5re problem-‐solving process has been followed.
-‐ Used to review the Grade Level Teams’ and Problem Solving Teams’ decision-‐making processes and problem-‐solving documenta5on completed for students referred for a special educa5on evalua5on in the area of SLD.
7/2/12
17