VA Barometer 2010/11 in English
15
2010/11
-
Upload
vetenskap-allmaenhet -
Category
Documents
-
view
234 -
download
4
description
VA Report 2010:6 These are a few of the results from VA’s annual barometer which is compiled using information from 1,000 telephone interviews with a representative sample of the Swedish population (aged 16 and over). The interviews were conducted by market research company Novus between 28th September and 4th October 2010. This is the ninth barometer survey since VA (Public & Science) was formed in 2002.
Transcript of VA Barometer 2010/11 in English
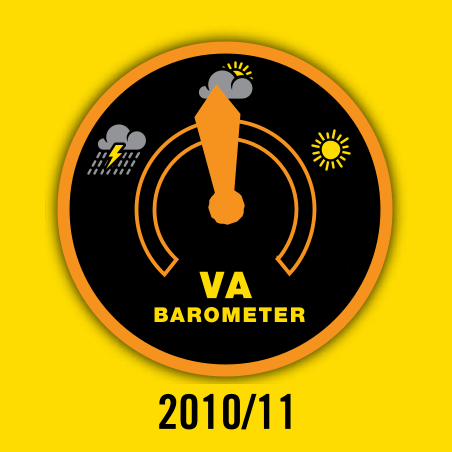
2010/11

va Barometer 2010/11 – va Report 2010:6
issn: 1653-6843isbn: 978-91-85585-59-5 (printed)urn:nbn:se:vetenskapochallmanhet-2010-6-eng (pdf )
Published by: Vetenskap & Allmänhet, VAPO Box 5073, SE-102 42 Stockholm, SwedenTelephone: +46 (0)8 791 30 48Fax: +46 (0)8 611 56 23E-mail: [email protected]: www.v-a.se
Readers are welcome to quote from this report provided that VA is cited as the source.
MIXED ATTITUDES TO RESEARCH
• Confidenceinresearchersisonthedecline.• AnincreasingnumberofSwedesbelievethatastrologyisascience.• Atthesametime,confidenceintheabilityofresearchtoslow
climate change and increase economic growth in Sweden is strengthening.
These are a few of the results from VA’s annual barometer which is compiled using information from 1,000 telephone interviews with a representative sample of the Swedish population (aged 16 and over). The interviews were conducted by market research company Novus between 28th September and 4th October 2010. This is the ninth ba-rometer survey since VA (Public & Science) was formed in 2002. The VA barometer was produced with support from the Swedish Research Council.
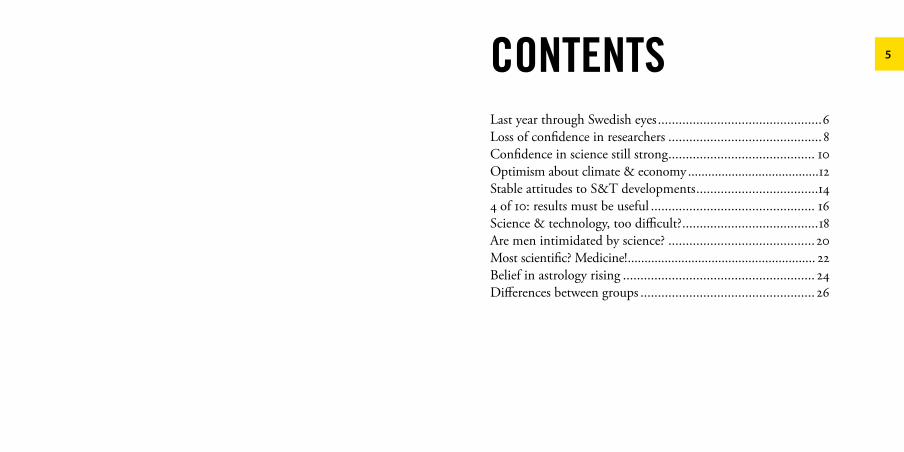
5CONTENTSLast year through Swedish eyes ...............................................6Lossofconfidenceinresearchers ............................................ 8Confidenceinsciencestillstrong .......................................... 10Optimism about climate & economy .......................................12Stable attitudes to S&T developments ...................................144 of 10: results must be useful ............................................... 16Science & technology, too difficult? .......................................18Are men intimidated by science? ..........................................20Mostscientific?Medicine! ........................................................ 22Belief in astrology rising ....................................................... 24Differences between groups .................................................. 26

LAST yEAR THROUgH SwEDISH EyES6
A professor at the Swedish National Defence College is found guilty of plagiarism but is permitted to continue with his research
Successful high-energy collisions take place at the LHC (Large Hadron Collider), CERN
An oil rig explodes in the Mexican Gulf with enormous volumes of spilt oil
The European Commission aims serious criticism at France for Roma deportation
A professor in Gothenburg is accused of serious scientific fraud
The nationalist party Sweden Democrats get 5.7 per cent of the votes in the par-liamentary elections
Volcanic ash from Iceland cripples air traffic
The State Prosecutor opens a preliminary investigation into a gross bribery case in the City of Gothenburg
Major floods in Pakistan
The University Chancellor resigns after disagreements between him and the Swedish Minister for Research
Record high temperatures in Russia resulting in major forest fires
“A fundamental reform of the IPCC management structure is needed” according to a review report
Barack Obama is awarded the Nobel Peace Prize
Mass vaccination against the “Swine Flu” virus H1N1 in Sweden
White Christmas and a cold and snowy winter along with sky-high electricity prices
Major earthquake in Haiti
UN Climate Change Conference in Copenhagen, COP15, fails to seal binding agreement
Wikileaks publishes thousands of documents on the war in Afghanistan. One of the company’s servers is located in Sweden
An American federal court bans the use of federal funds for embryonic stem cell research
The Swedish Minister for the Environment is criticised for citing scientific reasons for licensed wolf hunting
AstraZeneca announces it will close its research facility in Lund
OctSeptAugJulyJuneMayAprilMarchFebJanDecNovOct20
10
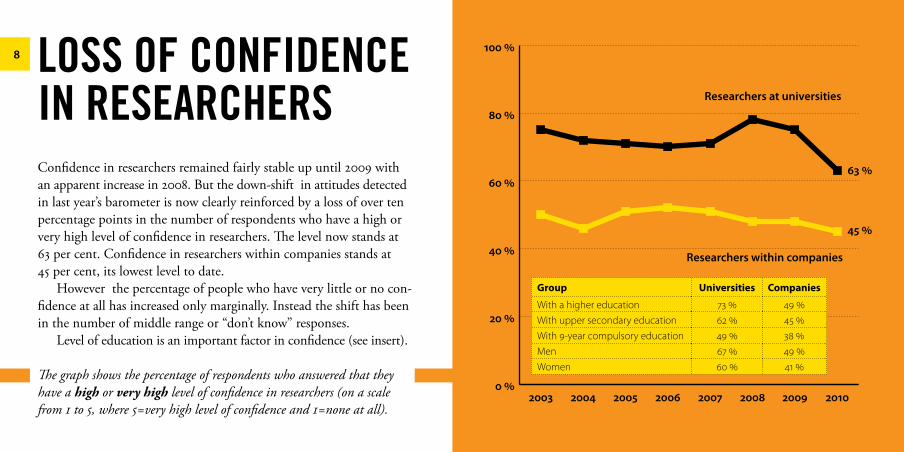
8 LOSS OF CONFIDENCE IN RESEARCHERSConfidenceinresearchersremainedfairlystableupuntil2009withan apparent increase in 2008. But the down-shift in attitudes detected in last year’s barometer is now clearly reinforced by a loss of over ten percentage points in the number of respondents who have a high or veryhighlevelofconfidenceinresearchers.Thelevelnowstandsat 63percent.Confidenceinresearcherswithincompaniesstandsat 45 per cent, its lowest level to date.
However the percentage of people who have very little or no con-fidenceatallhasincreasedonlymarginally.Insteadtheshifthasbeenin the number of middle range or “don’t know” responses.
Levelofeducationisanimportantfactorinconfidence(seeinsert).
The graph shows the percentage of respondents who answered that they have a high or very high level of confidence in researchers (on a scale from 1 to 5, where 5=very high level of confidence and 1=none at all).
0 %
20 %
40 %
60 %
80 %
100 %
Researchers at universities
Researchers within companies
45 %
63 %
20102009200820072006200520042003
Group Universities Companies
With a higher education 73 % 49 %With upper secondary education 62 % 45 %With 9-year compulsory education 49 % 38 %Men 67 % 49 %Women 60 % 41 %
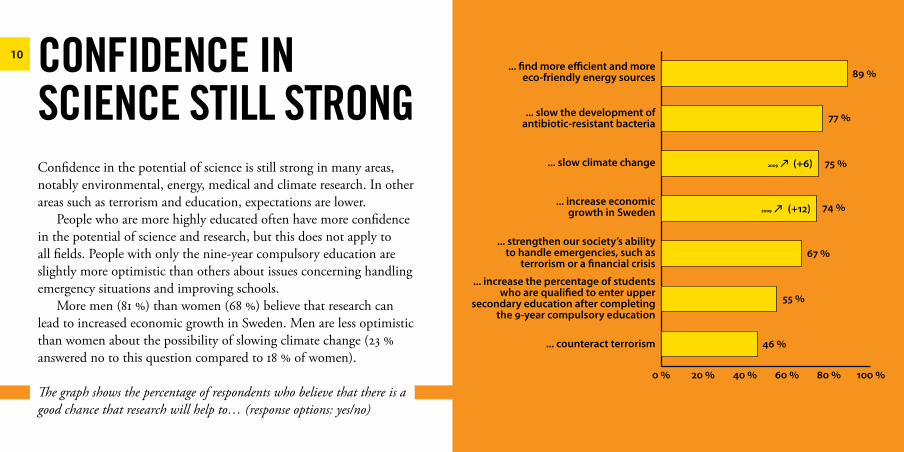
10 CONFIDENCE IN SCIENCE STILL STRONgConfidenceinthepotentialofscienceisstillstronginmanyareas,notablyenvironmental,energy,medicalandclimateresearch.Inotherareas such as terrorism and education, expectations are lower.
Peoplewhoaremorehighlyeducatedoftenhavemoreconfidencein the potential of science and research, but this does not apply to allfields.Peoplewithonlythenine-yearcompulsoryeducationareslightly more optimistic than others about issues concerning handling emergency situations and improving schools.
More men (81 %) than women (68 %) believe that research can lead to increased economic growth in Sweden. Men are less optimistic than women about the possibility of slowing climate change (23 % answered no to this question compared to 18 % of women).
The graph shows the percentage of respondents who believe that there is a good chance that research will help to… (response options: yes/no)
0 % 20 % 40 % 60 % 80 % 100 %
... counteract terrorism
... increase the percentage of studentswho are quali�ed to enter upper
secondary education after completingthe 9-year compulsory education
... strengthen our society’s abilityto handle emergencies, such as
terrorism or a �nancial crisis
... increase economicgrowth in Sweden
... slow climate change
... slow the development ofantibiotic-resistant bacteria
... �nd more e�cient and moreeco-friendly energy sources 89 %
77 %
75 %(+6)
(+12) 74 %
67 %
55 %
46 %
2009
2009
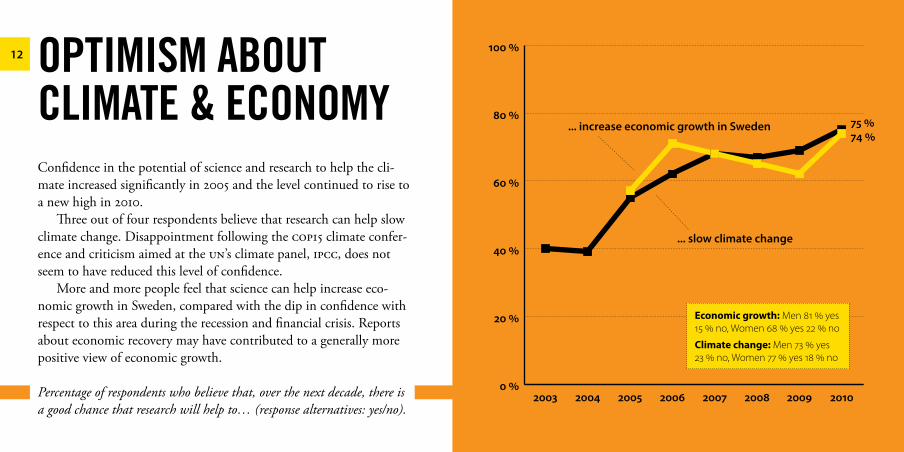
12 OPTIMISM ABOUT CLIMATE & ECONOMy Confidenceinthepotentialofscienceandresearchtohelpthecli-mateincreasedsignificantlyin2005andthelevelcontinuedtorisetoa new high in 2010.
Three out of four respondents believe that research can help slow climate change. Disappointment following the COP15 climate confer-ence and criticism aimed at the UN’s climate panel, IPCC, does not seemtohavereducedthislevelofconfidence.
More and more people feel that science can help increase eco-nomicgrowthinSweden,comparedwiththedipinconfidencewithrespecttothisareaduringtherecessionandfinancialcrisis.Reportsabout economic recovery may have contributed to a generally more positive view of economic growth.
Percentage of respondents who believe that, over the next decade, there is a good chance that research will help to… (response alternatives: yes/no).
0 %
20 %
40 %
60 %
80 %
100 %
... slow climate change
74 %75 %... increase economic growth in Sweden
20102009200820072006200520042003
Economic growth: Men 81 % yes 15 % no, Women 68 % yes 22 % no
Climate change: Men 73 % yes 23 % no, Women 77 % yes 18 % no
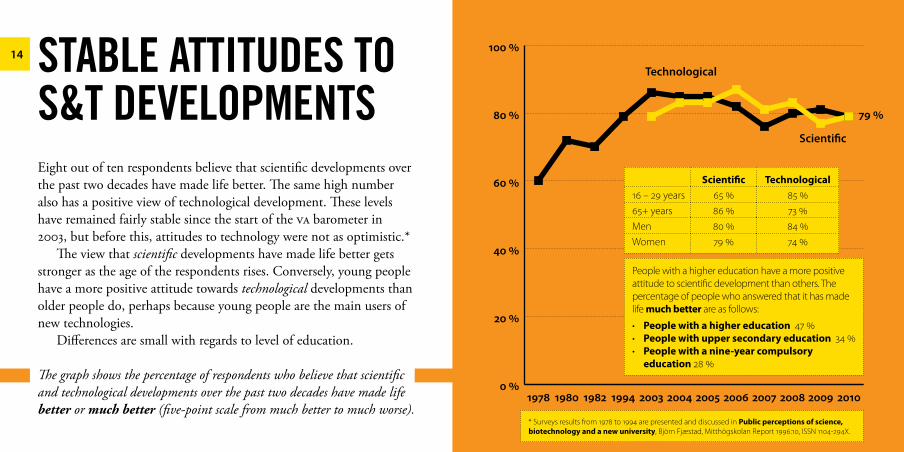
14 STABLE ATTITUDES TO S&T DEvELOPMENTS Eightoutoftenrespondentsbelievethatscientificdevelopmentsoverthe past two decades have made life better. The same high number also has a positive view of technological development. These levels have remained fairly stable since the start of the VA barometer in 2003, but before this, attitudes to technology were not as optimistic.*
The view that scientific developments have made life better gets strongerastheageoftherespondentsrises.Conversely,youngpeoplehave a more positive attitude towards technological developments than older people do, perhaps because young people are the main users of new technologies.
Differences are small with regards to level of education.
The graph shows the percentage of respondents who believe that scientific and technological developments over the past two decades have made life better or much better (five-point scale from much better to much worse).
0 %
20 %
40 %
60 %
80 %
100 %
Technological
Scienti�c
201020092008200720062005200420031994198219801978
79 %
People with a higher education have a more positive attitude to scientific development than others. The percentage of people who answered that it has made life much better are as follows:
• People with a higher education 47 % • People with upper secondary education 34 % • People with a nine-year compulsory
education 28 %
* Surveys results from 1978 to 1994 are presented and discussed in Public perceptions of science, biotechnology and a new university, Björn Fjæstad, Mitthögskolan Report 1996:10, ISSN 1104-294X.
Scientific Technological16 – 29 years 65 % 85 %65+ years 86 % 73 %Men 80 % 84 %Women 79 % 74 %

16 4 OF 10: RESULTS MUST BE USEFULResearch that is perceived as “useful” and relevant to people’s everyday lives is given a higher priority than other research in VA’s surveys. Just over four in ten respondents agree that “Researchers should only con-duct research that it is believed can yield useful results.” This is a slightly lowerfigurethanlastyear,butviewedovertimesince2003,thelevelhas remained stable.
However, over 60 per cent of people agreed in another statement ”It is important to conduct research that does not have useful results as its primary objective” when this question was last asked in 2008. Many people agreed with both statements.
The graph shows the percentage of respondents who agree completely or largely that “Researchers should only conduct research that it is believed can yield useful results.”
0 %
20 %
40 %
60 %
80 %
100 %
2010 20092008200720062005200420032002
43 %
People with a higher education: 33 %
People with upper secondary education: 43 %
People with nine-year compulsory education: 60 %

18 SCIENCE & TECHNO-LOgy, TOO DIFFICULT?Four out of ten respondents believe that science and technology are too difficult for most people to understand. The level seems to have stabilisedfollowingadropfromadistinctlyhigherlevelwhenfirstmeasured in 2002. 25 percent of people totally disagree with this statement.
Women are more likely to agree than men. Young people and those with a higher education agree the least with the statement that science and technology are too difficult to understand.
The question was posed to half of the survey participants. The other half was given a related alternative question (see next page).
The graph shows the percentage of respondents who agree completely or largely or do not agree at all with the statement “Science and technology are too difficult for most people to understand.”
0 %
10 %
20 %
30 %
40 %
50 %
60 %
Do not agree at all
Agree completely or largely
201020092008200720062005200420032002
40 %
25 %
Agree: men 35 %, women 45 %, with 9-year compulsory education 50 %, with upper secondary education 40 %, with a higher education 34 %, 16–29 years 24 %, 65+ years 61 %.
Do not agree at all: men 29 %, women 22 %, with 9-year compulsory education 18 %, with upper secondary education 24 %, with a higher education 32 %, 16–29 years 34 %, 65+ years 17 %
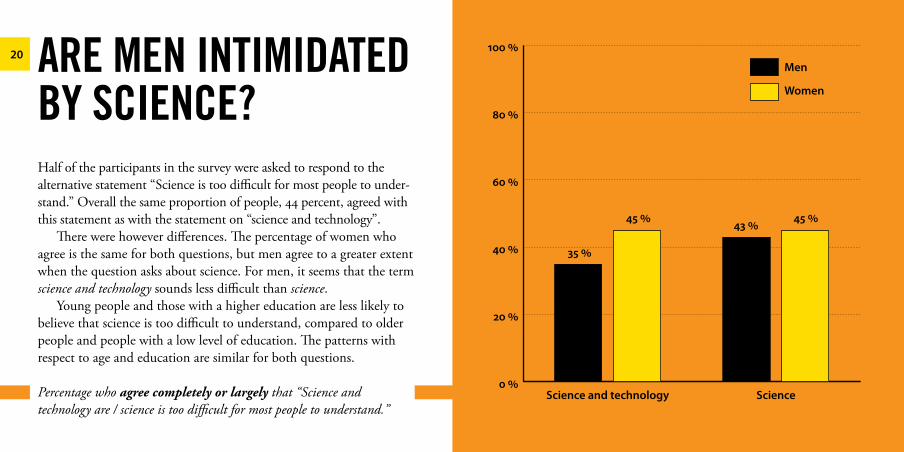
20 ARE MEN INTIMIDATED By SCIENCE?Half of the participants in the survey were asked to respond to the alternative statement “Science is too difficult for most people to under-stand.” Overall the same proportion of people, 44 percent, agreed with this statement as with the statement on “science and technology”.
There were however differences. The percentage of women who agree is the same for both questions, but men agree to a greater extent when the question asks about science. For men, it seems that the term science and technology sounds less difficult than science.
Young people and those with a higher education are less likely to believe that science is too difficult to understand, compared to older people and people with a low level of education. The patterns with respect to age and education are similar for both questions.
Percentage who agree completely or largely that “Science and technology are / science is too difficult for most people to understand.”
0 %
20 %
40 %
60 %
80 %
100 %Kvinnor
Män
ScienceScience and technology
35 %
45 % 45 %43 %
Men
Women

22
0 % 20 % 40 % 60 % 80 % 100 %
Theology*
Religious science
Philosophy
Law
Business administration*
Economics*
Information technology*
Astronomy
Chemistry
Medicine** 95 %
77 %
67 %
62 %
56 %
47 %
40 %
32 %
24 %
17 %
(+9)2006
2009
2005
2005
2008
(+2)
(+7)
(-4)
(+14)
MOST SCIENTIFIC? MEDICINE!Surveys looking at the public’s attitudes to science often include ques-tionsabouthowscientificdifferentsubjectsare.TheVA barometer has shown year on year that medicine and natural sciences are considered morescientificthansocialsciencesorhumanities.
Astronomyisconsideredscientificby67percentin2010–upfrom53percentin2009.Chemistryisalsoconsideredmorescientificthan before.
Ingeneral,peoplewithahigherlevelofeducationconsiderallsub-jectstobemorescientificthanpeoplewithalowerlevelofeducationdo.
Anexplanationofallsubjectswasprovidedattheinterviewinorder to avoid misunderstandings.
The chart shows the percentage of respondents who consider different sub-jects to be scientific (4 or 5 on a scale from 1 to 5, where 5=to the highest degree and 1=not at all scientific).
* 2009
** 2008
The figures in brackets refer to the change since the last measurement. The subjects are rotated between the years and different subjects are measured with varying frequency.
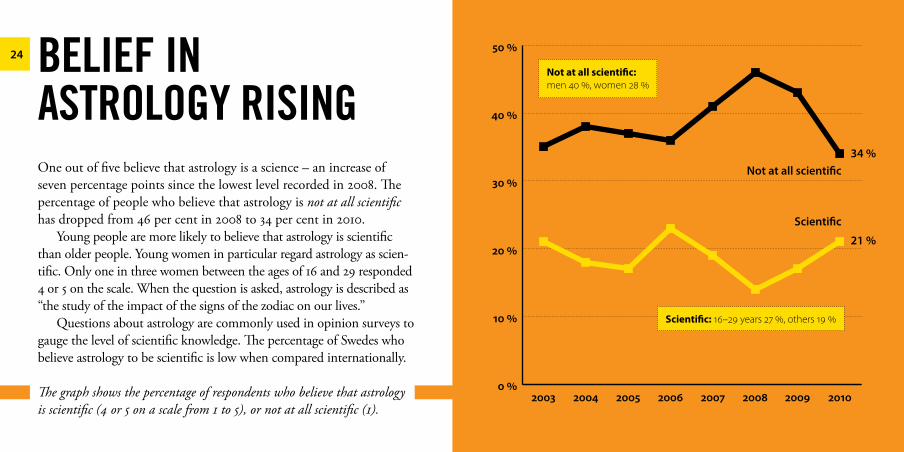
24 BELIEF IN ASTROLOgy RISINgOneoutoffivebelievethatastrologyisascience–anincreaseofseven percentage points since the lowest level recorded in 2008. The percentage of people who believe that astrology is not at all scientific has dropped from 46 per cent in 2008 to 34 per cent in 2010.
Youngpeoplearemorelikelytobelievethatastrologyisscientificthan older people. Young women in particular regard astrology as scien-tific.Onlyoneinthreewomenbetweentheagesof16and29responded4 or 5 on the scale. When the question is asked, astrology is described as “the study of the impact of the signs of the zodiac on our lives.”
Questions about astrology are commonly used in opinion surveys to gaugethelevelofscientificknowledge.ThepercentageofSwedeswhobelieveastrologytobescientificislowwhencomparedinternationally.
The graph shows the percentage of respondents who believe that astrology is scientific (4 or 5 on a scale from 1 to 5), or not at all scientific (1).
0 %
10 %
20 %
30 %
40 %
50 %
Not at all scienti�c
Scienti�c
20102009200820072006200520042003
34 %
21 %
Scientific: 16–29 years 27 %, others 19 %
Not at all scientific: men 40 %, women 28 %

26 vA REPORTS 02–102002:1 What do people in other countries think?2002:2 The public’s view of science2002:3 Researchers’ views on dialogue with the public2002:4 How young people view science
2003:1 Science in society2003:2 VA studies under the microscope: Perspectives on science 20022003:3 How the public views science 20032003:4 How researchers view Public & Science*2003:5 Researchers’ views on dialogue with the public
2004:1 Science in society2004:2 Teachers’ attitudes towards science and research-based knowledge2004:3 How the public views science 20042004:4 How teachers view science*2004:5 Researchers’ views on dialogue with the public2004:6 What do people in other countries think, 2004?
2005:1 Science in society2005:2 Teachers on entrepreneurship2005:3 Eurobarometers on science, 20052005:4 How the public views science, 20052005:5 Science in the press2005:6 How journalists view science*
2006:1 Science in society2006:2 How politicians view science2006:3 Science in the political press 2006:4 Eighteen voices on the relationship between researchers and politicians
2006:5 Politics and science*2006:6 How the public views science, 20062006:7 Stockholm politicians’ view of science2006:8 Politics and science –a literature survey 2006:9 The public on Carl Linnaeus, 2006
2007:1 Journalists on research2007:2 Science in society2007:3 How the public views science, 20072007:4 Young people’s views on science 2007:5 Young people on knowledge 2007:6 Crazy, confused and evil? 2007:7 Projects with no effect? 2007:8 Knowledge rocks! Summary of a youth study by VA*
2008:1 After the Linnaeus anniversary 2008:2 Science in society2008:3 Myself as a researcher*2008:4 The value of knowledge in the business world2008:5 Knowledge in transition* 2008:6 VA barometer 2008*
2009:1 Science in society2009:2 VA barometer 2009/10*2009:3 Knowledge you can believe in?2009:4 ODE – Public Engagement and Dialogue
2010:1 Science in society 2010:2 Knowledge in a class by itself ?2010:3 A feel for knowledge2010:4 Science & Values – a summary*2010:5 Research in the Swedish general election 20102010:6 VA barometer 2010/11*
27DIFFERENCES BETwEEN gROUPSThe most important differences in attitudes:
• Levelofeducationisthemostimportantandthemost differentiating factor. People with a higher level of education have in general a more positive attitude towards research and researchers than those with a lower level of education.
• Youngpeoplehave“lessrespect”forscienceandtechnology thanolderpeople,andoftenhavemoreconfidenceintheabilityof science to solve problems. Young people are slightly more likely to believe that astrology is a science.
• Genderisinsomecasesadifferentiatingfactor,forexampleinattitudestotechnicaldevelopment,confidenceinthepotentialof research to help increase economic growth, and with regard to whether astrology is a science.
Reports marked with an asterisk (*) are available in English.

28 VA (Public & Science) is a Swedish association which aims to promote dialogueandopennessbetweenthegeneralpublic–especiallytheyoung–andresearchers.Theassociationendeavourstostimulatenewforms of dialogue in unconventional arenas on issues that concern people,andtoconnecttheseissuestoscience.VAisanon-for-profitmembership organisation, with diverse members from across Swedish society including organisations, public authorities, companies, universities and individuals.
Read more at www.v-a.se