V. Exchange rates and capital flows in industrial countries · V. Exchange rates and capital flows...
21
V. Exchange rates and capital flows in industrial countries Highlights Two themes already evident in 1995 persisted in the foreign exchange market last year. The first was the strengthening of the US dollar, in two phases. In spite of continuing trade deficits, the dollar edged up for much of 1996 as market participants responded to its interest rate advantage, and the prospect of its increasing further. Then, towards the end of the year, the dollar rose sharply against the Deutsche mark and the Japanese yen as the US economic expansion demonstrated its vigour. A firming of European currencies against the mark and the Swiss franc accompanied the rise of the dollar. This helped the Finnish markka to join and the Italian lira to rejoin the ERM in October and November respectively. Stronger European currencies and associated lower bond yields both anticipated and made more likely the introduction of the euro, the second theme of the period under review. Market participants clearly expect the euro to be introduced: forward exchange rates point to exchange rate stability among a number of currencies judged most likely to join monetary union. Foreign exchange markets thereby stand to lose up to 10¤% of global transactions, and have begun to refocus on the rapidly growing business of trading emerging market currencies. Possible shifts in official reserve management with the introduction of the euro have preoccupied market commentators, but changes in private asset management and global liability management could well prove more significant. Even then, it is easy to overstate the effect of any such portfolio shifts on exchange rates. Differences in the vigour of growth in the major countries, and related differences in monetary policies, are likely to exert a greater influence on exchange rates. The ultimate international roles of the euro, the dollar and the yen will depend in part on their use as anchor currencies by third countries. The broadly based euro might well perform this role better than its predecessor currencies, but the dollar has the advantage of incumbency. The exchange rate policies of countries experiencing rapid growth will bear importantly on the future global role of the euro. The US dollar, the Deutsche mark and the Japanese yen The strengthening of the dollar against the yen and the mark reflected current and prospective cyclical developments and the consequent expectations about monetary policy. The strength of the dollar contributed to keeping short-term exchange rate volatility low for much of 1996, although the question arises as to whether the growing use of new instruments in the foreign exchange market also 76 Bank for International Settlements -- 67th Annual Report
Transcript of V. Exchange rates and capital flows in industrial countries · V. Exchange rates and capital flows...

V. Exchange rates and capital flows in industrialcountries
Highlights
Two themes already evident in 1995 persisted in the foreign exchange marketlast year. The first was the strengthening of the US dollar, in two phases. In spiteof continuing trade deficits, the dollar edged up for much of 1996 as marketparticipants responded to its interest rate advantage, and the prospect of itsincreasing further. Then, towards the end of the year, the dollar rose sharplyagainst the Deutsche mark and the Japanese yen as the US economic expansiondemonstrated its vigour.
A firming of European currencies against the mark and the Swiss francaccompanied the rise of the dollar. This helped the Finnish markka to join andthe Italian lira to rejoin the ERM in October and November respectively. StrongerEuropean currencies and associated lower bond yields both anticipated and mademore likely the introduction of the euro, the second theme of the period underreview.
Market participants clearly expect the euro to be introduced: forwardexchange rates point to exchange rate stability among a number of currenciesjudged most likely to join monetary union. Foreign exchange markets therebystand to lose up to 10¤% of global transactions, and have begun to refocus on therapidly growing business of trading emerging market currencies. Possible shifts inofficial reserve management with the introduction of the euro have preoccupiedmarket commentators, but changes in private asset management and globalliability management could well prove more significant. Even then, it is easy tooverstate the effect of any such portfolio shifts on exchange rates. Differencesin the vigour of growth in the major countries, and related differences inmonetary policies, are likely to exert a greater influence on exchange rates.
The ultimate international roles of the euro, the dollar and the yen willdepend in part on their use as anchor currencies by third countries. The broadlybased euro might well perform this role better than its predecessor currencies,but the dollar has the advantage of incumbency. The exchange rate policies ofcountries experiencing rapid growth will bear importantly on the future globalrole of the euro.
The US dollar, the Deutsche mark and the Japanese yen
The strengthening of the dollar against the yen and the mark reflected currentand prospective cyclical developments and the consequent expectations aboutmonetary policy. The strength of the dollar contributed to keeping short-termexchange rate volatility low for much of 1996, although the question arises as towhether the growing use of new instruments in the foreign exchange market also
76 Bank for International Settlements -- 67th Annual Report
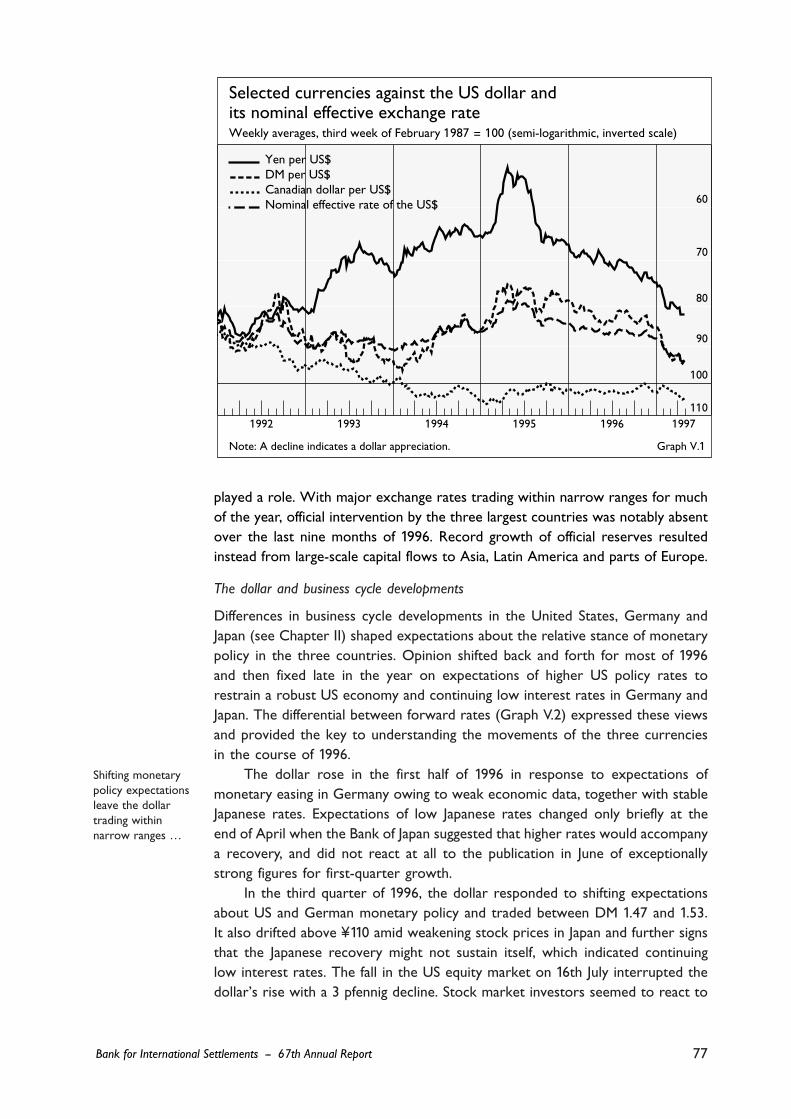
played a role. With major exchange rates trading within narrow ranges for muchof the year, official intervention by the three largest countries was notably absentover the last nine months of 1996. Record growth of official reserves resultedinstead from large-scale capital flows to Asia, Latin America and parts of Europe.
The dollar and business cycle developments
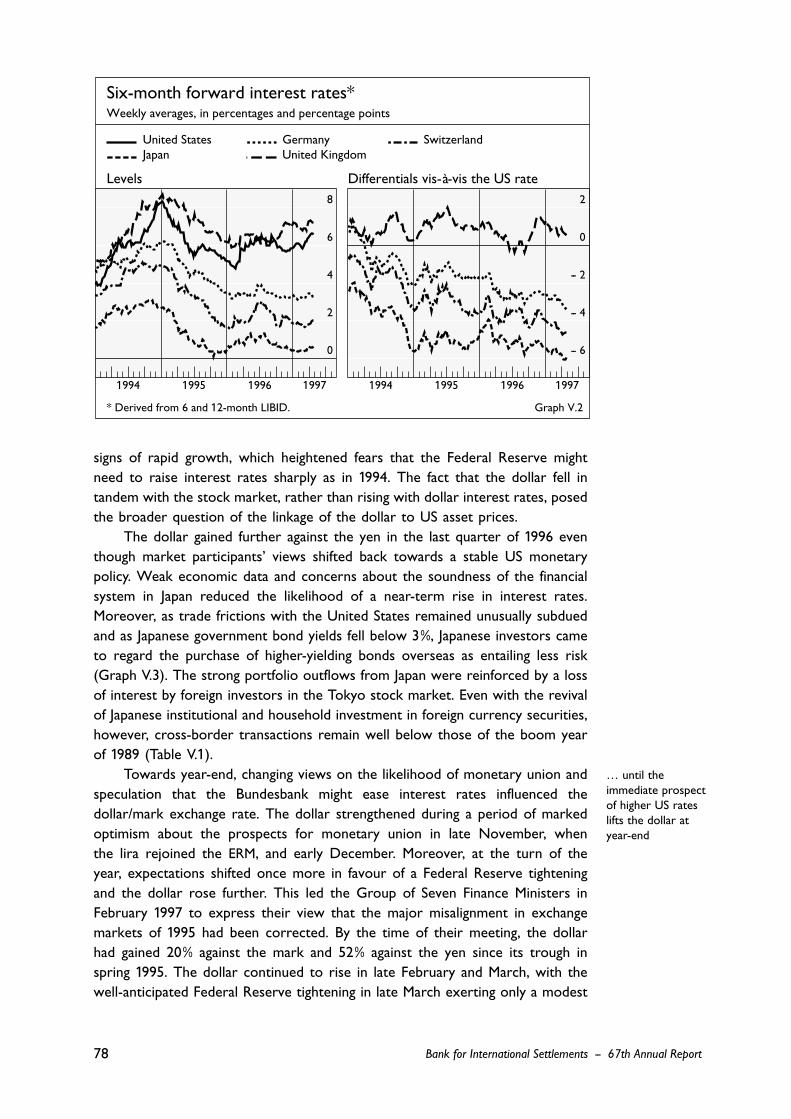
Differences in business cycle developments in the United States, Germany andJapan (see Chapter II) shaped expectations about the relative stance of monetarypolicy in the three countries. Opinion shifted back and forth for most of 1996and then fixed late in the year on expectations of higher US policy rates torestrain a robust US economy and continuing low interest rates in Germany andJapan. The differential between forward rates (Graph V.2) expressed these viewsand provided the key to understanding the movements of the three currenciesin the course of 1996.
The dollar rose in the first half of 1996 in response to expectations ofmonetary easing in Germany owing to weak economic data, together with stableJapanese rates. Expectations of low Japanese rates changed only briefly at theend of April when the Bank of Japan suggested that higher rates would accompanya recovery, and did not react at all to the publication in June of exceptionallystrong figures for first-quarter growth.
In the third quarter of 1996, the dollar responded to shifting expectationsabout US and German monetary policy and traded between DM 1.47 and 1.53.It also drifted above ¥¤110 amid weakening stock prices in Japan and further signsthat the Japanese recovery might not sustain itself, which indicated continuinglow interest rates. The fall in the US equity market on 16th July interrupted thedollar’s rise with a 3 pfennig decline. Stock market investors seemed to react to
77
Shifting monetarypolicy expectationsleave the dollartrading withinnarrow ranges …
Bank for International Settlements -- 67th Annual Report
60
70
80
90
100
1101992 1993 1994 1995 1996 1997
Yen per US$ DM per US$ Canadian dollar per US$ Nominal effective rate of the US$
Selected currencies against the US dollar andits nominal effective exchange rateWeekly averages, third week of February 1987 = 100 (semi-logarithmic, inverted scale)
Note: A decline indicates a dollar appreciation. Graph V.1
signs of rapid growth, which heightened fears that the Federal Reserve mightneed to raise interest rates sharply as in 1994. The fact that the dollar fell intandem with the stock market, rather than rising with dollar interest rates, posedthe broader question of the linkage of the dollar to US asset prices.
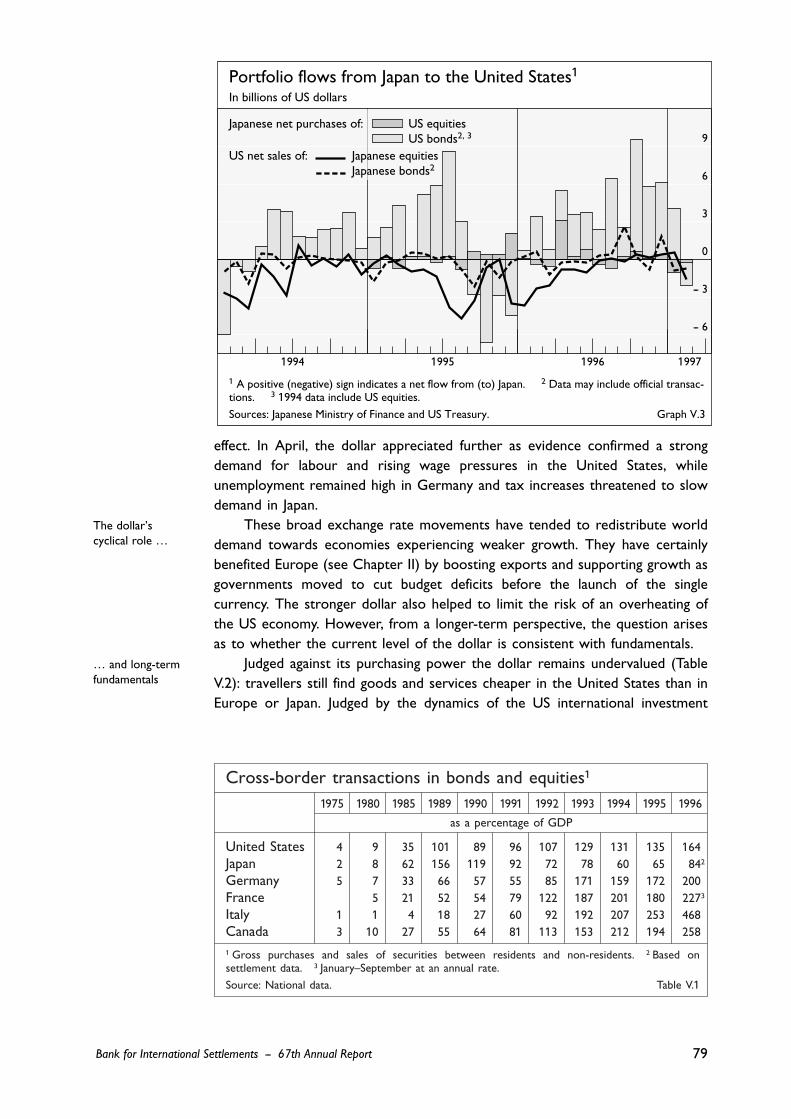
The dollar gained further against the yen in the last quarter of 1996 eventhough market participants’ views shifted back towards a stable US monetarypolicy. Weak economic data and concerns about the soundness of the financialsystem in Japan reduced the likelihood of a near-term rise in interest rates.Moreover, as trade frictions with the United States remained unusually subduedand as Japanese government bond yields fell below 3¤%, Japanese investors cameto regard the purchase of higher-yielding bonds overseas as entailing less risk(Graph V.3). The strong portfolio outflows from Japan were reinforced by a lossof interest by foreign investors in the Tokyo stock market. Even with the revivalof Japanese institutional and household investment in foreign currency securities,however, cross-border transactions remain well below those of the boom yearof 1989 (Table V.1).
Towards year-end, changing views on the likelihood of monetary union andspeculation that the Bundesbank might ease interest rates influenced thedollar/mark exchange rate. The dollar strengthened during a period of markedoptimism about the prospects for monetary union in late November, whenthe lira rejoined the ERM, and early December. Moreover, at the turn of theyear, expectations shifted once more in favour of a Federal Reserve tighteningand the dollar rose further. This led the Group of Seven Finance Ministers inFebruary 1997 to express their view that the major misalignment in exchangemarkets of 1995 had been corrected. By the time of their meeting, the dollarhad gained 20¤% against the mark and 52¤% against the yen since its trough inspring 1995. The dollar continued to rise in late February and March, with thewell-anticipated Federal Reserve tightening in late March exerting only a modest
78
… until theimmediate prospectof higher US rateslifts the dollar at year-end
Bank for International Settlements -- 67th Annual Report
0
2
4
6
8
1994 1995 1996 1997
- 6-
- 4-
- 2-
0
2
1994 1995 1996 1997
United StatesJapan
Germany United Kingdom
Switzerland
Six-month forward interest rates*Weekly averages, in percentages and percentage points
Levels Differentials vis-à-vis the US rate
* Derived from 6 and 12-month LIBID. Graph V.2
effect. In April, the dollar appreciated further as evidence confirmed a strongdemand for labour and rising wage pressures in the United States, whileunemployment remained high in Germany and tax increases threatened to slowdemand in Japan.
These broad exchange rate movements have tended to redistribute worlddemand towards economies experiencing weaker growth. They have certainlybenefited Europe (see Chapter II) by boosting exports and supporting growth asgovernments moved to cut budget deficits before the launch of the singlecurrency. The stronger dollar also helped to limit the risk of an overheating ofthe US economy. However, from a longer-term perspective, the question arisesas to whether the current level of the dollar is consistent with fundamentals.
Judged against its purchasing power the dollar remains undervalued (TableV.2): travellers still find goods and services cheaper in the United States than inEurope or Japan. Judged by the dynamics of the US international investment
79
The dollar’scyclical role …
… and long-termfundamentals
Cross-border transactions in bonds and equities1
1975 1980 1985 1989 1990 1991 1992 1993 1994 1995 1996
as a percentage of GDP
United States 4 9 35 101 89 96 107 129 131 135 164Japan 2 8 62 156 119 92 72 78 60 65 842
Germany 5 7 33 66 57 55 85 171 159 172 200France 5 21 52 54 79 122 187 201 180 2273
Italy 1 1 4 18 27 60 92 192 207 253 468Canada 3 10 27 55 64 81 113 153 212 194 258
1 Gross purchases and sales of securities between residents and non-residents. 2 Based onsettlement data. 3 January–September at an annual rate.
Source: National data. Table V.1
Bank for International Settlements -- 67th Annual Report
- 6-
- 3-
0
3
6
9
1994 1995 1996 1997
Japanese net purchases of:
US net sales of:
US equities US bonds2, 3
Japanese equitiesJapanese bonds2
Portfolio flows from Japan to the United States1
In billions of US dollars
1 A positive (negative) sign indicates a net flow from (to) Japan. 2 Data may include official transac-tions. 3 1994 data include US equities.
Sources: Japanese Ministry of Finance and US Treasury. Graph V.3

position, the picture looks different. Fundamental equilibrium exchange rates areeffective exchange rates compatible with current account imbalances that leavethe ratio of external debt to output stable. Necessarily problematic estimatessuggest that at market rates in May 1997 the dollar is somewhat overvaluedagainst the mark and rather more so against the yen. While any widening of theUS current account deficit could become evident only slowly, the $18 billion tradedeficit in January indicated that the process may indeed have begun. The Japanesesurplus seems already to have bottomed out in 1996.
Volatility and the dollar cycle
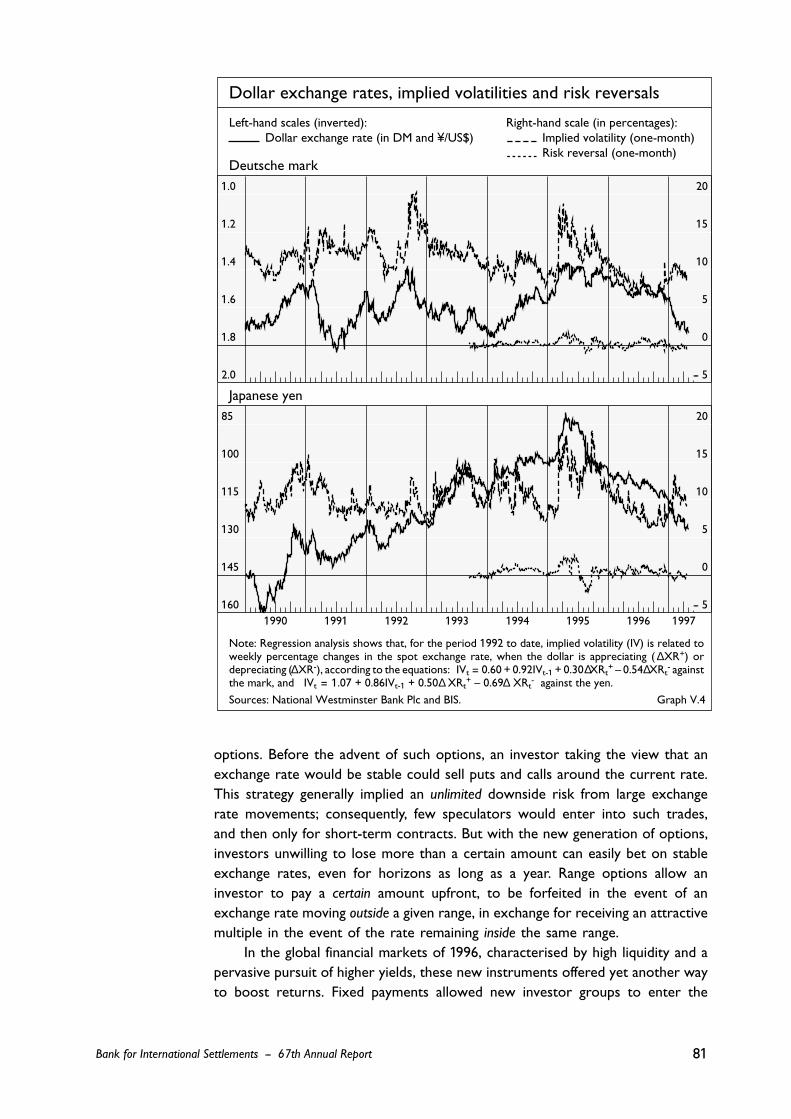
It is easier to explain the dollar’s broad upswing since 1995 than the unusuallynarrow range of short-term variation of major exchange rates and cheapcurrency options (low implied volatility) during much of 1996 (Graph V.4). Majorcentral banks, which saw no reason to intervene in such quiet markets, hadoccasion to ask whether low volatility was here to stay. Discussion centred ona new generation of options as a source of permanently lower volatility. However,the role of the dollar cycle in fostering what may prove to be only a temporaryperiod of calm also deserves attention.
The dollar’s rising trend may explain some of its low volatility in 1996. Sincethe United States has accumulated a net external debt and continues to run acurrent account deficit, global investors and international traders have a net longposition in dollars. The pressure to hedge against a falling dollar leads to moreexpensive options (higher implied volatility) than the parallel but weaker pressureto hedge against a rising dollar. Thus the dollar’s sharp rise at the turn of theyear did not take implied volatility above its average levels.
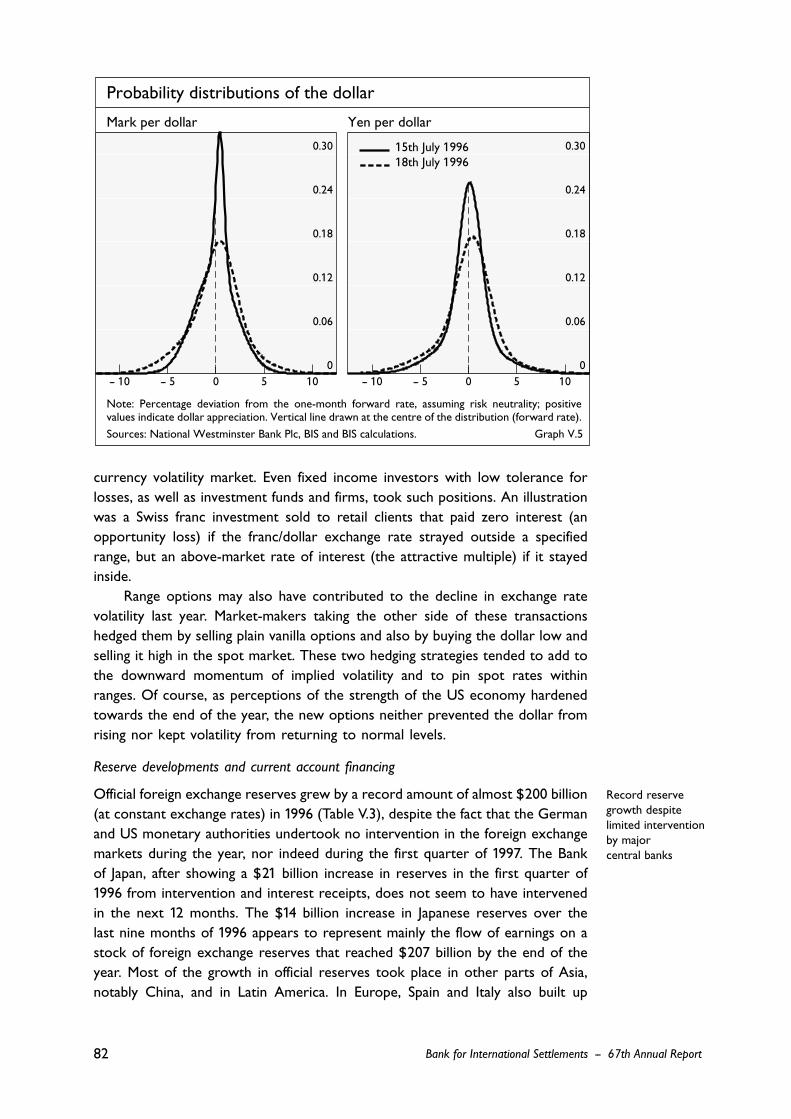
The episode of dollar weakness in mid-July suggested a connection betweenglobal financial wealth and the price of dollar options. As the US and other equitymarkets fell, and with them the dollar, market participants bid up implied volatility(widening the probability distribution) and attached more weight to the possibilityof the dollar’s sinking further (fattening the left-hand tail of the distribution;see Graph V.5).
Generally low implied volatility in 1996 may also have reflected the increasedpopularity with investors of a new generation of options, called range or binary
80
Low volatilityowing to …
… thedollar trend …
… and new optionmarket participants
Estimates of the US dollar’s purchasing power and fundamentalequilibrium value
Market Purchasing power PPP Fundamentalrate1 parity (PPP) adjusted for equilibrium exchange
against productivity ratethe dollar OECD2 Penn3 Goldman IIE SBC4
Sachs4
Deutsche mark 1.70 2.05 2.12 1.51 1.45–1.50 1.42Japanese yen 123 172 188 112 100 94
1 On 9th May 1997. 2 1996 average. 3 1992. 4 Early 1997.
Sources: OECD, Penn World Tables 5.6, Goldman Sachs, John Williamson’s April 1996 informalupdate of estimates in Estimating equilibrium exchange rates, Institute for International Economics(IIE), Washington, D.C. (September 1994) and Swiss Bank Corporation (SBC). Table V.2
Bank for International Settlements -- 67th Annual Report
options. Before the advent of such options, an investor taking the view that anexchange rate would be stable could sell puts and calls around the current rate.This strategy generally implied an unlimited downside risk from large exchangerate movements; consequently, few speculators would enter into such trades,and then only for short-term contracts. But with the new generation of options,investors unwilling to lose more than a certain amount can easily bet on stableexchange rates, even for horizons as long as a year. Range options allow aninvestor to pay a certain amount upfront, to be forfeited in the event of anexchange rate moving outside a given range, in exchange for receiving an attractivemultiple in the event of the rate remaining inside the same range.
In the global financial markets of 1996, characterised by high liquidity and apervasive pursuit of higher yields, these new instruments offered yet another wayto boost returns. Fixed payments allowed new investor groups to enter the
81Bank for International Settlements -- 67th Annual Report
1.0
1.2
1.4
1.6
1.8
2.0 - 5-
0
5
10
15
20
85
100
115
130
145
160 - 5-
0
5
10
15
20
1990 1991 1992 1993 1994 1995 1996 1997
Left-hand scales (inverted):Dollar exchange rate (in DM and ¥/US$)
Right-hand scale (in percentages):Implied volatility (one-month) Risk reversal (one-month)
Deutsche mark
Japanese yen
Dollar exchange rates, implied volatilities and risk reversals
Note: Regression analysis shows that, for the period 1992 to date, implied volatility (IV) is related toweekly percentage changes in the spot exchange rate, when the dollar is appreciating ( XR+) ordepreciating ( XR-), according to the equations: IVt = 0.60 + 0.92IVt-1 + 0.30 XRt
+ – 0.54 XRt- against
the mark, and IVt = 1.07 + 0.86IVt-1 + 0.50 XRt+ – 0.69 XRt
- against the yen.
Sources: National Westminster Bank Plc and BIS. Graph V.4
∆∆ ∆ ∆
∆ ∆
currency volatility market. Even fixed income investors with low tolerance forlosses, as well as investment funds and firms, took such positions. An illustrationwas a Swiss franc investment sold to retail clients that paid zero interest (anopportunity loss) if the franc/dollar exchange rate strayed outside a specifiedrange, but an above-market rate of interest (the attractive multiple) if it stayedinside.
Range options may also have contributed to the decline in exchange ratevolatility last year. Market-makers taking the other side of these transactionshedged them by selling plain vanilla options and also by buying the dollar low andselling it high in the spot market. These two hedging strategies tended to add tothe downward momentum of implied volatility and to pin spot rates withinranges. Of course, as perceptions of the strength of the US economy hardenedtowards the end of the year, the new options neither prevented the dollar fromrising nor kept volatility from returning to normal levels.
Reserve developments and current account financing
Official foreign exchange reserves grew by a record amount of almost $200 billion(at constant exchange rates) in 1996 (Table V.3), despite the fact that the Germanand US monetary authorities undertook no intervention in the foreign exchangemarkets during the year, nor indeed during the first quarter of 1997. The Bankof Japan, after showing a $21 billion increase in reserves in the first quarter of1996 from intervention and interest receipts, does not seem to have intervenedin the next 12 months. The $14 billion increase in Japanese reserves over thelast nine months of 1996 appears to represent mainly the flow of earnings on astock of foreign exchange reserves that reached $207 billion by the end of theyear. Most of the growth in official reserves took place in other parts of Asia,notably China, and in Latin America. In Europe, Spain and Italy also built up
82
Record reservegrowth despitelimited interventionby majorcentral banks
Bank for International Settlements -- 67th Annual Report
0
0.06
0.12
0.18
0.24
0.30
- 10- - 5- 0 5 10 0
0.06
0.12
0.18
0.24
0.30
- 10- - 5- 0 5 10
15th July 199618th July 1996
Probability distributions of the dollar
Mark per dollar Yen per dollar
Note: Percentage deviation from the one-month forward rate, assuming risk neutrality; positivevalues indicate dollar appreciation. Vertical line drawn at the centre of the distribution (forward rate).
Sources: National Westminster Bank Plc, BIS and BIS calculations. Graph V.5

reserves substantially as foreign investors bought peseta and lira bonds and theBank of Spain and the Bank of Italy intervened to buy dollars or marks.
The United States financed most of its current account deficit in 1996 withofficial inflows. Although this had also been the case in 1987 and 1995, theunderlying process at work differed last year. In 1987 and 1995 the dollar sufferedfrom the unwillingness of private foreign investors to accept the dollars flowingfrom the US current account deficit at prevailing exchange rates and interestrates; the dollar’s weakness against major currencies led Group of Ten authoritiesto intervene in its support. In 1996, by contrast, the dollar rose against majorcurrencies and a pervasive search for yield in world financial markets (seeChapters III, VI and VII) led to strong capital flows to emerging markets. Sincemany of these countries link their currencies to the dollar, the resulting foreignexchange intervention led to increases in reserves, which were generally investedin US Treasury securities and other liquid dollar instruments.
As for the recycling of Japan’s current account surplus, private outflowspredominated in 1996. Given domestic bond yields below 3¤%, and with tradedisputes muted along with the associated risks of a stronger yen, Japaneseinstitutional investors and households alike bought higher-coupon US ($45billion), UK ($10 billion), Canadian ($4 billion) and Australian ($3 billion) bonds.
European currencies and the Canadian dollarLast year’s Annual Report highlighted a pattern of exchange rate linkages thatrelates the direction of European exchange rate changes to movements in the
83
US official inflowsresult from capitalflows to emergingmarkets
Official foreign exchange reserves1993 1994 1995 1996 Amounts
outstandingat end-1996
in billions of US dollars
Changes, at current exchange rates
Total 110.9 151.8 199.4 169.5 1,517.8Industrial countries 32.0 60.9 80.1 72.9 707.0Asian NIEs1 20.5 30.3 21.3 15.6 261.6Other countries 58.4 60.6 98.0 81.0 549.2
Changes, at constant exchange rates2
Total 115.7 111.6 181.8 196.5 1,517.8
Dollar reserves 73.9 91.8 156.1 145.8 1,041.5held:
In the United States3 66.4 38.3 106.0 122.0 712.1With banks outside the US4 0.6 30.0 –¤15.4 19.2 126.2Unallocated 6.9 23.5 65.5 4.6 203.2
Non-dollar reserves 41.8 19.8 25.7 50.7 476.3of which held with banks4 6.2 1.8 7.7 8.0 122.1
1 Hong Kong, Korea, Singapore and Taiwan. 2 Partly estimated; valued at end-of-year exchangerates. The residual has been allocated on the basis of known reserves. 3 Excludes foreign militarysales prepayments and the current value of zero coupon bonds issued to the governments ofArgentina, Mexico and Venezuela as collateral for their Brady bonds. 4 Deposits by officialmonetary institutions with banks reporting to the BIS.
Sources: IMF, national data and BIS. Table V.3
Bank for International Settlements -- 67th Annual Report
dollar/mark rate. This pattern can be explained by trade links, the comovementof cyclical fluctuations and international portfolio bias.
Exchange rate links
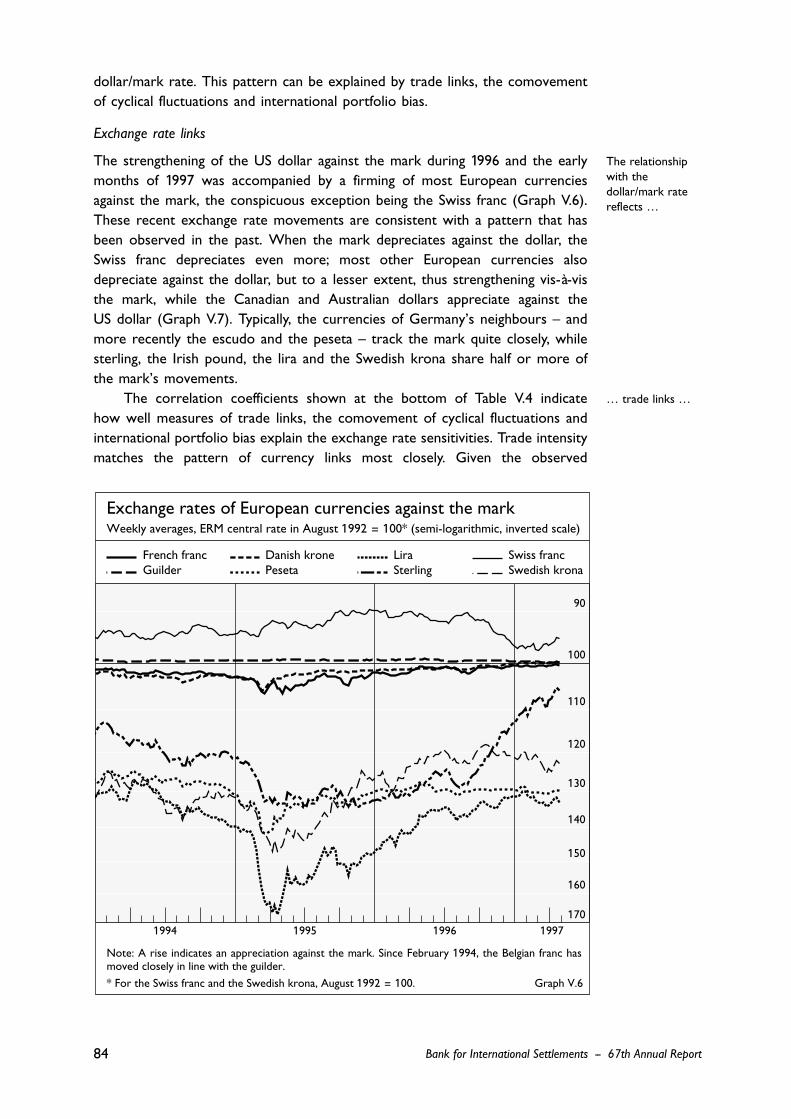
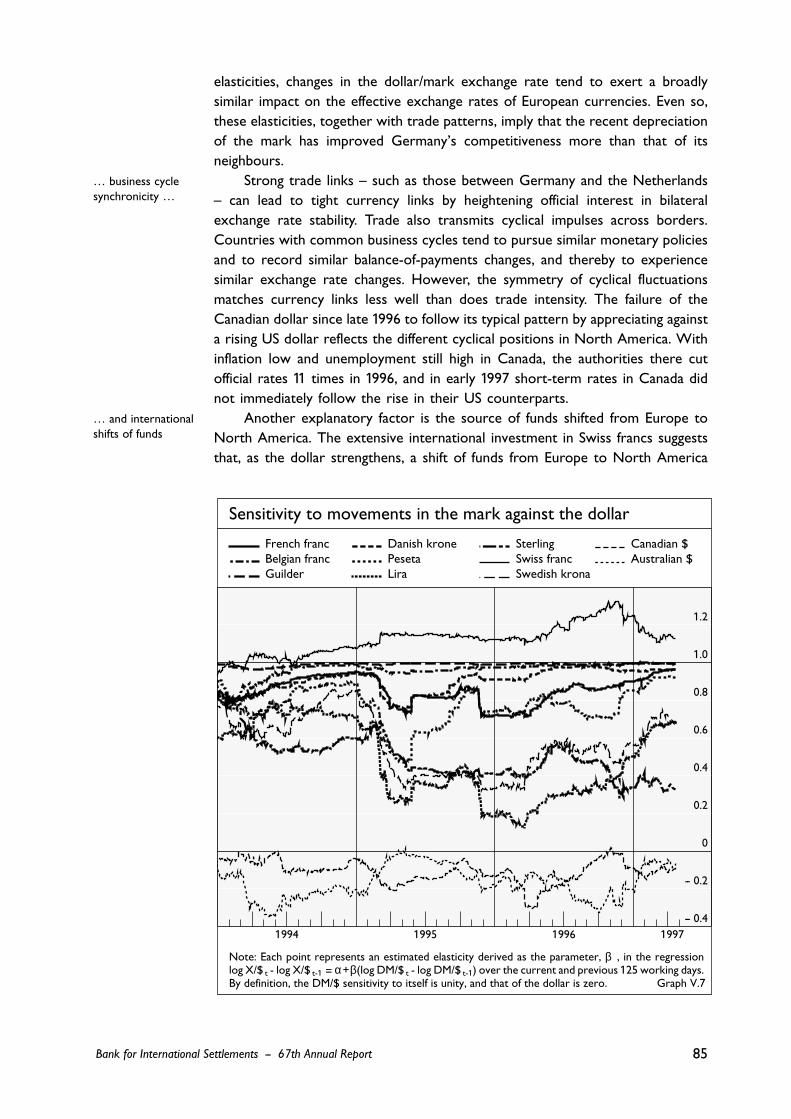
The strengthening of the US dollar against the mark during 1996 and the earlymonths of 1997 was accompanied by a firming of most European currenciesagainst the mark, the conspicuous exception being the Swiss franc (Graph V.6).These recent exchange rate movements are consistent with a pattern that hasbeen observed in the past. When the mark depreciates against the dollar, theSwiss franc depreciates even more; most other European currencies alsodepreciate against the dollar, but to a lesser extent, thus strengthening vis-à-visthe mark, while the Canadian and Australian dollars appreciate against theUS dollar (Graph V.7). Typically, the currencies of Germany’s neighbours – andmore recently the escudo and the peseta – track the mark quite closely, whilesterling, the Irish pound, the lira and the Swedish krona share half or more ofthe mark’s movements.
The correlation coefficients shown at the bottom of Table V.4 indicatehow well measures of trade links, the comovement of cyclical fluctuations andinternational portfolio bias explain the exchange rate sensitivities. Trade intensitymatches the pattern of currency links most closely. Given the observed
84
The relationshipwith thedollar/mark ratereflects …
… trade links …
Bank for International Settlements -- 67th Annual Report
90
100
110
120
130
140
150
160
1701994 1995 1996 1997
French francGuilder
Danish kronePeseta
Lira Sterling
Swiss franc Swedish krona
Exchange rates of European currencies against the markWeekly averages, ERM central rate in August 1992 = 100* (semi-logarithmic, inverted scale)
Note: A rise indicates an appreciation against the mark. Since February 1994, the Belgian franc hasmoved closely in line with the guilder.
* For the Swiss franc and the Swedish krona, August 1992 = 100. Graph V.6
elasticities, changes in the dollar/mark exchange rate tend to exert a broadlysimilar impact on the effective exchange rates of European currencies. Even so,these elasticities, together with trade patterns, imply that the recent depreciationof the mark has improved Germany’s competitiveness more than that of itsneighbours.
Strong trade links – such as those between Germany and the Netherlands– can lead to tight currency links by heightening official interest in bilateralexchange rate stability. Trade also transmits cyclical impulses across borders.Countries with common business cycles tend to pursue similar monetary policiesand to record similar balance-of-payments changes, and thereby to experiencesimilar exchange rate changes. However, the symmetry of cyclical fluctuationsmatches currency links less well than does trade intensity. The failure of theCanadian dollar since late 1996 to follow its typical pattern by appreciating againsta rising US dollar reflects the different cyclical positions in North America. Withinflation low and unemployment still high in Canada, the authorities there cutofficial rates 11 times in 1996, and in early 1997 short-term rates in Canada didnot immediately follow the rise in their US counterparts.
Another explanatory factor is the source of funds shifted from Europe toNorth America. The extensive international investment in Swiss francs suggeststhat, as the dollar strengthens, a shift of funds from Europe to North America
85
… business cyclesynchronicity …
… and internationalshifts of funds
Bank for International Settlements -- 67th Annual Report
- 0.4-
- 0.2-
0
0.2
0.4
0.6
0.8
1.0
1.2
1994 1995 1996 1997
French franc Belgian francGuilder
Danish kronePeseta Lira
SterlingSwiss franc Swedish krona
Canadian $ Australian $
Sensitivity to movements in the mark against the dollar
Note: Each point represents an estimated elasticity derived as the parameter, , in the regressionlog X/$ t - log X/$ t-1 = + (log DM/$ t - log DM/$ t-1) over the current and previous 125 working days.By definition, the DM/$ sensitivity to itself is unity, and that of the dollar is zero. Graph V.7
α ββ

occurs disproportionately at the expense of the Swiss franc, which accordinglyweakens. This portfolio bias can be proxied by the ratio of international depositsand eurodeposits to GDP, which is highest for the Swiss franc, lower for theFrench franc and lowest for the lira.
Events in 1995 and 1996 suggest that the causal relationship between dollarstrength and the cohesion of European currencies (or the prospects for monetaryunion) runs in both directions. While the weakening of European currenciesagainst the mark in reaction to the US stock market fall on 16th July 1996illustrates how US developments can influence European currencies, the dollar’sweakness when doubts arose regarding the breadth of participation in monetaryunion in September 1995 (see last year’s Annual Report) illustrates how Europeandevelopments can influence the dollar.
European currencies
The strength of the dollar vis-à-vis the mark in 1996 favoured the firming ofEuropean currencies against the mark and helped the Finnish markka to join
86
Explaining exchange rate sensitivitiesExchange Trade Correlation of Inter- Memo item:
rate intensity2 business cycles national Dollar exchangesensi- portfolio rate changestivity1
Output gaps3 Supply shocks4 bias5 on 16th July 1996
with with with with with with % ratio toDE US DE US DE US change6 DM/$
change
Swiss franc 1.05 2.87 0.59 0.40 0.25 0.34 0.20 3.44 –¤12.1 1.37
Mark 1.00 0.00 0.34 1.00 0.20 1.00 0.18 1.39 –¤11.5 1.00
Guilder 0.94 2.75 0.53 0.63 0.39 0.24 0.18 0.89 –¤11.4 0.94
Belgian franc 0.93 2.22 0.48 0.52 0.09 0.39 0.15 1.05 –¤11.4 0.95
Danish krone 0.84 2.22 0.29 0.29 0.42 0.21 0.17 – –¤11.4 0.94
French franc 0.82 1.94 0.42 0.38 0.14 0.36 0.16 0.67 –¤11.3 0.82
Escudo 0.82 1.68 0.30 0.33 –¤0.00 0.02 –¤0.05 – –¤11.3 0.81
Peseta 0.73 1.87 0.33 0.10 –¤0.33 –¤0.03 –¤0.08 – –¤11.2 0.81
Irish pound 0.53 1.15 0.75 – – – – – –¤10.5 0.33
Swedish krona 0.49 1.59 0.43 0.28 0.29 0.08 0.19 – –¤10.5 0.31
Pound sterling 0.46 1.39 0.81 –¤0.01 0.56 –¤0.05 0.13 0.89 –¤10.3 0.32
Lira 0.45 1.93 0.40 0.55 0.41 0.25 0.25 0.62 –¤10.6 0.39
US dollar 0.00 0.41 0.00 0.20 1.00 0.18 1.00 1.62 0.0 0.00
Canadian dollar –¤0.09 0.14 5.29 0.06 0.86 –¤0.24 0.22 – 0.2 –¤0.12
Australian dollar –¤0.12 0.36 0.92 –¤0.07 0.76 –¤0.05 0.05 – 0.2 –¤0.16
Memorandum item: Correlation with sensitivities7
of values 1.00 0.93 –¤0.63 0.69 –¤0.71 0.75 –¤0.06 0.58 –¤0.96 0.97
of rank orders8 1.00 0.88 –¤0.41 0.68 –¤0.57 0.69 0.00 0.80 –¤0.95 0.95
1 Exchange rate sensitivities are defined as the slope coefficient in a regression of daily percentage changes of dollar exchangerates on percentage changes in dollar/mark exchange rate changes, estimated over the period 1994–96. 2 Ratio of thebilateral trade share with Germany (the United States) to the German (US) share of world trade. 3 Correlation of outputgaps computed as deviations from potential GDP estimated using the Hodrick-Prescott filter. 4 Estimated following themethod of Bayoumi and Eichengreen described in “Shocking Aspects of European Monetary Integration”, in Adjustment andGrowth in the European Monetary Union, Cambridge University Press (1993), but using quarterly data from 1980 to 1995 andfour lags. 5 Ratio of cross-border and local foreign currency deposits in each currency to GDP of the country of issue in1995. High values indicate large international use of the currency in relation to the scale of domestic financial markets.6 A decline indicates an appreciation against the dollar. 7 Since trade intensity with Germany (the United States) is not definedfor Germany (the United States), these two countries are excluded. 8 Spearman rank order correlation. Table V.4
Bank for International Settlements -- 67th Annual Report

the ERM on 20th October and the lira to rejoin after a four-year absence on25th November. This was in sharp contrast to the events of 1992 when it was the mark that was appreciating. It was also the case in 1996 that declininginflation rates, fiscal consolidation and rising expectations of monetary union ledto substantial capital inflows into government bonds in Italy ($34 billion up toend-November), Spain ($16 billion) and Sweden ($5 billion). The narrowing ofinterest rate differentials vis-à-vis Germany in Italy, Spain and Sweden highlightshow bond markets and foreign exchange markets were responding jointly togood news (Graph V.8).
Consistent with their usual currency links but in stronger measure, sterlingstrengthened against the mark in 1996 whereas the Swiss franc weakened. Theannouncement in March of the UK general election for 1st May 1997 did notprevent sterling from rising to DM 2.77 (its lower limit in the ERM during1990–92). Forward interest rates suggested expectations that the election
87
More ERMmembers andconverging bondmarkets
Bank for International Settlements -- 67th Annual Report
0
2
4
6
950
1,050
1,150
1,250
0
2
4
6
76
84
92
100
0
2
4
6
4.18
4.62
5.06
5.50
1994 1995 1996 19970
2
4
6 2.16
2.38
2.60
2.821994 1995 1996 1997
Left-hand scale (in percentage points):1
Swap rate Benchmark government bond yield
Right-hand scales (against the mark):2
Exchange rate ERM central rate
Ten-year yield differentials and European exchange ratesAt end-month
Italy Spain
Sweden United Kingdom
Note: The shaded areas denote ERM membership.1 Domestic less German rate. 2 Scaled to show a 35% range of variation; for the United Kingdom,DM/£ (inverted scale). A decline indicates an appreciation of the domestic currency.
Sources: Reuters, Datastream and BIS. Graph V.8

would in any case be followed by a rise in interest rates. (In the event, anannouncement on 6th May that the Bank of England would be granted moreindependence accompanied a rise in short-term interest rates, and sterling gainedfurther against the mark and the dollar.) While there was discussion of sterlingas a haven from the uncertainties of monetary union, what is demonstrable isthat the pound has traded more in sympathy with the dollar in the past yearthan at any time since the late 1970s (Graph V.7). For its part, the Swiss francweakened in response to continuing signs of stagnation of the Swiss economyand an aggressive easing of monetary policy in late 1996.
The introduction of the euro
As the probability has increased that several European currencies will merge intothe euro, attention has turned to the potential effects on the global foreignexchange market and on global portfolio management, and to the possible useof the euro as an anchor currency by countries outside the industrial world.
The market outlook for European monetary union
Opinion in financial markets regarding the probability of European monetaryunion, and the currencies likely to be included, firmed last year. Yields on interestrate swaps, as traded in the over-the-counter derivative market, offer a measureof these changing views. Implied exchange rates calculated out to ten yearsforward show that the currencies of a number of countries are expected to bestable against the mark (Graph V.9, upper panels). Indeed, for much of the pastyear forward French franc swap contracts, starting in 1999 and extending to 2004,have featured fixed interest rates noticeably lower than those on correspondingmark contracts owing to a strong domestic French portfolio shift into bonds inthe face of low short-term rates. This rate configuration persisted despiteinternational disinvestment of $39 billion out of French government bonds in thefirst three quarters of 1996 and international investment in German governmentbonds of $27 billion in the year as a whole, as well as parallel transactions inswap contracts.
With the exception of sterling, other European currencies were by early1997 expected to demonstrate much more stability against the mark than hadbeen the case in 1996 or 1995 (Graph V.9, middle panels). Recent forward ratesfor the dollar suggest that it might give back to the euro some of its recent gainsagainst the mark.
The impact of the euro on the foreign exchange market
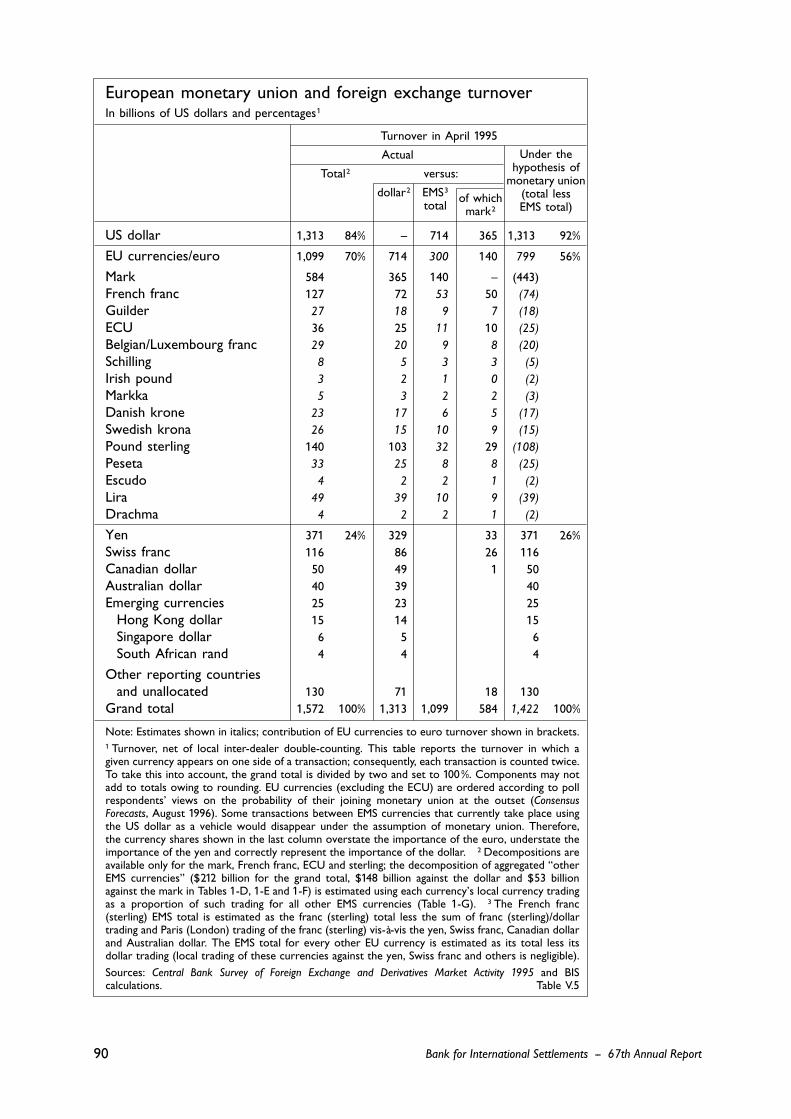
Monetary union would reduce revenues from foreign exchange trading andoutright position-taking even though many financial firms have profited from theconvergence of interest rates in Europe. The April 1995 foreign exchange marketsurvey conducted by the central banks and monetary authorities of 26 countriesmay be taken as the basis for assessing the scale of the prospective loss of trading.It should be emphasised at the outset, however, that such an estimate can onlybe approximate, since precise decompositions, for instance of trading of Frenchfrancs against lire in London, are not available. In addition, the calculations mayunderstate the potential loss of turnover to the extent that an exchange of two
88
Market indicatorspoint to monetaryunion
The prospect ofdisappearingEuropeancurrencies …
Bank for International Settlements -- 67th Annual Report
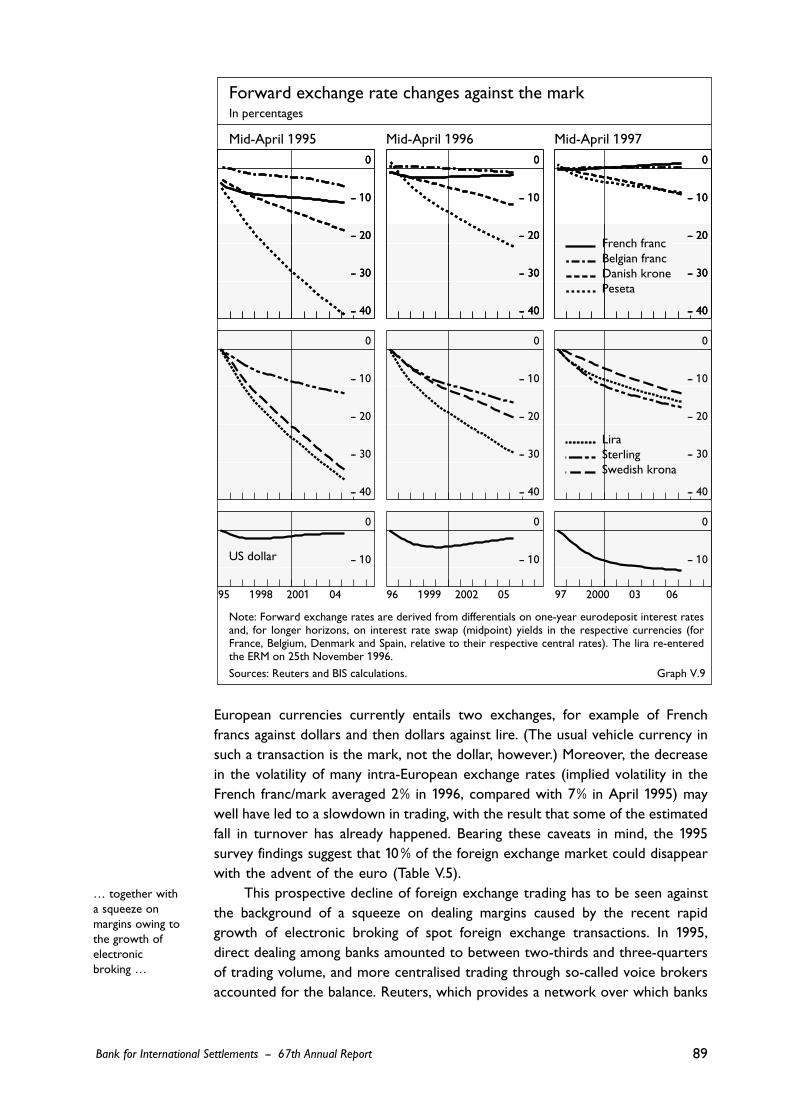
European currencies currently entails two exchanges, for example of Frenchfrancs against dollars and then dollars against lire. (The usual vehicle currency insuch a transaction is the mark, not the dollar, however.) Moreover, the decreasein the volatility of many intra-European exchange rates (implied volatility in theFrench franc/mark averaged 2¤% in 1996, compared with 7¤% in April 1995) maywell have led to a slowdown in trading, with the result that some of the estimatedfall in turnover has already happened. Bearing these caveats in mind, the 1995survey findings suggest that 10¤¤% of the foreign exchange market could disappearwith the advent of the euro (Table V.5).
This prospective decline of foreign exchange trading has to be seen againstthe background of a squeeze on dealing margins caused by the recent rapidgrowth of electronic broking of spot foreign exchange transactions. In 1995,direct dealing among banks amounted to between two-thirds and three-quartersof trading volume, and more centralised trading through so-called voice brokersaccounted for the balance. Reuters, which provides a network over which banks
89
… together witha squeeze onmargins owing tothe growth ofelectronicbroking …
Bank for International Settlements -- 67th Annual Report
- 40-
- 30-
- 20-
- 10-
0
- 40-
- 30-
- 20-
- 10-
0
- 40-
- 30-
- 20-
- 10-
0
- 40-
- 30-
- 20-
- 10-
0
- 40-
- 30-
- 20-
- 10-
0
- 40-
- 30-
- 20-
- 10-
0
French franc Belgian francDanish krone Peseta
- 40-
- 30-
- 20-
- 10-
0
- 40-
- 30-
- 20-
- 10-
0
- 40-
- 30-
- 20-
- 10-
0
Lira Sterling Swedish krona
- 10-
0
95 1998 2001 04
- 10-
0
96 1999 2002 05
- 10-
0
97 2000 03 06
US dollar
Forward exchange rate changes against the markIn percentages
Mid-April 1995 Mid-April 1996 Mid-April 1997
Note: Forward exchange rates are derived from differentials on one-year eurodeposit interest ratesand, for longer horizons, on interest rate swap (midpoint) yields in the respective currencies (forFrance, Belgium, Denmark and Spain, relative to their respective central rates). The lira re-enteredthe ERM on 25th November 1996.
Sources: Reuters and BIS calculations. Graph V.9
90
European monetary union and foreign exchange turnoverIn billions of US dollars and percentages1
Turnover in April 1995
Actual
Total2 versus:
dollar2 EMS3of which
total mark2
US dollar 1,313 84% – 714 365 1,313 92%
EU currencies/euro 1,099 70% 714 300 140 799 56%
Mark 584 365 140 – (443)French franc 127 72 53 50 (74)
Guilder 27 18 9 7 (18)
ECU 36 25 11 10 (25)
Belgian/Luxembourg franc 29 20 9 8 (20)
Schilling 8 5 3 3 (5)
Irish pound 3 2 1 0 (2)
Markka 5 3 2 2 (3)
Danish krone 23 17 6 5 (17)
Swedish krona 26 15 10 9 (15)
Pound sterling 140 103 32 29 (108)
Peseta 33 25 8 8 (25)
Escudo 4 2 2 1 (2)
Lira 49 39 10 9 (39)
Drachma 4 2 2 1 (2)
Yen 371 24% 329 33 371 26%Swiss franc 116 86 26 116Canadian dollar 50 49 1 50Australian dollar 40 39 40Emerging currencies 25 23 25
Hong Kong dollar 15 14 15Singapore dollar 6 5 6South African rand 4 4 4
Other reporting countriesand unallocated 130 71 18 130
Grand total 1,572 100% 1,313 1,099 584 1,422 100%
Note: Estimates shown in italics; contribution of EU currencies to euro turnover shown in brackets.1 Turnover, net of local inter-dealer double-counting. This table reports the turnover in which agiven currency appears on one side of a transaction; consequently, each transaction is counted twice.To take this into account, the grand total is divided by two and set to 100¤%. Components may notadd to totals owing to rounding. EU currencies (excluding the ECU) are ordered according to pollrespondents’ views on the probability of their joining monetary union at the outset (ConsensusForecasts, August 1996). Some transactions between EMS currencies that currently take place usingthe US dollar as a vehicle would disappear under the assumption of monetary union. Therefore,the currency shares shown in the last column overstate the importance of the euro, understate theimportance of the yen and correctly represent the importance of the dollar. 2 Decompositions areavailable only for the mark, French franc, ECU and sterling; the decomposition of aggregated “otherEMS currencies” ($212 billion for the grand total, $148 billion against the dollar and $53 billionagainst the mark in Tables 1-D, 1-E and 1-F) is estimated using each currency’s local currency tradingas a proportion of such trading for all other EMS currencies (Table 1-G). 3 The French franc(sterling) EMS total is estimated as the franc (sterling) total less the sum of franc (sterling)/dollartrading and Paris (London) trading of the franc (sterling) vis-à-vis the yen, Swiss franc, Canadian dollarand Australian dollar. The EMS total for every other EU currency is estimated as its total less itsdollar trading (local trading of these currencies against the yen, Swiss franc and others is negligible).
Sources: Central Bank Survey of Foreign Exchange and Derivatives Market Activity 1995 and BIScalculations. Table V.5
Under thehypothesis of
monetary¤¤union(total lessEMS total)
Bank for International Settlements -- 67th Annual Report
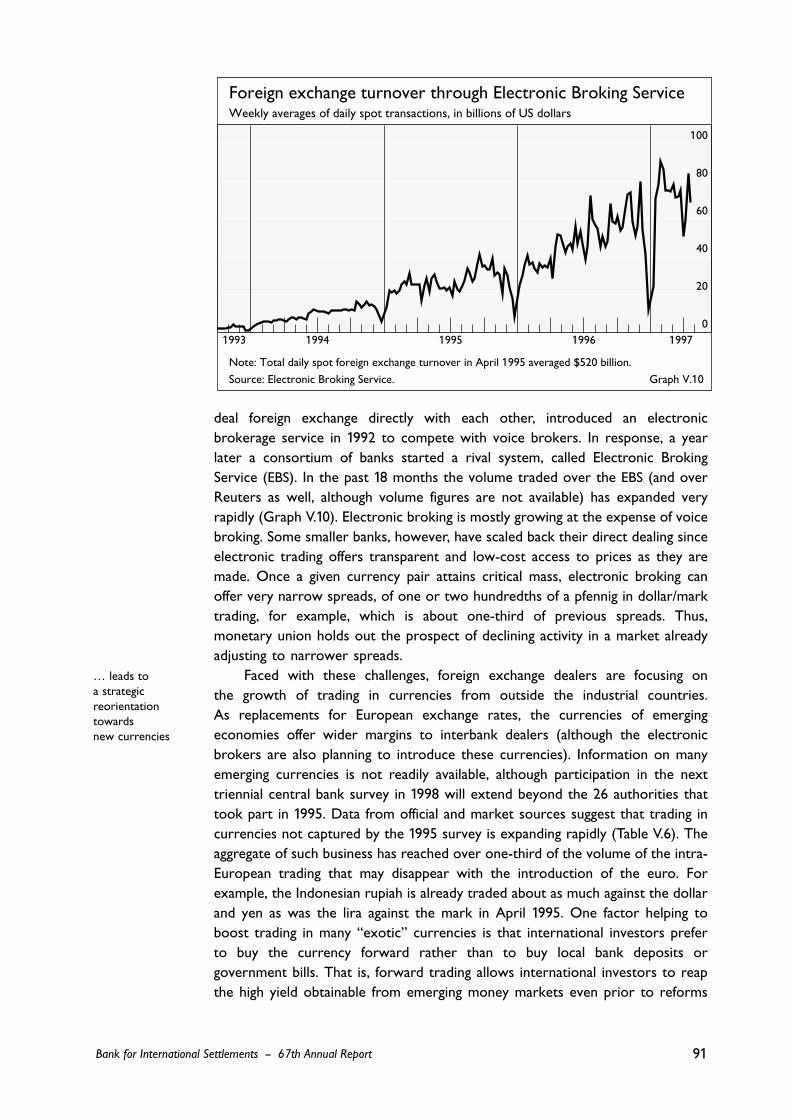
deal foreign exchange directly with each other, introduced an electronicbrokerage service in 1992 to compete with voice brokers. In response, a yearlater a consortium of banks started a rival system, called Electronic BrokingService (EBS). In the past 18 months the volume traded over the EBS (and overReuters as well, although volume figures are not available) has expanded veryrapidly (Graph V.10). Electronic broking is mostly growing at the expense of voicebroking. Some smaller banks, however, have scaled back their direct dealing sinceelectronic trading offers transparent and low-cost access to prices as they aremade. Once a given currency pair attains critical mass, electronic broking canoffer very narrow spreads, of one or two hundredths of a pfennig in dollar/marktrading, for example, which is about one-third of previous spreads. Thus,monetary union holds out the prospect of declining activity in a market alreadyadjusting to narrower spreads.
Faced with these challenges, foreign exchange dealers are focusing onthe growth of trading in currencies from outside the industrial countries.As replacements for European exchange rates, the currencies of emergingeconomies offer wider margins to interbank dealers (although the electronicbrokers are also planning to introduce these currencies). Information on manyemerging currencies is not readily available, although participation in the nexttriennial central bank survey in 1998 will extend beyond the 26 authorities thattook part in 1995. Data from official and market sources suggest that trading incurrencies not captured by the 1995 survey is expanding rapidly (Table V.6). Theaggregate of such business has reached over one-third of the volume of the intra-European trading that may disappear with the introduction of the euro. Forexample, the Indonesian rupiah is already traded about as much against the dollarand yen as was the lira against the mark in April 1995. One factor helping toboost trading in many “exotic” currencies is that international investors preferto buy the currency forward rather than to buy local bank deposits orgovernment bills. That is, forward trading allows international investors to reapthe high yield obtainable from emerging money markets even prior to reforms
91
… leads toa strategic reorientationtowardsnew currencies
Bank for International Settlements -- 67th Annual Report
0
20
40
60
80
100
1993 1994 1995 1996 1997
Foreign exchange turnover through Electronic Broking ServiceWeekly averages of daily spot transactions, in billions of US dollars
Note: Total daily spot foreign exchange turnover in April 1995 averaged $520 billion.
Source: Electronic Broking Service. Graph V.10

of withholding taxes, custodial arrangements, reserve requirements and otherimpediments to holding cash instruments in these countries.
The euro and portfolio shifts
The question of how global portfolio managers will respond, in the short runand over the long term, to the introduction of the euro has attracted a greatdeal of commentary in the past year. Financial market participants have focusedon the possibility that official reserve managers might shift their assets out of themark and into the dollar in the near term, and then might shift out of the dollar
92
Foreign exchange turnover in emerging currenciesIn billions of US dollars
Currencies Local turnover1 Global turnover
April April March April early19952 19962 19962 19972 19963
Asia >13.61 >17.81 >16.3 >39.4 36.6Indian rupee 1.641 1.21 1.0 n.a. 1.1Indonesian rupiah 4.841 7.841 3.5 10.0 8.5Korean won 3.11 3.21 1.8 2.4 2.4Malaysian ringgit n.a.1 n.a.1 5.0 10.0 9.5New Taiwan dollar 1.51 1.61 n.a. 3.0 1.1Thai baht 2.641 4.041 5.0 14.0 14.0
Latin America 9.11 10.91 >5.8 n.a.Argentine peso 1.71 2.01 n.a. 1.5Brazilian real 4.351 5.551 4.5 n.a.Chilean peso 0.81 0.91 n.a. n.a.Colombian peso 0.141 0.141 0.1 n.a.New Mexican peso 2.11 2.21 1.2 n.a.New Peruvian sol 0.11 0.21 n.a. n.a.
Eastern Europe 1.81 >5.91 >1.6 8.1Czech koruna 0.641 2.541 0.5 5.5Hungarian forint 0.31 0.61 0.3 0.4Polish zloty 0.341 n.a.1 0.3 0.4Russian rouble 0.61 2.61 0.5 1.4Slovak koruna 0.02 0.21 n.a. 0.4
Other currencies 5.41 6.71 >7.4 >7.0New Israeli shekel 0.31 0.51 n.a. n.a.Saudi riyal 1.41 1.51 0.3 n.a.South African rand 3.71 4.71 6.0 6.0Turkish lira 0.014 0.024 1.1 1.0
Total6 >29.91 >41.31 >31.1 >56.1
Note: The countries shown (except South Africa) had aggregate GDP of $3.4 trillion in 1992 or15¤% of world GDP, compared with 80¤% for the countries included in the April 1995 central banksurvey.1 Estimates as reported by the respective central banks, net of double-counting unless otherwisespecified, for a period as near as possible to April. For Thailand, 1995 second half and 1996 annualaverages. For Indonesia and Argentina, annual average. The turnover of the Russian rouble and theSouth African rand in April was well above the annual average. 2 Citibank estimates, net of double-counting. 3 Estimates reported in the Singapore Foreign Exchange Market Committee Annual Report1996. 4 On a gross basis. 5 Includes other currencies. 6 The Central Bank Survey of ForeignExchange and Derivatives Market Activity 1995 reports a grand total (including South Africa) of $1,136.9billion. Table V.6
Bank for International Settlements -- 67th Annual Report

into the euro in the long run. Current international reserve holdings in Europeancurrencies fall far short of the potential importance of the euro area in terms ofoutput and world trade. In particular, after European Union countries’ reserveholdings of each other’s currencies are netted out, the share of EU G-10members in G-10 output and world trade is twice the share of their currenciesin global reserves (Graph V.11).
Four points should be borne in mind in considering possible portfolio shifts.First, the behaviour of euro-area residents could be important in the transition.In a published report, the Swiss authorities discussed the possibility of large shiftsout of the euro into the Swiss franc by such residents. However unlikely thismay be, the discussion underscores the fact that portfolio shifts need not beconfined to investors from outside the euro area.
Secondly, official foreign exchange reserves represent only a small part ofinternational portfolios. At $11⁄2 trillion, official reserves amount to much lessthan total international bonds and (non-bank) deposits outstanding, at over$5 trillion. Moreover, this aggregate does not include the one-quarter of USTreasury securities or the one-third of German public debt securities held bynon-residents, in both cases mostly in the private sector. In an era in whichprivate capital flows have demonstrated their importance, the preoccupation withofficial reserve management seems misplaced.
Thirdly, the behaviour of global liability managers may change in a mannerthat could partly offset, or more than offset, shifts by private asset managers.Debtor countries, for instance, appear to have a very small fraction of theirliabilities denominated in the euro’s predecessor currencies. Larger and more
93
Official reserves inperspective
The euro wouldattract internationalborrowing as wellas investment
Bank for International Settlements -- 67th Annual Report
0
15
30
45
60
75
81 87 93 >99 0
15
30
45
60
75
81 87 93 >99 0
15
30
45
81 87 93 >99
Foreign exchangereservesInternational assets2
International trade GDP
●●
●
●
●
●
●
●●
The international role of the euro, dollar and yenCurrency and country shares, in percentages
EU currencies/EU1 US dollar/United States Japanese yen/Japan
Note: Hypothetical shares beyond 1999 are computed by netting out from most recent observations,respectively: EU holdings of EU currency reserves; EU holdings of EU currency bank assets and EUissuers’ bonds/notes in G-10 EU currencies; and G-10 EU trade with EU countries. Total reserves,assets and G-10 GDP were $1.52 (1.38), 5.1 (3.9) and 19.9 trillion respectively in 1996; G-10 trade was$5.8 (3.9) trillion in 1995 (consolidated totals in brackets).1 G-10 EU countries only. 2 Includes international bonds, cross-border bank liabilities to non-banks,foreign currency liabilities to domestic non-banks (from 1984) and euronotes (from 1989).
Sources: IMF, OECD, BIS and national data. Graph V.11
liquid fixed income markets in euros, as compared with current Europeanmarkets, could encourage debt issuance in the euro.
Lastly, it is easy to overstate the effect of portfolio shifts on exchange rates.In the final analysis, business cycle positions and associated expectations aboutfuture monetary policy, as well as the credibility of the European Central Bank,will play central roles in determining the external value of the euro.
94 Bank for International Settlements -- 67th Annual Report
- 0.2-
0
0.2
0.4
0.6
0.8Russian rouble Polish zloty Czech koruna Hungarian forint
- 0.4-
- 0.2-
0
0.2
0.4
0
0.2
0.4
0.6
0.8
1994 1995 1996 1997
Indonesian rupiahKorean won Thai baht New Taiwan dollar
Malaysian ringgitHong Kong dollar Singapore dollar
Turkish lira South African rand
Saudi riyal Moroccan dirham
New Israeli shekel
Indian rupee Canadian dollar Australian dollar
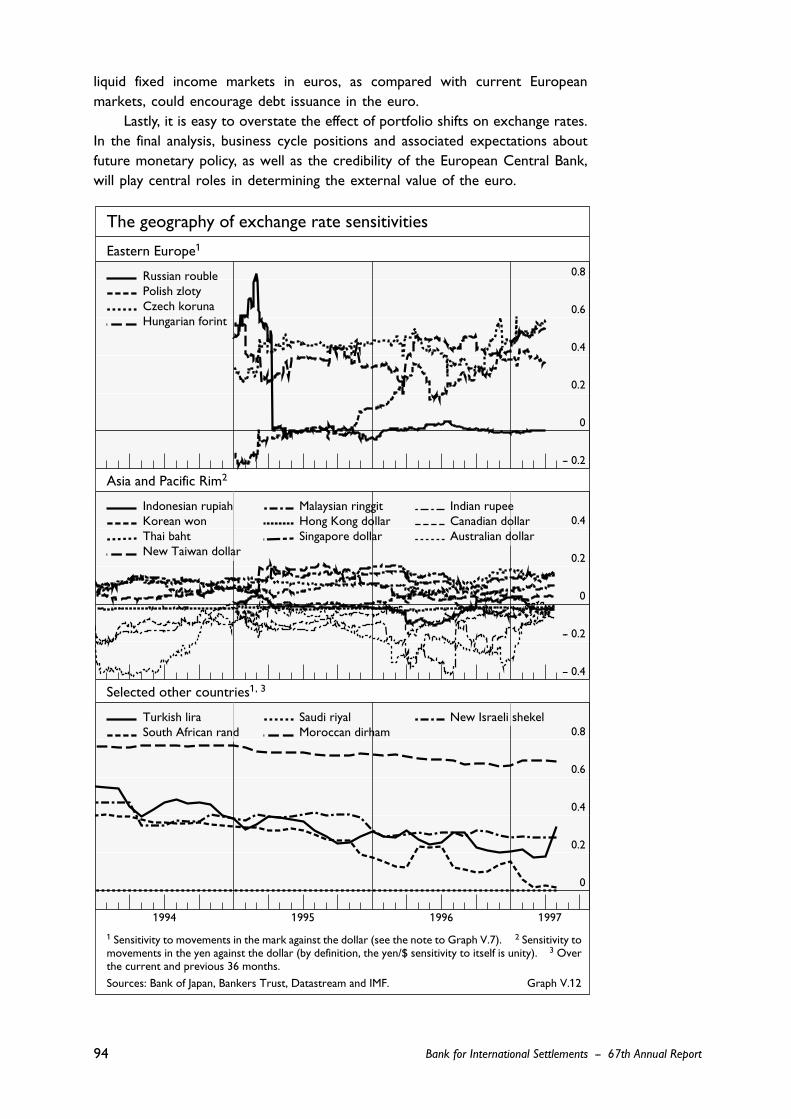
Eastern Europe1
Asia and Pacific Rim2
Selected other countries1, 3
The geography of exchange rate sensitivities
1 Sensitivity to movements in the mark against the dollar (see the note to Graph V.7). 2 Sensitivity tomovements in the yen against the dollar (by definition, the yen/$ sensitivity to itself is unity). 3 Overthe current and previous 36 months.
Sources: Bank of Japan, Bankers Trust, Datastream and IMF. Graph V.12
The euro, dollar and yen as currency anchors
The euro’s international role will depend in part on its use as an anchor currencyby non-G-10 countries. The use of European currencies as an anchor currentlydoes not extend beyond parts of Eastern Europe, Africa and the Middle East, asis indicated by the exchange rate sensitivities of non-G-10 currencies tomovements in the mark/dollar rate (Graph V.12). The dollar, in contrast, servesas an anchor for currencies in the Americas and Asia, for the Australian dollarand even for some Eastern European currencies. The role of the yen as aninternational currency is limited even in Asia, where most currencies tend toshare no more than 10¤% of its movements against the dollar. Foreign exchangeturnover data in emerging markets confirm the limited role of the yen and showmuch higher shares of dollar trading in Asia.
Looking ahead, the exchange rate policies of Russia and China could proveof particular importance. The current dollar orientation of Russian policy andforeign exchange holdings (official and private), as well as the scale of itscommodity exports, favour linkage to the dollar, but growing trade with Europecould shift the balance towards the euro over time. Hong Kong’s fixed link tothe dollar, as well as rapidly expanding trade between the United States andChina, make a reorientation of China’s policy perhaps less likely.
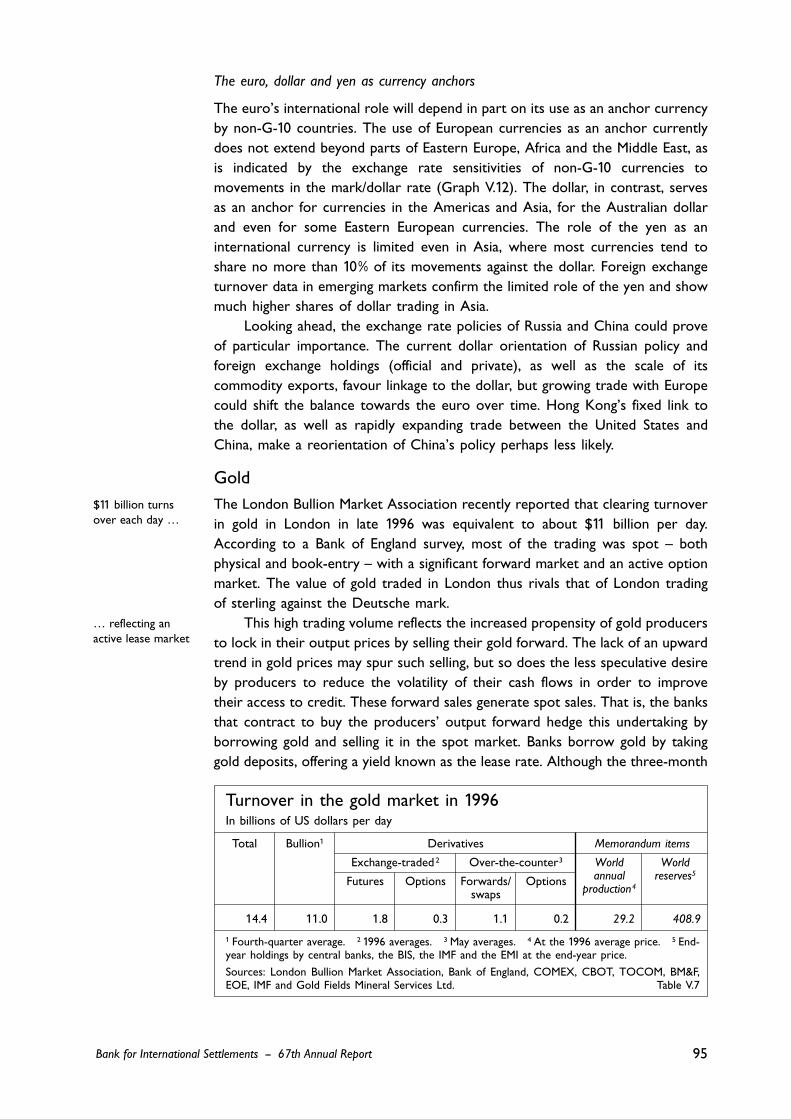
GoldThe London Bullion Market Association recently reported that clearing turnoverin gold in London in late 1996 was equivalent to about $11 billion per day.According to a Bank of England survey, most of the trading was spot – bothphysical and book-entry – with a significant forward market and an active optionmarket. The value of gold traded in London thus rivals that of London tradingof sterling against the Deutsche mark.
This high trading volume reflects the increased propensity of gold producersto lock in their output prices by selling their gold forward. The lack of an upwardtrend in gold prices may spur such selling, but so does the less speculative desireby producers to reduce the volatility of their cash flows in order to improvetheir access to credit. These forward sales generate spot sales. That is, the banksthat contract to buy the producers’ output forward hedge this undertaking byborrowing gold and selling it in the spot market. Banks borrow gold by takinggold deposits, offering a yield known as the lease rate. Although the three-month
95
$11 billion turnsover each day …
… reflecting anactive lease market
Turnover in the gold market in 1996In billions of US dollars per day
Total Bullion1 Derivatives Memorandum items
Exchange-traded2 Over-the-counter3 World World
Futures Options Forwards/ Options annual reserves5
swaps production4
14.4 11.0 1.8 0.3 1.1 0.2 29.2 408.9
1 Fourth-quarter average. 2 1996 averages. 3 May averages. 4 At the 1996 average price. 5 End-year holdings by central banks, the BIS, the IMF and the EMI at the end-year price.
Sources: London Bullion Market Association, Bank of England, COMEX, CBOT, TOCOM, BM&F,EOE, IMF and Gold Fields Mineral Services Ltd. Table V.7
Bank for International Settlements -- 67th Annual Report
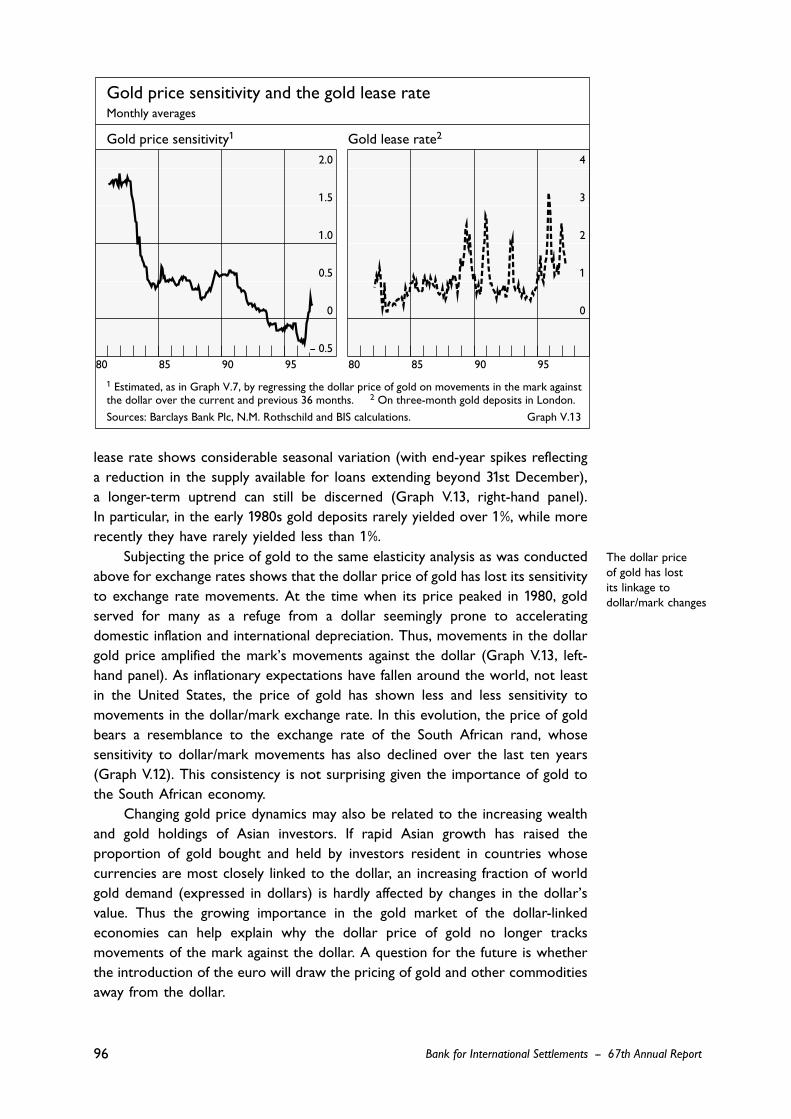
lease rate shows considerable seasonal variation (with end-year spikes reflectinga reduction in the supply available for loans extending beyond 31st December),a longer-term uptrend can still be discerned (Graph V.13, right-hand panel).In particular, in the early 1980s gold deposits rarely yielded over 1%, while morerecently they have rarely yielded less than 1%.
Subjecting the price of gold to the same elasticity analysis as was conductedabove for exchange rates shows that the dollar price of gold has lost its sensitivityto exchange rate movements. At the time when its price peaked in 1980, goldserved for many as a refuge from a dollar seemingly prone to acceleratingdomestic inflation and international depreciation. Thus, movements in the dollargold price amplified the mark’s movements against the dollar (Graph V.13, left-hand panel). As inflationary expectations have fallen around the world, not leastin the United States, the price of gold has shown less and less sensitivity tomovements in the dollar/mark exchange rate. In this evolution, the price of goldbears a resemblance to the exchange rate of the South African rand, whosesensitivity to dollar/mark movements has also declined over the last ten years(Graph V.12). This consistency is not surprising given the importance of gold tothe South African economy.
Changing gold price dynamics may also be related to the increasing wealthand gold holdings of Asian investors. If rapid Asian growth has raised theproportion of gold bought and held by investors resident in countries whosecurrencies are most closely linked to the dollar, an increasing fraction of worldgold demand (expressed in dollars) is hardly affected by changes in the dollar’svalue. Thus the growing importance in the gold market of the dollar-linkedeconomies can help explain why the dollar price of gold no longer tracksmovements of the mark against the dollar. A question for the future is whetherthe introduction of the euro will draw the pricing of gold and other commoditiesaway from the dollar.
96
The dollar priceof gold has lostits linkage todollar/mark changes
Bank for International Settlements -- 67th Annual Report
- 0.5-
0
0.5
1.0
1.5
2.0
80 85 90 95
0
1
2
3
4
80 85 90 95
Gold price sensitivity and the gold lease rate
Gold price sensitivity1 Gold lease rate2
Monthly averages
1 Estimated, as in Graph V.7, by regressing the dollar price of gold on movements in the mark againstthe dollar over the current and previous 36 months. 2 On three-month gold deposits in London.
Sources: Barclays Bank Plc, N.M. Rothschild and BIS calculations. Graph V.13