UW Climate Impacts Group Seminar November 14, 2002 Michael Dalton California State University,...
39
UW Climate Impacts Group Seminar November 14, 2002 Michael Dalton California State University, Monterey Bay The California Rockfish Conservation Area: Climate Fluctuations and Groundfish Trawlers at Moss Landing Harbor
-
date post
21-Dec-2015 -
Category
Documents
-
view
216 -
download
1
Transcript of UW Climate Impacts Group Seminar November 14, 2002 Michael Dalton California State University,...
UW Climate Impacts Group Seminar
November 14, 2002
Michael Dalton California State University, Monterey Bay
The California Rockfish Conservation Area:Climate Fluctuations and
Groundfish Trawlers at Moss Landing Harbor
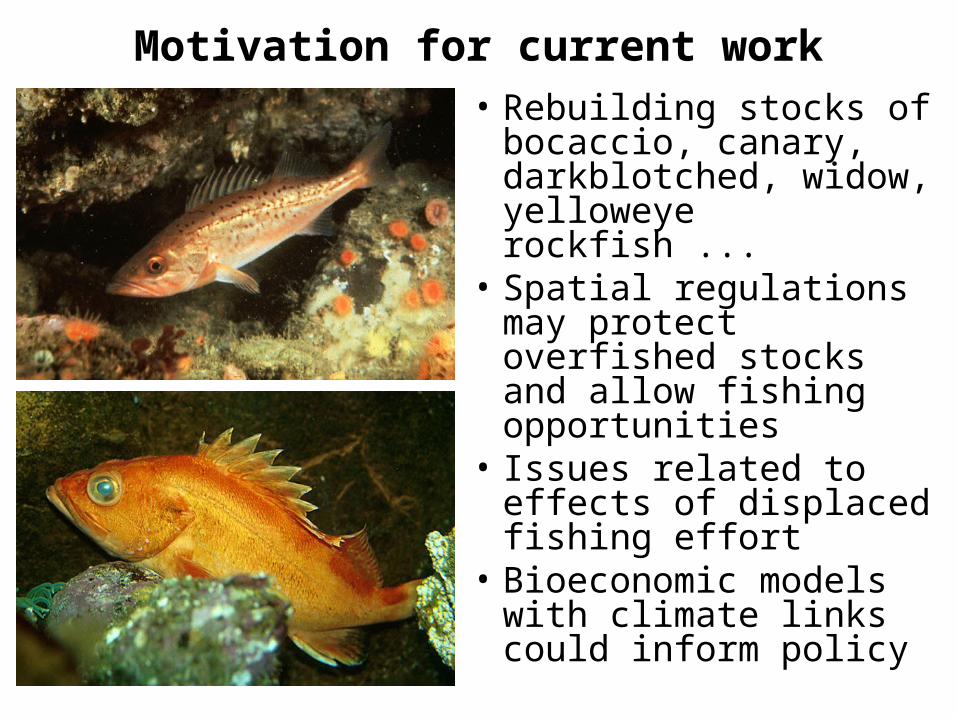
Motivation for current work
• Rebuilding stocks of bocaccio, canary, darkblotched, widow, yelloweye rockfish ...
• Spatial regulations may protect overfished stocks and allow fishing opportunities
• Issues related to effects of displaced fishing effort
• Bioeconomic models with climate links could inform policy
CIG Vision Statement 2001-2005
• Provide fishery managers tools to improve management of … economically and ecologically important fisheries
• Improve regional natural resource management decisions, including new climate information
• Reduce vulnerability of agricultural production to climatic variability and climate change
• Provide decision-making tools including geographical information systems for quantitative policy analysis (Integrated Assessment?)
Economics and global change• Two sides of ecological economics
– Ecosystem valuation– Human behavior
• Human behavior has two key elements– Economic activity drives global change– People respond to economic incentives (e.g.
policy) and adapt to change• Coupled ecological-economic (bioeconomic)
models are a framework for understanding behavior and its effects, and a tool for valuation
• However climatic variability is usually missing
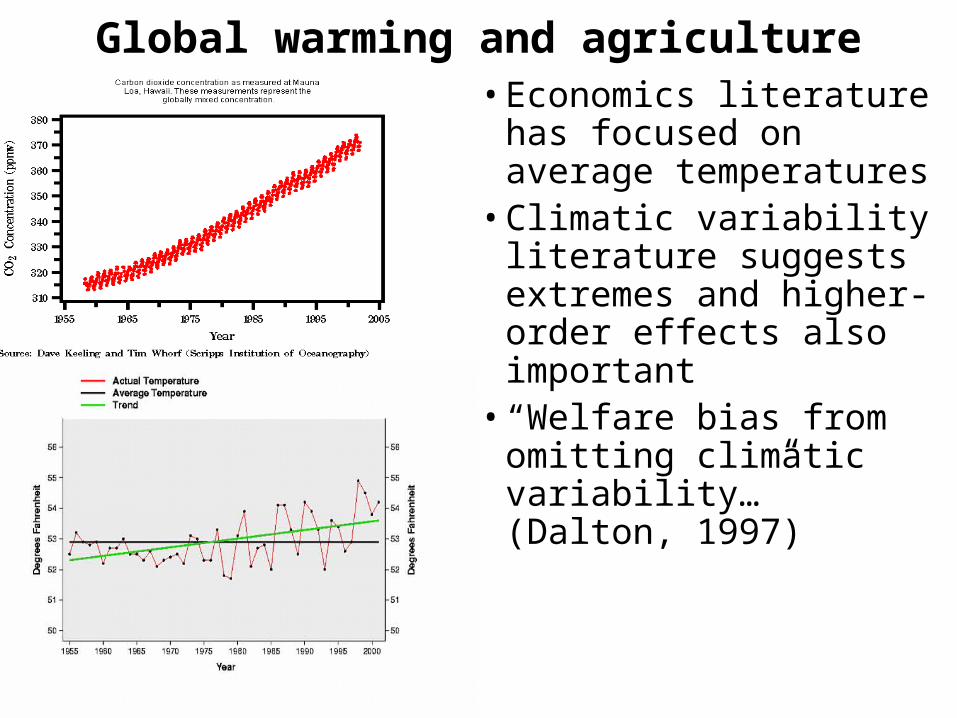
Global warming and agriculture• Economics literature
has focused on average temperatures
• Climatic variability literature suggests extremes and higher-order effects also important
• “Welfare bias from omitting climatic variability…” (Dalton, 1997)
Climatic variability and information• Type of forward-looking behavior important for
predicting responses and measuring effects– Recursive or adaptive expectations– Perfect foresight– Rational expectations
• “Making Climate Forecasts Matter” (NRC, 1999)– Value of climate information depends on type
of expectations– Need to develop and test structural models for
climate sensitive sectors– Testing different behavioral assumptions is
important for policy analysis– Little testing has been done for climate models
Estimating and testing economic models• Testing models for policy analysis familiar
problem to macroeconomists• Lucas and Sargent:
We observe an agent, or collection of agents, behaving through time; we wish to use these observations to infer how this behavior would have differed had the agent's environment been altered in some specified way
• They conclude:the problem of identifying a structural model from a collection of economic time-series must be solved
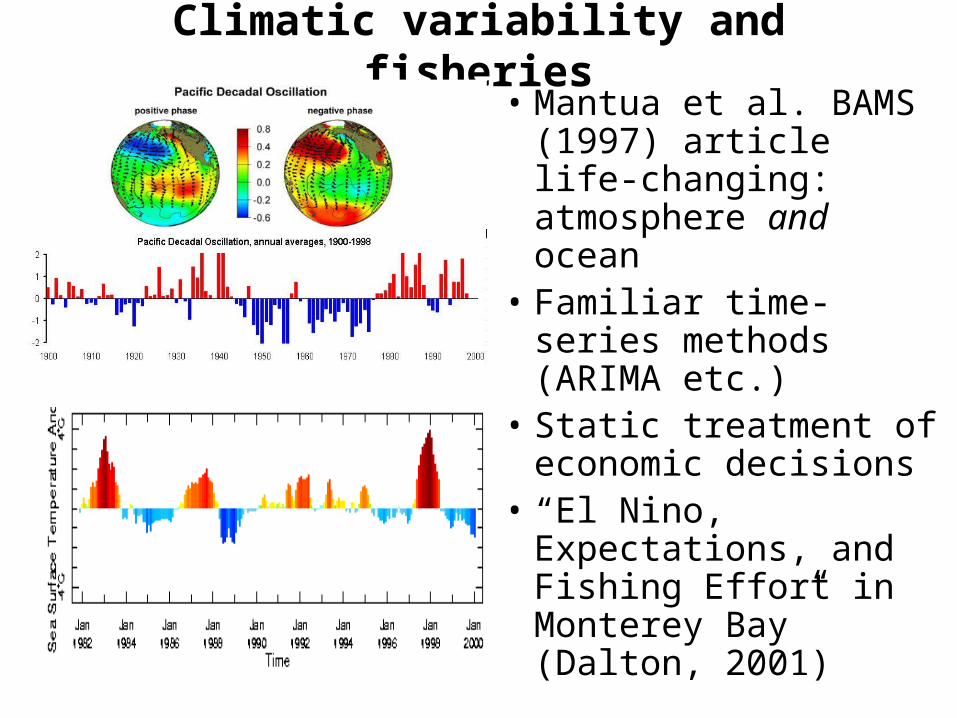
Climatic variability and fisheries• Mantua et al. BAMS
(1997) article life-changing: atmosphere and ocean
• Familiar time-series methods (ARIMA etc.)
• Static treatment of economic decisions
• “El Nino, Expectations, and Fishing Effort in Monterey Bay” (Dalton, 2001)
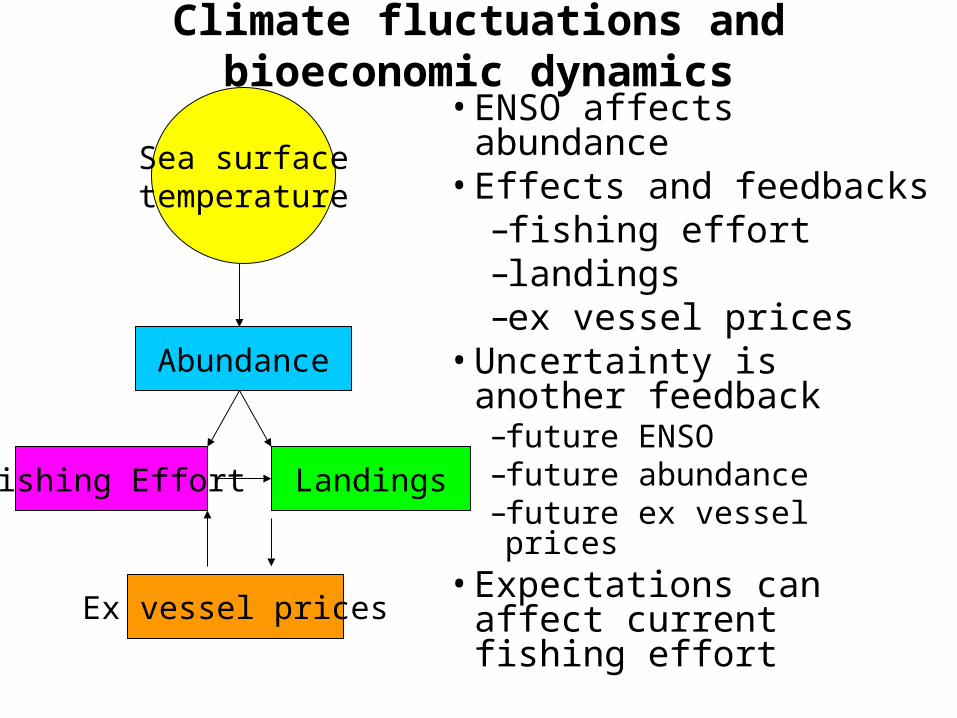
Climate fluctuations and bioeconomic dynamics
• ENSO affects abundance • Effects and feedbacks
–fishing effort–landings–ex vessel prices
• Uncertainty is another feedback–future ENSO–future abundance–future ex vessel prices
• Expectations can affect current fishing effort
Sea surfacetemperature
Fishing Effort Landings
Ex vessel prices
Abundance
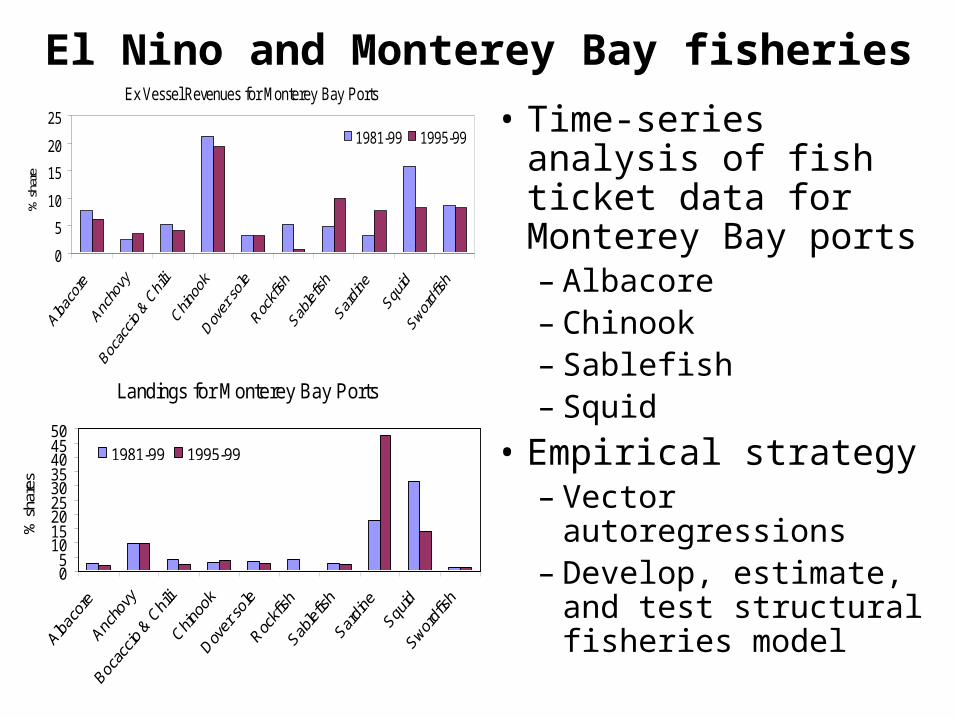
El Nino and Monterey Bay fisheries
• Time-series analysis of fish ticket data for Monterey Bay ports– Albacore– Chinook – Sablefish– Squid
• Empirical strategy– Vector autoregressions– Develop, estimate, and
test structural fisheries model
Ex Vessel Revenues for Monterey Bay Ports
0
5
10
15
20
25
% s
hare
1981-99 1995-99
Landings for Monterey Bay Ports
05
101520253035404550
% s
hare
s
1981-99 1995-99
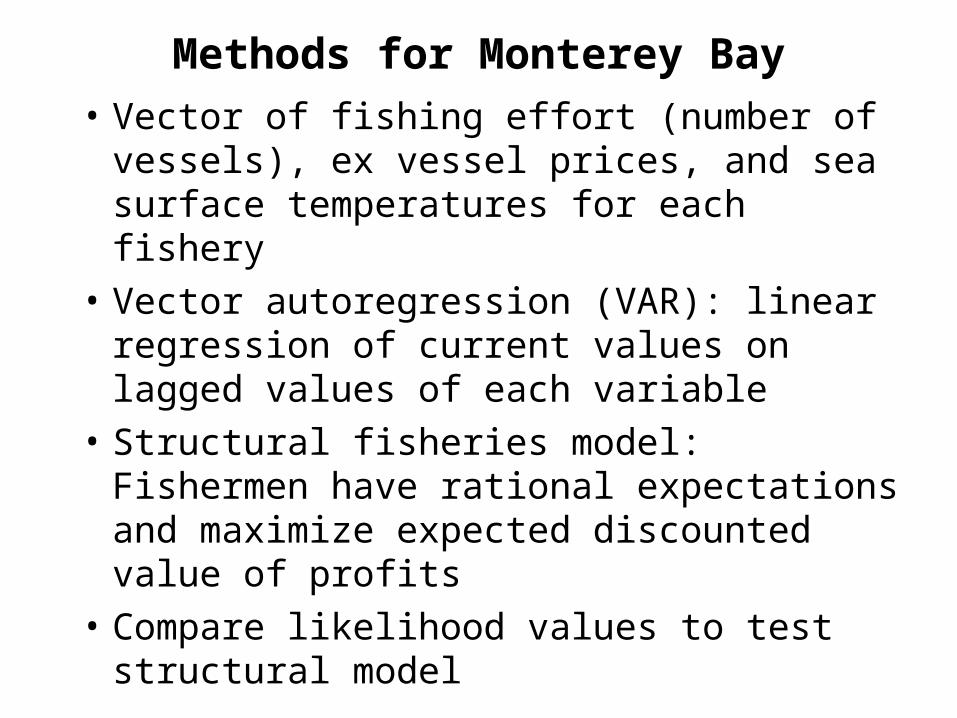
Methods for Monterey Bay
• Vector of fishing effort (number of vessels), ex vessel prices, and sea surface temperatures for each fishery
• Vector autoregression (VAR): linear regression of current values on lagged values of each variable
• Structural fisheries model: Fishermen have rational expectations and maximize expected discounted value of profits
• Compare likelihood values to test structural model
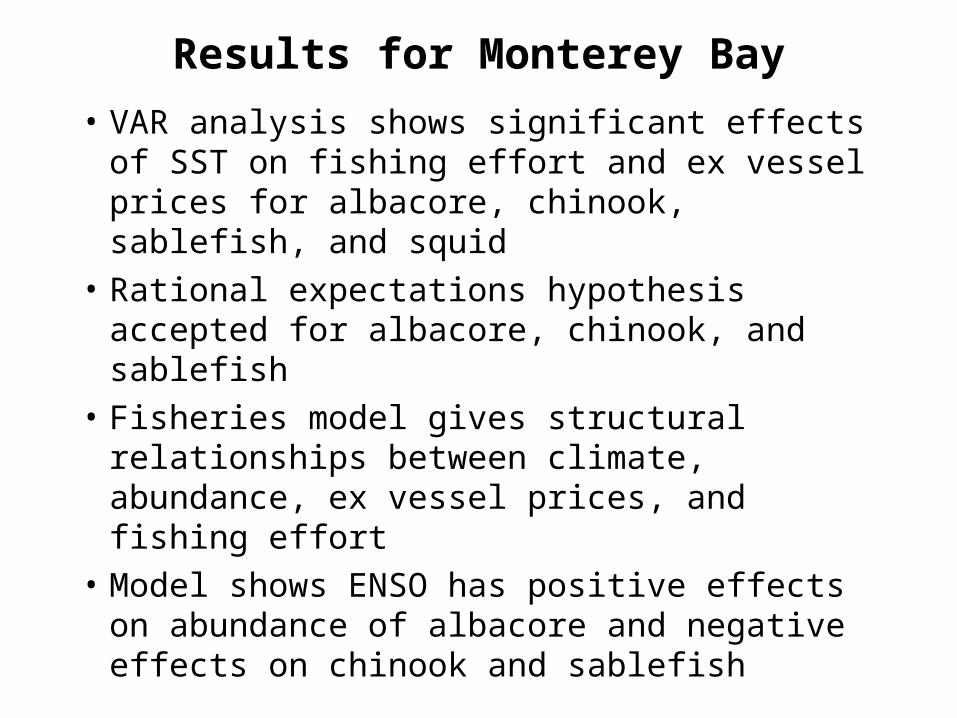
Results for Monterey Bay
• VAR analysis shows significant effects of SST on fishing effort and ex vessel prices for albacore, chinook, sablefish, and squid
• Rational expectations hypothesis accepted for albacore, chinook, and sablefish
• Fisheries model gives structural relationships between climate, abundance, ex vessel prices, and fishing effort
• Model shows ENSO has positive effects on abundance of albacore and negative effects on chinook and sablefish
Climate fluctuations and spatial management
• Goal of bioeconomic models to inform management
• Recent management actions are spatial– Marine reserve size and location– 2003 West Coast groundfish regulations
• Follow similar empirical strategy with spatial and dynamic structural fisheries model– Spatial and temporal interactions enrich and
complicate analysis– Computational “curse of dimensionality”
• Case study: Moss Landing groundfish trawlers and California Rockfish Conservation Area
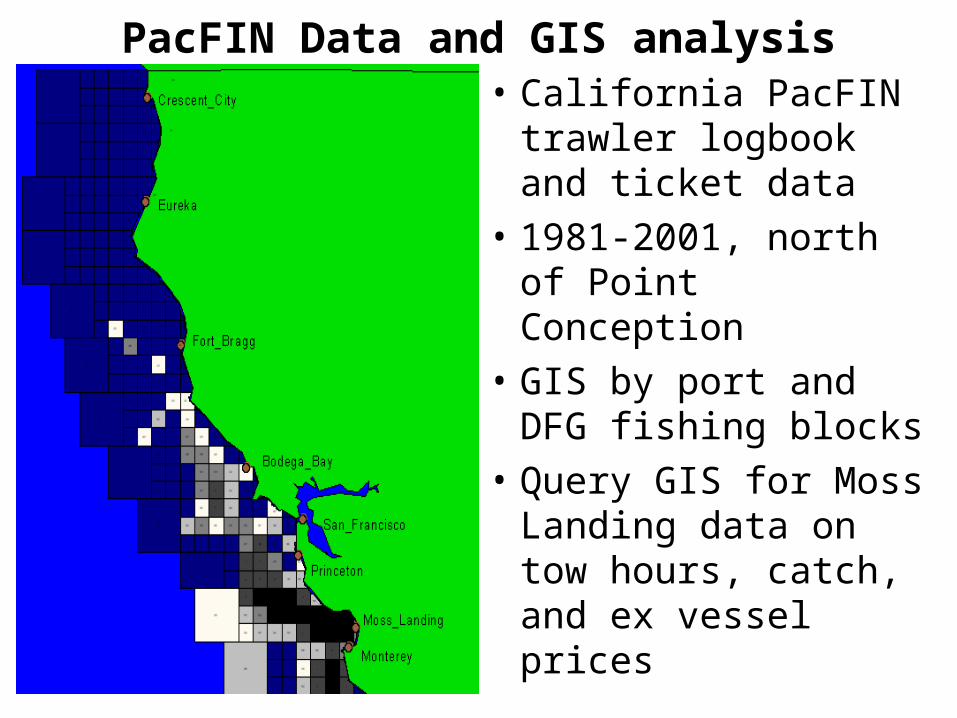
PacFIN Data and GIS analysis• California PacFIN
trawler logbook and ticket data
• 1981-2001, north of Point Conception
• GIS by port and DFG fishing blocks
• Query GIS for Moss Landing data on tow hours, catch, and ex vessel prices
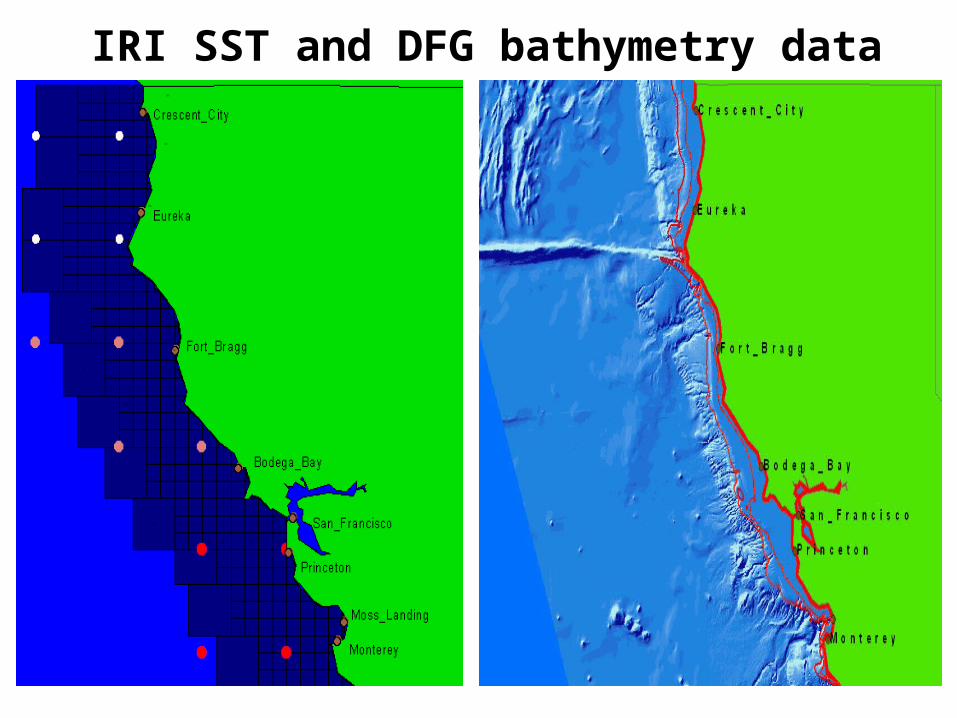
IRI SST and DFG bathymetry data
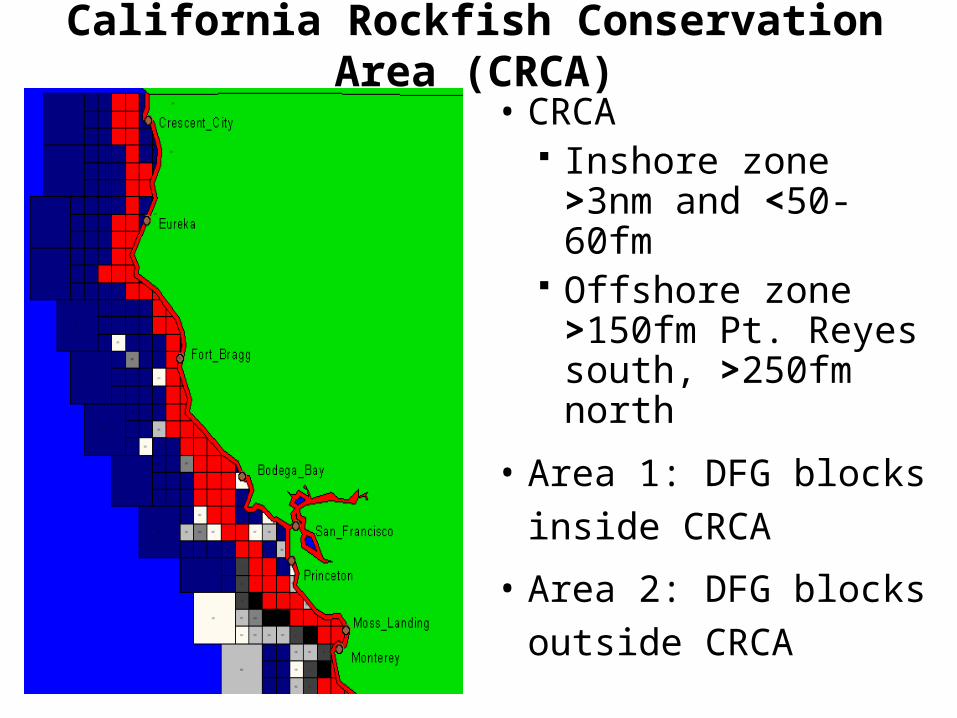
California Rockfish Conservation Area (CRCA)
• CRCA Inshore zone
>3nm and <50-60fm Offshore zone
>150fm Pt. Reyes south, >250fm north
• Area 1: DFG blocks
inside CRCA
• Area 2: DFG blocks
outside CRCA
Data for vector autoregression (VAR) analysis
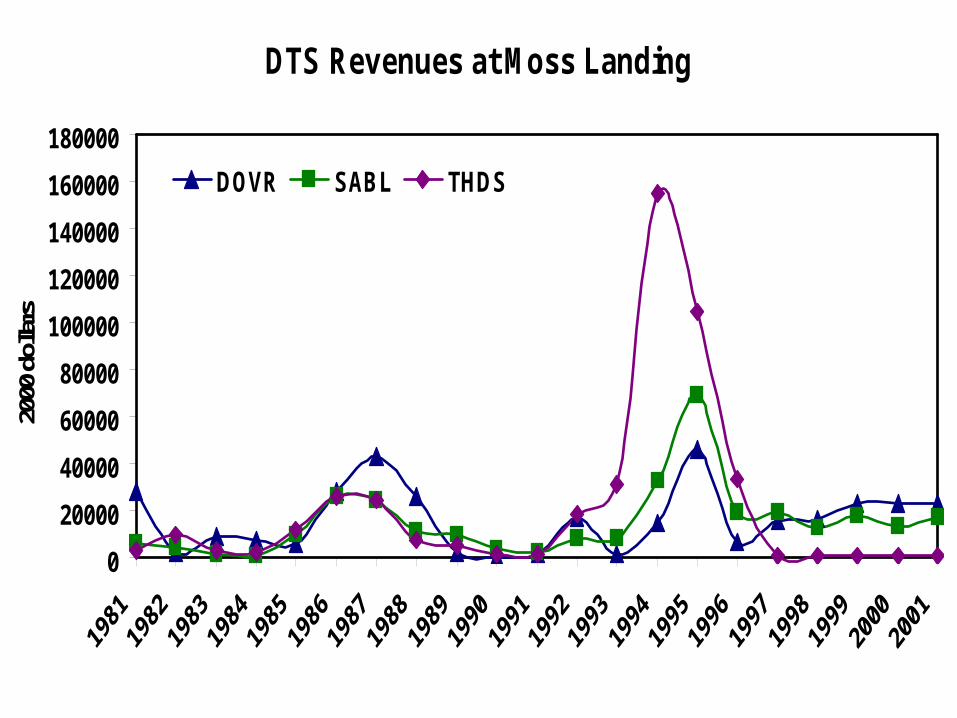
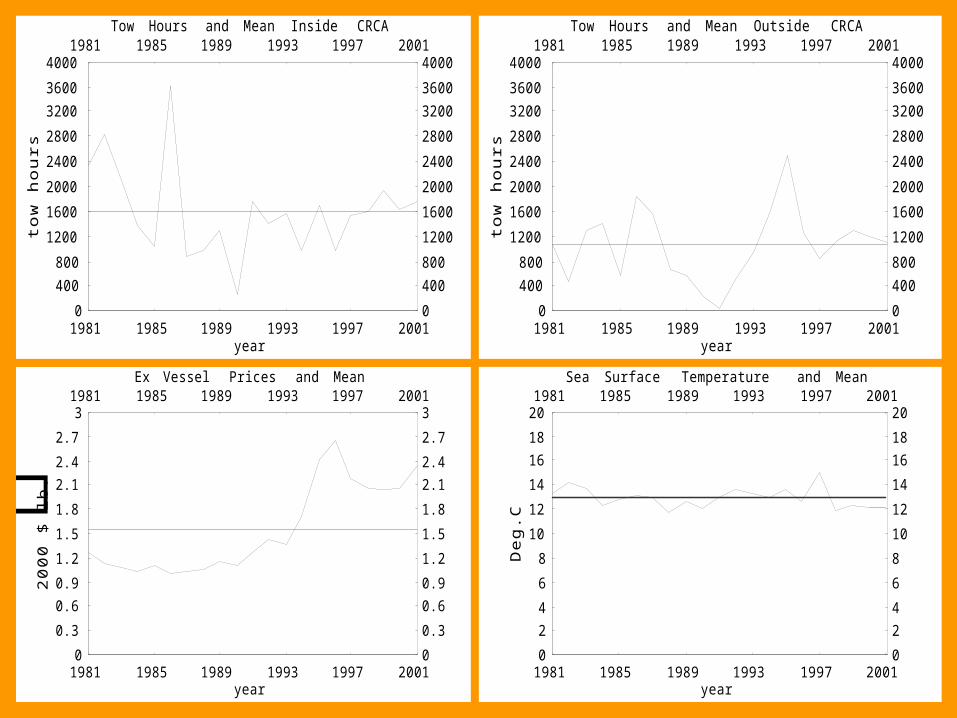
• Compile time series data for Moss Landing Total tow hours for blocks inside and outside
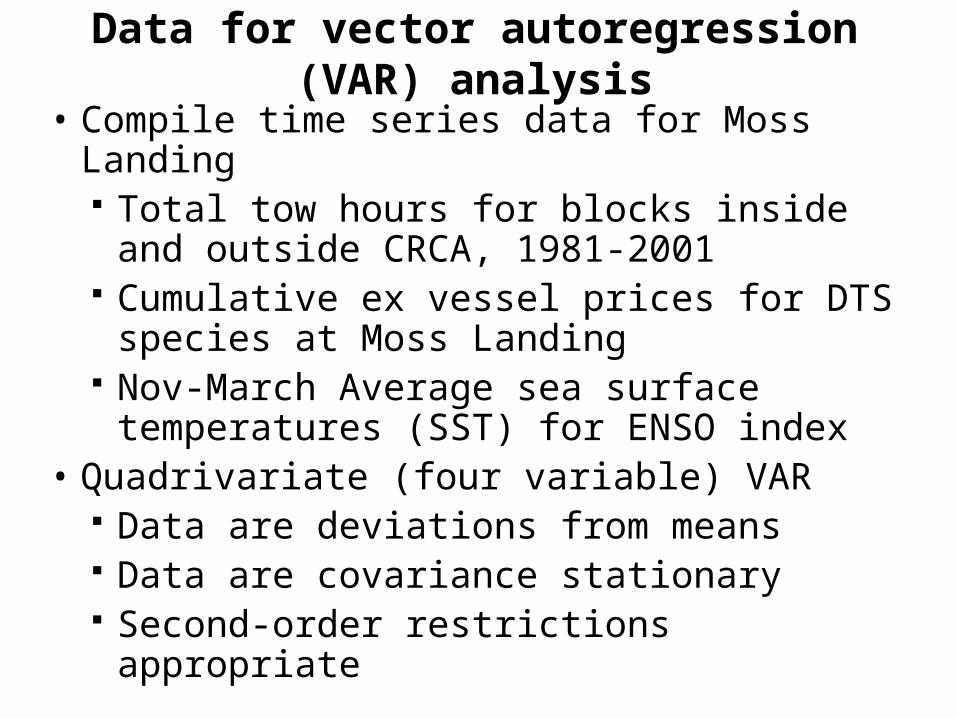
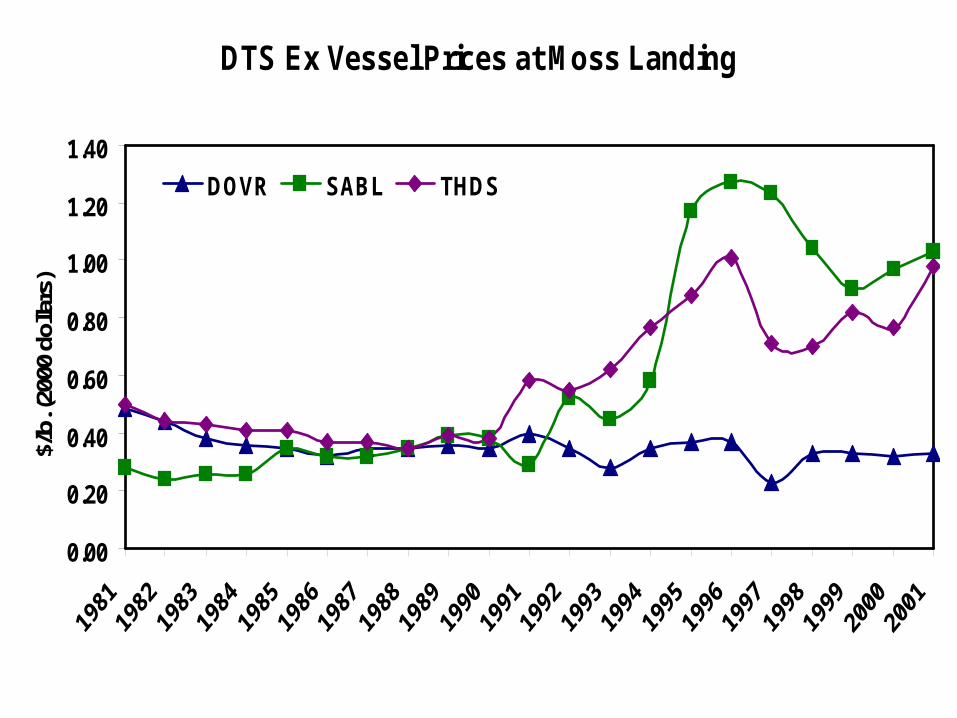
CRCA, 1981-2001 Cumulative ex vessel prices for DTS species
at Moss Landing Nov-March Average sea surface temperatures
(SST) for ENSO index• Quadrivariate (four variable) VAR
Data are deviations from means Data are covariance stationary Second-order restrictions appropriate
DTS Ex Vessel Prices at Moss Landing
0.00
0.20
0.40
0.60
0.80
1.00
1.20
1.40
$/lb
. (20
00 d
olla
rs)
DOVR SABL THDS
DTS Revenues at Moss Landing
0
20000
40000
60000
80000
100000
120000
140000
160000
180000
2000
dol
lars
DOVR SABL THDS
1981 1985 1989 1993 1997 2001year
040080012001600200024002800320036004000
wotsruoh
1981 1985 1989 1993 1997 2001
040080012001600200024002800320036004000
Tow Hours and Mean Inside CRCA
1981 1985 1989 1993 1997 2001year
040080012001600200024002800320036004000
wotsruoh
1981 1985 1989 1993 1997 2001
040080012001600200024002800320036004000
Tow Hours and Mean Outside CRCA
1981 1985 1989 1993 1997 2001year
00.30.60.91.21.51.82.12.42.73
0002$bl.
1981 1985 1989 1993 1997 2001
00.30.60.91.21.51.82.12.42.73
Ex Vessel Prices and Mean
1981 1985 1989 1993 1997 2001year
02468101214161820
geD.C
1981 1985 1989 1993 1997 2001
02468101214161820
Sea Surface Temperature and Mean
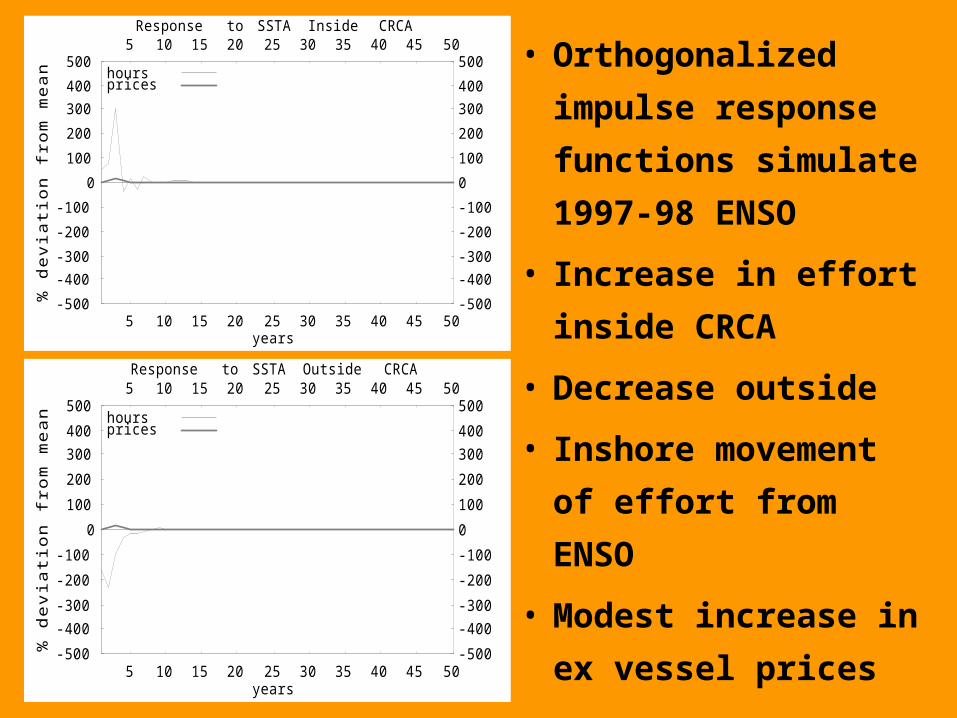
• Orthogonalized
impulse response
functions simulate
1997-98 ENSO
• Increase in effort
inside CRCA
• Decrease outside
• Inshore movement of
effort from ENSO
• Modest increase in ex
vessel prices
5 10 15 20 25 30 35 40 45 50years
-500-400-300-200-100
0100200300400500
%noitaived
morfnaem
5 10 15 20 25 30 35 40 45 50
-500-400-300-200-1000100200300400500
Response to SSTA Inside CRCA
hoursprices
5 10 15 20 25 30 35 40 45 50years
-500-400-300-200-100
0100200300400500
%noitaived
morfnaem
5 10 15 20 25 30 35 40 45 50
-500-400-300-200-1000100200300400500
Response to SSTA Outside CRCA
hoursprices
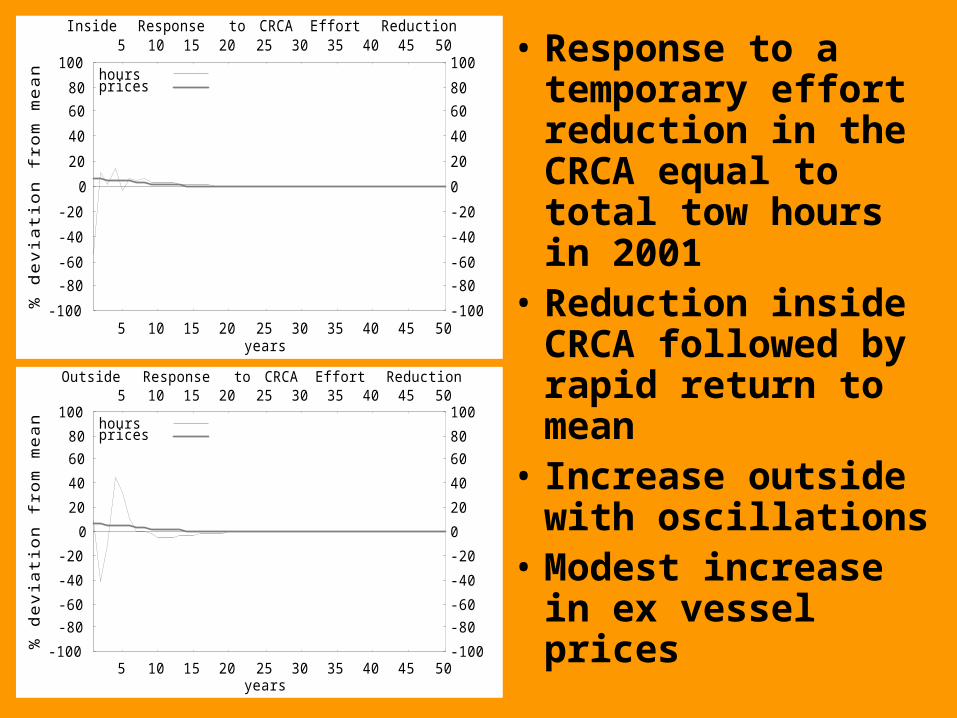
• Response to a temporary effort reduction in the CRCA equal to total tow hours in 2001
• Reduction inside CRCA followed by rapid return to mean
• Increase outside with oscillations
• Modest increase in ex vessel prices
5 10 15 20 25 30 35 40 45 50years
-100-80-60-40-20020406080
100
%noitaived
morfnaem
5 10 15 20 25 30 35 40 45 50
-100-80-60-40-20020406080100
Inside Response to CRCA Effort Reduction
hoursprices
5 10 15 20 25 30 35 40 45 50years
-100-80-60-40-20020406080
100
%noitaived
morfnaem
5 10 15 20 25 30 35 40 45 50
-100-80-60-40-20020406080100
Outside Response to CRCA Effort Reduction
hoursprices
Granger causality tests
• Multivariate test rejects excluding effort outside
CRCA from the VAR at 5% significance level • Effort outside CRCA could be Granger causing:
1. Ex vessel prices
2. Fishing effort inside CRCA
3. SST (fishermen’s expectations)• Bioeconomic model here allows 3 only
• Bivariate tests inconclusive
• T-statistics from VAR support 3
Bioeconomic Model components
• Two area model with stochastic dynamics
• Net RPUE A t depends on
Effort H t in the area (crowding externality)
Abundance N t in the area (dynamic externality)
Ex vessel prices P t at the port
• A t = f 0 + f 1 H t + f 2 N t + f 3 P t
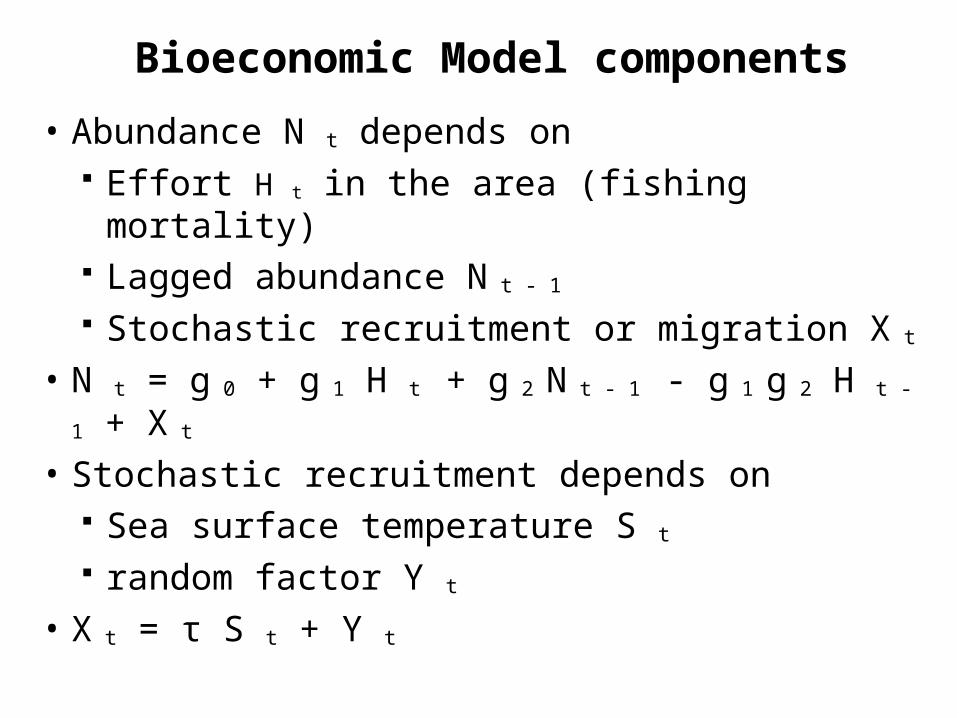
Bioeconomic Model components
• Abundance N t depends on Effort H t in the area (fishing mortality) Lagged abundance N t - 1
Stochastic recruitment or migration X t
• N t = g 0 + g 1 H t + g 2 N t - 1 - g 1 g 2 H t - 1 + X t
• Stochastic recruitment depends on Sea surface temperature S t random factor Y t
• X t = τ S t + Y t
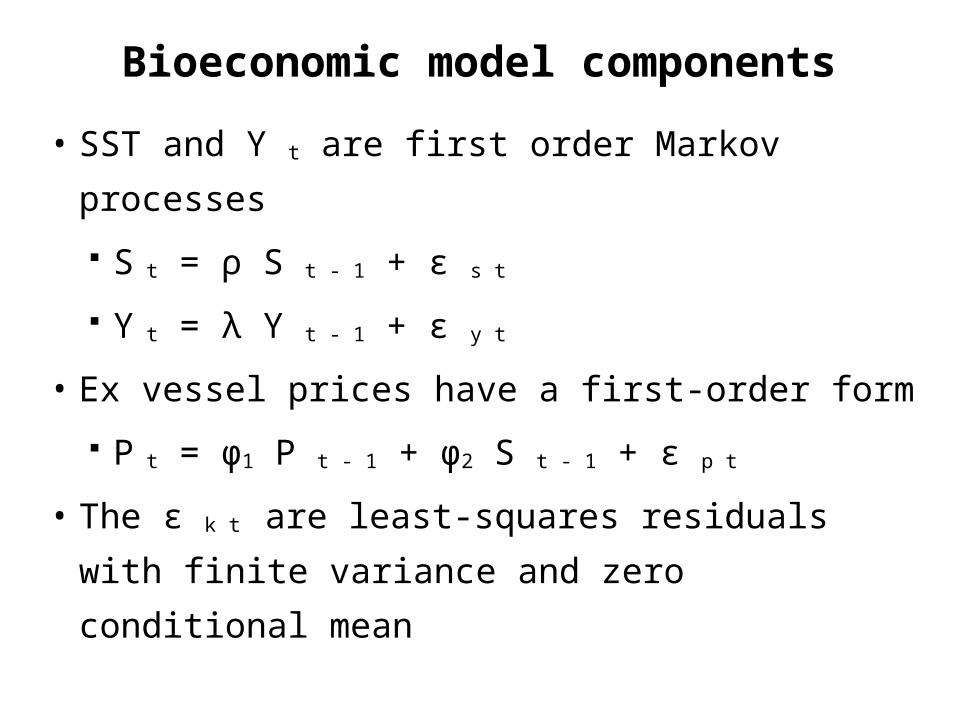
Bioeconomic model components
• SST and Y t are first order Markov processes
S t = ρ S t - 1 + ε s t
Y t = λ Y t - 1 + ε y t
• Ex vessel prices have a first-order form
P t = φ1 P t - 1 + φ2 S t - 1 + ε p t
• The ε k t are least-squares residuals with finite
variance and zero conditional mean
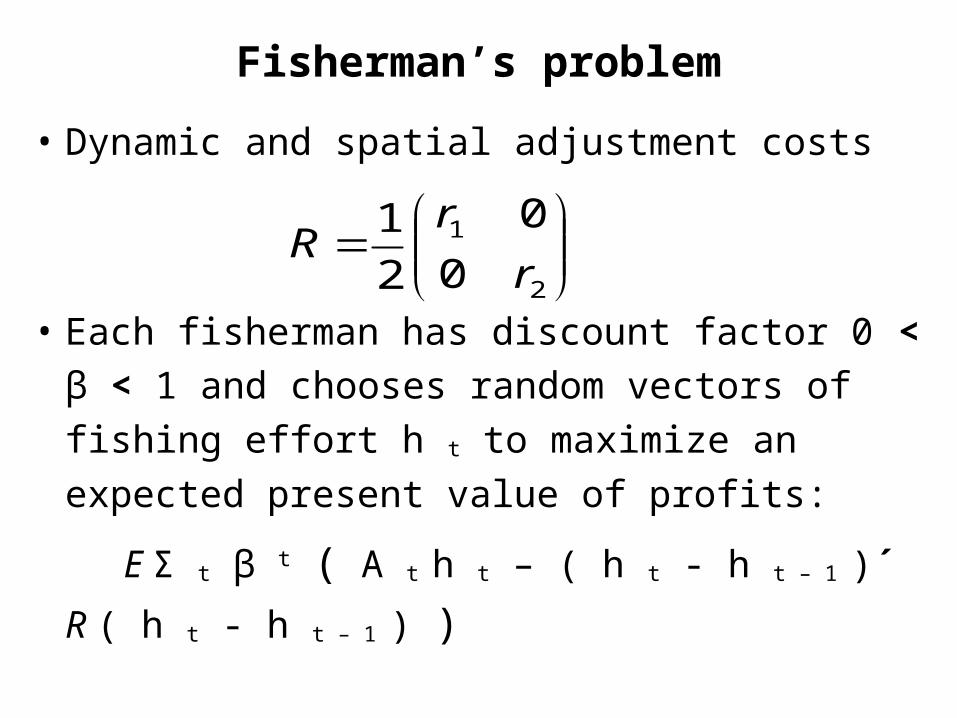
Fisherman’s problem
• Dynamic and spatial adjustment costs
• Each fisherman has discount factor 0 < β < 1 and
chooses random vectors of fishing effort h t to
maximize an expected present value of profits:
E Σ t β t ( A t h t – ( h t - h t – 1 )´ R ( h t - h t – 1 ) )
2
1
0
0
2
1
r
rR
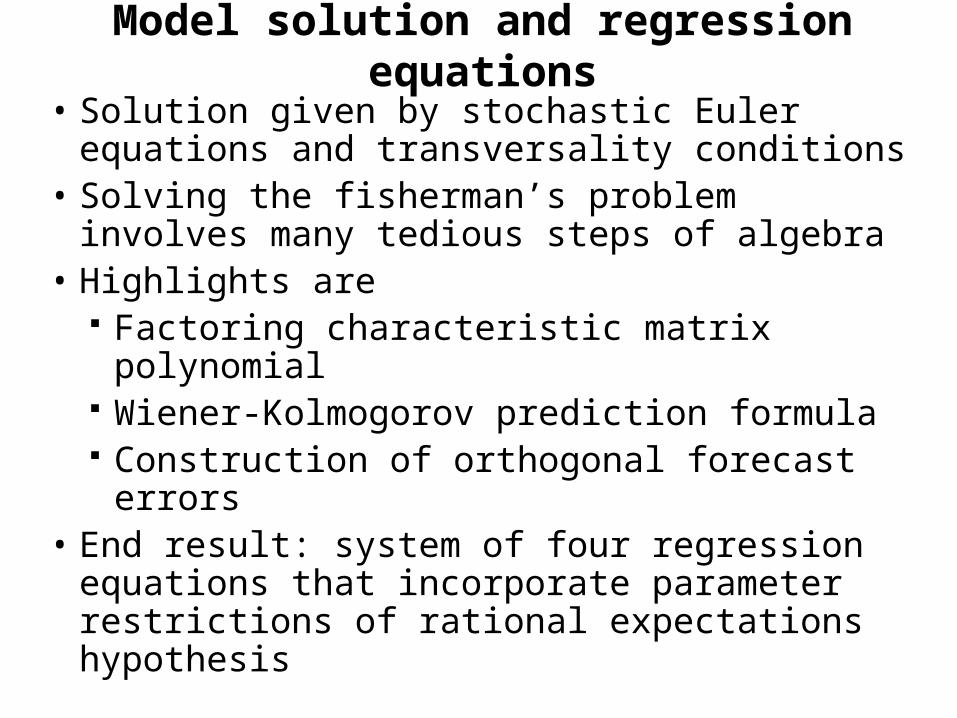
Model solution and regression equations
• Solution given by stochastic Euler equations and transversality conditions
• Solving the fisherman’s problem involves many tedious steps of algebra
• Highlights are Factoring characteristic matrix polynomial Wiener-Kolmogorov prediction formula Construction of orthogonal forecast errors
• End result: system of four regression equations that incorporate parameter restrictions of rational expectations hypothesis
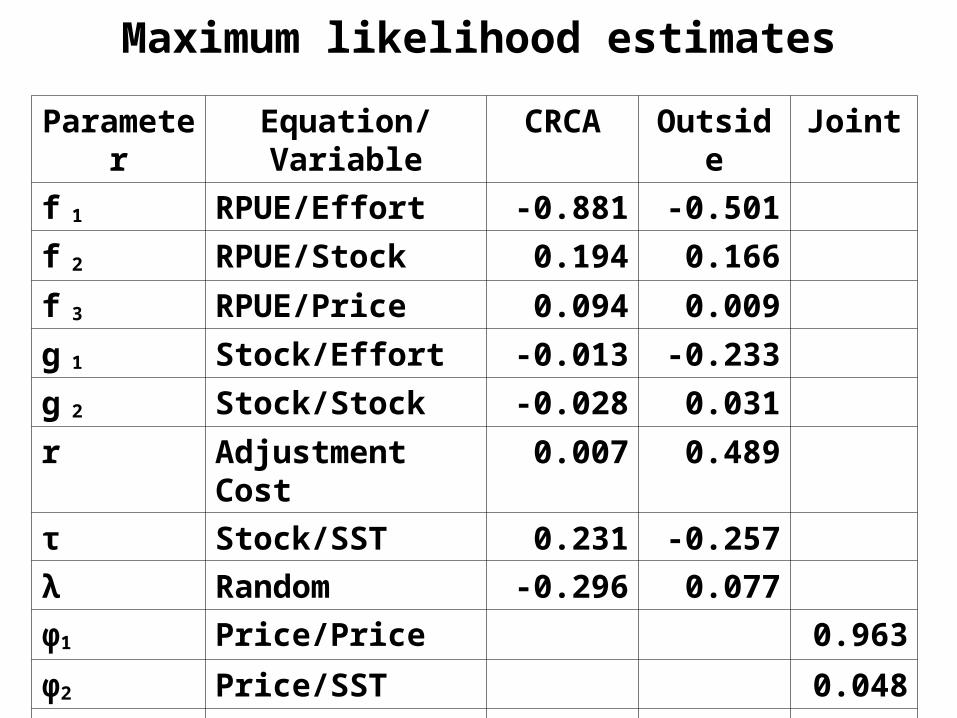
Maximum likelihood estimates
Parameter Equation/Variable CRCA Outside Joint
f 1 RPUE/Effort -0.881 -0.501
f 2 RPUE/Stock 0.194 0.166
f 3 RPUE/Price 0.094 0.009
g 1 Stock/Effort -0.013 -0.233
g 2 Stock/Stock -0.028 0.031
r Adjustment Cost 0.007 0.489
τ Stock/SST 0.231 -0.257
λ Random -0.296 0.077
φ1 Price/Price 0.963
φ2 Price/SST 0.048
ρ SST -0.126
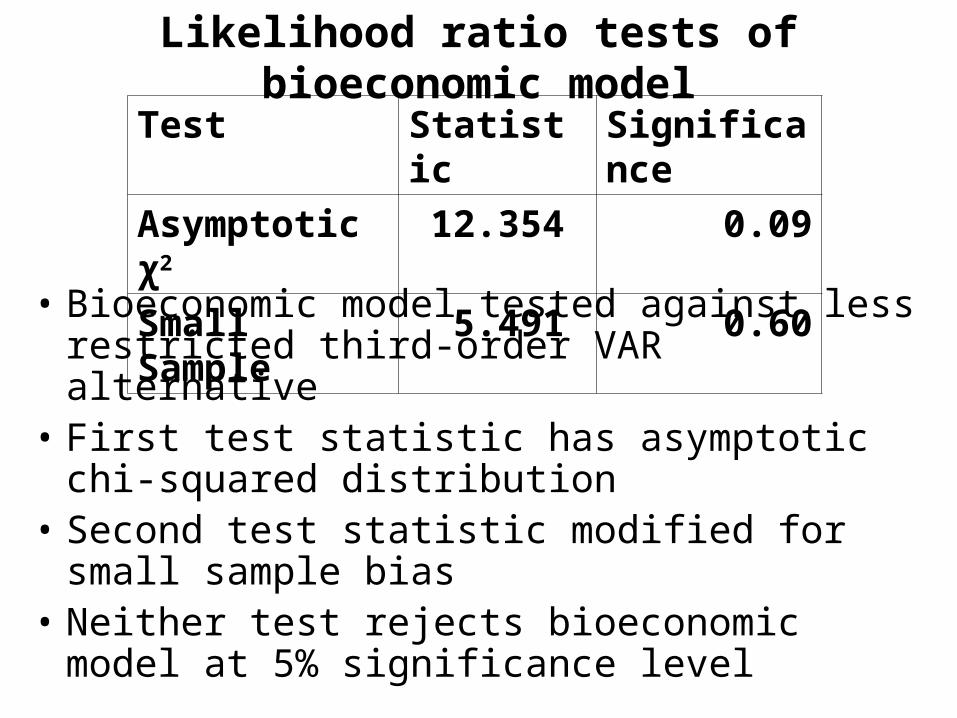
Likelihood ratio tests of bioeconomic model
• Bioeconomic model tested against less restricted third-order VAR alternative
• First test statistic has asymptotic chi-squared distribution
• Second test statistic modified for small sample bias
• Neither test rejects bioeconomic model at 5% significance level
Test Statistic Significance
Asymptotic χ2 12.354 0.09
Small Sample 5.491 0.60

Conclusions
• VAR analysis shows significant differences inside and outside CRCA Inshore movement from ENSO Effort displacement from CRCA
• Bioeconomic model gives reasonable results RPUE inside CRCA more sensitive to vessel
crowding RPUE inside CRCA more sensitive to changes
in ex vessel prices Adjustment costs greater outside CRCA Stock/SST effects support VAR results

Next steps for data and model development
• Historical regulatory data including trip limits for DTS species from SAFE documents
• Species detail from stock assessments, rebuilding analyses, etc. to identify additional parameters and estimate bycatch
• Relax model assumptions to predict effort shifts
1. Adjustment costs
2. Stock recruitment and migration
3. Address effort and ex vessel prices
Acknowledgements
• National Marine Fisheries Service, Division of Statistics and Economics
• California Seagrant
• William Daspit (PSMFC/PacFIN),
• Rita Curtis (NMFS), Church Grimes (NMFS), Pat Iampietro (CSUMB), Carrie Pomeroy (UCSC), Rick Starr (CSG), Cindy Thomson (NMFS), Charlie Wahle (NOAA MPA Center), Gina Wade (CDFG), Nancy Wright (CDFG)
Community effects and integrated assessment
• Structural models for climate sensitive sectors do not measure full social effects of climate variability
• Multiplier effects are often present in economic systems
– For example, Post 9/11 decline in demand for air travel
– Effects cascade through hospitality and entertainment sectors
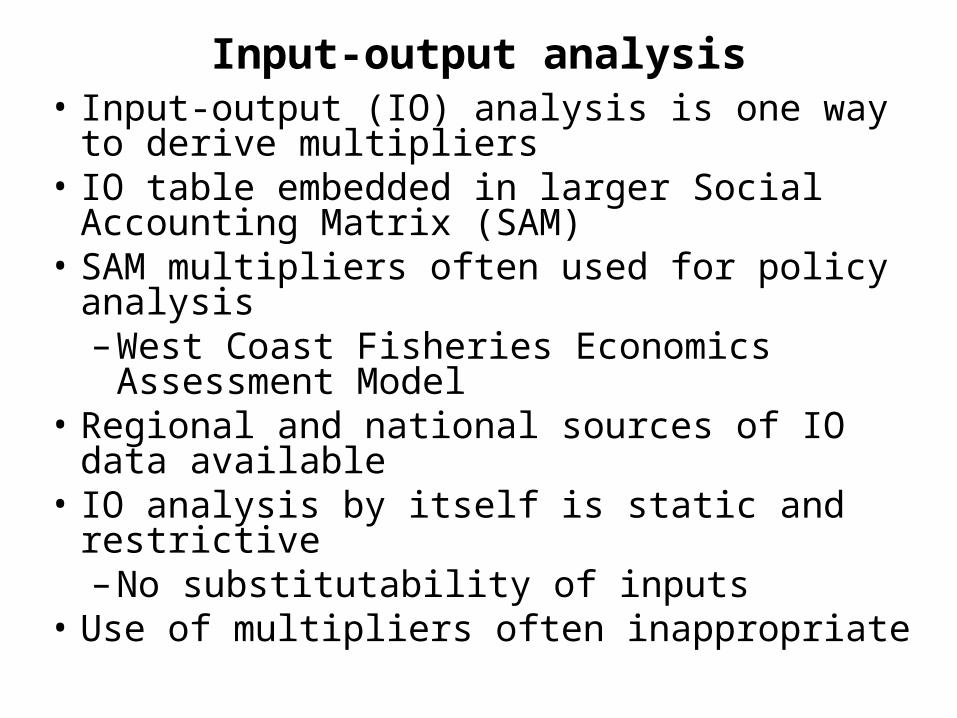
Input-output analysis• Input-output (IO) analysis is one way to derive
multipliers• IO table embedded in larger Social Accounting
Matrix (SAM)• SAM multipliers often used for policy analysis
– West Coast Fisheries Economics Assessment Model
• Regional and national sources of IO data available
• IO analysis by itself is static and restrictive– No substitutability of inputs
• Use of multipliers often inappropriate
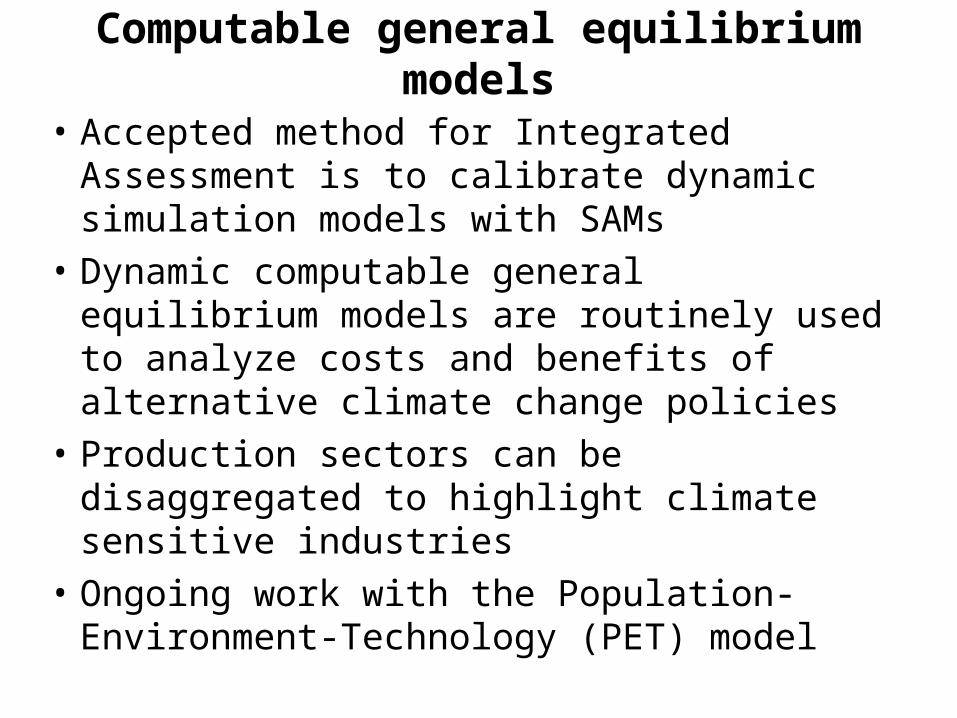
Computable general equilibrium models
• Accepted method for Integrated Assessment is to calibrate dynamic simulation models with SAMs
• Dynamic computable general equilibrium models are routinely used to analyze costs and benefits of alternative climate change policies
• Production sectors can be disaggregated to highlight climate sensitive industries
• Ongoing work with the Population-Environment-Technology (PET) model
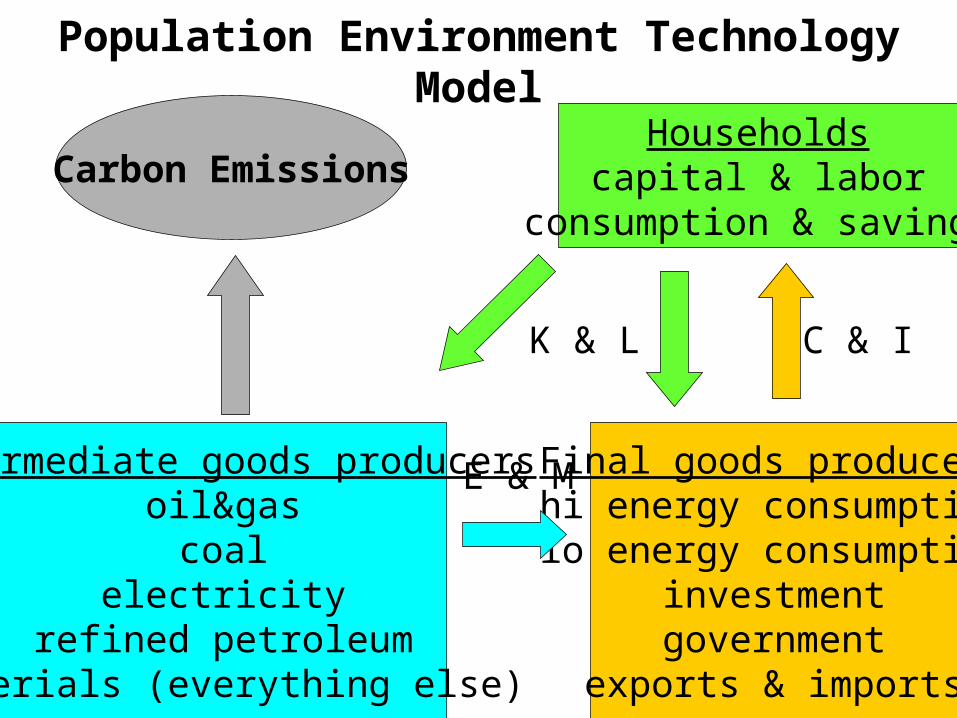
Population Environment Technology Model
Householdscapital & labor
consumption & savings
Final goods producershi energy consumptionlo energy consumption
investmentgovernment
exports & imports
Intermediate goods producersoil&gas
coalelectricity
refined petroleummaterials (everything else)
K & L C & I
E & M
Carbon Emissions
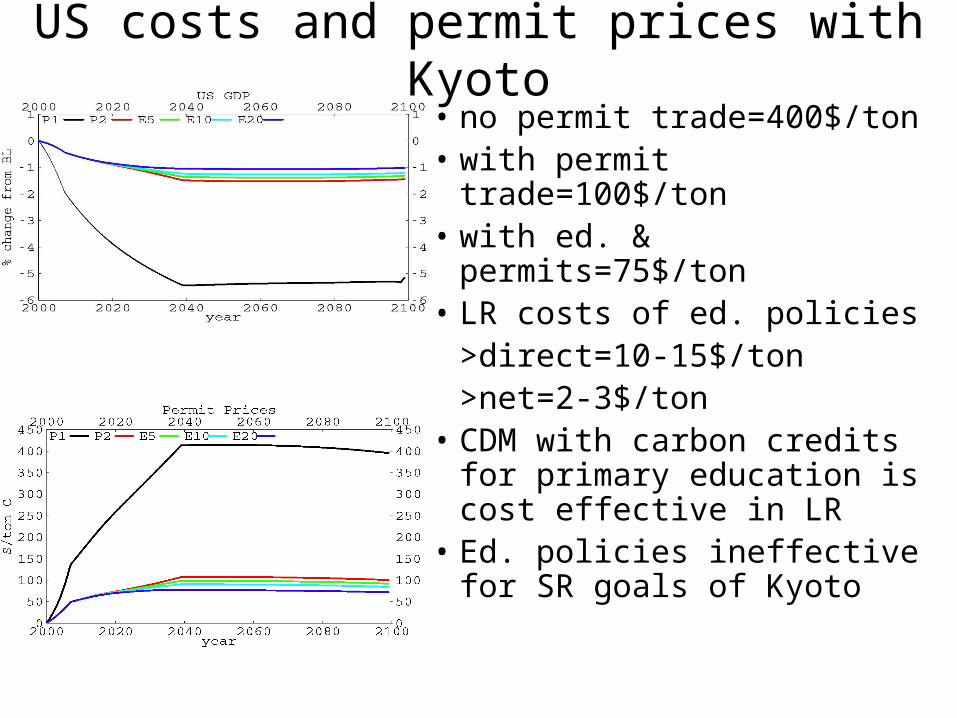
• no permit trade=400$/ton• with permit trade=100$/ton• with ed. & permits=75$/ton• LR costs of ed. policies
>direct=10-15$/ton>net=2-3$/ton
• CDM with carbon credits for primary education is cost effective in LR
• Ed. policies ineffective for SR goals of Kyoto
US costs and permit prices with Kyoto
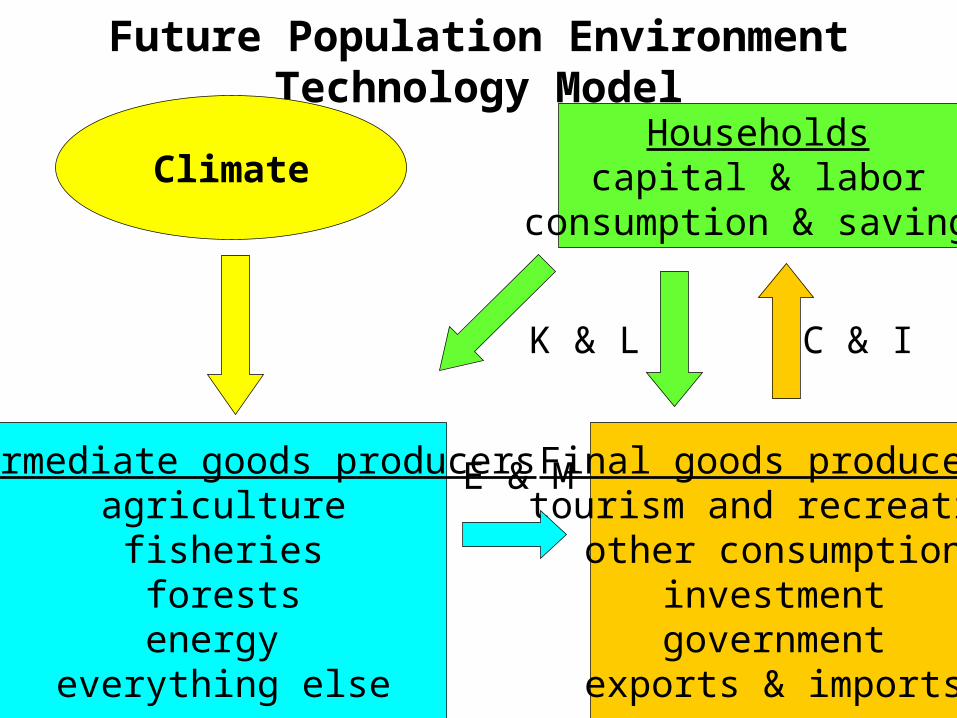
Future Population Environment Technology Model
Householdscapital & labor
consumption & savings
Final goods producerstourism and recreation
other consumptioninvestmentgovernment
exports & imports
Intermediate goods producersagriculturefisheriesforestsenergy
everything else
K & L C & I
E & M
Climate