
UvA-DARE (Digital Academic Repository) Further insights … · Z.A. Bhuiyan R. Rosso J.M. Kalman...
13
UvA-DARE is a service provided by the library of the University of Amsterdam (http://dare.uva.nl) UvA-DARE (Digital Academic Repository) Further insights into inheritable arrhythmia syndromes: Focus on electrocardiograms Postema, P.G. Link to publication Citation for published version (APA): Postema, P. G. (2010). Further insights into inheritable arrhythmia syndromes: Focus on electrocardiograms General rights It is not permitted to download or to forward/distribute the text or part of it without the consent of the author(s) and/or copyright holder(s), other than for strictly personal, individual use, unless the work is under an open content license (like Creative Commons). Disclaimer/Complaints regulations If you believe that digital publication of certain material infringes any of your rights or (privacy) interests, please let the Library know, stating your reasons. In case of a legitimate complaint, the Library will make the material inaccessible and/or remove it from the website. Please Ask the Library: http://uba.uva.nl/en/contact, or a letter to: Library of the University of Amsterdam, Secretariat, Singel 425, 1012 WP Amsterdam, The Netherlands. You will be contacted as soon as possible. Download date: 30 May 2018
Transcript of UvA-DARE (Digital Academic Repository) Further insights … · Z.A. Bhuiyan R. Rosso J.M. Kalman...

UvA-DARE is a service provided by the library of the University of Amsterdam (http://dare.uva.nl)
UvA-DARE (Digital Academic Repository)
Further insights into inheritable arrhythmia syndromes: Focus on electrocardiograms
Postema, P.G.
Link to publication
Citation for published version (APA):Postema, P. G. (2010). Further insights into inheritable arrhythmia syndromes: Focus on electrocardiograms
General rightsIt is not permitted to download or to forward/distribute the text or part of it without the consent of the author(s) and/or copyright holder(s),other than for strictly personal, individual use, unless the work is under an open content license (like Creative Commons).
Disclaimer/Complaints regulationsIf you believe that digital publication of certain material infringes any of your rights or (privacy) interests, please let the Library know, statingyour reasons. In case of a legitimate complaint, the Library will make the material inaccessible and/or remove it from the website. Please Askthe Library: http://uba.uva.nl/en/contact, or a letter to: Library of the University of Amsterdam, Secretariat, Singel 425, 1012 WP Amsterdam,The Netherlands. You will be contacted as soon as possible.
Download date: 30 May 2018

03The response of the QT-interval to the
brief tachycardia provoked by standing
A bedside test for diagnosing Long-QT syndrome
Journal of the American College of Cardiology
2010;55:1955-1961
S. ViskinP.G. PostemaZ.A. Bhuiyan
R. RossoJ.M. Kalman
J.K. VohraM.E. Guevara-Valdivia
M.F. MarquezE. Kogan
B. BelhassenM. Glikson
B. StrasbergC. Antzelevitch
A.A.M. Wilde
Tel Aviv, Shavi and Rabin Medical Centers, Tel Aviv, IsraelAcademic Medical Center, Amsterdam, The Netherlands
Royal Melbourne Hospital, Melbourne, AustraliaUMAE Hospital Dr. Antonio Fraga-Mouret CMN La-Raza IMSS and
Instituto Nacional de Cardiologia, Mexico City, MexicoMasonic Medical Research Laboratory, Utica, New York, USA

Chapter 03
| 48
ABSTRACT
Objectives This study was undertaken to determine if the short-lived sinus tachycardia that occurs during standing will expose changes in the QT-interval of diagnostic value.
Background The QT shortens during heart rate acceleration but this response is not instantaneous. We tested whether the transient, sudden sinus tachycardia that occurs during standing would expose abnormal QT prolongation in patients with long QT syndrome (LQTS).
Methods Patients (68 LQTS [LQT1: 46%, LQT2: 41%, LQT3: 4%, not genotyped: 9%] and 82 controls) underwent a baseline electrocardiogram (ECG) while resting in the supine position and were then asked to get up quickly and stand still during continuous ECG recording. The QT-interval was studied at baseline and during maximal sinus tachycardia, maximal QT prolongation and maximal “QT-stretching.”
ResultsIn response to brisk standing, patients and controls responded with similar heart rate acceleration of 28±10 beats/min (p=0.261). However, the response of the QT-interval to this tachycardia differed. On average the QT-interval of controls shortened by 21±19ms while the QT-interval of LQTS-patients increased by 4±34ms (p<0.001). Since the RR-interval shortened more than the QT, during maximal tachycardia the QTc increased by 50±30ms in the control-group and by 89±47ms in the LQTS-group (p<0.001). Receiver operator curves showed that the test adds diagnostic value. The response of the QT-interval to brisk standing was particularly impaired in patients with LQT2.
Conclusions Evaluation of the response of the QT-interval to the brisk tachycardia induced by standing provides important information that aids in the diagnosis of LQTS.

QT interval stretching for diagnosing LQTS
49 |
INTRODUCTION
The diagnosis of the long QT syndrome (LQTS) is straightforward when torsade de pointes is documented in a patient with obvious QT prolongation.1,2 Often, however, diagnosing LQTS is problematic for several reasons: first, arrhythmic symptoms occur infrequently, making it difficult to document torsade de pointes. Second, overlap in the duration of the QT-interval exists between carriers of LQTS-mutations and healthy controls.3 Third, failing to identify a mutation does not exclude the diagnosis of LQTS and misinterpreting innocent genetic changes as “mutations” may occur.4 Thus, diagnosing LQTS remains a challenge.5
The QT-interval shortens during tachycardia but adaptation of the QT-interval to sudden heart rate acceleration is not instantaneous.6,7 Moreover, patients with LQTS often display abnormal responses to heart rate changes.8,9 We therefore aimed to take advantage of the abrupt sinus tachycardia that normally occurs during standing to evaluate whether maladaptation of the QT-interval to heart rate acceleration would expose pathologic QT-changes in LQTS-patients.
METHODS.
Patient groups. The LQTS-Group consisted of patients with high-probability for LQTS (International LQTS-Registry Score ≥4 points10) or definite LQTS (documented torsade de pointes and/or LQTS mutation). The control group consisted of healthy volunteers (92%) and asymptomatic relatives of LQTS-patients who are non-carriers of the familial mutation (8%) that take no medications. The study was approved by our Institutional Review Committee.
Interventions. LQTS-patients taking beta-blockers underwent the test 26 to 30 hours after their last dosage. For the test, participants rested supine for 10 minutes. They then got-up quickly and remained standing for 5 minutes during continued ECG recording. Implanted devices were programmed to single-chamber ventricular pacing at 35 beats/min for the duration of the test.
Measurements. As subjects stand up, there are movement related artifacts that preclude QT measurements for ≤5 s followed by transient sinus tachycardia. One investigator, blinded to the patients’ grouping, performed the measurements specified below at 4 points in time: 1) Baseline: during the maximal sinus bradycardia recorded as the patient rested supine; 2) Maximal Tachycardia: during the fastest sinus rate achieved in response to standing; 3) Maximal QT: at the time of maximal prolongation (if any) of the QT-interval during the first 30 s after standing and 4)

Chapter 03
| 50
Maximal QT-Stretching: time where (due to R-R shortening without QT-shortening) the end of the T-wave gets nearest to the next P-wave. At all these stages the QTc was corrected for the heart rate using Bazett’s formula. We then repeated our analysis with the Fridericia and Framingham formulas.
Statistics. To examine the hypothesis that rapid standing influences QT parameters of LQTS-patients and controls differently, analysis of variance (ANOVA) for repeated measures was preformed with the RR, QT and QTc as dependent variables and with stage (i.e., baseline, maximal tachycardia, etc.) and subject’s status (LQTS or control) as between-subject variable. Contrast analysis was then preformed to compare QT-parameters in relation to baseline for both patient groups. We excluded from this analysis all patients with obviously long and obviously normal QT-intervals at baseline because additional tests are superfluous for them.5 Accordingly, we limited this analysis to males with baseline QTc 390-450ms and to females with QTc 400-480ms.5 DeLong and DeLong’s method (nonparametric comparison of areas under multiple correlated ROC curves) was used to compared ROC curves before and after standing. Discriminant analysis was performed to examine the best separation between the two groups. For this purpose, 70% of the total sample was randomly selected and a discriminant U-function was applied in a stepwise method. Simple comparisons between the two groups of patients were done using student’s t-test for continuous variables and Chi-square for categorical variables. Two tailed p-value ≤0.05 was considered significant. Values >1.5 times or >3 times the inter-quartile range are termed regular outliers and extreme outliers, respectively. The SPSS statistical package was used for all statistical evaluation (SSPS Inc. Chicago, IL, USA).
RESULTS
The study cohort consisted of 68 LQTS-patients and 82 controls subjects. Among LQTS-patients, 31(46%) have LQT1, 28(41%) LQT2 and 3(4%) LQT3 and 6(9%) have unsuccessfully genotyped LQTS. Patients and controls were of similar age. We recruited a similar number of healthy males and females for the control group whereas female gender predominated in the LQTS group. (Table 1, Figure 1A).
Normal response of the QT-interval to standingIn response to standing, the sinus rate increased within 10 s to 95±14 beats/min (Table 1). Males and females had similar heart rate acceleration (p=0.7) and the response of their QT-interval to this heart rate speeding was similar (the QT shortened by 21±19ms in both genders, p=0.8). Since the QT decreased less than the RR-interval during standing-induced tachycardia, the QTc of controls increased (by 50±28ms [12±7%] in males and by 50±32ms

QT interval stretching for diagnosing LQTS
51 |
[13±9%] in females, p=0.9).
Response of patients with LQTSThe LQTS-patients and controls had similar heart rate acceleration in response to standing (Table 1). However, the response of their QT-interval to this sudden change in heart rate was different (Figures 2, 3 and 4). During maximal sinus tachycardia, the QT of controls shortened by ≥20ms in 59%, remained unchanged (varied by <20ms) in 39% and increased by ≥20ms in only 2%. In contrast, among LQTS-patients, the QT shortened in only 24%, remained unchanged in 43% and actually increased in 34% (p<0.001). Thus, while the averaged QT of controls shortened by 21±19ms, the QT of LQTS-patients hardly changed (it lengthened by 4±34ms, p<0.001, Figure 1E). Consequently, during maximal tachycardia the QTc of controls increased by only 50±30ms (13±8% from baseline), whereas the QTc of LQTS-patients increased by 89±47ms (20±11% from baseline, p<0.001, Figure 1F).
We then identified the complex with longest uncorrected QT-interval during standing-induced tachycardia. Despite a similar heart rate at this point, only the QT of LQTS-patients had increased in comparison to baseline [by 37±44ms (p=0.001)].
Table 1 Baseline characteristics and response to standing
Controlsubjects(n=82)
LQTS patients(n=68) p value
Age (years) 35± 10 32±15 0.154
Female gender 38(46) 50(74) 0.001
Baseline heart rate (beats/min) 68±10 65±11 0.166
Baseline QT (ms) 383±28 449±48 <0.001
Baseline QTc (ms) 405±25 465± 44 <0.001
Response to standing
Time to maximal heart rate (s) 9.8±4.1 9.6±4.3 0.847
Increment in heart rate (beats/min) 28±10 26±11 0.261
Maximal heart rate (beats/min) 95±14 91±13 0.053
ΔQT during maximal tachycardia (ms) -21±19 4±34 <0.001
ΔQTc during maximal tachycardia (ms) 50±30 89±47 <0.001
ΔQT during longest QT (ms) -5±34 37±44 <0.001
ΔQTc during longest QT (ms) 48±42 100±54 <0.001
ΔQT during maximal QT-stretching (ms) -15±30 13±38 <0.001
ΔQTc during maximal QT-stretching (ms) 54±38 94±49 <0.001Data are mean±SD or n(%). ∆QT, QT interval change from baseline; ∆QTc, corrected QT interval change from baseline; QTc, corrected QT.

Chapter 03
| 52
At the point of maximal QT-stretching the QTc increased by 54±38ms in controls and by 94±49ms in LQTS-patients, p<0.001 (figure 1D). Ventricular extrasystoles representing early-afterdepolarizations1 or T-wave alternans were observed during maximal QT-stretching in 4 LQTS-patients (Figure 4).
Analysis of our results after excluding LQTS-patients with very long baseline QT or with unknown genotype, or with the use of Fridericia’s or Framingham formulas, also showed that the difference in QTc between LQTS-patients and controls at all stages of the test was statistically significant.
Comparison of LQT1 and LQT2Patients with LQT1 and LQT2 had similar baseline QT/QTc intervals and developed similar heart rate acceleration upon standing (Table 2). However, the groups had discordant
Figure 1 . Box plots of results obtained in LQTS patients and control subjects
The colored boxes represent the interquartile range (25th to 75th percentiles). The red boxes represent long QT syndrome (LQTS) patients; the gray boxes represent control subjects. The black line in the middle of the box is the 50th percentile, and the bars represent the range of results excluding outliers. Solid black circles indicate outliers and * indicate extreme outliers; ∆QT, QT interval change from baseline; ∆QTc, corrected QT interval change from baseline.
700
600
500
400
700
600
500
400
700
600
500
400
700
600
500
400
100
50
0
-50
200
150
100
50
0
700
500
450
400
550
350
300
700
500
400
600
300
A B C D
E F G H
Controls LQTS Controls LQTS Controls LQTS Controls LQTS
Controls LQTS Controls LQTS LQT1 LQT2 LQT1 LQT2
QTc duringbaseline
QTc at maximaltachycardia
QTc duringmaximal QT
QTc duringQT-stretching
∆QT at maximaltachycardia
∆QTc at maximaltachycardia
QTc duringbaseline
QTc at maximaltachycardia
p<0.001 p<0.001 p<0.001 p<0.001
p<0.001 p<0.001 p=0.445 p=0.002

QT interval stretching for diagnosing LQTS
53 |
responses of the QT-interval: The QT of LQT1-patients shortened by 8±32ms while it lengthened by 21±28ms among LQT2-patients. Consequently, LQT2-patients displayed the maximal QTc prolongation (Table 2, Figures 1G-1H).
Diagnostic value of the testThe QTc of LQTS-patients and controls was different already at baseline but the difference increased during standing (Figure 1A-1D). ROC-curves demonstrate incremental diagnostic value (Table 3). For example, for the population with QTc 390–480ms at baseline, the baseline-QTc that identified LQTS with 90% sensitivity had only 61% specificity. In contrast,
Figure 2 . QT interval stretching in a healthy control and in a LQT2 patient
(Top trace) A 39-year-old healthy volunteer. At baseline (left panel), heart rate is 65 beats/min, QT interval is 400 ms, and corrected QT interval (QTc) is 420 ms. Six seconds after standing (right panel), the shortest RR interval is 570 ms; by then, the QT interval has shortened to 360 ms. Since the RR interval shortened more than the QT interval, the QTc interval increased to 480 ms. Maximal QT interval stretching (when the end of the T-wave is nearest the next P-wave) is marked (*). (Bottom trace) A 38-year-old man with long QT syndrome mutation LQT2. At baseline, heart rate is 60 beats/min, QT interval and QTc interval are 440 ms. Note the fairly normal T-wave morphology. Shortly after standing (right panel), motion artifact is visible; the shortest RR interval is 640 ms, and by then the QT interval actually increased to 460 ms (*). Consequently, the QTc interval increased to 570 ms. Note the development of classic T-wave notching while standing.
ControlI
II
III
aVR
aVL
aVF
V1
V2
V3
V4
V5
V6
1 SEC
Maximal tachycardia and QT-stretching
II
aVF
V2
V5
V6
1 SEC
RR 595 600 580 570 580 600 640 660 940
QT 360 360 360 360 360 360 380 380 380
I
II
III
aVR
aVL
aVF
V1
V2
V3
V4
V5
V6
1 SEC
LQT2 Maximal tachycardia and QT-stretching
II
aVF
V5
V4
V6
1 SEC
RR 720 700 720 680 680 660 660 660 640 660 640
QT 440 440 440 450 450 450 460 460 460 460

Chapter 03
| 54
during maximal QT-stretching, the QTc value identifying LQTS with 90% sensitivity also had 86% specificity. With DeLong and DeLong analysis, the ROC curves of QT and QTc at maximal heart rate were significantly better than the ROC for baseline QT (p=0.008) and QTc (p=0.026).
DISCUSSION
Accurate diagnosis of the LQTS is crucial because this is a potentially lethal disorder for which effective therapy exists. We report that just observing the response of the QT-interval to the sudden heart rate acceleration provoked by quick standing provides diagnostic information.
The normal response of the QT-interval to brisk standing. The fact that the QT-shortening in response to sudden heart rate acceleration is not instantaneous has been known for almost a century.11 Already in 1920, Bazett emphasized
Figure 3 . QT interval stretching in a LQT1 patient
A 22-year-old woman with long QT syndrome mutation LQT1. (Left panel) At baseline, heart rate is 68 beats/min, QT interval is 480 ms, and corrected QT interval (QTc) is 512 ms. (Middle panel) Immediately after standing, there is movement artifact; heart rate increases to 82 beats/min but the QT interval fails to shorten, and the QTcinterval increases to 582 ms (the QT interval stretches all the way to the next P-wave). (Right panel) At the end of the test, heart rate returns to baseline but the QT interval remains prolonged, and the QTc interval is 565 ms long and has abnormal morphology.
Baseline Maximal tachycardia Return to baselineRR 880, QT 480 msQTc 512 ms
RR 680, QT 480 msQTc 582 ms
RR 880, QT 530 msQTc 565 ms
QT interval stretching for diagnosing LQTS
55 |
that “with exercise, the heart rate increases promptly but the QT shortens more slowly”.11 Animal12 and clinical6 studies show that following an abrupt increase in ventricular pacing-rate it takes up to 2 minutes until the ventricular refractory period12 and the QT-interval6 shorten (accommodate) to a new steady state. Beat-to-beat analysis of the human action potential show that during a sudden increase in pacing rate, the action potential shortens abruptly at the first fast heart beat but then requires several hundred beats to finally shorten to a new steady state.7 In our study, maximal heart rate acceleration occurred within 15 s of standing and such timing is too short for QT-accommodation.7 Thus, the insufficient QT-shortening of our healthy controls is actually expected. The fact that during standing-induced sinus tachycardia the QT shortened in 59% of controls while it remained unchanged in the rest is consistent with observations from Holter recordings in healthy volunteers.13 Such studies show that the speed of response of the QT-interval to sudden changes in heart rate is highly individual and independent of the basic QTc.13
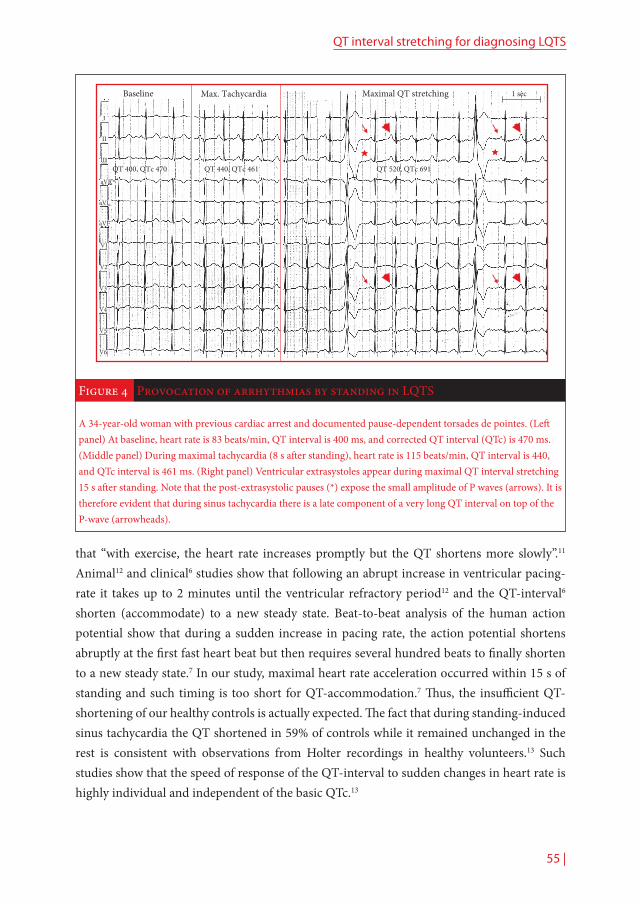
Figure 4 . Provocation of arrhythmias by standing in LQTS
A 34-year-old woman with previous cardiac arrest and documented pause-dependent torsades de pointes. (Left panel) At baseline, heart rate is 83 beats/min, QT interval is 400 ms, and corrected QT interval (QTc) is 470 ms. (Middle panel) During maximal tachycardia (8 s after standing), heart rate is 115 beats/min, QT interval is 440, and QTc interval is 461 ms. (Right panel) Ventricular extrasystoles appear during maximal QT interval stretching 15 s after standing. Note that the post-extrasystolic pauses (*) expose the small amplitude of P waves (arrows). It is therefore evident that during sinus tachycardia there is a late component of a very long QT interval on top of the P-wave (arrowheads).
I
II
III
aVR
aVL
aVF
V1
V2
V3
V4
V5
V6
Baseline Max. Tachycardia Maximal QT stretching
QT 400, QTc 470 QT 440, QTc 461 QT 520, QTc 691
1 sec

Chapter 03
| 56
The response of LQTS-patients to brisk standingAdaptation of the QT-interval to gradual changes in heart rate is impaired in the LQTS8 and we show that this maladaptation worsens when the changes in heart rate are sudden. The sympathetic stimulation that occur while standing affects the QT-interval independently of the concomitant tachycardia;14 such adrenergic stimulation would be expected to exert different effects on patients with normal versus abnormal QT.15,16 The LQT2-patients developed maximal QTc prolongation in response to standing. This observation was unexpected because during epinephrine-infusion tests, the largest QT-changes occur in LQT1.16 However, predominant prolongation of the M-cell action potential – leading to increased transmural dispersion of repolarization and early-afterdepolarization
Table 2 Baseline characteristics and response to standing, LQT1 versus LQT2
LQT1(n=31)
LQT2 (n=28) p value
Age (years) 33± 15 30±13 0.400
Female gender 21(68) 23(82) 0.243
Baseline heart rate (beats/min) 67±11 62±9 0.051
Baseline QT (ms) 445±42 455±45 0.375
Baseline QTc (ms) 468±39 460± 39 0.445
Response to standing
Increment in heart rate (beats/min) 24±10 26±11 0.474
Maximal heart rate (beats/min) 95±14 91±13 0.053
ΔQT during maximal tachycardia (ms) -8±32 21±28 0.001
ΔQTc during maximal tachycardia (ms) 67±41 114±42 <0.001
ΔQTc during longest QT (ms) 80±50 126±49 0.001
ΔQTc during maximal QT-stretching (ms) 73±43 119±48 <0.001Data are mean±SD or n(%). ∆QT, QT interval change from baseline; ∆QTc, corrected QT interval change from baseline; QTc, corrected QT.
Table 3 ROC curve analysis of variables
AUC 95% CI90% sensitivity
Cutoff Specificity
Baseline QT interval 0.836 0.758–0.914* 395 50.9%
Baseline QTc interval 0.850 0.775–0.925* 423 61.4%
QT interval at maximal heart rate 0.900 0.840–0.960* 375 70.2%
QTc interval at maximal heart rate 0.933 0.889–0.978* 474 75.4%
QT interval during maximal QT stretching 0.923 0.874–0.973* 487 86%
*p <0.001 for all receiver-operating characteristic (ROC) curves. AUC, area under the curve; CI, confidence inter-val; QTc, corrected QT.

QT interval stretching for diagnosing LQTS
57 |
activity – is a well recognized response to sudden heart rate acceleration in models of LQT2.17 Interestingly, clinical arrhythmias in LQT2 are characteristically triggered by situations involving sudden (as opposed to gradual) heart rate acceleration, like sudden startling by noise.18
LimitationsAlthough all QT measurements were performed by a blinded investigator, the QT-duration and T-wave morphology would often reveal the patients’ identity. Thus, potential for biased measurements exists. However, a small study comparing the effects of standing on 16 patients with LQT2 and 27 controls also showed significantly larger increments in the QTc of LQT2-patients.19
ConclusionsDiagnostic implications Our test is easy to perform and should be used in addition to more accepted tests when necessary. Conversely, it is important to avoid over-diagnosis of LQTS based on QTc estimations performed when the patient stands. We have patients referred for evaluation following the incidental finding of a long QT interval in a single ECG but with strictly normal QT intervals in subsequent recordings. In these cases, the culprit ECG was the baseline ECG of an exercise test. Rather than representing a truly resting ECG, these were traces demonstrating the normal QTc prolongation in response to brisk standing immediately prior to exercise. Similarly, inadvertent QT-stretching during Holter recordings may lead to over-diagnosis of LQTS.
Clinical implications The onset of QT-interval related ventricular ectopy observed in a few LQTS-patients upon standing suggests that untreated patients are at risk for more serious arrhythmias every time they stand up. This is important because physicians are likely to misinterpret syncope as vasovagal if this occurred upon standing. Interestingly, standing is reported as trigger for syncope by one third of symptomatic LQTS-patients.20 We did not evaluate the effects of therapy but Walker reported that beta-blocker therapy attenuates the QT-stretching effects of standing.19
Research implications An intriguing aspect of this study relates to the outliers in the control group. A few controls demonstrated exaggerated QT-stretching during standing that was of the magnitude observed in the LQTS-group (Figure 1C-1D). Rather than simply representing false positives, it is possible that these are individuals with normal QT but impaired repolarization reserve. Larger studies should be conducted to determine if these outliers share genotypic characteristics or demonstrate exaggerated QT prolongation in response to drugs or other insults.

Chapter 03
| 58
AcknowledgmentsOri Rogowski performed the statistical analysis. Hila Zohar and Ilana Meir provided invaluable technical help. In addition, we thank the patients for their cooperation.
REFERENCES
1 Viskin S. The long QT syndromes and torsade de pointes. Lancet. 1999;354:1625-1633.2 Moss AJ. Long QT Syndrome. JAMA. 2003;289:2041-2044.3 Vincent GM, Timothy KW, Leppert M, Keating M. The spectrum of symptoms and QT intervals in
carriers of the gene for the long QT syndrome. N Engl J Med. 1992;327:846-852.4 Vincent GM. Role of DNA testing for diagnosis, management and genetic screening in long QT
syndrome, hypertrophic cardiomyopathy and Marfan syndrome. J Cardiovasc Electrophysiol. 2001;86:12-14.
5 Viskin S. The QT interval: too long, too short or just right. Heart Rhythm. 2009;6:711-715.6 Lau CP, Freedman AR, Fleming S et al. Hysteresis of the ventricular paced QT interval in response
to abrupt changes in pacing rate. Cardiovasc Res. 1988;22:67-72.7 Franz MR, Swerdlow CD, Liem LB, Schaefer J. Cycle length dependence of human action potential
duration in vivo. Effects of single extrastimuli, sudden sustained rate acceleration and deceleration, and different steady-state frequencies. J Clin Invest. 1988;82:972-979.
8 Merri M, Moss AJ, Benhorin J et al. Relation between ventricular repolarization duration and cardiac cycle length during 24-hour Holter recordings. Findings in normal patients and patients with long QT syndrome. Circulation. 1992;85:1816-1821.
9 Tan HL, Bardai A, Shimizu W et al. Genotype-specific onset of arrhythmias in congenital long-QT syndrome: possible therapy implications. Circulation. 2006;114:2096-2103.
10 Schwartz PJ, Moss AJ, Vincent GM, Crampton RS. Diagnostic criteria for the long QT syndrome. An update. Circulation. 1993;88:782-784.
11 Bazett HC. An analysis of the time-relations of electrocardiograms. Heart. 1920;7:353-370.12 Janse MJ, van der Steen AB, van Dam RT. Refractory period of the dog’s ventricular myocardium
following sudden changes in frequency. Circ Res. 1969;24:251-262.13 Malik M, Hnatkova K, Novotny T, Schmidt G. Subject-specific profiles of QT/RR hysteresis. Am J
Physiol Heart Circ Physiol. 2008;295:H2356-H2363.14 Browne E, Zipes D, Heger J, Prystowsky E. Influence of the autonomic nervous system on the QT
interval in man. Am J Cardiol. 1982;50:1099-1103.15 Antzelevitch C. Sympathetic modulation of the long QT syndrome. Eur Heart J. 2002;23:1246-1252.16 Ackerman MJ, Khositseth A, Tester DJ et al. Epinephrine-induced QT interval prolongation: a gene-
specific paradoxical response in congenital long QT syndrome. Mayo Clin Proc. 2002;77:413-421.17 Burashnikov A, Antzelevitch C. Acceleration-induced action potential prolongation and early
afterdepolarizations. J Cardiovasc Electrophysiol. 1998;9:934-948.18 Schwartz PJ, Priori SG, Spazzolini C et al. Genotype-phenotype correlation in the long-QT
syndrome: gene-specific triggers for life-threatening arrhythmias. Circulation. 2001;103:89-95.19 Walker BD, Krahn AD, Klein GJ, et al. Effect of change in posture and exercise on repolarization in
patients with long QT syndrome with HERG channel mutations. Can J Cardiol. 2005;21:33-38.20 Colman N, Bakker A, Linzer M et al. Value of history-taking in syncope patients: in whom to suspect
long QT syndrome? Europace. 2009;11:937-943.


![Vohra Instructor Manual All Chapter File[1]](https://static.fdocuments.us/doc/165x107/55cf9c57550346d033a97fcf/vohra-instructor-manual-all-chapter-file1.jpg)