![]HOHQjosefuvdul.eu/wp-content/uploads/UP2_HLV_Josefův_Důl.pdf · 2016. 3. 3. · 748 m n. m. 0D[RYVNì YUFK 884 m n. m. ÿHUQì YUFK 908 m n. m. 'ORXKi VH 956 m n. m. 830 m n. m.](https://static.fdocuments.us/doc/165x107/5fdf760f48400048041ed86e/-vdlpdf-2016-3-3-748-m-n-m-0dryvn-yufk-884-m-n-m-huq-yufk.jpg)
UvA-DARE (Digital Academic Repository) Adhesion and … · bubbleediameter,m penetrationndepth,m...
23
UvA-DARE is a service provided by the library of the University of Amsterdam (http://dare.uva.nl) UvA-DARE (Digital Academic Repository) Adhesion and agglomeration of catalyst particles in three phase reactors van der Zon, M. Link to publication Citation for published version (APA): van der Zon, M. (2001). Adhesion and agglomeration of catalyst particles in three phase reactors. General rights It is not permitted to download or to forward/distribute the text or part of it without the consent of the author(s) and/or copyright holder(s), other than for strictly personal, individual use, unless the work is under an open content license (like Creative Commons). Disclaimer/Complaints regulations If you believe that digital publication of certain material infringes any of your rights or (privacy) interests, please let the Library know, stating your reasons. In case of a legitimate complaint, the Library will make the material inaccessible and/or remove it from the website. Please Ask the Library: https://uba.uva.nl/en/contact, or a letter to: Library of the University of Amsterdam, Secretariat, Singel 425, 1012 WP Amsterdam, The Netherlands. You will be contacted as soon as possible. Download date: 12 Feb 2020
Transcript of UvA-DARE (Digital Academic Repository) Adhesion and … · bubbleediameter,m penetrationndepth,m...
UvA-DARE is a service provided by the library of the University of Amsterdam (http://dare.uva.nl)
UvA-DARE (Digital Academic Repository)
Adhesion and agglomeration of catalyst particles in three phase reactors
van der Zon, M.
Link to publication
Citation for published version (APA):van der Zon, M. (2001). Adhesion and agglomeration of catalyst particles in three phase reactors.
General rightsIt is not permitted to download or to forward/distribute the text or part of it without the consent of the author(s) and/or copyright holder(s),other than for strictly personal, individual use, unless the work is under an open content license (like Creative Commons).
Disclaimer/Complaints regulationsIf you believe that digital publication of certain material infringes any of your rights or (privacy) interests, please let the Library know, statingyour reasons. In case of a legitimate complaint, the Library will make the material inaccessible and/or remove it from the website. Please Askthe Library: https://uba.uva.nl/en/contact, or a letter to: Library of the University of Amsterdam, Secretariat, Singel 425, 1012 WP Amsterdam,The Netherlands. You will be contacted as soon as possible.
Download date: 12 Feb 2020

5 5 Thee impact of hydrophobic activated carbon particles on
thee hydrodynamics of aqueous slurry bubble columns*
Abstract t
Thee hydrodynamics of three phase bubble columns is affected by the presence of
particless in the liquid phase. This is commonly attributed to a change in the apparent
viscosityy and density of the slurry phase. Besides these commonly known effects, the
columnn hydrodynamics may also be affected by adhesion of particles to the gas
bubbles.. As shown by Vinke, et al. (1991) and in Chapter 2, activated carbon particles
mayy easily adhere to gas bubbles in aqueous slurries. The impact of adhesion on the
hydrodynamicss may be attributable to an effect on the bubble coalescence. The
adhesionn behaviour depends on the hydrophobicity of the solid particles and
consequentlyy the impact on the bubble coalescence is related to this parameter as well.
AA possible explanation for the impact of hydrophobicity is that hydrophobic particles
wil ll penetrate into the bubble-liquid interface resulting in an easier rupture of the
liquidd film between two gas bubbles, causing an easier coalescence between bubbles.
*M .. van der Zon, M. Lapar, P.J. Hamersma, A. Bliek, submitted for Chem. Eng. Sci.

ChapterChapter 5
5.11 Introductio n
Slurryy bubble columns are widely used in chemical industry. Nevertheless, the impact
off catalyst particles present in the liquid phase on the overall hydrodynamics is not
welll understood. This matter has been subject of research by, for instance Bukur et al.
(1990),, Gavroy et al. (1995), Ghandhi et al. (1999), Krishna et al. (1997), Saxena et
al.al. (1992), Tsutsumi et al. (1999), and Yasunishi et al. (1986). The research described
inn their articles is performed using glass, sand, or silica particles as solid phase. The
impactt of solid particles on the gas holdup and the bubble size distribution is generally
attributedd to parameters like the apparent viscosity or apparent density of the slurry.
Accordingg to theory the gas holdup should decrease with an increasing solid
concentrationn due to the resulting higher apparent viscosity and density. However, in
contrastt to this theory, the results reported by Tsutsumi et al. (1999) shows no effect.
Furthermore,, a literature review, presented by Banisi et al. (1995), shows that an
increasee of the gas holdup with increasing catalyst concentration can be found if very
loww concentrations (< 0.6 v/v%) and very small particles (< 10|Xm), or very large
particless (> 2000 ^im) and high concentrations (> 10 v/v%) are used.
Thee impact of solid segregation, as apparent in particle agglomeration and particle to
bubblee adhesion is generally neglected in the literature. Exception to this is the study
off Banisi et al. (1995). These authors used both silica (hydrophilic) and carbon
(hydrophobic)) particles for their investigations. It was demonstrated that the nature of
thee solids affects the gas holdup: the holdup in presence of 15 v/v% carbon is lower
thann in presence of 15% silica. The difference can obviously not be attributed to
differencess in the apparent viscosity or apparent density. This suggests that another
phenomenonn is to be held responsible for the changed hydrodynamics in a slurry
bubblee column, like adhesion of particles to the gas bubbles. For hydrophobic
activatedd carbon particles in water, earlier work of described in Chapter 2 and
publishedd by Vinke (1991) revealed that such particles may indeed easily adhere to
bubbles.. This adhesion behaviour is affected by the hydrophobicity of the particles.
Itt is generally accepted that bubble coalescence occurs in three steps (Chaudari and
Hofmann,, (1994)). Initially a film between two bubbles is formed. Secondly thinning
60 0

ChapterChapter 5
off this film occurs and thirdly the film may rupture at a critical thickness. The last step
mayy be affected by the presence of particles in the film layer.
Ass wil l be demonstrated, the impact of adhering particles on the slurry-bubble-column
hydrodynamicss may be substantial. In this study, the impact of the hydrophobicity of
activatedd carbon on the gas holdup, as a measure for the hydrodynamics in a three
phasee reactor, is investigated. Two types of carbon are used, differing in
hydrophobicity. .
5.22 Experimental
5.2.15.2.1 Materials and Preparation
AA steam activated peat based carbon, SX1G, supplied by Norit NV (Amersfoort, The
Netherlands)) is used for the experiments. The SX1G carbon is oxidised with nitric acid
too obtain a more hydrophilic activated carbon. For this treatment the carbon is refluxed
forr 45 minutes in 200 ml 65 % nitric acid. Subsequently it is filtered and washed six
timess with water and dried at 80 °C over night. This carbon wil l be denoted as SX1G-
HN03. .
5.2.25.2.2 Characterisation
Thee results presented in Chapter 4 and results presented by Heinen et al. (2000)
showedd that the amount of carboxylic sites on the surface is a measure for the
hydrophobicityy of activated carbons. Therefore, FTIR is used to characterise the
activatedd carbons. In this way a signal for the carboxylic groups (at 1700 cm" ) and a
signall for the bulk aromatic groups (1580 cm"1) is obtained (Vinke, et al, (1994)). The
ratioo between the areas of both signals, so A1700/A1580 is a measure for the
concentrationn of acidic groups, and thus a measure for the hydrophobicity. The
infraredd spectra were recorded with a Biorad FTS 45A spectrometer. FTIR is carried
outt by dispersing the activated carbon particles in pentane and subsequently brushed
onn a KBr-tablet. The obtained spectra are based on 256 scans and are corrected using a
curvedd baseline.
61 1

ChapterChapter 5
SEMM analysis is used to investigate the macroscopic structure of the activated carbon
particles.. The equipment used is a Philips XL30 FEG.
5.2.3.5.2.3. Holdup measurements
Holdupp experiments are performed in a cylindrical bubble (3-D) column of 0.15 m
diameterr and a height of 4 m and in a two dimensional (2-D) slit-column, with a width
off 0.3 m, a depth of 0.005 m and a height of 2 m. All experiments are carried out at
roomm temperature and atmospheric pressure. The gas (air) inlet in both columns
consistss of a P00 glass filter. The superficial gas velocity vsg is varied between 0 and
0 .1ms".. After changing the gas flow, a wait time of 10 minutes is required before
steadyy state is reached. In the 3-D bubble column, the pressure at different heights (0.6
andd 1 m) is used to calculate the holdup. The gas holdup can be calculated from the
timee average pressure difference. In the 2-D slit-column the holdup was determined by
measuringg the liquid height with and without gas flowing trough the column. In both
columns,, experiments are performed using activated carbon loadings varying between
00 and 6 v/v% in water.
5.3.45.3.4 Bubble size distribution measurements
Thee average bubble size distribution is obtained by high speed video recording of the
hydrodynamicc behaviour in the 2-D slit-column as described by de Swart et al. (1996).
Thee camera is placed at a column height of 0.75 m. The image analysis is performed
usingg SCIL-image, a commercial image analysis software program. To measure
bubblee size distributions in absence of carbon, it is important to obtain contrast
betweenn the bubbles and liquid. Therefore, 0.25 v/v% activated carbon was added to
thee water. This resulted in a grey coloured liquid. It was verified that the addition of
0.255 v/v% had no influence on the column hydrodynamics compared to water.
5.33 Theory
AA Two Bubble Class hydrodynamic model was introduced by Shetty et al. (1992).
Thesee authors assume that small bubbles follow the flow regime of the liquid in the
column,, where as large bubbles are transported in a plug flow through the column. The
62 2
ChapterChapter 5
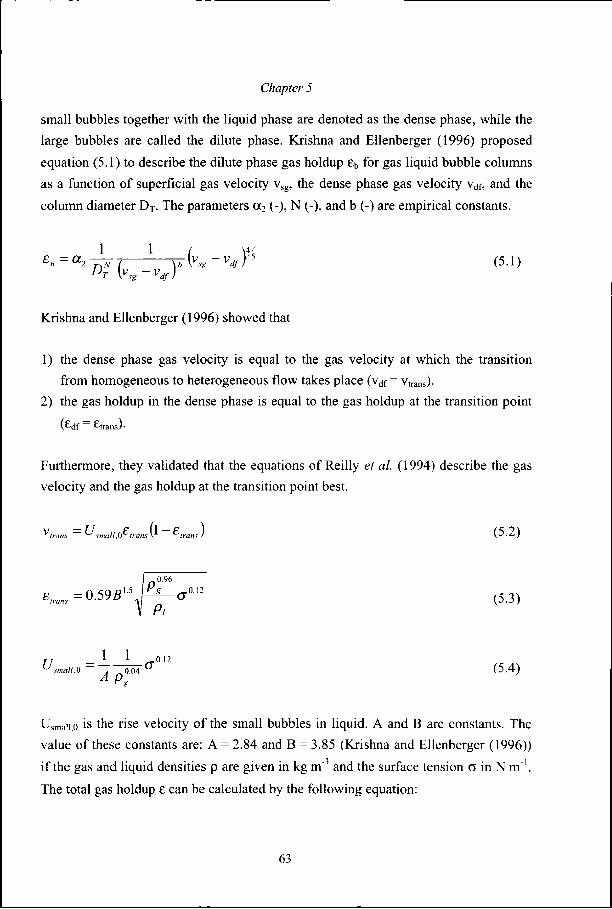
smalll bubbles together with the liquid phase are denoted as the dense phase, while the
largee bubbles are called the dilute phase. Krishna and Ellenberger (1996) proposed
equationn (5.1) to describe the dilute phase gas holdup £\, for gas liquid bubble columns
ass a function of superficial gas velocity vsg, the dense phase gas velocity vdf, and the
columnn diameter DT. The parameters a2 (-), N (-), and b (-) are empirical constants.
11 1
DDTT (Vse-V*/)' iivvssgg-v-vdfdfff
55 (5.1)
Krishnaa and Ellenberger (1996) showed that
1)) the dense phase gas velocity is equal to the gas velocity at which the transition
fromm homogeneous to heterogeneous flow takes place (v<jf = vtrans).
2)) the gas holdup in the dense phase is equal to the gas holdup at the transition point
(edff = etrans)-
Furthermore,, they validated that the equations of Reilly et al. (1994) describe the gas
velocityy and the gas holdup at the transition point best.
VV trans ~ ̂ small,O^transV ~ ^Irans ) (5.2)
ff 0.96 (1.55 \"g 0.12 e _ = 0 . 5 9 i r j ^ - < r "" (5.3)
.0.12 2 uussmamaii.oii.o -— "TooT*7 (5.4) AA Ps
Usmaii,oo is the rise velocity of the small bubbles in liquid. A and B are constants. The
valuee of these constants are: A = 2.84 and B = 3.85 (Krishna and Ellenberger (1996))
iff the gas and liquid densities p are given in kg m"3 and the surface tension o in N m'1.
Thee total gas holdup e can be calculated by the following equation:
63 3

ChapterChapter 5
== (l £ £ df df (5.5) )
Thee presence of particles can influence the gas holdup in a bubble column
significantly.. This may be due to either a change in the apparent viscosity of the slurry,
orr a change in the apparent density, or to adhesion of particles.
Krishnaa et al. (1997) showed that equations (5.1-5.5) may be used for gas-liquid-solid
bubblee columns as well, provided that additional equations for the rise velocity of the
smalll bubbles, and of the dense phase gas holdup as a function of the particle
concentrationn are used (equations (5.6) and (5.7)). These latter equations describe the
contributionn of the apparent viscosity and apparent density.
U.smallU.small ~ Usmall.0
'' 0.8 ^ 11 + V. V. small.O small.O
(5.6) )
££dfdf Ed/,0 '' 0.7 ^
11 £ 'df,Q 'df,Q
(5.7) )
Forr the derivation of these equations, Krishna et al. used non-adhering silica particle,
thee impact of adhesion is not well accounted for.
5.44 Results
5.4.15.4.1 Gas holdup experiments
Holdupp experiments are carried out using two activated carbons (SX1G and
SXIG-HNO3).. The carbons differ notably in hydrophobicity (Table 5.1 and Figure
5.1)) as indicated by FTIR analysis.
64 4

ChapterChapter 5
<dp>(|im)) SBEtCmg"1) ppg(kgm"3) A170o/A, 580 0
SX1G G
SXIG-HNOJ J
20 0
18 8
999 9
918 8
824 4
807 7
0.404 4
0.518 8
TableTable 5.1. Physical properties of the activated carbon particles.
3 3
<D D O O C C TO TO
n n 1 --
o o -Q Q re re
19000 1700 1500
reciprocall wavelength (cm'1)
1300 0
FigureFigure 5.1. FTIR spectra of SX1G (—) and SXIG-HNO3 ( ) activated carbon particles.
Thee FTIR band intensities at 1700 cm"1 and 1580 cm"1 are used to characterise the
carbonn hydrophobicity. The A17oo/A158o ratio of the SXIG-HNO3 is higher than the
ratioo for SX1G, indicating that the nitric acid treatment decreases the hydrophobicity
off the activated carbon, while the other properties are not changed significantly.
Manyy authors (Banisi et al. (1995), Krishna et al. (1997), Yasunishi et al. (1986))
reportt that in a three phase bubble column the gas holdup decreases with increasing
concentrationss of particles.
65 5

ChapterChapter 5
0,33 0,3
. : ; ; ; * * * * * * : * * ? - — - --
0,22 . r : * * i i s ^ o,2 * !! o,2 „aBSSis*^
coo J É * S - " W
0,11 | 1 S 0.1
00 0 00 0,025 0,05 0,075 0,1 0 0,025 0,05 0,075 0,1
v s g (ms 1 )) v s g (ms 1 )
FigureFigure 5.2. The total air holdup as a function of the superficial gas velocity vsg in the 3-D
columnn for activated carbon concentrations in water.
• :: 0 v/v%, • : 3 v/v%, • : 4 v/v%, *: 5 v/v% -: 6 v/v%.
Closedd bullets (left): SX1G, Open bullets (right): SX1G-HNO.,.
Thee decrease of gas holdup with increasing particle concentration is found for both
typess of activated carbon particles as can be seen in Figure 5.2. Up to a carbon
concentrationn of 1 v/v% no significant effect of the activated carbon particles is
observed,, in accordance with data from Gavroy et al. (1995).
Figuree 5.3 shows the holdup results for both the 3-D column and the 2-D slit-column
usingg water, 6 v/v% SX1G, and 6v/v% SX1G-HN03 respectively. It clearly
demonstratess that, in both columns, a significant difference exists between the gas
holdupp of SX1G and SXIG-HNO3 particles. In spite of the qualitative difference, Fig
5.33 shows that the 2-D slit-column is quantitatively representative for the 3-D column.
Figuree 5.3 also demonstrate the theoretical predictions, based on equations (5.1-5.7),
forr the gas holdup in case of an air-water system and an air-water-6 v/v% particles
system. .
66 6

ChapterChapter 5
0,3 3
0,2 2
GO O
0,1 1
0 0
FigureFigure 5.3. The total air gas holdup as a function of the superficial gas velocity (vsg) in 3-D
andd 2-D column in water. • : gas holdup in 0 v/v% carbon • : Gas holdup in 6 v/v% SX1G
slurryy • : Gas holdup in 6 v/v% SXIG-HNO3 slurry. Closed bullets: 2-D slit-column, Open
bullets:: 3-D column. — Gas holdup in water calculated with equations (5.1-5.5), — Gas
holdupp in a 6 v/v% slurry calculated with equations (5.1-5.7). a2 = 0.268, N = 0.524, b = 0.22.
AA significant difference between the measured gas holdup in presence of activated
carbonn and the gas holdup predicted by the model presented by Krishna et al. (1997) is
foundd (Figure 5.3). The difference between model and experimental result implies that
adhesionn of particles is an important parameters for hydrodynamics in a bubble
column.. This means that equations (5.6) and (5.7) can not be used to describe the
hydrodynamicss in a column if adhering particles are present.
5.4.25.4.2 Bubble coalescence
Experimentss in a 2-D slit-column were used to assess the bubble size distributions,
usingg high-speed video imaging. The results for various catalyst concentrations are
givenn in Figures 5.4, 5.5, and 5.6, showing a large decrease in the amount of small
bubbless with increasing catalyst concentration. Because of the large fraction of small
bubbless (< 5 mm) found for air-water systems, only the bubbles larger than 5 mm are
analysed. .
rA £ A A A A A A A A
A A
0,025 5 0,05 5
vSgg (m s 1 )
0,075 5 0,1 1
67 7

ChapterChapter 5
FigureFigure 5.4. Six successive frames in time of air bubbles in 0.25 v/v% SX1G in water recorded
withh 40 ms interval. The frame width is 0.3 m, vsg= 0.1 m/s.
FigureFigure 5.5. Six successive frames in time of air bubbles in 3 v/v% SX1G in water recorded
withh 40 ms interval. The frame width is 0.3 m, vsg = 0.1 m/s.
68 8

ChapterChapter 5
FigureFigure 5.6. Six successive frames in time of air bubbles in 6 v/v% SX1G in water recorded
withh 40 ms interval. The frame width is 0.3 m, vsg = 0.1 m/s.
Figuress 5.4, 5.5 and 5.6 also demonstrate the coalescence behaviour of the bubbles. As
illustratedd in Figure 5.4 (water-air system) a liquid layer between interacting bubbles is
presentt at low activated carbon concentrations. This layer remains stable until the
coalescencee of the bubbles occurs. In presence of 3 v/v% activated carbon (Figure
5.5),, film rupture occurs faster compared to the pure water-air system. The liquid layer
betweenn interacting bubbles disappears quicker for higher solids concentration (6 v/v%
SX1G)) (See Figure 5.6). This indicates that particles do indeed affect the film rupture.
Withh increasing catalyst concentration the film thinning is faster, or the critical film
thicknesss increases. Both phenomena would result in an easier coalescence between
twoo bubbles.
69 9

ChapterChapter 5
0,40 0
0,35 5
.. 0,30 O) )
êê 0,25
0,20 c c ff 0,15 ra ra ** 0,10
0,05 5
0,00 0 5-100 10-20 20^0 >40
dbb (mm)
FigureFigure 5.7. Contribution of specific bubble size classes to the total air holdup of bubbles with
aa diameter exceeding 5 mm at vsg = 0.1 m s"'. • . 0.25 v/v% SX1G in water, , 3 v/v% SX1G
inn water , 6 v/v% SX1G in water.
Figuree 5.7 gives the results of image analysis of the video frames and shows that for
increasingg particle concentration the contribution of the smallest analysed bubbles (5-
100 mm) decreases and the contribution of the largest analysed bubbles (> 40 mm) to
thee gas holdup increases. This is also qualitatively observable from the frame
sequencess given Figures 5.4, 5.5, and 5.6.
Byy comparing the results obtained with 6 v/v% SX1G (Figure 5.6) and 6 v/v%
SXIG-HNO33 (Figure 5.8), it can be concluded that more small bubbles and a more
stablee liquid film are found in presence of less hydrophobic SX1G-FTN03 particles.
Thiss corresponds with the results presented in Figure 5.3: the gas holdup in the 3-D
columnn for 6 v/v% SX1G is significantly smaller than the gas holdup for 6 v/v%
SXIG-HNO3.. Because of the small amount of bubbles smaller than 5 mm, all bubbles
aree counted using SCIL-image.
70 0

ChapterChapter 5
FigureFigure 5.8. Six successive frames in time with of air bubbles In 6 v/v% SXIG-HNO3 in water
recordedd with 40 ms interval. The frame width is 0.3 m, vsg = 0.1 m/s.
Thee difference in bubble size distribution for the SX1G and SX1G-HN03, based on
imagee analysis, are shown in Figure 5.9. As can be observed in this figure, the
contributionn of small bubbles in presence SX1G particles is smaller compared to the
contributionn of small bubbles in presence of SXIG-HNO3. The opposite holds for the
contributionn of large bubbles. As demonstrated in Figure 5.10, the difference in bubble
sizee distribution is mainly caused by a larger absolute amount of smaller bubbles for
SXIG-F1NO33 (< 5 mm) and an about equal amount of visible parts of larger bubbles
(>> 10 mm).
71 1

ChapterChapter 5
0,3 3
0,25 5
II 0,2
0,15 5
SS 0,1
0,05 5
1-100 10-20 20-40
d bb (mm)
>40 0
FigureFigure 5.9. The contribution of different bubble size classes to the total air holdup at
vsgg = 0.1 m s ' . • . 6 v/v% SX1G in water, • , 6 v/v% SXIG-HNO3 in water.
0.004 4
0.003 3
55 0.002
0.001 1
0 0 22 3
dbb (mm)
0.012 2
0.009 9
$$ 0.006
0.0033 S
0 0
25 5 dbb (mm)
85 5
FigureFigure 5.10. Gas holdup for different bubble size classes at vsg = 0.1 m s" . Bubbles smaller
thann 5 mm: left picture (db class 0.1 mm around x value). Bubbles larger than 25 mm right
picturee (db class 5 mm around x value). • , 6 v/v% SX1G in water, * , 6 v/v% SXIG-HNO3 in
water. .
Whenn the video frames of the movies of 6 v/v% SX1G and SXIG-HNO3 are examined
inn more detail, adhesion of activated carbon particles on the bubbles is observable
(Figuree 5.11). Especially for SXIG-carbon a large part of the bubbles are covered with
carbonn particles. The covered parts of the bubbles are not detectable using SCIL-image
analysis,, resulting in underestimation of the bubble size. The bubble coverage of the
72 2

ChapterChapter 5
largerr bubbles is higher. Because the coverage of the bubbles by particles is more
pronouncedd in presence of SX1G than for SXIG-HNO3, the underestimation of large
bubbless in the air-water SX1G system is largest. This means that the difference in
bubblee size distribution as shown in Figure 5.9 is even larger.
FigureFigure 5.11a. Video frame of 6 v/v% SX1G Figure 5.11b. Video frame of 6 v/v%
inn water. vsg = 0.1 m s ' . SXIG-HNO3 in water. vsg = 0.1 m s~'.
Ass demonstrated by Figures 5.6, 5.8, 5.9, 5.10, and 5.11, a treatment of activated
carbonn with nitric acid leads to an increase in the gas holdup, as compared to the
untreatedd carbon. This is caused by an influence on the bubble coalescence: in
presencee of SX1G particles the liquid layer is less stable than in presence of
SXIG-HNO33 particles. An effect of adhering particles on the bubble coalescence can
eitherr be caused by the roughness of the macroscopic surface of the particles, or by the
hydrophobicityy of the particles. For rough particles, the bubble surface is easily
ruptured,, causing coalescence. Accordingly, surface roughness may affect the
coalescencee behaviour. If the particles are hydrophobic, they will penetrate into bubble
surface.. The penetration depth is a function of the three phase contact angle.
Penetrationn of the particles can either affect the film thinning velocity or the rupture of
thee film. If the particles are less hydrophobic, the three phase contact angle is lower, as
comparedd to more hydrophobic particles, consequently a lower penetration depth of
thee hydrophobic particles into the gas phase will be found (Figure 5.12).
73 3

ChapterChapter 5
gass bubble
FigureFigure 5.12. Schematic representation of the penetration of a particle into a gas bubble. The
forcess are described in Chapter 4.
Ass a result of the decreased penetration depth, a more stable layer between two
bubbless can exist. In addition agglomeration of adhering particles can influence the
coalescencee behaviour. More hydrophobic particles have a stronger tendency to form
agglomerates,, resulting in an increase of the effective particle diameter. If such
agglomeratess are present in the film, the film will be easier ruptured.
FigureFigure 5.13a. SEM picture of SX1G particle. Figure 5.13b. SEM picture of SXIG-HNO,
particle. .
SEMM pictures of the carbon particles are shown in Figure 5.13, demonstrating that
nitricc acid treatment does not really changes the macroscopic roughness of particles.
Therefore,, the difference in bubble coalescence is not easily explained by a difference
74 4

ChapterChapter 5
inn particle roughness. The impact of acid treatment on the hydrophobic nature of
carbonn forms an alternative, more plausible, explanation for its impact on penetration
depth,, and thereby on the coalescence behaviour.
5.55 Conclusions
Itt is well known that the presence of particles has an impact on the hydrodynamics in a
slurryy bubble column by changing the apparent viscosity and density of the slurry
phase.. This work shows that the hydrophobicity of the particles also appears to be
important.. The results presented demonstrate that the presence of hydrophobic
particless results in a decrease of the gas holdup compared to a gas-liquid system. This
iss contributed to the influence of the particles on the coalescence behaviour of the
bubbles.. When the expected gas holdup is corrected for the impact of the presence of
carbonn particles on the apparent slurry density and viscosity using the equations of
Krishnaa et al. (1997), still a net effect remains. The net effect is attributed to the
hydrophobicc nature of the activated carbon particles, leading to adhesion of the
particless on the gas-liquid interface. The adhesion of particles in turn results in
enhancedd bubble coalescence, and significantly changes in the total gas holdup in the
slurryy bubble column may arise.
AA plausible explanation for the change in coalescence behaviour in presence of
adheringg particles might be the impact on the film rupture. The liquid film between to
gass bubbles is ruptured earlier in a gas-liquid-adhering particle system compared to the
gas-liquid-nonn adhering particles system. This is caused by the fact that in case of
moree hydrophobic particles the three phase contact angle, 0, is larger, resulting in a
deeperr penetration into the bubble. A deeper penetration accelerates the rupture of the
film.. Alternatively, more hydrophobic particles form larger agglomerates, which still
mayy adhere to the bubbles. Larger particles in the gas-liquid film may also accelerate
filmm rupture. This might explain the impact of hydrophobicity on the holdup, and
thereby,, on the hydrodynamics of a three phase reactor.
75 5

ChapterChapter 5
5.66 Nomenclature
A A
b b
B B
4 4 Ipen n
DT T
Fa a
Fb b
Fg g
Fa a
N N
Vsg g
Vdf f
^trans s
Usmall l
Usmall.0 0
constantt in equation (5.4), not dimensionless
constantt in equation (5.1), -
constantt in equation (5.3), not dimensionless
bubblee diameter, m
penetrationn depth, m
columnn diameter, m
capillaryy force, N
buoyancyy force, N
gravityy force, N
capillaryy pressure, N
constantt in equation (5.1), -
overalll superficial gas velocity, m s"
superficiall gas velocity of gas through the dense phase, m s"1
superficiall gas velocity at the regime transition, m s"
risee velocity of small bubbles, m s"1
riserise velocity of small bubbles at zero solids concentrations, m s
GreekGreek symbols
0C22 constant in equation (5.1) ,-
EE total gas holdup, -
£bb gas holdup of the dilute phase, -
edff holdup of gas in dense phase, -
Edf,oo holdup of gas in dense phase in two phase system (G-L), -
£jj holdup of gas of bubble size class i, -
Eiargee holdup of bubbles larger than 5 mm, obtained by image analysis, -
e ss solids holdup, -
Etott total gas holdup, obtained by image analysis, -
£transs gas holdup at the regime transition, -
00 three phase contact angle, rad
76 6
ChapterChapter 5
pgg density of the gas phase, kg m
P]] density of the liquid phase, kg m"
aa surface tension of the liquid phase, N m'
77 7

ChapterChapter 5
5.77 References
Banisi,, S, J.A. Finch, and A.R. Laplante, "Effect of Solid Particles on Gas Holdup in
Flotationn Columns -I. Measurement", Chem. Eng. ScL, 50, 2329 (1995).
Bukur,, D.B., S.A. Pater, and J.G. Daly, "Gas holdup and solid dispersion in three
phasee slurry bubble column", AIChE J., 36, 1731, (1990)
Dee Swart, J.W.A., R.E. van Vliet, and R. Krishna, "Size, Structure and Dynamics of
"Large"" Bubbles in a two Dimensional Slurry Bubble Column", Chem. Eng. Sci., 51,
4619(1996) )
Gandhi,, B., A. Prakash, and M.A. Bergougnou, "Hydrodynamic behaviour of slurry
bubblee column at high solids concentration", Powder Technology, 103, 80 (1999)
Gavroy,, D., C. Joly Vuillemin, G. Cordier, and H. Delmas, " Gas Hold-up, liquid
circulationn and gas liquid mass transfer in slurry bubble columns", Chem. Eng. Res. &
Dev.,Dev., 73, 637(1995)
Heinen,, A.W., J.A. Peters, and H. van Bekkum, "Competitive adsorption of water and
toluenee on modified activated carbon supports" Appl. Catal. A: General, 194-195, 193
(2000) )
Krishna,, R., and J. Ellenberger, "Gas Holdup in Bubble Column Reactors Operating in
thee Churn-Turbulent Flow Regime", AIChE J., 42, 2627 (1996)
Krishna,, R, J.W.A. de Swart, J. Ellenberger, G.B. Martina, and C. Maretto, "Gas
Holdupp in Slurry Bubble Columns: Effect of Column Diameter and Slurry
Concentrations",, AIChE J., 43(2), 311 (1997)
Reilly,, I.G., D.S. Scott, T.J.W. de Bruijn, and D. Maclntyre, "The Role of Gas Phase
Momentumm in Determining Gas Holdup and Hydrodynamic flow Regimes in Bubble
Columnn Operations", Can. J. Chem. Eng., 72, 3 (1994)
Saxena,, S.C, N.S. Rao, and A.C. Saxena, "Heat transfer and Gas holdup studies in a
bubblee column: air-water-sand system", Can. J. Chem. Eng., 70, 33 (1992)
Shetty,, S.A., M.V. Kantak, and B.G. Kelkar, "Gas-Phase backmixing in bubble
columnn reactors", AIChE J., 38, 1013 (1992)
Tsutsumi,, T., W. Chen, and Y-H. Kim, "Classification and characterization of
hydrodynamicc and transport behaviors of three phase reactors", Korean J. Chem. Eng.
16,709(1999) )
78 8

ChapterChapter 5
Vinke,, P, M. van der Eijk, M. Verbree, A.F. Voskamp, and H. van Bekkum,
"Modificationn of the surfaces of a gas activated carbon and chemically activated
carbonn with nitric acid, hypochlorid, and ammonia", Carbon, 32, 675 (1994)
Vinke,, H., P.J. Hamersma, and J.M.H. Fortuin, "Adhesion of small catalyst particles to
gass bubbles: determination of small effective solid-liquid-gas contact angles", AIChE
J.,J., 37, 1801 (1991)
Yasunishi,, A., M. Fukuma, and K. Muroyama, "Measurements of behaviour of gas
bubbless and gas holdup in slurry bubble columns by a dual electroresistivity probe", J.
Chem.Chem. Eng. Japan, 19, 444 (1986)
79 9

80 0