UV-2800 Software Manual
28
UV-28 SERIES SPECTROPHOTOMETER USER and SOFTWARE MANUAL United Products & Instruments, Inc. 182-E Ridge Road Dayton, NJ 08810 732-274-1155 FAX 732-274-1151
-
Upload
edwardsamaelg -
Category
Documents
-
view
236 -
download
0
Transcript of UV-2800 Software Manual

8/12/2019 UV-2800 Software Manual
http://slidepdf.com/reader/full/uv-2800-software-manual 1/28
UV-28 SERIESSPECTROPHOTOMETER
USER and SOFTWAREMANUAL
United Products & Instruments, Inc.182-E Ridge Road
Dayton, NJ 08810732-274-1155 FAX 732-274-1151
8/12/2019 UV-2800 Software Manual
http://slidepdf.com/reader/full/uv-2800-software-manual 2/28
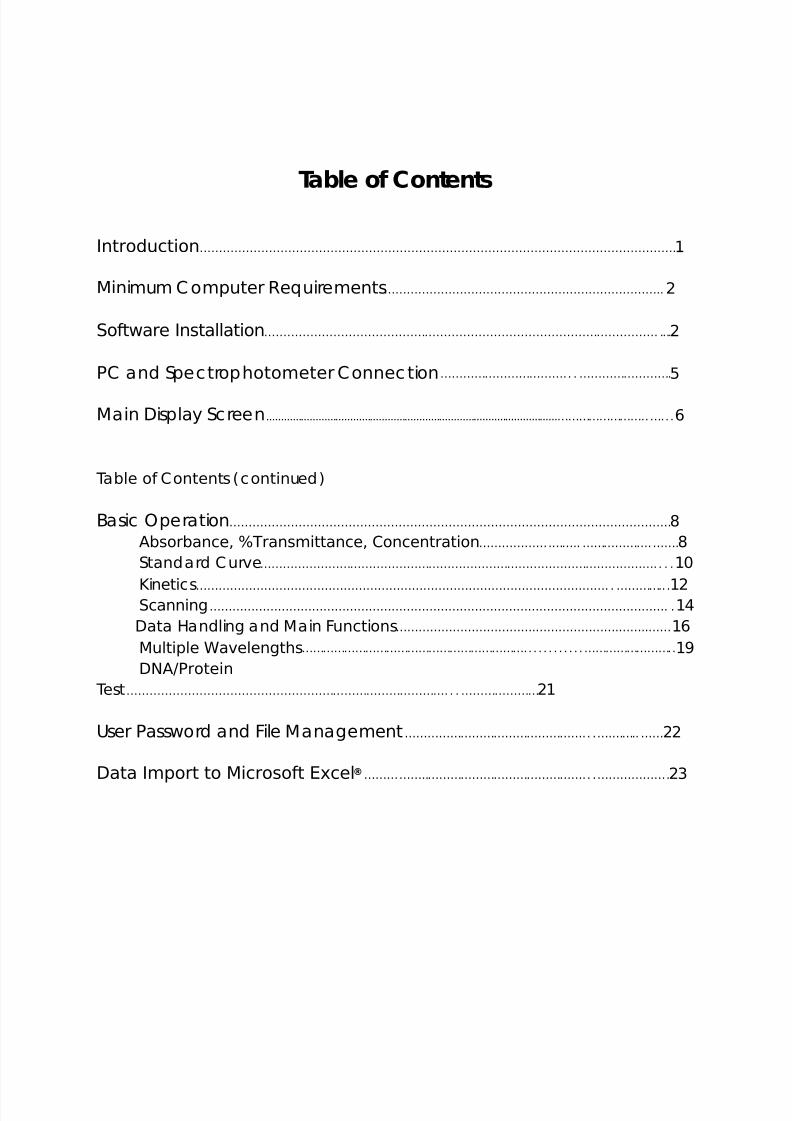
Table of Contents
Introduction ……………………………………………………………………………………………………………. 1
Minimum C omputer Requirements ……………………………………………………………….. 2
Software Installation …………………………………………………………………………………………. .... 2
PC and Spec trophotometer Connec tion …………………………….. . ……………………. 5
Main Display Screen .....................................................................................................……………………..….. . 6
Table of Contents (continued)
Basic Operation ……………………………………………………………………………………………………. 8Absorbance, %Transmittance, Concentration ……………….…….. ……………….……. 8 Standard C urve …………………………………………………………………………………………….. . . 10
Kinetics ………………………………………………………………………………………………. . ………….. . 12Scanning …………………………………………………………………………………………………………. . 14Data Handling and Main Functions ……………………………….………………….……..…… 16 Multiple Wavelengths ……………………………………………………….. . . . . . . . . . .…………………….. 19 DNA/Protein
Test …………………………………………………………………………. . . ………………… 21
User Password and File Management ………………………………………….. .….…….. …… 22
Data Import to Microsoft Excel ® ……………..…………………………………….. .………………. 23

8/12/2019 UV-2800 Software Manual
http://slidepdf.com/reader/full/uv-2800-software-manual 3/28
1
Introduction
The UNICO®
Application Software has been designed to operate with UNICO®
spectrophotometers: model 2800 £¬2802 and 2802S . The software ena bles you touse a personal computer, with Window’s 9x operating system(s), with yourspectrophotometer.
UNICO ® Application Software includes:• One CD containing the software ( UV-28 )• Manual• A 6’ null modem cable with 9-pin and 25-pin female connector’s on both
ends.
The UNICO ® Application Software performs the following methods of analysis:
Absorbance/ %Transmittance/ Concentration : permit the operator tomeasure the Absorbance, %Transmittance, Conc entration /Standard, orC oncentration/ Factor at a single wavelength within the range of190~1100 nm.
Kinetics : permit the operator to measure a sample’s change of
absorbance over a selec ted period of time, display the results graphicallyand view the da ta table.
Standard Curve : permit the operator to crea te a c alibration curve(choice of 4 curve fits) with up to 8 standard solutions at a singlewavelength and determine the c onc entration of samples (unknownsamples).
Multiple Wavelengths : permit the operator to measure up to 32 separate
wavelengths per sample for analysis of c olor or multiple components.
Scanning : permit the operator to sca n a t intervals of 0.1, 1.0, 3.0, 6.0 and12.0 nm increments at any wavelength range between 190~1100 nm.
The operator may scan up to 8 scans a nd combine any of the scans,perform math functions such as data smoothing, arithmetic, or derivativesup to the fourth order. Fea tures zoom and peak/valley pick.
DNA/ Protein Test : permit the operator to c alculate the DNA/RNA
8/12/2019 UV-2800 Software Manual
http://slidepdf.com/reader/full/uv-2800-software-manual 4/28
2
conc entration and the protein concentration using factors set from the
Warburg Equa tion 1. The test displays the individual absorbance(including optional reference wavelength absorba nce), the AbsorbanceRatio, DNA c onc entration , and Protein concentration.
Minimum Computer Requirements
To properly install and operate the enclosed software, it is required to have thefollowing minimum computer configuration
Personal Computer (PC) with the following minimum configuration:• Pentium chip with Window’s 95 or later• 10MB free space on hard d rive• 32MB RAM• RS-232C and printer ports• Keyboard and PS/2 mouse• VGA C olor Monitor• CD-ROM drive
NO TE: The UNICO ® Application Software provided will NOT function with aMa cintosh/Apple c omputer.
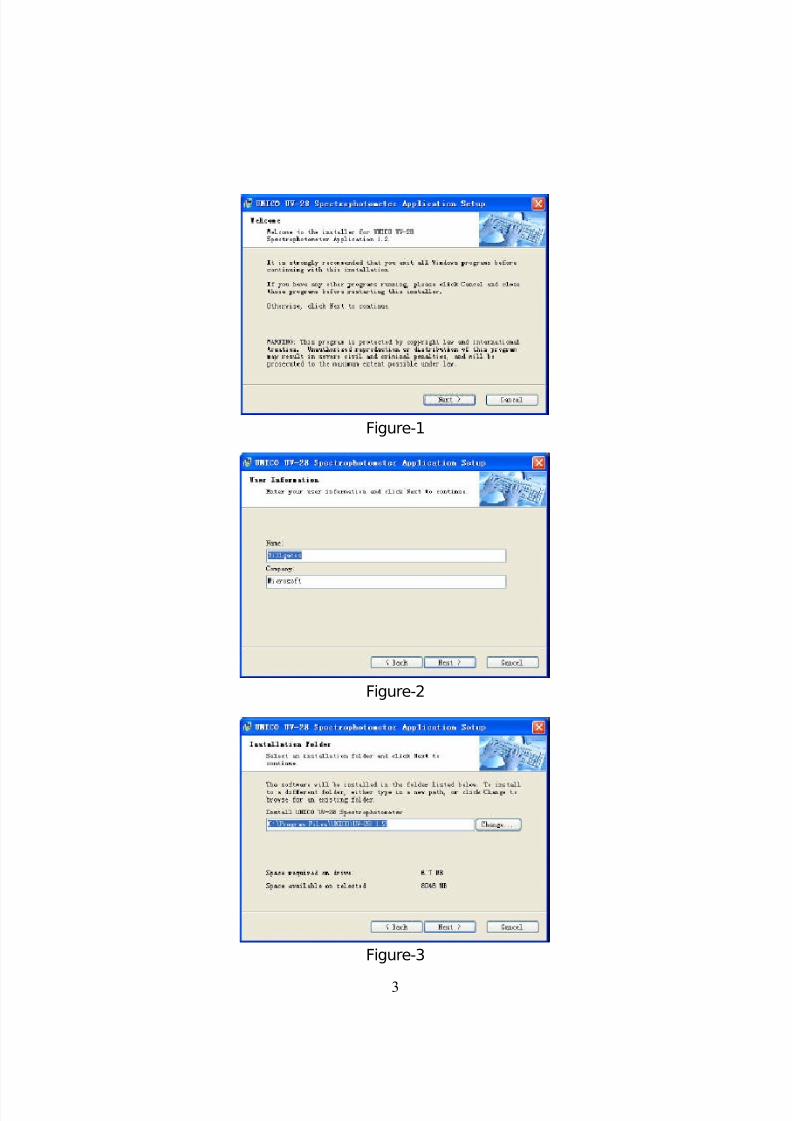
Software Installation
Loa d ing Sof twa re t o Co m p ute r
To install the software, please close any open programs and disconnec t from theInternet if online, then follow the instructions below.
Step 1: Insert UNICO ® Application Software CD into the CD drive of your PC .Step 2: Click Setup.exe to start setup(Figure-1).Step 3: Type your Name and Your Company Name as Figure-2 shown, then c lick Next
button and go to Step 4 .Step 4: Choose the Folder where you want the softwa re to be installed(Figure-3). If
the folder selec tion is OK, then c lick Next button and go to Step 5 .Setp 5: Click Next button (Figure-4) to continue installation.Step 6: Finished setup and c lick Finish button to end the installation(Figure-5). The
UNICO UV-28 icon will be shown on your desktop (Figure-6).
8/12/2019 UV-2800 Software Manual
http://slidepdf.com/reader/full/uv-2800-software-manual 5/28
3
Figure-1
Figure-2
Figure-3

8/12/2019 UV-2800 Software Manual
http://slidepdf.com/reader/full/uv-2800-software-manual 6/28
4
Figure4
Figure-5
Figure-6

8/12/2019 UV-2800 Software Manual
http://slidepdf.com/reader/full/uv-2800-software-manual 7/28
5
PC and Spectrophotometer Connection
Step 1: Remove the Connec tion Cable from the ba g.Step 2: Locate the RS-232C port on the ba ck of your computer. C onnect
the female 9-pin (small) connec tor to the male 9-pin computer andsec ure with the built-in screws. If your computer does not have amale 9-pin connec tion, use the male 25-pin connector. ONLY USEthe 25-pin connector if your computer does not have a male 9-pinconnec tor (common for older, upgraded c omputers).
Step 3: Your model UV-28 Series Spec trophotometer has a male 9-pin and25-pin null modem RS-232C port on the right-side pa nel, circled andmarked “ RS-232” . Connect the other end of the ca ble to theinstrument and secure tightly. If using a 9-pin connector with yourcomputer, then use the 9-pin connec tor, and if using the 25-pinconnec tor for your computer, then use the 25-pin on the instrument.
Step 4: Turn on your computer (if not alrea dy on) and yourspec trophotometer (if not a lready on).
Step 5: Click on the Start button on your Window’s software.Step 6: Scroll to Programs and loc ate the Unico Application Software .
Step 7: Click on the UV-28 icon (Figure-6). The beginning screen will appea r.Step 8: Selec t the port in the pop -up window (Figure-7) and press the ENT
button on the model UV-28 Operation Panel, and then c lick OK onyour Computer Screen. The UV-28 will enter connection stage(Figure-7) and initialize to go to the main screen (Figure-8).
Figure-7

8/12/2019 UV-2800 Software Manual
http://slidepdf.com/reader/full/uv-2800-software-manual 8/28
6
Figure-8
WARNING: you need click the ENT button on the instrument before c lick OK button. Otherwise the c onnection self testing may fail, you need shutdown themodel UV-28 and restart.
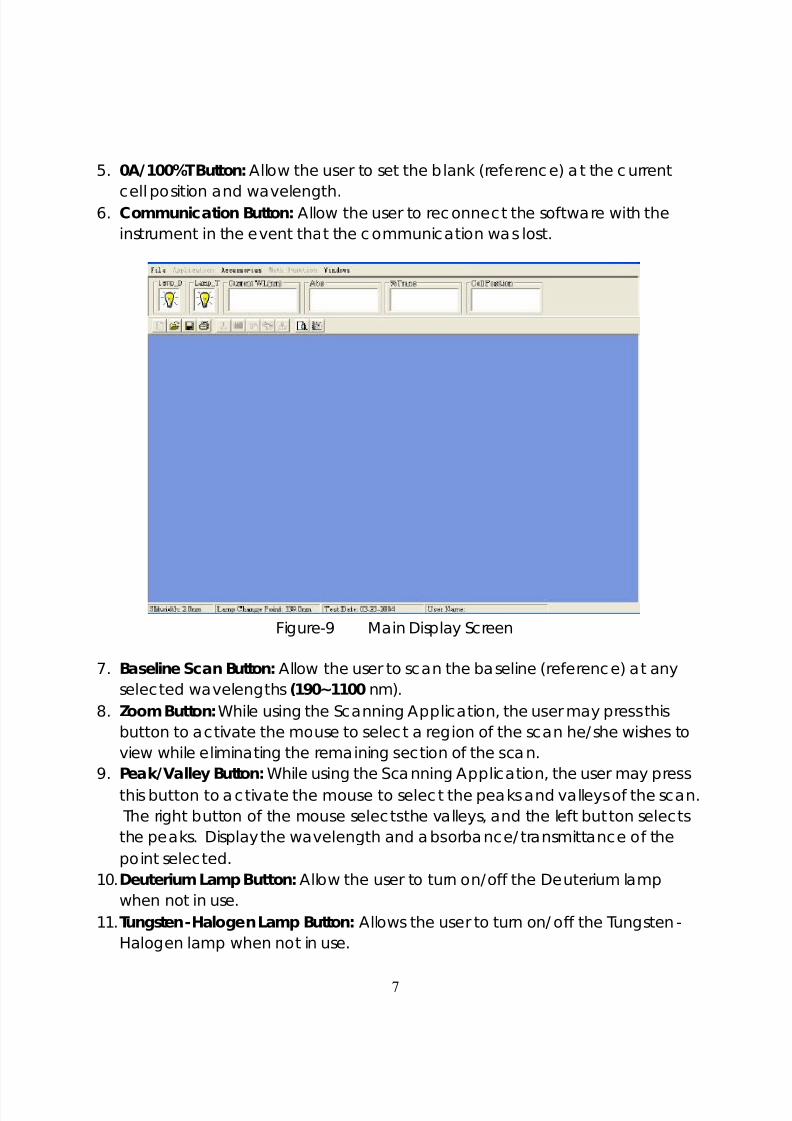
Main Display Screen
The Main Display Screen has the following functions:
1. File Manager Buttons: Allow the operator to open a new file, existing file, orsave the c urrent file in the direc tory of the operator’s choosing.
2. Print Button: Print the data from the current ac tive (open) file. 3. Wavelength Button: Allow the operator to move the monochromator to any
single wa velength between 190~1100 nm. Selec ts to the 1/10 of awavelength.
4. Cell Position Button: If the user has a 4-position Automatic Cell Holder (modelUV-28 , this allows the user to move the holder to a ny of the 8 positions.
8/12/2019 UV-2800 Software Manual
http://slidepdf.com/reader/full/uv-2800-software-manual 9/28
7
5. 0A/100%T Button: Allow the user to set the b lank (referenc e) a t the c urrent
cell position and wavelength. 6. Communication Button: Allow the user to rec onnec t the software with the
instrument in the event that the c ommunication wa s lost.
Figure-9 Main Display Screen
7. Baseline Scan Button: Allow the user to scan the baseline (referenc e) a t anyselected wavelengths (190~1100 nm).
8. Zoom Button: While using the Scanning Application, the user may press thisbutton to ac tivate the mouse to selec t a region of the scan he/ she wishes toview while eliminating the remaining section of the sca n.
9. Peak/Valley Button: While using the Sca nning Application, the user may pressthis button to a c tivate the mouse to selec t the peaks and valleys of the scan. The right button of the mouse selec ts the valleys, and the left but ton selectsthe peaks. Display the wavelength and a bsorba nce/ transmittance of thepoint selected.
10. Deuterium Lamp Button: Allow the user to turn on/off the Deuterium lampwhen not in use.
11. Tungsten-Halogen Lamp Button: Allows the user to turn on/ off the Tungsten -Halogen lamp when not in use.

8/12/2019 UV-2800 Software Manual
http://slidepdf.com/reader/full/uv-2800-software-manual 10/28
8
Basic Operation
Absorbance, %Transmittance, Concentration
The Absorbance, %Transmittance, Concentration (A/%T/C ) method has fourmodes of operation:
1. Absorbance
2. %Transmittanc e3. Concentration/Standard4. Concentration/Factor
Absorbance and %Transmittance Modes The operation procedure is shown below. Figure-10 is its display Screen.
Figure-10 A/ T/C Screen
Step 1: Insert referenc e cell (blank) into position 1 of the cell holder (cell
8/12/2019 UV-2800 Software Manual
http://slidepdf.com/reader/full/uv-2800-software-manual 11/28
9
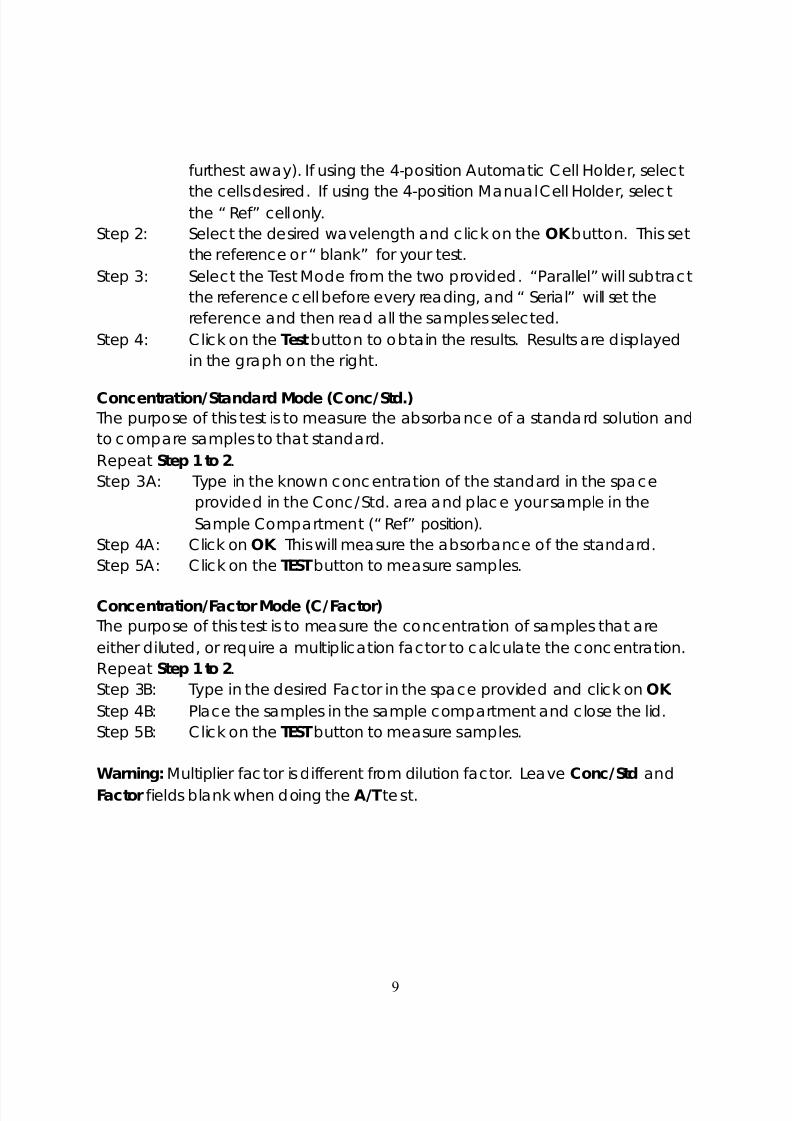
furthest away). If using the 4-position Automatic Cell Holder, select
the cells desired. If using the 4-position Manual Cell Holder, selec tthe “ Ref” cell only.
Step 2: Select the desired wavelength and c lick on the OK button. This setthe reference or “ blank” for your test.
Step 3: Select the Test Mode from the two provided . “Parallel” will subtrac tthe reference c ell before every reading, and “ Serial” will set thereference and then read all the samples selected.
Step 4: Click on the Test button to obtain the results. Results are displayedin the graph on the right.
Concentration/Standard Mode (Conc/Std.) The purpose of this test is to measure the absorba nce of a standa rd solution andto c ompare samples to that standard.Repeat Step 1 to 2 .Step 3A: Type in the known conc entration of the standard in the spa ce
provided in the Conc /Std. area and plac e your sample in theSample Compartment (“ Ref” position).
Step 4A: Click on OK . This will measure the absorbance of the standard.Step 5A: Click on the TEST button to measure samples.
Concentration/Factor Mode (C/Factor) The purpose of this test is to measure the concentration of samples that areeither diluted, or require a multiplication factor to calculate the conc entration.Repeat Step 1 to 2 .Step 3B: Type in the desired Factor in the space provided and click on OK .Step 4B: Place the samples in the sample compartment and close the lid.Step 5B: Click on the TEST button to measure samples.
Warning: Multiplier fac tor is different from dilution factor. Leave Conc/Std andFactor fields blank when doing the A/T te st.
8/12/2019 UV-2800 Software Manual
http://slidepdf.com/reader/full/uv-2800-software-manual 12/28
10
Standard Curve
The Standard Curve (calibration curve) method a llows the operator to:• Measure up to 8 standard samples• Graph standard curves with 4 curve fits, including:
1. Linea r Squares (Least squares method). Calculates and displays the slope,y-intercept, and C orrelation Coefficient for the given standards.
2. Linear Thru Zero (sets the y-intercep t equal to zero; therefore, the curve isforced through zero). Calculates and displays the slope and correlationcoefficient.
3. 2 nd Order (sec ond order derivative of the Linear Squares Model).Calculates and d isplays the coefficients. This method is used for non-linearstandard curves or curves with a C orrelation Coefficient of less than 90.
4. Segmented (straight line). Uses the standards as nodes to connect eachpoint. No c alculated results are displayed.
• Selec t, view and ed it existing standard curves• Calculate the conc entrations of samples with unknown conc entrations.

8/12/2019 UV-2800 Software Manual
http://slidepdf.com/reader/full/uv-2800-software-manual 13/28
11
Figure-11 Standard C urve Setup for Unknowns
Operation Procedure
To get started, click on “ Application” from the Menu bar and select StandardCurve.Step 1: Selec t the c ell position a ccording to the number of Standard Samples
you want to measure (for more than 3 standards, selec t the All buttonand place the samples in order from least conc entration to highestconcentration.
Step 2: Selec t the wa velength desired and c lick on OK .Step 3: Selec t the number of standards (2~8).Step 4: Type in the c onc entration of the standards pressing the Enter key on your
computer keyboard.Step 5: To measure the absorbance each standard, select the cell position from
the tool ba r and double-click on the standa rd to be mea sured (afterthe cell position is moved to the desired position). Repeat for eachstandard.
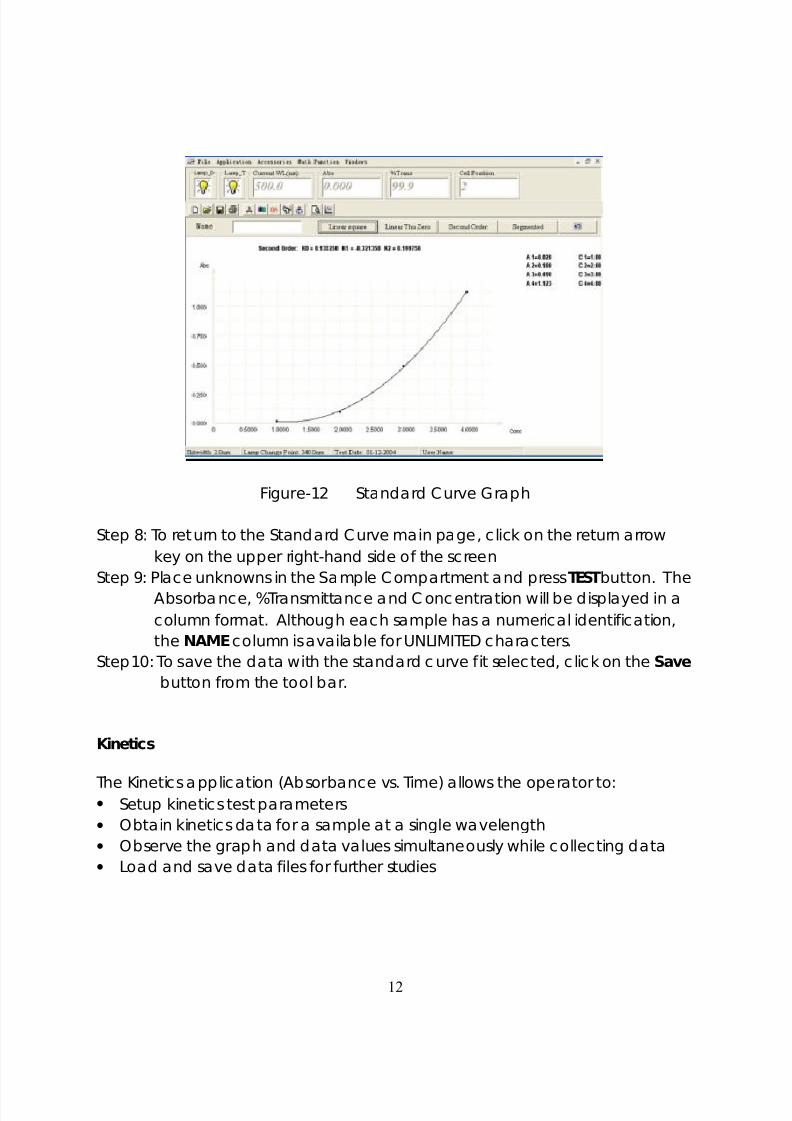
Step 6: Click on the Draw button to g raph a curve.Step 7: C lick on one of the four buttons for the desired calibration curve ( i.e.
Least Squares). See Figure-12 below.
8/12/2019 UV-2800 Software Manual
http://slidepdf.com/reader/full/uv-2800-software-manual 14/28
12
Figure-12 Standard C urve Graph
Step 8: To return to the Standard C urve main page, c lick on the return arrowkey on the upper right-hand side of the screen
Step 9: Place unknowns in the Sample C ompartment and press TEST button. TheAbsorba nce, %Transmittance and C onc entration will be displayed in acolumn format. Although each sample has a numerical identification,the NAME column is available for UNLIMITED characters.
Step10: To save the data with the standard c urve fit selec ted, c lick on the Save button from the tool bar.
Kinetics
The Kinetics a pplication (Absorbance vs. Time) allows the operator to:• Setup kinetics test parameters• Obtain kinetics da ta for a sample at a single wavelength• Observe the graph and data values simultaneously while collecting data• Load and save data files for further studies

8/12/2019 UV-2800 Software Manual
http://slidepdf.com/reader/full/uv-2800-software-manual 15/28
13
Figure-13 Kinetic s Display
Operation ProcedureStep1: Selec t the number of samples you will test (1~3) by clicking on the Cell
Positions you will use.Step2: Selec t the wavelength for the study and click on OK .Step3: Selec t your expected Total Run Time (in sec onds) for the rea ction.Step4: Selec t the Interval Time. This is the time interval for which
measurements will be rec orded.Step5: Selec t the time delay, or the time nec essary to begin the rea ction
before the Total Run Time is started .Step6: Selec t the High and Low Limits of the graph. This is the selec tion of
the minimum and maximum absorbance range for the graph of the data.Step7: Selec t a multiplication fac tor for the c onc entration of the measured
sample.Step8: Click OK to enter the pa rameters.Step9: C lick on Start to begin the Time Delay and the rec ording of da ta.
NOTE : Click on the Data Table if you wish to view the data as it is being rec orded .

8/12/2019 UV-2800 Software Manual
http://slidepdf.com/reader/full/uv-2800-software-manual 16/28
14
Scanning
8/12/2019 UV-2800 Software Manual
http://slidepdf.com/reader/full/uv-2800-software-manual 17/28

8/12/2019 UV-2800 Software Manual
http://slidepdf.com/reader/full/uv-2800-software-manual 18/28
16
collec ted within the wavelength range. The options are 0.1, 1.0, 3.0, 6.0,
12.0 nm.Step4: Selec t your starting and end ing wavelengths.Step5: Select the High and Low Limits. The High Limit rep resents the y-
maximum for the graph and the Low Limit is the y-minimum for the graph. This can be changed anytime after collec ting the data if da ta is off thegraph, etc.
Step6: C lick on OK . If you have not rec orded a reference baseline, thenthe software will prompt you to do so. This ba seline will be recorded for aslong as you a re operating the software with the instrument or until thesoftware or instrument is off.
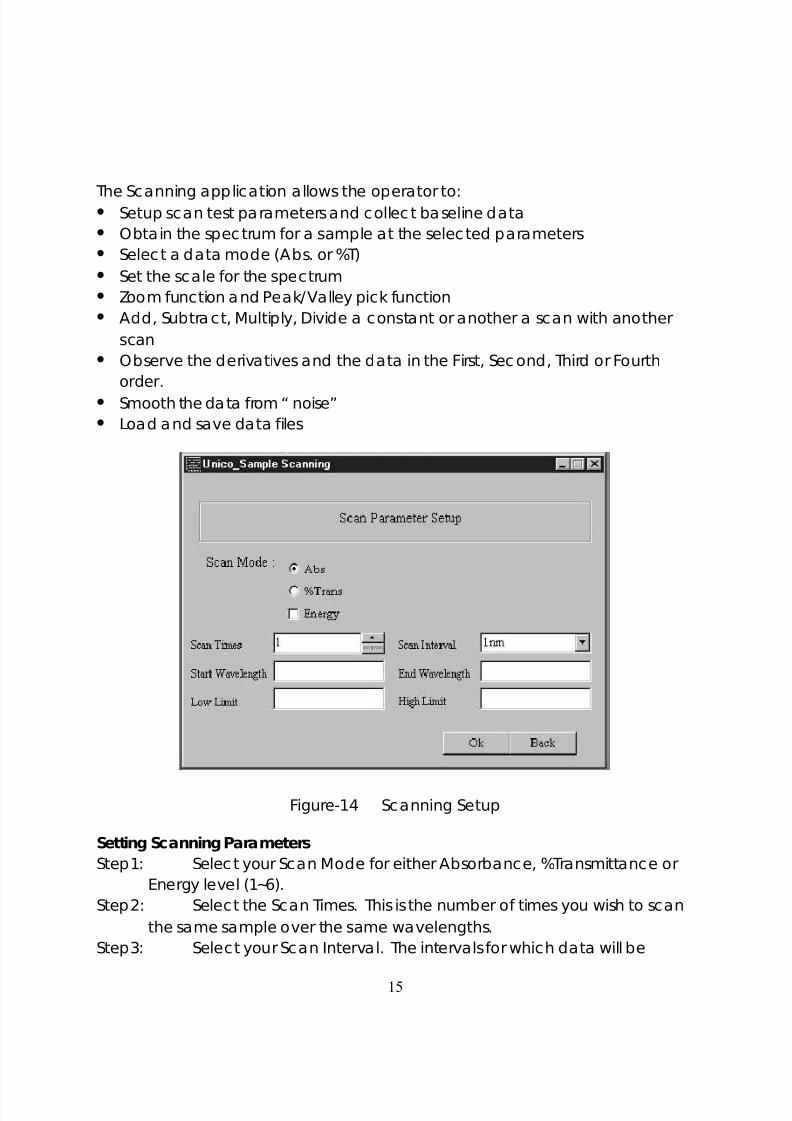
Figure-15 Scanning Display
Step7: After the baseline is recorded, click on OK again (Figure 14). TheScanning Display will then appea r (Figure 15).
Step8: Place your sample in the Sample Compartment and selec t theproper cell position from the tool bar, and click on OK . Now you are readyto rec ord your sample spec trum.
Step9: Selec t the Current Channel, or the channel for the graph to bemeasured, from the drop -down menu.

8/12/2019 UV-2800 Software Manual
http://slidepdf.com/reader/full/uv-2800-software-manual 19/28
17
Step10: Type the name of the graph to be stored with the file (unlimited
characters).Step11: Click on the Scan button to collec t the da ta and observe the scan. If
you prefer, you may c lick on the Data Table to view the exac t values.
Data Handling and Math Functions Now that you have c ollec ted your data for the sample spec trum(s), you havethese options to choose:1. Use the Zoom function to expand a selec ted area of the graph.2. Use the Peak/Valley function to locate the peaks and valleys of the graph.3. Use the following options from the “Math Function” located on the top tool
bar.• Derivative (First, Second, Third, Fourth)• Arithmetic (Multiply, Divide, Add, Subtract) a scan or a constant• Smooth (minimize the noise on the data graph)• Refresh graph (displays the original graph, or “ raw data” , if the graph has
been altered (zoom, math function, change of x-y coordinates)4. C hange the waveleng th (x-coordinate) and absorbance or %T (y-
coordinates) to view the desired data.
5. View the da ta from the Data Table.6. Loa d and save the data files.7. Combine graphs from one or more Channels.
Zoom Function The purpose of this function is to expa nd a sec tion of the graph to enlarge thepeaks/valleys for easy viewing.• To perform this function, click on the Zoom button from the tool ba r, move
the mouse to the upper left-hand c orner of the area desired to be enlarged.Click and hold the left -mouse button a nd move the mouse until the areadesired is highlighted with a dotted square, and release.
• To return to the full graph, go to Math Functions on the tool ba r, and click on“ Replace Graph” . This will return display the original collec ted data
Peak/Valley Function The purpose of this function is to label peaks and valleys of the graph forpresentation/notes.• To perform this function, click on the Peak/Valley button from the tool ba r.• To place the Peak label, move the mouse to the top of the pea k and click

8/12/2019 UV-2800 Software Manual
http://slidepdf.com/reader/full/uv-2800-software-manual 20/28
18
with the left mouse button. This will display the absorbance a nd wavelength.
• To remove the Peak label, click again on the displayed absorbance andwavelength with the left mouse button.
• To place the Valley label, move the mouse to the bottom of a peak (valley)and c lick with the right mouse button. This will display the a bsorbance a ndwavelength.
• To remove the Valley label, click again on the displayed absorbance andwavelength with the right mouse button.
Math Functions The UNICO ® Application Software a llows you to perform mathematicalmanipulations on data collec ted in a spec trum for the Current Channel(s). Toperform math functions, click on “ Ma th Functions” on the top tool ba r and c lickon the desired function.
• To perform a derivative function, be sure to have a Current Channelselected with da ta c ollec ted, and select one of the 4 derivatives to becalculated. The graph will automatically display the results. To view theda ta, click on “Data Table”.
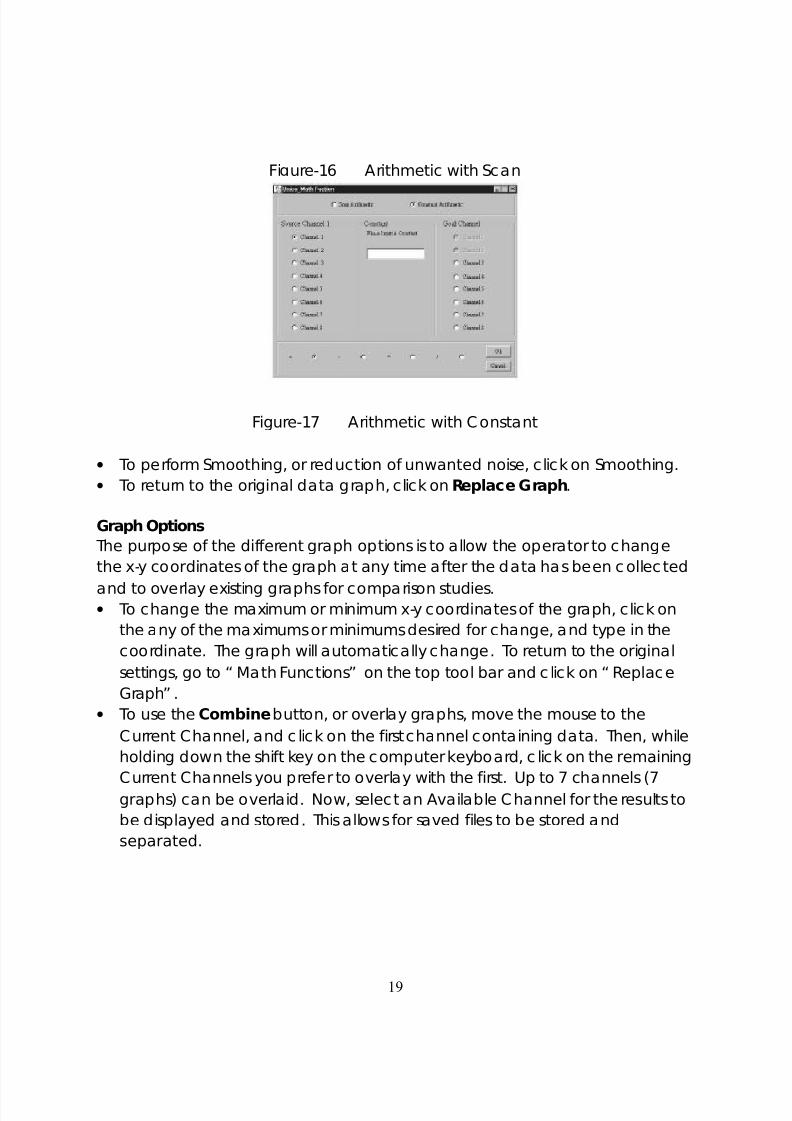
• To perform an arithmetic function with two scans, select the desired data(“ raw data” ) from Source Channel 1 (see Figure-16) a nd the d ata that thefunction will be calculated, Source C hannel 2. Then select an available“ Goa l Channel” , or the channel for the results to be displayed. Select thefunction desired (multiply, add, etc) and c lick on “ OK” . The result willautomatically be displayed on the graph.
• To perform an arithmetic function with a scan and a constant, repea t thesetup, except enter the desired constant (Figure-17).
8/12/2019 UV-2800 Software Manual
http://slidepdf.com/reader/full/uv-2800-software-manual 21/28
19
Figure-16 Arithmetic with Scan
Figure-17 Arithmetic with C onstant
• To perform Smoothing, or reduction of unwanted noise, click on Smoothing.• To return to the original data graph, click on Replace Graph .
Graph Options The purpose of the different graph options is to allow the operator to changethe x-y coordinates of the graph a t any time after the data has been c ollec ted
and to overlay existing graphs for comparison studies.• To change the maximum or minimum x-y coordinates of the graph, click on
the any of the maximums or minimums desired for change, and type in thecoordinate. The graph will automatically change. To return to the originalsettings, go to “ Math Functions” on the top tool bar and c lick on “ ReplaceGraph” .
• To use the Combine button, or overlay graphs, move the mouse to theCurrent Channel, and c lick on the first channel containing data. Then, whileholding down the shift key on the computer keyboard, c lick on the remaining
Current Channels you prefer to overlay with the first. Up to 7 channels (7graphs) can be overlaid. Now, selec t an Available C hannel for the results tobe displayed and stored. This allows for saved files to be stored andseparated.
8/12/2019 UV-2800 Software Manual
http://slidepdf.com/reader/full/uv-2800-software-manual 22/28
20
Multiple Wavelengths
The purpose of the Multiple Wavelengths app lication is to allow the operator to
selec t up to 32 different wa velengths for sample measurements. Eachmeasurement displays the user-entered name, wavelength, Absorbance and%Transmittanc e.
A unique fea ture is the allowance of naming individua l wavelength samples forea ch sample. Next to the column for the wavelength, the operator may enteran alphanumerical name with no character limitation. This is useful whenidentifying individual components for each sample.

8/12/2019 UV-2800 Software Manual
http://slidepdf.com/reader/full/uv-2800-software-manual 23/28
21
Figure-18 Multiple Wavelengths Screen
Operation ProcedureStep1: If you are operating a model UV-28 with a M anual Cell Holder or if
you a re operating with a single Cell Holder, select the Manual Test in the Test Mode box. If you have a model UV-28 with an Automatic C ellHolder, selec t Auto Test and click the number of cell positions desired.
Step2: Select the number of wa velengths to be tested in the Test Wls boxfrom the drop -down menu.
Step3: Enter the desired wa velengths to be tested.Step4: If using the automated holder, plac e the referenc e cell in position 1
and the sample(s) in the Sample C ompartment and c lick on Test . Theresults will be displayed in the tab le. If the samples will need to be named,then this may be entered at any time.
NOTE : if operating in the Manual Test Mode , then the operator must change thewavelengths by using the Wavelength Button from the tool bar, anddouble-click the “ boxes” for each sample. If using the Manual Cell Holder,it is advised to leave the referenc e c uvette in the sample holder and besure to plac e the reference c uvette in the light pa th when changing

8/12/2019 UV-2800 Software Manual
http://slidepdf.com/reader/full/uv-2800-software-manual 24/28
22
wa velengths. This is due to the automated referenc ing when the
wavelength is changed.
DNA/Protein Test
The purpose of the DNA/Protein app lication is to allow the operator to enter theknown factors from the Warburg Equation 1, and ob tain the conc entration ofDNA or RNA a nd the Protein within the oligonucleotide. The operator has theoption to selec t a internal referenc e wavelength (default value of 320 nm),enter a multiplication fac tor for the DNA Ratio result, and a ssign units to the file.
8/12/2019 UV-2800 Software Manual
http://slidepdf.com/reader/full/uv-2800-software-manual 25/28
23
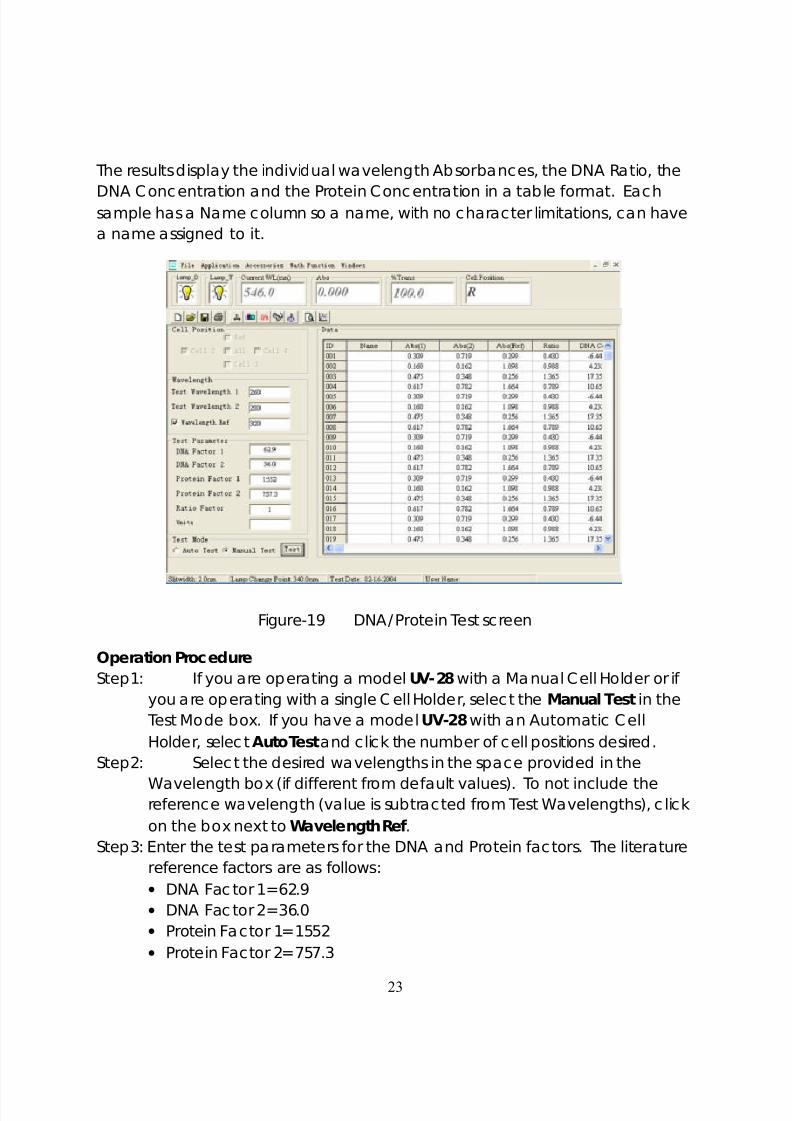
The results display the individual wavelength Absorbances, the DNA Ratio, the
DNA C onc entration and the Protein Conc entration in a table format. Eachsample has a Name column so a name, with no character limitations, can havea name assigned to it.
Figure-19 DNA/Protein Test screen
Operation ProcedureStep1: If you are operating a model UV-28 with a Ma nual Cell Holder or if
you are operating with a single C ell Holder, selec t the Manual Test in the Test Mode box. If you have a model UV-28 with an Automatic C ellHolder, selec t Auto Test and click the number of cell positions desired.
Step2: Selec t the desired wavelengths in the space provided in the
Wavelength box (if different from default values). To not include thereference wavelength (value is subtracted from Test Wavelengths), c lickon the box next to Wavelength Ref .
Step3: Enter the test pa rameters for the DNA and Protein fac tors. The literaturereference factors are as follows:• DNA Fac tor 1= 62.9• DNA Fac tor 2= 36.0• Protein Factor 1= 1552• Protein Factor 2= 757.3

8/12/2019 UV-2800 Software Manual
http://slidepdf.com/reader/full/uv-2800-software-manual 26/28
24
Step4: If using the automated holder, plac e the referenc e cell in position 1
and the sample(s) in the Sample Compartment and click on Test . Theresults will be displayed in the table. If the samples will need to be na med,then this may be entered at any time.
Eq ua t io ns a nd c a lc u la t io ns fo r t he DNA / Pro t e in Test :
A1=Absorbance at 260 nmA2=Absorbance at 280 nmA3=Absorbance a t referenc e wavelength (320 nm)
DNA Eq ua tion: Protein Eq ua tion :(A 1-A3)F1 – (A 2-A3)F2 (A 2-A3)F3 – (A 1-A3)F4
w h e r eF1= 62.9 F3= 1552F2= 36.0 F4= 757.3
DNA Ra t io eq ua t ion :
Ratio= A 1-A3A 2-A 3
User Password and file Management
8/12/2019 UV-2800 Software Manual
http://slidepdf.com/reader/full/uv-2800-software-manual 27/28
25
UNICO ® Application Software allows you to use a pa ssword to protec t your own
test data saved under UNICO®
file. When you open UNICO®
software, a smallwindow will appear. Please follow the screen, enter user name and passwordbefore you start. Next time you want to open the saved file, you will need toenter the exact user name and password. Please note it is case sensitive.
You cannot open your da ta file when the software is running under somebodyelse’s name (or no na me). If the UNICO ® Application Software is up running, youcan go to file drop down list, selec t new user, then type your user name andpassword.
Data import to Microsoft Excel ®
By referring to the following steps, you can transfer any of the UNICO ® App lica tion Software test da ta to a Window’s Excel program:
Step 1: In Microsoft Exc el ®, click on File and c lick Open. Step 2: Select the saved file you wish to import.Step 3: After the Excel Text Import Wizard appea rs, selec t Delimited and c lick on
the Next button.Step 4: Close the Tab delimiter and select Comma delimiter, then c lick the Next
button.Step 5: Selec t the row from which you wa nt the import to start.Step 6: Click the Finish button and the test da ta will be imported into your Excel
sprea dsheet. Here, further calculations can be performed from the“ raw” data collected.
Step 7: Save the imported file under a DIFFERENT FILE Name if you still want tokeep and open the original UNICO ® da ta file in UNICO ® ApplicationSoftware. The original UNICO ® data file will be modified by the Excel © format during importing and the modified file c an not be opened fromUNICO ® A pplication Software.
Note: Since Microsoft Excel ® does not have file protec tion password

8/12/2019 UV-2800 Software Manual
http://slidepdf.com/reader/full/uv-2800-software-manual 28/28
26
feature, the imported file will not be a password-protec ted file.