UTTAC Annual Report 2002 - tac.tsukuba.ac.jp
115
UTTAC-71, 2003 ANNUAL REPORT April 1,2002 – March 31, 2003 TANDEM ACCELERATOR CENTER UNIVERSITY OF TSUKUBA http://www.tac.tsukuba.ac.jp/
Transcript of UTTAC Annual Report 2002 - tac.tsukuba.ac.jp
UTTAC-71, 2003
ANNUAL REPORT
April 1,2002 – March 31, 2003
TANDEM ACCELERATOR CENTER
UNIVERSITY OF TSUKUBA
http://www.tac.tsukuba.ac.jp/

PREFACE
This annual report describes research activities in UTTAC during the period from April 2002 to
March 2003. The 12UD Pelletron tandem accelerator was successfully operated until the end of
February 2003. Total beam time used for experiments was 1663 hours. During the scheduled
maintenance performed at the end of March 2003, the structure in the terminal stripping channel was
modified to improve the performance of the AMS system. A new project was initiated with the 1 MV
tandetron accelerator. It is aimed at the investigation of interaction between low-energy cluster ions
and atoms or molecules at the surface of materials. Carbon cluster ions Cn (n ≤ 8) were successfully
extracted at 20 keV/amu with intensities sufficiently available in experiment.
In nuclear physics, investigations were continued on the proton polarization in the 208
Pb(d,p)209
Pbgs
reaction at 20 MeV, the analyzing powers in the 6
Li(d,p)7
Li reaction at 90 keV, the total-reaction cross
section for protons on Si nuclei near the (p,n) threshold and CDCC analysis. Measurements of
spin-correlation parameters with a polarized-deuteron target and polarized-deuteron beam were started
in collaboration with Nagoya University.
Steady progress was made on ion- and cluster-induced secondary electron spectroscopy, the charge
state of heavy ions through Be, atomic cluster physics, NMR studies on electronic states of 3d
transition-metal oxides, Moessbauer experiments and the elastic property of metals after proton
irradiation. A new technique was developed on the production of 3D nano-structures with heavy ion
bombardment on TiO2.
The microprobe system for hydrogen analysis was finished. The measurement of the hydrogen
concentration in melt inclusions was initiated for samples taken at some places near Zao volcano in
Miyagi prefecture Japan. The final data for the neutron dosimetry of Hiroshima atomic bomb provided
by our AMS group were in good agreement with data reported by Munich and Livermore groups, and
with the results obtained from residual activity measurements. The measurement of 36Cl produced in
concrete shields of various accelerator facilities began as a new subject of AMS.
The director of the Tandem Accelerator Center changed from Prof. Kohei Furuno to Prof. Hiroshi
Kudo on April 1, 2003.
Kohei Furuno
- i -

CONTENTS
1. ACCELERATOR AND EXPERIMENTAL FACILITIES
1.1 Accelerator operation 2002.............................................................................................. ........ 1
1.2 Performance tests of the Tsukuba high-energy nuclear microprobe ........................................ 7
1.3 Development of a laser ion source for metallic ions...............................................................11
1.4 Development of the gated MSTPC........................................................................................ 13
2. NUCLEAR PHYSICS
2.1 Analyzing powers for the 6
Li(d,p)7
Li reaction at incident energy of 90 keV ........................ 15
2.2 Measurement of proton polarization in 208
Pb(d,p)209
Pb reaction at incident energy
of 20 MeV...................................................................................................................... ....... 16
2.3 Spin correlation measurement for 2
H(d,p)3
H reaction at incident energy of 20 MeV ........... 17
2.4 Energy dependence of proton elastic scattering from 28
Si around 28
Si(p,n) reaction
threshold energy............................................................................................................... ..... 20
2.5 Energy dependence of deuteron total reaction cross sections below Coulomb barrier.......... 22
2.6 CDCC analysis of triple differential cross section of 208
Pb(d,pn) reaction at Ed= 56 MeV .. 24
2.7 Numerical evaluation of negative energy Coulomb wave functions ..................................... 28
3. ATOMIC AND SOLID STATE PHYSICS, AND CLUSTER SCIENCE
3.1 Equilibrium charge states of Cu, Br and I ions passing through Be foils .............................. 30
3.2 Electron emission by fast cluster impact on solids ................................................................ 32
3.3 Low-energy electron emission from solids bombarded by fast dressed ions......................... 35
3.4 Elastic recoil detection analysis of polyimide-based layers fabricated on Si ........................ 45
3.5 57
Fe Moessbauer study of α' iron-nitride ............................................................................... 48
3.6 Characteristic mechanical properties of high-density nanocrystalline FCC metals............... 53
3.7 Cluster impact secondary electron emission from metal surface........................................... 56
3.8 TOF mass spectrometer for the experiment with highly-charged ion beam .......................... 58
3.9 Cluster abundance spectra of In, Ga, Bi and Sn cluster produced by sputtering
with Xe atoms .................................................................................................................. ..... 61
3.10 Plasma diagnostics of the plasma of liquid-He-free superconducting ECR ion source
with use of a laser ablation method..................................................................................... 63
3.11 The science of 3d transition-metal oxide system ................................................................. 66
3.12 3D nano-fabrication of rutile TiO2 single crystals with swift heavy ion.............................. 71
3.13 Structual transitions of Au55
isomers ................................................................................... 73
- iii -

4. ION BEAM APPLICATION
4.1 Impurities in carbon foils produced by means of arc-discharge method ............................... 75
4.2 Calibration of hydrogen concentration by alpha-gamma angular correlation method .......... 77
4.3 The unfolding of hydrogen distribution in thick mineral samples from ERCS spectra......... 82
4.4 Development of hydrogen analysis by using proton-proton elastic recoil coincidence
method for mineral samples.................................................................................................. 87
4.5 Status of Tsukuba AMS system ............................................................................................ . 94
4.6 Comparison of Cl-36 standard samples ................................................................................. 97
4.7 Measurement of 36
Cl induced in shielding concrete of various accelerator facilities
using AMS ...................................................................................................................... ...... 99
5. LIST OF PUBLICATIONS ...................................................................................101
6. THESES .......................................................................................................................104
7. SEMINARS.................................................................................................................105
8. SYMPOSIUM ............................................................................................................106
9. LIST OF PERSONNEL..........................................................................................107
- iv -

1.1 Accelerator operation 2002
K. Sasa, S. Ishii, H. Kimura, H. Oshima, Y. Tajima, T. Takahashi, Y. Yamato,
M. Yamaguchi, T. Komatsubara, K. Shima and K. Furuno
[1] The 12UD Pelletron tandem accelerator
The total operating time and the experimental beam time were 2011.6 and 1662.8 hours, respectively.
The operating time was about 90.5 % as compared with that in 2001. Fig.1 shows the distribution of
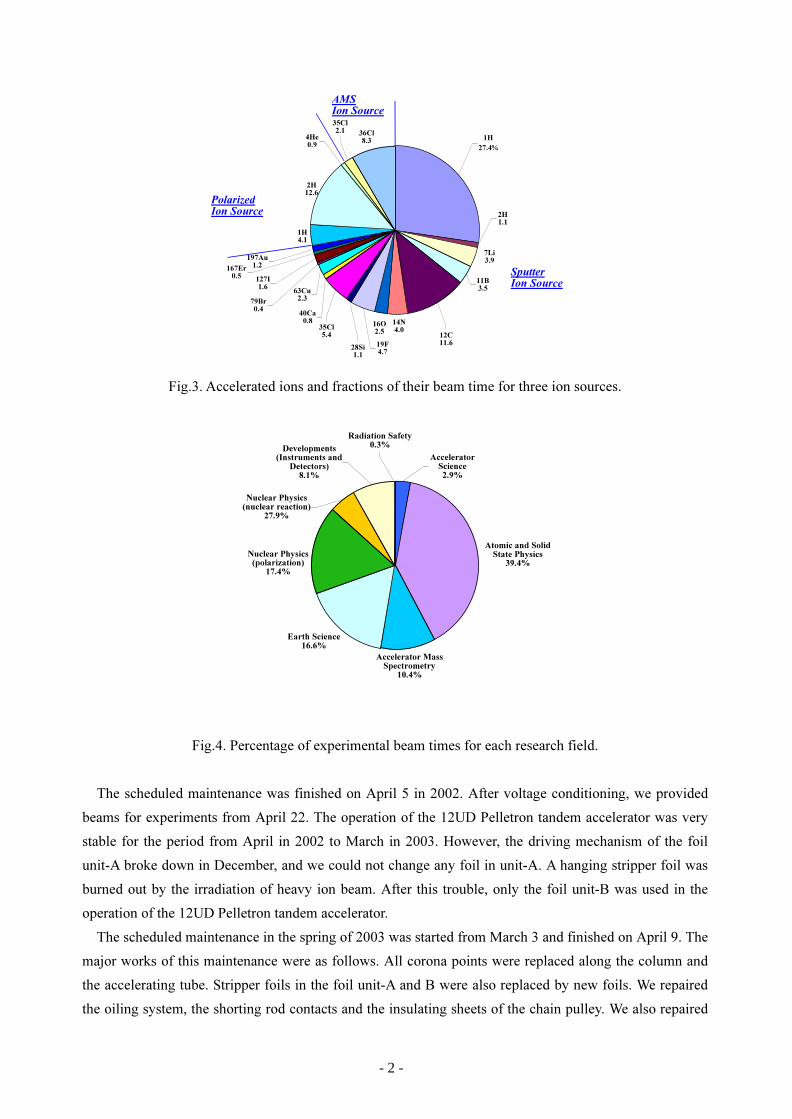
operation hours every month. The beam time at various terminal voltages is shown in Fig.2. Fig.3 presents
the summary of accelerated ions and fractions of their beam time for three ion sources. Fig.4 shows the
percentage of experimental beam times for each research field. The voltage around 10 MV was used most
frequently for experiments in comparison with other terminal voltages. In the year of 2002, the research
fields of atomic and solid state physics, AMS and earth science increased the share of experimental beam
time, while the research field of nuclear physics decreased it as compared with that in the last year.
0
50
100
150
200
250
Machine O
peration H
ours
2002Apr May Jun Jul Aug Sep Oct Nov Dec 2003
Jan
Feb Mar
Fig.1. Accelerator operation hours per month from April in 2002 to March in 2003.
0 100 200 300 400 500 600
Beam Hours
2 MV
3 MV
4 MV
5 MV
6 MV
7 MV
8 MV
9 MV
10 MV
11 MV
Term
inal V
oltage
Fig.2. Beam time summed up every 1 MV of terminal voltages.
- 1 -
127I
1.6
167Er
0.5
79Br
0.4
35Cl
5.4
14N
4.0
12C
11.6
35Cl
2.1
4He
0.9
36Cl
8.3
2H
12.6
40Ca
0.8
63Cu
2.3
28Si
1.1
19F
4.7
197Au
1.2
1H
4.1
16O
2.5
11B
3.5
7Li
3.9
2H
1.1
1H
27.4%
AMS
Ion Source
Polarized
Ion Source
Sputter
Ion Source
Fig.3. Accelerated ions and fractions of their beam time for three ion sources.
Nuclear Physics
(nuclear reaction)
27.9%
Nuclear Physics
(polarization)
17.4%
Radiation Safety
0.3%Developments
(Instruments and
Detectors)
8.1%
Accelerator
Science
2.9%
Atomic and Solid
State Physics
39.4%
Accelerator Mass
Spectrometry
10.4%
Earth Science
16.6%
Fig.4. Percentage of experimental beam times for each research field.
The scheduled maintenance was finished on April 5 in 2002. After voltage conditioning, we provided
beams for experiments from April 22. The operation of the 12UD Pelletron tandem accelerator was very
stable for the period from April in 2002 to March in 2003. However, the driving mechanism of the foil
unit-A broke down in December, and we could not change any foil in unit-A. A hanging stripper foil was
burned out by the irradiation of heavy ion beam. After this trouble, only the foil unit-B was used in the
operation of the 12UD Pelletron tandem accelerator.
The scheduled maintenance in the spring of 2003 was started from March 3 and finished on April 9. The
major works of this maintenance were as follows. All corona points were replaced along the column and
the accelerating tube. Stripper foils in the foil unit-A and B were also replaced by new foils. We repaired
the oiling system, the shorting rod contacts and the insulating sheets of the chain pulley. We also repaired
- 2 -

the broken driving mechanism of the foil unit-A. We modified the structure of the terminal to make larger
apertures. It was requested by AMS research group from a reason that somewhat wider acceptance of the
tandem accelerator was needed in AMS experiments to obtain better reproduction of measurements and
higher accuracy of the data. Fig.5 shows the old and new terminal stages.
In the year of 2002, we lost SF6 gas by about 800 kg in the operation of the gas handling system. This is
a serious problem for us. We are investigating the cause of this problem. We added 1000 kg SF6 gas to the
main accelerator tank during the scheduled maintenance
Tantalum
Aluminum
Tantalum
Aluminum
Aperture (upper side)
Aperture (lower side)
Manual valve [CF70]
(38 mm in inner diameter)
Foil holder
Tantalum
Aluminum
Aperture
Old terminal stage New terminal stage
(after April, 2003)
(35mm in inner diameter)
Fig.5. Old and new terminal stages.
[2] The 1MV Tandetron accelerator
The total operating time of the 1 MV Tandetron accelerator was 182 hours for the period of 2002. He
ion beam is highly required for RBS analysis, but the duoplasmatron ion source for He-
production does
not supply sufficient intensity of beam currents for experiments at present. While the scheduled
maintenance in the spring of 2003, we found that the accelerating tank tilted with respect to the beam line.
We corrected the tilt by moving the accelerating tank. Fig.6 shows the transmission of proton beam as a
function of the terminal voltage. The transmission is estimated by the ratio of the beam current from the
sputter ion source to the accelerated beam current on the C (15°) beam course with a collimator of 3 mm
in diameter. The transmission of proton beam was decreased sharply before the maintenance as compared
with that in March of 1999. After the maintenance, the transmission was improved, but still much lower
- 3 -
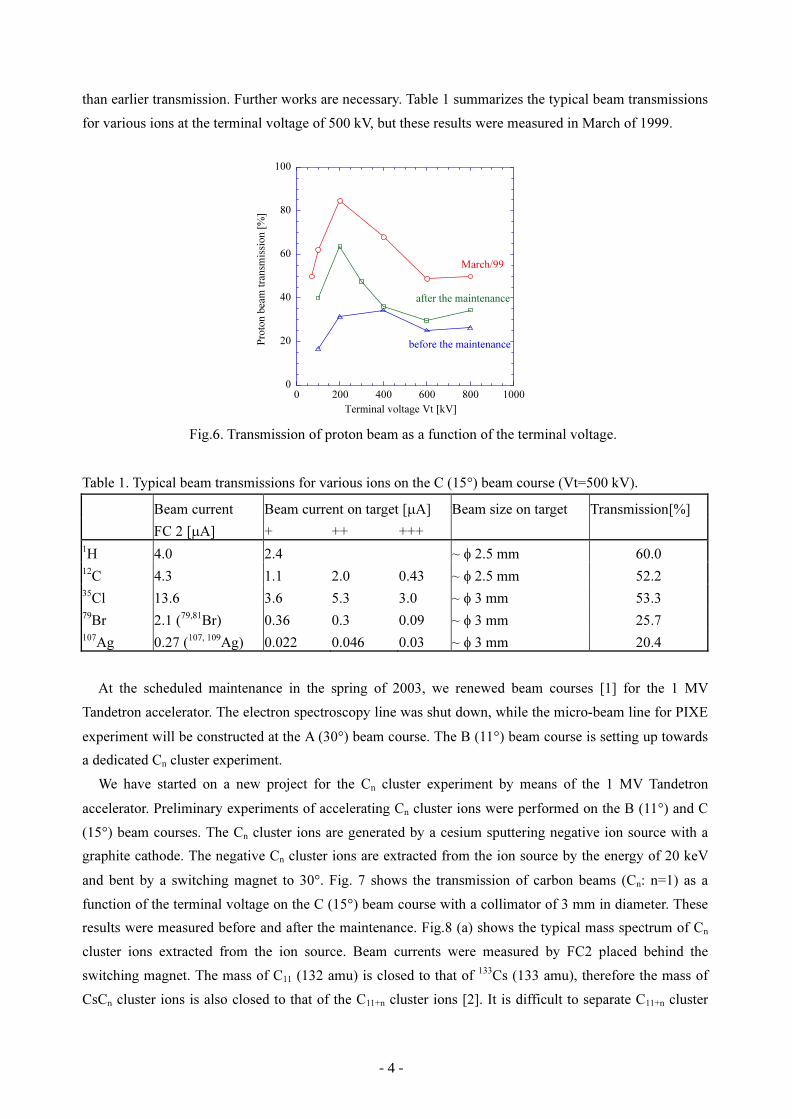
than earlier transmission. Further works are necessary. Table 1 summarizes the typical beam transmissions
for various ions at the terminal voltage of 500 kV, but these results were measured in March of 1999.
0
20
40
60
80
100
0 200 400 600 800 1000
Pro
to
n b
eam
tran
sm
issio
n [%
]
Terminal voltage Vt [kV]
March/99
after the maintenance
before the maintenance
Fig.6. Transmission of proton beam as a function of the terminal voltage.
Table 1. Typical beam transmissions for various ions on the C (15°) beam course (Vt=500 kV).
Beam current Beam current on target [µA] Beam size on target Transmission[%]
FC 2 [µA] + ++ +++
1
H 4.0 2.4 ~ φ 2.5 mm 60.0
12
C 4.3 1.1 2.0 0.43 ~ φ 2.5 mm 52.2
35
Cl 13.6 3.6 5.3 3.0 ~ φ 3 mm 53.3
79
Br 2.1 (79,81
Br) 0.36 0.3 0.09 ~ φ 3 mm 25.7
107
Ag 0.27 (107, 109
Ag) 0.022 0.046 0.03 ~ φ 3 mm 20.4
At the scheduled maintenance in the spring of 2003, we renewed beam courses [1] for the 1 MV
Tandetron accelerator. The electron spectroscopy line was shut down, while the micro-beam line for PIXE
experiment will be constructed at the A (30°) beam course. The B (11°) beam course is setting up towards
a dedicated Cn cluster experiment.
We have started on a new project for the Cn cluster experiment by means of the 1 MV Tandetron
accelerator. Preliminary experiments of accelerating Cn cluster ions were performed on the B (11°) and C
(15°) beam courses. The Cn cluster ions are generated by a cesium sputtering negative ion source with a
graphite cathode. The negative Cn cluster ions are extracted from the ion source by the energy of 20 keV
and bent by a switching magnet to 30°. Fig. 7 shows the transmission of carbon beams (Cn: n=1) as a
function of the terminal voltage on the C (15°) beam course with a collimator of 3 mm in diameter. These
results were measured before and after the maintenance. Fig.8 (a) shows the typical mass spectrum of Cn
cluster ions extracted from the ion source. Beam currents were measured by FC2 placed behind the
switching magnet. The mass of C11
(132 amu) is closed to that of 133
Cs (133 amu), therefore the mass of
CsCn cluster ions is also closed to that of the C
11+n cluster ions [2]. It is difficult to separate C
11+n cluster
- 4 -

ions from CsCn cluster ions. It is necessary to accelerate C
n cluster ions as the same energy ratio
(keV/amu) for the interaction experiment between the cluster ions and the target. Fig. 8 (b) shows the
beam currents of Cn cluster ions (n=1, 4, 8) accelerated as 20 keV/amu on the B (11°) beam course with a
collimator of 1 mm in diameter. Table 2 summarizes the experimental conditions of Cn cluster ions
accelerated for the B (11°) and C (15°) beam courses.
0
10
20
30
40
50
60
0 200 400 600 800 1000
Carb
on
b
eam
tran
sm
issio
n [%
]
Terminal voltage Vt [kV]
after the maintenance
before the maintenance
Fig.7. Transmission of carbon beams (Cn: n=1) as a function of the terminal voltage on the C (15°) beam
course with a collimator of 3 mm in diameter.
1
10
100
1000
10000
1 2 3 4 5 6 7 8 9 10
Beam
current [nA
]
C
n
-
0.1
1
10
1 4 8
Beam
current [nA
]
C
n
+
(a) (b)
Fig.8. (a) Typical mass spectrum of Cn cluster ions extracted from the ion source. (b) Beam currents of C
n
cluster ions (n=1, 4, 8) accelerated as 20 keV/amu on the B (11°) beam course with a collimator of 1 mm
in diameter.
- 5 -

Table 2. Experimental conditions of Cn cluster ions for the B (11°) and C (15°) beam courses.
Beam course Cluster size: Cn E (keV/amu) ρ [m] ME/q
2
B (11°) 1≤n≤8 20 1.84 245
C (15°) 1≤n≤6 20 - 24 1.40 127
References
[1] K. Sasa et al., UTTAC68 (1999) 1.
[2] Y. Saitoh, K. Mizuhashi, S. Tajima, Nuclear Instruments and Methods in Physics Research A 452
(2000) 61-66.
- 6 -

1.2 Performance tests of the Tsukuba high-energy nuclear microprobe
K. Sasa, K. Furuno, Y. Yamato, H. Ohshima, S. Ishii, T. Komatsubara and M. Kurosawa
[1] Introduction
In earth science, hydrogen concentration in melt inclusions confined in quartz or diamond provides
important information about the mechanism of formation and evolution of magma. Nowadays, nuclear
technique is known to be one of better tools for the detection of hydrogen in various materials. Several
authors reported measurements of hydrogen concentration in quartz or diamond with ERDA or NRA [1, 2].
These measurements, however, were performed for thin samples at low beam energies around a few MeV
using small accelerators. Since the size of melt inclusions is in the range from 30 to 100 µm, samples
including melt inclusions must be thicker than 100 µm not to destroy the inclusions during slicing and
polishing samples. We need, therefore, a high-energy beam to measure the hydrogen in such a thick
sample over the whole range of the inclusions.
We have developed a system for hydrogen analysis [3] using a 20 MeV proton beam and 19
F ions with
energies up to 25 MeV. The system is designed and constructed as an apparatus dedicated to the hydrogen
analysis of geophysical samples. Our goal is to achieve a beam spot less than 30 µm in diameter at a beam
current more than 0.1 nA. It consists of a beam line for microbeam production, a vacuum chamber
equipped with a 3-directional sample-driving mechanism, an optical microscope for observation of
samples and a proton or a gamma-ray detector. This report mainly describes operational tests and results
on the beam focusing of 20 MeV protons under several conditions for openings of the beam defining slits.
[2] Description of the apparatus
The beam defining and the first divergence slits are both modified from their original forms [4] of
fixed apertures to a type being variable rectangular slit openings. The material of the beam defining slit is
tungsten, while it is copper for the first divergence slit. To reduce slit-edge scattering, the edges of these
variable slits were polished to mirror surfaces with roughness less than 2 µm. The displacement of these
slits was read with dial gauges having a minimum indication of 1 µm. Another modification from the
original design is the placement of the second divergence slit just in front of the Russian quadruplet. The
slit is a fixed aperture of 9 mm in diameter and 2 mm thick stainless steel.
Sample positions can be moved in steps of 1 µm with the aid of precision ball screws and stepping
motors. This step is determined with the 1 mm lead of the ball screw and the rotation angle of 0.36°/pulse
in the stepping motor. The reproducibility of the position determination is measured with a calibrated scale
to be ± 2 µm for a movement of 30 mm. The magnification of the optical microscope is variable between
55 and 690.
- 7 -

12 MV Pelletron
tandem accelerator
Analyzer
magnet
14.25 m
First experimental room
Object slit
FC FC FC
Steerer
Steerer Steerer
Divergence
slit
Divergence
slit
Russian
Quadruplet
Chamber
Beam
defining
slit
Viewer
DoubletControl
slit
Switching
magnet
Fig.1. A schematic drawing of the beam line for microbeam production.
[3] Experimental results on the beam focusing and discussion
The size of a beam spot on samples is important for investigations of the hydrogen in melt inclusions.
At first, we observed scintillation light emitted from a ZnS plate attached to the sample holder by
bombarding the ZnS plate with a low intensity beam. The scintillation light was observed with the optical
microscope mounted on the vacuum chamber. The angle of observation was 180° with respect to the
incident beam using a 45° mirror with a beam through hole. We used a magnification of about 650 for the
optical microscope. The scintillation light comprised of a very bright part and a large halo which was at
least three times as large as the very bright part. We measured horizontal and vertical lengths of the very
bright part by superposing its captured microscope image on the image of the calibrated scale on the
sample holder. Just after the observation of this scintillation light, we moved the sample holder and
bombarded a 25 µm thick tantalum wire to measure elastic scattering events with a SSD at an angle of
135°. Fig.2 displays typical scattering yields as a function of the displacement of the tantalum wire in
horizontal and vertical directions. In this case, we operated two quadrupole magnets in the Russian
quadruplet in the doublet mode. The openings of the beam defining slit were 120 µm in horizontal and 200
µm in vertical directions. The full width of this beam spot can be estimated to 25 µm ± 5 µm in the
horizontal and 5 µm ± 3 µm in the vertical direction. This beam spot size is in reasonable agreement with
that determined from the very bright part of the scintillation light. Additional confirmation was obtained
by observing the fact that all the scintillation light as well as the large halo disappeared completely when
the very bright part passed through a pinhole of 30 µm in diameter opened through the ZnS plate. In Table
1, experimental results on beam spot sizes and final beam currents obtained for 20 MeV protons are
summarized. Beam spot sizes were estimated from the very bright part of scintillation light. The
experimental uncertainty is ± 3 µm.
- 8 -

Fig.2. Yields of protons scattered on a 25 µm tantalum wire in the horizontal plane (a) in steps of 10 µm
and the vertical plane (b) in steps of 5 µm.
The beam spot size can be calculated as the product of opening widths of the beam defining slits and
the demagnification factors in both horizontal and vertical directions. The demagnification factors were
calculated in terms of the computer program TRACE 3-D [5] with assumptions of 0.1 % beam energy
resolution and uniform brightness. The openings of the beam defining slit and the beam divergence were
assumed to be 200 × 200 µm2
and 0.43 mrad, respectively. The calculated demagnification factors and
corresponding beam spot sizes are listed in Table 1. Parasitic aberrations are not taken into account in
these calculations.
Table 1 Calculated and experimental spot sizes obtained for a 20 MeV proton beam. The calculation is
assumed to a beam current of 1.2 nA.
Quadrupole Doublet Russian Quadruplet
Calculated results
Object slit [µm2
] 200 × 200 200 × 200
Expected beam spot size [µm2
]
with no parasitic aberrations 27.7 × 4.8 14.9 × 14.9
Demagnification factor Dx=7.2, Dy= 41.7 Dx= Dy=13.4
Maximum mass energy product
ME/q2
[MeV amu] 45 100
Experimental results
Object slit [µm2
] 60 × 200 120 × 200 200 × 200 200 × 200
Spot size [µm2
] 14 × 6 22 × 8 30 × 10 25 × 20
Target current [nA] ≤0.15 ≤0.5 ≤2 ≤2
- 9 -
Since the experimental beam spot size obtained with the Russian quadruplet is smaller than 30 µm in
diameter, the design purpose of the present microprobe system is achieved. The experimental beam spot
size, however, is clearly affected by aberrations. In fact we observed an appreciable rotation of the beam
spot on the ZnS plate near an optimal focus. Qualitatively, this rotation could be ascribed to some
rotational misalignments in each quadrupole singlet in the Russian quadruplet.
Melt inclusions in natural geophysical samples have various shapes. Therefore a rectangular beam
spot would be preferable in some cases. From this point of view, we tested operation in the doublet mode
using the last two quadrupole singlets in the Russian type configuration. The experimental results are
listed in Table 1 together with calculated demagnification factors and beam spot sizes. The minimum spot
size obtained in this doublet mode of operation was 14×6 µm2
at a beam current of 0.1 nA. This beam
current is still high enough for the hydrogen analysis by the proton-proton scattering. These data suggests
that the present microprobe system has flexibility in a practical sense because we can easily prepare wide
variety of beam spots depending on shapes of melt inclusions. The switching from the Russian quadruplet
to the doublet mode can be made by only a few mouse clicking of the symbols relevant to the magnets on
the display terminal at the control console.
[4] Summary
We have developed a microprobe system dedicated to the hydrogen analysis of geophysical samples.
The smallest beam spot size obtained so far is 14×6 µm2
for a 20 MeV proton beam. The performance of
the present microprobe system is fully sufficient for such measurements of hydrogen in melt inclusions
that are important in earth science. Somewhat smaller beam sizes could be obtained by increasing
brightness of the beam with an improved operation of the ion source. However, the beam spot size is
mainly limited by aberrations in the Russian quadruplet which was modified from old conventional
quadrupole doublets for a beam transport line. To decrease the aberration in the present Russian
quadruplet is rather difficult.
Acknowledgement
This work is supported in part by the Grand-in-Aid for Scientific Research (A) of the Ministry of
Education, Science, Sports and Culture.
References
[1] S. H. Sie, G. F. Suter, A. Chekhmir, T. H. Green, Nucl. Instr. and Meth. B 104 (1995) 261.
[2] R.D.Verda, J. R. Tesmer, C. J. Maggiore, M. Nastasi, R. W. Bower, Nucl. Instr. and Meth. B 183
(2001) 391.
[3] K. Sasa, H. Ohshima, Y. Yamato, T. Komatsubara, T. katabuchi, K. Shima, K. Furuno, M. Kurosawa,
N. Yanagisawa, Nucl. Instr. and Meth. B 190 (2002) 287.
[4] K. Sasa et al., Annual report 2001, UTTAC-70(2002) 10.
[5] K. R. Crandall, D. P. Rusthoi, TRACE 3-D Documentaion, third ed., Los Alamos National Laboratory
Report, LA-UR-97-886, 1997.
- 10 -

1.3 Development of a laser ion source for metallic ions
K. Sasa
A laser ion source (LIS) is a versatile tool to produce high-flux multi-charged ions [1, 2]. One of the
problems in LIS is that ions extracted from LIS have a broad energy distribution. The development of a
new LIS has been started with the design concept that LIS couples with an electron-cyclotron-resonance
(ECR) ion source. The efficient production of highly charged ions in the ECR ion source ensures
elimination of molecular ions or micro-particles produced by laser ablation. It consists of LIS as a first
stage, followed by the ECR ion source as a second stage which acts as a charge state multiplier and a
stable beam extractor. A compact Nd:YAG pulsed laser with the pulse width of 8 ns and the maximum
energy of 50 mJ at 1064 nm wavelength was employed to evaporate sample materials as a primary source
for the ECR plasma. This report describes preliminary tests of LIS.
A laser beam was focused on a 3 mm thick copper target placed in a vacuum chamber. A pressure in the
chamber was 6.7×10⁻⁴
Pa. A focusing lens was placed at 150 mm at a 45° with respect to the target surface.
The laser spot was 0.5×10⁻²
cm2
at the target position. The maximum power density on the target was
achieved to 1.3×10⁹
W/cm2
for the laser energy of 50 mJ. Ions evaporated from the copper target by laser
ablation were measured by a Faraday cup (FC) with a suppressor biased to -400V. The FC was located at
500 mm, and a collimator with 8 mm in diameter was placed at 420 mm from the target position. The
accelerating voltage up to 5 kV could be applied to the target. Fig.1 shows an experimental set-up.
LaserNd:YAG
Focal lens
Viewer
High Voltage
∼∼∼∼ 5 kV
Vacuumgauge
TMPTarget
FC Suppressor
∼∼∼∼ −−−−400V
Slit
φφφφ 8 mm
Plume
Laser window(Fused Silica)
500 mm
45°
Fig.1.Experimental set-up.
- 11 -
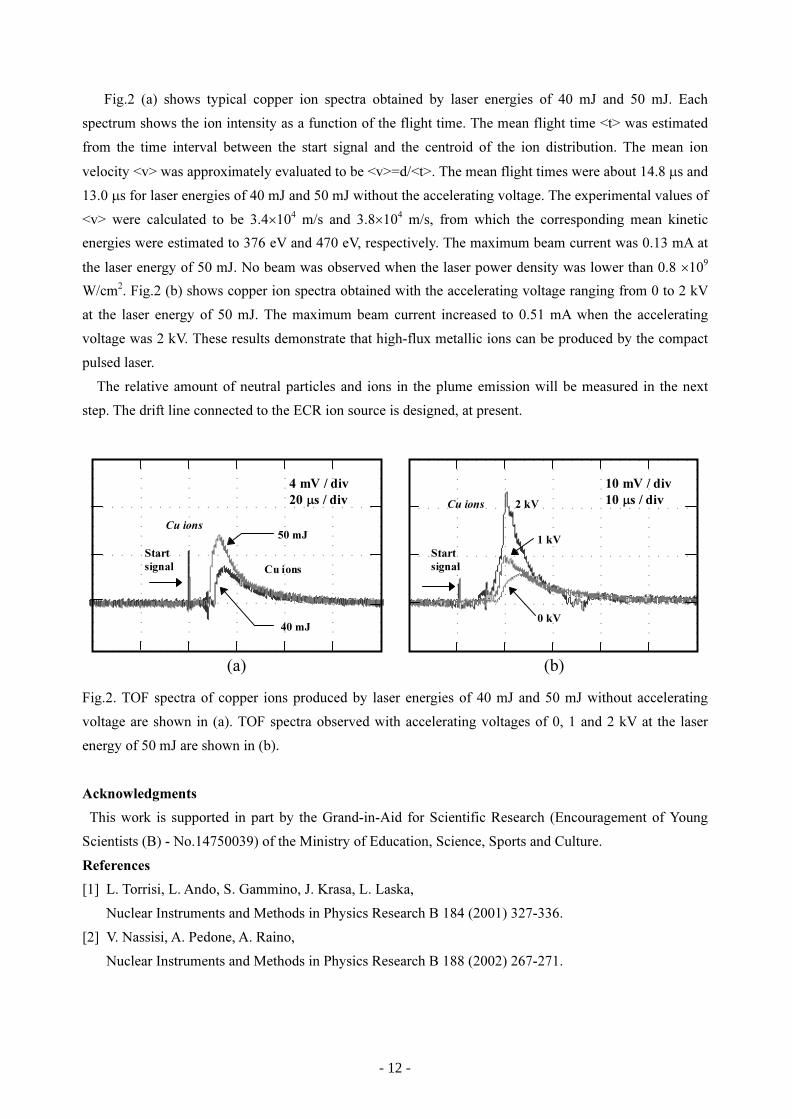
Fig.2 (a) shows typical copper ion spectra obtained by laser energies of 40 mJ and 50 mJ. Each
spectrum shows the ion intensity as a function of the flight time. The mean flight time <t> was estimated
from the time interval between the start signal and the centroid of the ion distribution. The mean ion
velocity <v> was approximately evaluated to be <v>=d/<t>. The mean flight times were about 14.8 µs and
13.0 µs for laser energies of 40 mJ and 50 mJ without the accelerating voltage. The experimental values of
<v> were calculated to be 3.4×10⁴
m/s and 3.8×10⁴
m/s, from which the corresponding mean kinetic
energies were estimated to 376 eV and 470 eV, respectively. The maximum beam current was 0.13 mA at
the laser energy of 50 mJ. No beam was observed when the laser power density was lower than 0.8 ×10⁹
W/cm2
. Fig.2 (b) shows copper ion spectra obtained with the accelerating voltage ranging from 0 to 2 kV
at the laser energy of 50 mJ. The maximum beam current increased to 0.51 mA when the accelerating
voltage was 2 kV. These results demonstrate that high-flux metallic ions can be produced by the compact
pulsed laser.
The relative amount of neutral particles and ions in the plume emission will be measured in the next
step. The drift line connected to the ECR ion source is designed, at present.
10 mV / div
10 µs / div
Start
signal
Cu ions
0 kV
1 kV
2 kV
4 mV / div
20 µs / div
Start
signalCu ions
40 mJ
50 mJ
Cu ions
(a) (b)
Fig.2. TOF spectra of copper ions produced by laser energies of 40 mJ and 50 mJ without accelerating
voltage are shown in (a). TOF spectra observed with accelerating voltages of 0, 1 and 2 kV at the laser
energy of 50 mJ are shown in (b).
Acknowledgments
This work is supported in part by the Grand-in-Aid for Scientific Research (Encouragement of Young
Scientists (B) - No.14750039) of the Ministry of Education, Science, Sports and Culture.
References
[1] L. Torrisi, L. Ando, S. Gammino, J. Krasa, L. Laska,
Nuclear Instruments and Methods in Physics Research B 184 (2001) 327-336.
[2] V. Nassisi, A. Pedone, A. Raino,
Nuclear Instruments and Methods in Physics Research B 188 (2002) 267-271.
- 12 -
1.4 Development of the gated MSTPC
H. Ishiyama1
, T. Kawamura2
, T. Hashimoto2,3
, T. Ishikawa2
, T. Furukawa4
, M. H. Tanaka1
, N. Yoshikawa1
,
H. Miyatake1
, S. C. Jeong1
, T. Nomura1
, T. Komatsubara and Y. Tagishi
A project to acquire directly nuclear cross sections of (α, n) and (p, n) reactions using low energy light
neutron-rich radioactive nuclear beams (RNBs) is in progress for nuclear astrophysical interests [1].
Measurements of 8
Li(α, n)11
B,16
N(α, n)20
F [2], 16
N(p, n)16
O reaction cross sections have been already
performed successfully.
For their measurements a detector system consists of a “ Multi-Sampling and Tracking Proportional
Chamber” (MSTPC) [3] and a neutron detector array. The MSTPC can measure a three-dimensional track
of a charged particle and the energy loss along its trajectory. A RNB is injected into the MSTPC directly,
which is filled with He + CO2 (10%) or CH
4 gas. This filling gas also plays a role of a gas target.
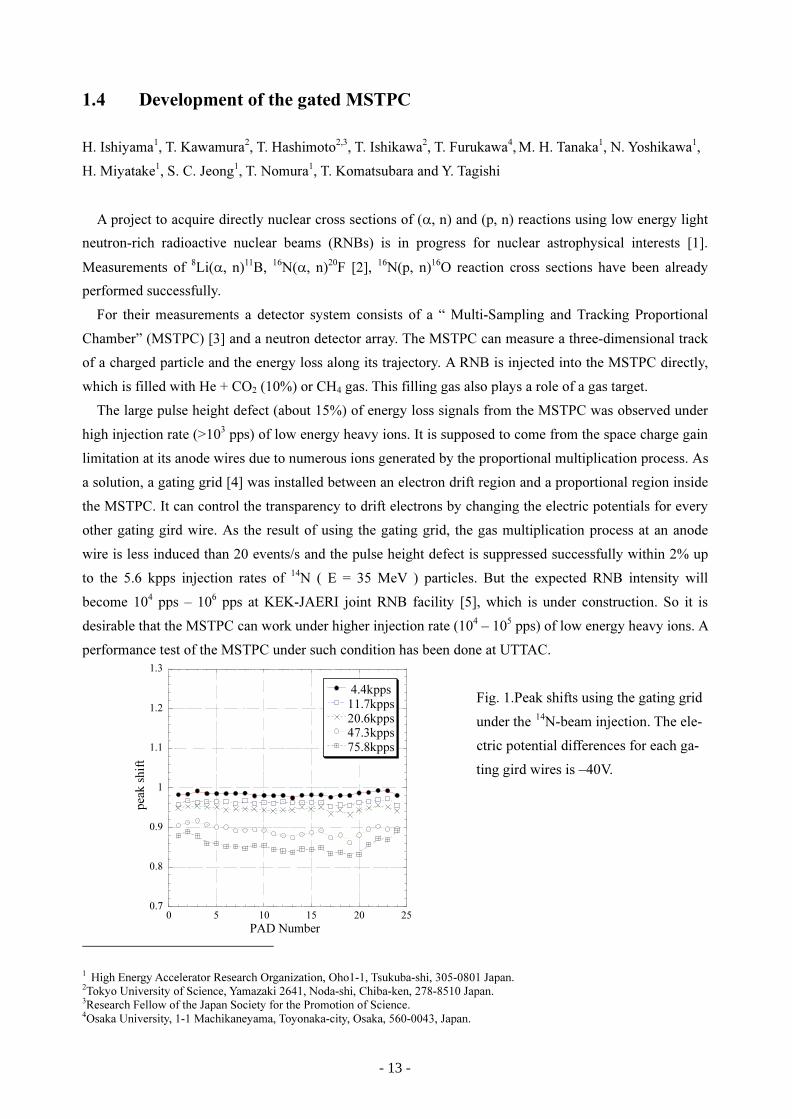
The large pulse height defect (about 15%) of energy loss signals from the MSTPC was observed under
high injection rate (>103
pps) of low energy heavy ions. It is supposed to come from the space charge gain
limitation at its anode wires due to numerous ions generated by the proportional multiplication process. As
a solution, a gating grid [4] was installed between an electron drift region and a proportional region inside
the MSTPC. It can control the transparency to drift electrons by changing the electric potentials for every
other gating gird wire. As the result of using the gating grid, the gas multiplication process at an anode
wire is less induced than 20 events/s and the pulse height defect is suppressed successfully within 2% up
to the 5.6 kpps injection rates of 14
N ( E = 35 MeV ) particles. But the expected RNB intensity will
become 104
pps – 106
pps at KEK-JAERI joint RNB facility [5], which is under construction. So it is
desirable that the MSTPC can work under higher injection rate (104
– 105
pps) of low energy heavy ions. A
performance test of the MSTPC under such condition has been done at UTTAC.
Fig. 1.Peak shifts using the gating grid
under the 14
N-beam injection. The ele-
ctric potential differences for each ga-
ting gird wires is –40V.
1
High Energy Accelerator Research Organization, Oho1-1, Tsukuba-shi, 305-0801 Japan.
2
Tokyo University of Science, Yamazaki 2641, Noda-shi, Chiba-ken, 278-8510 Japan.
3
Research Fellow of the Japan Society for the Promotion of Science.
4
Osaka University, 1-1 Machikaneyama, Toyonaka-city, Osaka, 560-0043, Japan.
0.7
0.8
0.9
1
1.1
1.2
1.3
0 5 10 15 20 25
4.4kpps
11.7kpps
20.6kpps
47.3kpps
75.8kpps
peak shift
PAD Number
- 13 -

The 14
N-beam ( E = 35 MeV) was provided by Pelletron 12UD. The 14
N particles elastically scattered
from a thin Au-target were transported to the MSTPC with a QDQ spectrometer. The gating grid was
triggered by the reduced signals of a SSD in end of the MSTPC. The trigger rate was reduced by a down
scalar.
Fig.1 shows peak shifts of the output signals versus counting rates using the gating grid. The vertical axis
shows the pulse height normalized to that when the injection rate is a few pps. The horizontal axis shows
the cathode pad number, which corresponds to the distance (the one pad length is 11mm) from the beam
injection point inside the MSTPC . When the injection rate is 47.3 kpps, the pulse height defect becomes
about 10%. As the result of a off-line analysis and a bench test, it is supposed to come from a few % leak
of drift electrons to a proportional region even under the closed gate condition. This leak can be
suppressed by increasing electric potential differences for every other gating grid wire. In order to check it,
an experiment was performed using 7
Li-beam (E = 14 MeV) at JAERI tandem facility.
Fig. 2. Peak shifts using the gating grid
under the 7
Li-beam injection. The ele-
ctric potential differences for each ga-
ting gird wires is –68V.
Fig.2 shows the results. When the injection rate is 42 kpps, the pulse height defect is suppressed within
2% successfully. But when the injection rate is 113 kpps, the pulse height defect becomes about 7%. A
further investigation and an improvement are therefore required.
References
[1] H. Ishiyama, et. al., Nucl. Phys. A718c (2003)481.
[2] T. Ishikawa, et. al., Nucl. Phys. A718c(2003)483.
[3] Y. Mizoi, et. al., Nucl. Instrum. Meth. Phys. Res. A 431(1999)112.
[4] P. Nemethy, et. al., Nucl. Instrum. Meth. A 212(1983)73.
[5] H. Miyatake, et. al., Nucl. Instrum. Meth. in press.
0.7
0.8
0.9
1
1.1
1.2
1.3
0 5 10 15 20 25
42.0kpps
113.0kpps
peak shift
PAD Number
- 14 -
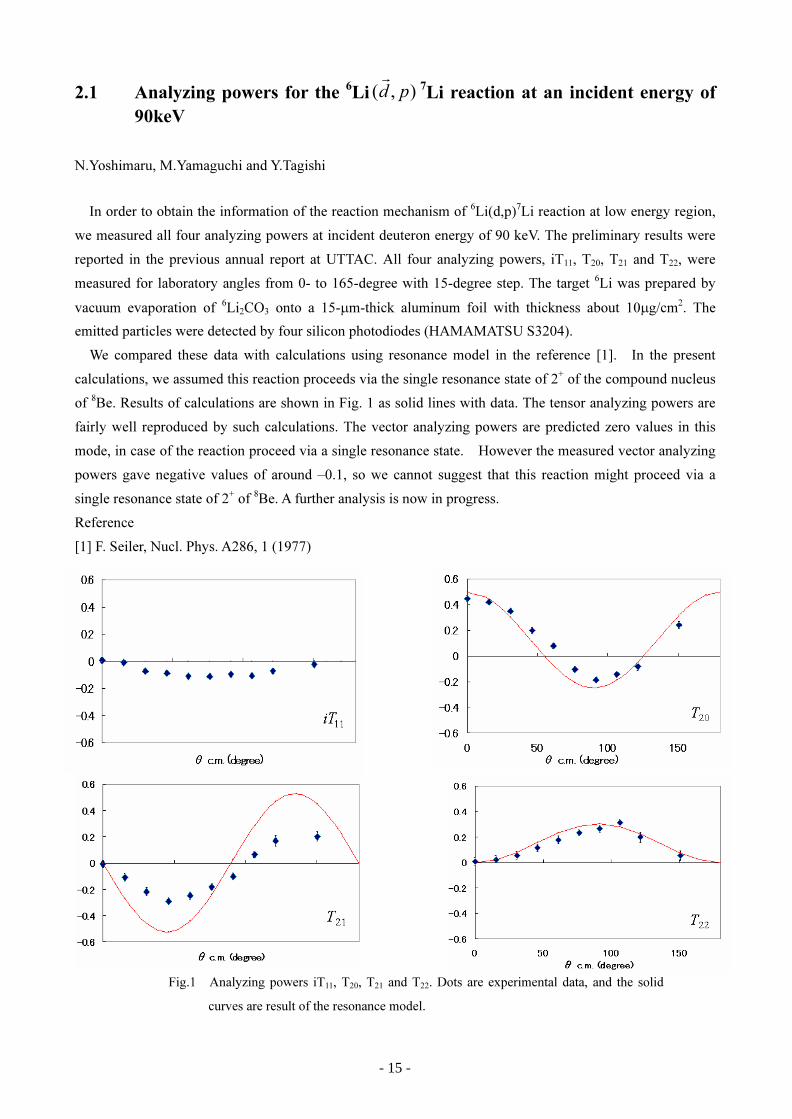
Fig.1 Analyzing powers iT11
, T20
, T21
and T22
. Dots are experimental data, and the solid
curves are result of the resonance model.
2.1 Analyzing powers for the 6
Li ),( pd
r
7
Li reaction at an incident energy of
90keV
N.Yoshimaru, M.Yamaguchi and Y.Tagishi
In order to obtain the information of the reaction mechanism of 6
Li(d,p)7
Li reaction at low energy region,
we measured all four analyzing powers at incident deuteron energy of 90 keV. The preliminary results were
reported in the previous annual report at UTTAC. All four analyzing powers, iT11
, T20
, T21
and T22
, were
measured for laboratory angles from 0- to 165-degree with 15-degree step. The target 6
Li was prepared by
vacuum evaporation of 6
Li2CO
3 onto a 15-µm-thick aluminum foil with thickness about 10µg/cm
2
. The
emitted particles were detected by four silicon photodiodes (HAMAMATSU S3204).
We compared these data with calculations using resonance model in the reference [1]. In the present
calculations, we assumed this reaction proceeds via the single resonance state of 2+
of the compound nucleus
of8
Be. Results of calculations are shown in Fig. 1 as solid lines with data. The tensor analyzing powers are
fairly well reproduced by such calculations. The vector analyzing powers are predicted zero values in this
mode, in case of the reaction proceed via a single resonance state. However the measured vector analyzing
powers gave negative values of around –0.1, so we cannot suggest that this reaction might proceed via a
single resonance state of 2+
of 8
Be. A further analysis is now in progress.
Reference
[1] F. Seiler, Nucl. Phys. A286, 1 (1977)
- 15 -
2.2 Measurement of proton polarization in 208Pb(d,p)209Pb reaction atincident energy of 20 MeV
M.Yamaguchi, N.Kawachi, N.Yoshimaru, Y.Aoki, and Y.Tagishi
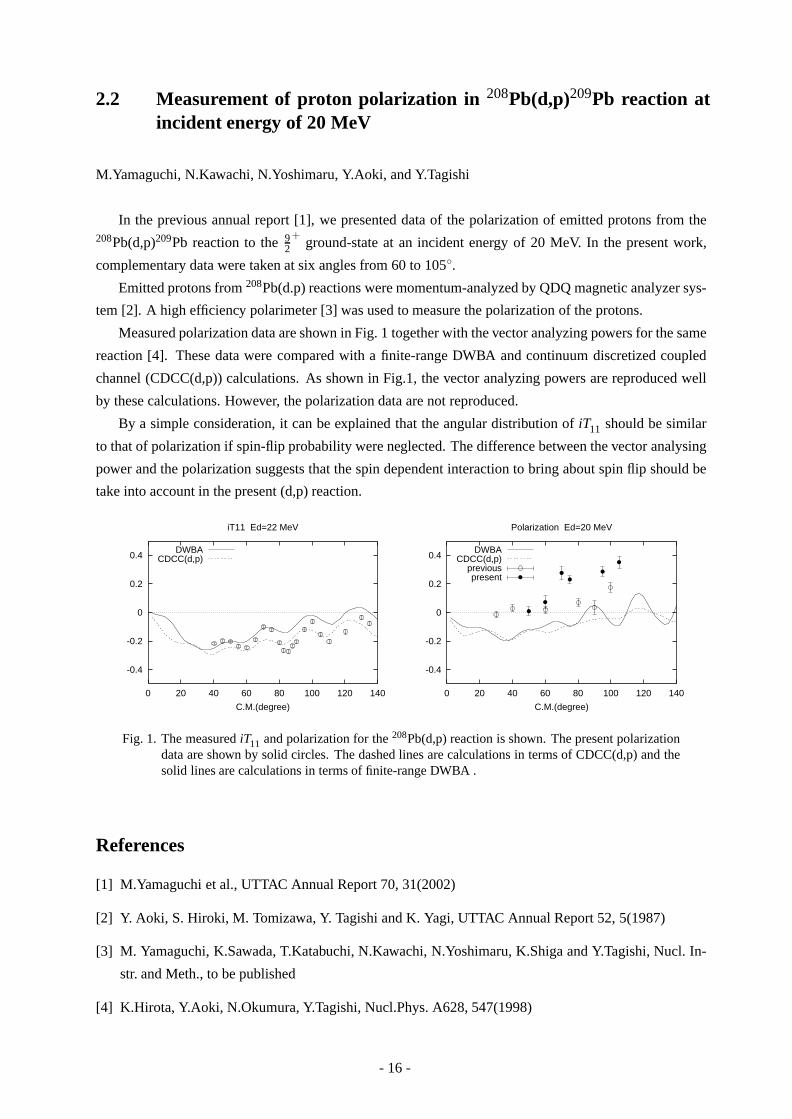
In the previous annual report [1], we presented data of the polarization of emitted protons from the208Pb(d,p)209Pb reaction to the 9
2+
ground-state at an incident energy of 20 MeV. In the present work,
complementary data were taken at six angles from 60 to 105.Emitted protons from 208Pb(d.p) reactions were momentum-analyzed by QDQ magnetic analyzer sys-
tem [2]. A high efficiency polarimeter [3] was used to measure the polarization of the protons.
Measured polarization data are shown in Fig. 1 together with the vector analyzing powers for the same
reaction [4]. These data were compared with a finite-range DWBA and continuum discretized coupled
channel (CDCC(d,p)) calculations. As shown in Fig.1, the vector analyzing powers are reproduced well
by these calculations. However, the polarization data are not reproduced.
By a simple consideration, it can be explained that the angular distribution of iT11 should be similar
to that of polarization if spin-flip probability were neglected. The difference between the vector analysing
power and the polarization suggests that the spin dependent interaction to bring about spin flip should be
take into account in the present (d,p) reaction.
-0.4
-0.2
0
0.2
0.4
0 20 40 60 80 100 120 140
C.M.(degree)
iT11 Ed=22 MeV
DWBACDCC(d,p)
-0.4
-0.2
0
0.2
0.4
0 20 40 60 80 100 120 140
C.M.(degree)
Polarization Ed=20 MeV
DWBACDCC(d,p)
previouspresent
Fig. 1. The measured iT11 and polarization for the 208Pb(d,p) reaction is shown. The present polarizationdata are shown by solid circles. The dashed lines are calculations in terms of CDCC(d,p) and thesolid lines are calculations in terms of finite-range DWBA .
References
[1] M.Yamaguchi et al., UTTAC Annual Report 70, 31(2002)
[2] Y. Aoki, S. Hiroki, M. Tomizawa, Y. Tagishi and K. Yagi, UTTAC Annual Report 52, 5(1987)
[3] M. Yamaguchi, K.Sawada, T.Katabuchi, N.Kawachi, N.Yoshimaru, K.Shiga and Y.Tagishi, Nucl. In-
str. and Meth., to be published
[4] K.Hirota, Y.Aoki, N.Okumura, Y.Tagishi, Nucl.Phys. A628, 547(1998)
- 16 -
2.3 Spin correlation measurement for 2H(d,p)3H reaction at incident en-ergy of 20 MeV
M.Yamaguchi, N.Okumura, N.Yoshimaru, S.Ishii, Y.Tajima, Y.Tagishi, I.Daito1, T.Inagaki1, T.Kobayashi1,
N.Horikawa1, M.Iio2, N.Kuwazu2 and N.Kawachi3
The spin correlation measurements are of interest for the nuclear physics of a few nucleon systems
and also fusion energy applications. At low energy region, in particular it is suggested that the d-d fusion
reaction should be suppressed for deuterons with parallel spins[1].
We arranged to make experiment for spin-correlation measurements in the 2H(d,p)3H reaction in col-
laboration with Nagoya University, where a polarized-deuteron target had been developed. The polarized-
deuteron target system[2][3] was carried into UTTAC from Nagoya Univ. on April, 2002.
We designed a scattering chamber and detection system, which was shown in Fig. 1. A target made
of deuterized polyethylene ((CD2)n) was placed at the center of the chamber. The target has a diameter
of 4 mm and the thickness of about 20 µm. Emitted charged particles were detected with two counter-
telescopes consisting of silicon solid-state detectors. Each telescope was comprised of a transmission type
detector with thickness of 400 µm and thick detector with thickness of 3000 µm. Deuteron beam was
produced by a Lamb-shift type polarized ion source at UTTAC[4] and accelerated up to 20 MeV. Double
collimaters having 2 mm and 3 mm diameters were placed at 40 cm and 156 cm upstream from the target.
A typical beam current was about 20 nA on the Faraday cup in the scattering chamber.
The target was placed at the center of magnetic field at 2.5 T generated by Helmholtz coils in order
to polarize deuterons in the target. The directions of incident deuterons and ejected charged particles
were deflected in this magnetic field. The left graph in Fig. 2 shows the strength of the magnetic field
in the reaction plane. Ray-trace simulation was performed for incident deuterons and ejected protons
and deuterons. According to the simulation, the total deflection of the deuteron beam during the travel
through the magnetic field was about 7. The right graph in Fig. 2 shows the ray-trace of the deuteron
beam in the magnetic field. The ejected charged particles were also deflected from original emitted angles.
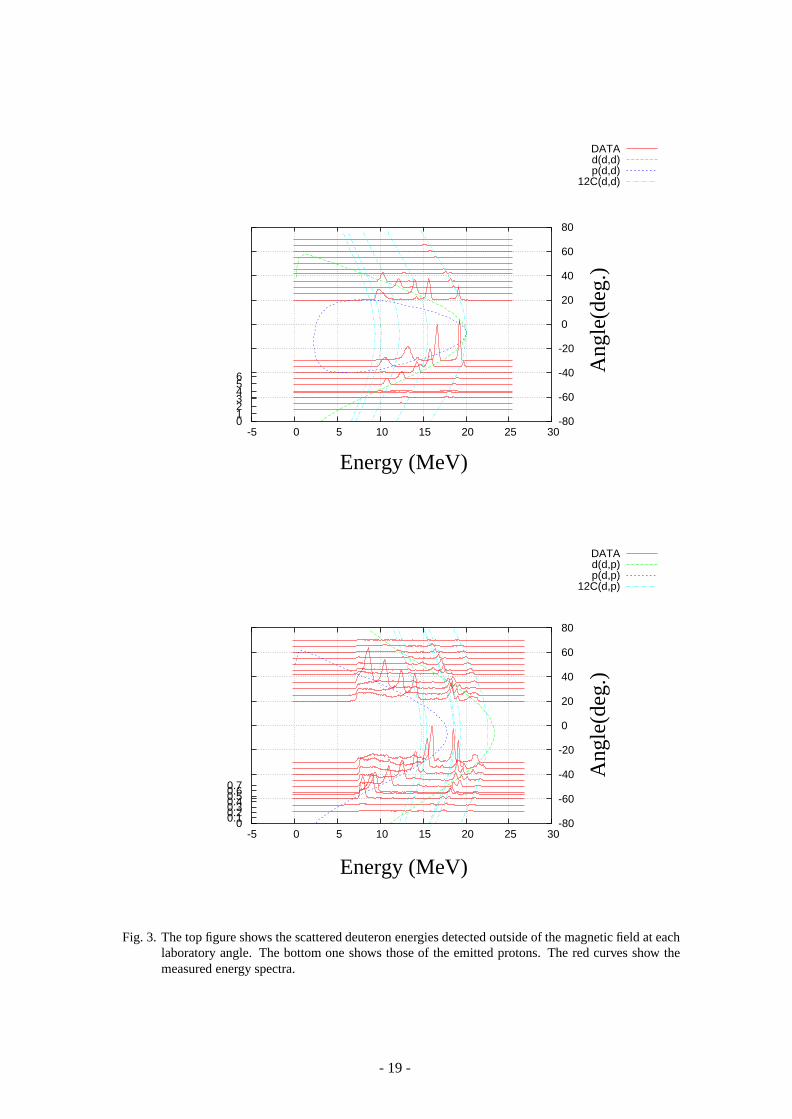
The predicted energies of the emitted deuterons and protons observed with detectors placed outside of the
magnetic field at each laboratory angle are shown in Fig. 3. The measured energy spectra are also shown in
Fig. 3 with red lines. The peak positions of these red lines were well reproduced by the present simulation.
The thicknesses of the target and refrigerant (liquid helium having the thickness of about 1 mm) caused
the energy spreads of the peaks in these spectra. It was found that protons from the 2H(d,p)3H reaction
were well separated from those of other reactions in emission-angle regions from 32 to 38 and from 49
to 63.
References
[1] R .M. Kulsrud et al. Phys. Rev. Lett. 49(1982)1248
1Nagoya Univ.2Miyazaki Univ.3Natioanl Cardiovascular Center
- 17 -

[2] I.Daito, ”Polarized deuteron target system for low energy D(d,p)T measurement”, POLU-
SION99,(1999).
[3] I.Daito, H.Doushita, S.Hasegawa, N.Horikawa, S.Horikawa, T.Iwata, K.Kondo, Y.Miyachi, K.Mori,
N.Takabayashi, T.Tojyo, A.Wakai, ”SPIN2000, 14th. International Spin Physics Symposium”, AIP
Conference Proceedings, 570, 896(2001)
[4] Y.Tagishi and J.Sawada, Nucl. Instr. and Meth., 164,411(1979).
Fig. 1. Scattering chamber and the layout of the detectors. Dimension are given in units of mm.
-2.5
-2
-1.5
-1
-0.5
0
0.5
0 0.02 0.04 0.06 0.08 0.1 0.12
B [T
esla
]
r [m]
magnetic field
-0.2
-0.1
0
0.1
0.2
-0.2 -0.1 0 0.1 0.2
[m]
[m]
ray-trace result
Fig. 2. The strength of the magnetic field at the horizontal scattering plane is shown in left side, whichcalculated from dimensions of the Helmholtz coil. The amplitude is normalized to -2.5 Tesla at theorigin. The right side shows the result of the ray-trace calculation of the incident deuteron-beamat the horizontal scattering plane at 20 MeV.
- 18 -
DATAd(d,d)p(d,d)
12C(d,d)
-5 0 5 10 15 20 25 30-80
-60
-40
-20
0
20
40
60
80
0 1 2 3 4 5 6
Energy (MeV)
Ang
le(d
eg.)
Energy (MeV)
Ang
le(d
eg.)
DATAd(d,p)p(d,p)
12C(d,p)
-5 0 5 10 15 20 25 30-80
-60
-40
-20
0
20
40
60
80
0 0.1 0.2 0.3 0.4 0.5 0.6 0.7
Fig. 3. The top figure shows the scattered deuteron energies detected outside of the magnetic field at eachlaboratory angle. The bottom one shows those of the emitted protons. The red curves show themeasured energy spectra.
- 19 -

2.4 Energy dependence of proton elastic scattering from 28Si around28Si(p, n) reaction threshold energy
N.Okumura and Y.Aoki
Proton total reaction cross sections have a resonance like behavior around 28Si(p, n)28P threshold en-
ergy [1]. This threshold effect should be observed in elastic scattering, so that the energy dependence of
cross sections was studied. The incident energy range was from ECMp = 14.553 to 16.099 MeV and the
energy loss in the target was 36 keV for 15.2 MeV proton. Fig. 1 shows the ratio of elastic scattering
10-1
100
101
102
103
104
105
106
107
108
20 40 60 80 100 120 140 160 180
σ/σ R
uth.
θc.m. [deg.]
28Si(p,p)28SiEp
CM[MeV]
15.037
15.061 (× 1×101 )
15.085 (× 3×101 )
15.109 (× 1×10² )
15.133 (× 3×10² )
15.145 (× 1×10³ )
15.157 (× 3×10³ )
15.182 (× 1×10⁴ )
15.206 (× 3×10⁴ )
15.219 (× 1×10⁵ )15.230 (× 3×10⁵ )
15.254 (× 1×10⁶ )
15.278 (× 3×10⁶ )
15.302 (× 1×10⁷ )
Fig. 1. Proton elastic scattering cross sections. The each line is shown for guide your eyes.
cross section to Rutherford cross section. From 15.157 to 15.254 MeV, angular distribution of the ratio
becomes flat in the backward angles.
We searched the optical potential parameters that reproduced these cross sections and calculated phase
shifts δ j for each energy. Energy derivative of the phase shift,
τ j ≡ 2∂δ j
∂E, (1)
is the time delay for each (, j) partial wave (partial wave reaction time).
A few examples of the phase shift are shown in Fig. 2. We smoothed the phase shift and evaluated the
partial wave reaction times (Table 1).
- 20 -

2.1
2.2
2.3
2.4
2.5
14.4 14.8 15.2 15.6 16 16.4
δ lj/π
EpCM [MeV]
s1/2d3/2
Fig. 2. Partial wave phase shift δ j.
Table 1. Partial wave re-action time
τ j(×10−21s) j = − 1
2 j = + 12
0 − 1.51 2.1 1.92 1.3 1.43 3.2 1.14 0.3 0.5
720
760
800
840
14.4 14.8 15.2 15.6 16 16.4
σ R [m
b]
EpCM [MeV]
(a) Calculated σR
560
600
640
680
720
13 14 15 16 17
σ R [m
b]
EpCM [MeV]
(b) Experimental σR
Fig. 3. the comparison of calculated and experimental total reaction cross sections
Total reaction cross sections calculated by the searched optical potentials are plotted in Fig. 3. Like
our experimental total reaction cross sections [1], there is a dip in this calculation at the threshold energy.
References
[1] N. Okumura, Y. Aoki, T. Joh, Y. Honkyu, K. Hirota and K. S. Itoh, Nucl. Inst. Meth. A487(2002)565.
- 21 -
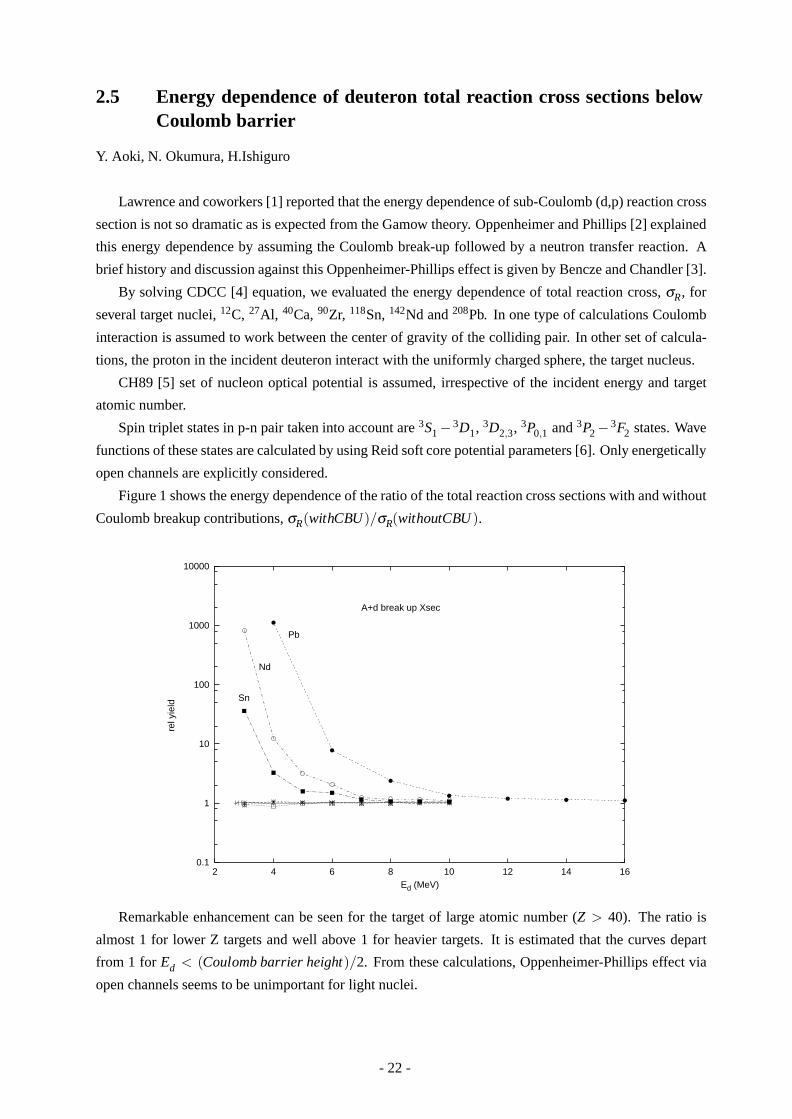
2.5 Energy dependence of deuteron total reaction cross sections belowCoulomb barrier
Y. Aoki, N. Okumura, H.Ishiguro
Lawrence and coworkers [1] reported that the energy dependence of sub-Coulomb (d,p) reaction cross
section is not so dramatic as is expected from the Gamow theory. Oppenheimer and Phillips [2] explained
this energy dependence by assuming the Coulomb break-up followed by a neutron transfer reaction. A
brief history and discussion against this Oppenheimer-Phillips effect is given by Bencze and Chandler [3].
By solving CDCC [4] equation, we evaluated the energy dependence of total reaction cross, σR, for
several target nuclei, 12C, 27Al, 40Ca, 90Zr, 118Sn, 142Nd and 208Pb. In one type of calculations Coulomb
interaction is assumed to work between the center of gravity of the colliding pair. In other set of calcula-
tions, the proton in the incident deuteron interact with the uniformly charged sphere, the target nucleus.
CH89 [5] set of nucleon optical potential is assumed, irrespective of the incident energy and target
atomic number.
Spin triplet states in p-n pair taken into account are 3S1 − 3D1, 3D2,3, 3P0,1 and 3P2 − 3F2 states. Wave
functions of these states are calculated by using Reid soft core potential parameters [6]. Only energetically
open channels are explicitly considered.
Figure 1 shows the energy dependence of the ratio of the total reaction cross sections with and without
Coulomb breakup contributions, σR(withCBU)/σR(withoutCBU ).
0.1
1
10
100
1000
10000
2 4 6 8 10 12 14 16
rel y
ield
Ed (MeV)
A+d break up Xsec
Pb
Sn
Nd
Remarkable enhancement can be seen for the target of large atomic number (Z > 40). The ratio is
almost 1 for lower Z targets and well above 1 for heavier targets. It is estimated that the curves depart
from 1 for Ed < (Coulomb barrier height)/2. From these calculations, Oppenheimer-Phillips effect via
open channels seems to be unimportant for light nuclei.
- 22 -
References
1 O.E. Lawrence, E.McMillan and R.L. Thornton, Phys. Rev. 48, 493(1935)
2 J.R. Oppenheimer and M. Phillips, Phys. Rev. 48,500(1935)
3 Gy. Bencze and Colston Chandler, Phys. Rev. C53,880(1996)
4 M. Kamimura, M. Yahiro, Y. Iseri,Y. Sakuragi, H. Kameyama and M. Kawai, Prog. Theor. Phys. Jpn.
Supp.,89(1986).
5 R.L. Varner, W.J. Thompson, T.L. McAbee, E.J. Ludwig and T.B. Clegg, Phys. Rep.201(1991) 59.
6 R.V. Reid, Jr., Ann. Phys. 50 411(1968).
- 23 -

2.6 CDCC analysis of triple differential cross section of 208Pb(d,pn) re-action at Ed=56 MeV
Y. Aoki, N. Okumura, T. Jho and Y. Iseria
As an extension of an CDCC analysis, triple differential cross sections of deuteron elastic break up
process is studied.
The concept of Continuum Discretized Coupled Channels (CDCC) approach of deuteron elastic scat-
tering and breakup process is spelled out by Kawai and co-workers in ref. [1]. A brief description is given
here just to remind the concepts of the ingredients. The CDCC Hamiltonian may be written as follows,
H = Tp +Vp +Tn +Vn +Vpn,
where Tp and Tn are kinetic energy operator of a proton and a neutron, which are bound to form a deuteron
in the incident channel. They interact with each other by the potential Vp−n. Continuum states are dis-
cretized by wave number binning. We assumed that the spin flip process may be negligible and the
spin singlet states are neglected. Scattering states really taken into the analyses are, 3S1 − 3D1, 3D2,3,3P0,1 and 3P2 − 3F2 states. Wave number kp−n of the relative p-n motion are binned by 10 bins of
kp−n = 0− 0.1 , · · · 0.9 − 1.0 f m−1. Reid soft core potential [2] is assumed whenever it is available.
Gaussian potential, which reproduce the phase shift, is assumed for the 3D3 states.
Proton and a neutron interaction with a target nucleus are given by potentials of Vp and Vn. No explicit
excitation of target nucleus and rearrangement reactions are taken into account. Nucleon optical potential,
CH89 [3], of half the deuteron kinetic energy Ep = En = Ed/2 are assumed in the present analyses. Proton
in the deuteron interact with the target nucleus via Coulomb potential, which are assumed to be due to
uniformly charged sphere. Because deuteron is a bound state of proton and a neutron, antisymmetrization
correction is necessary even if we assume that the phenomenological optical potential takes care of the
exchange effect of incident nucleon and nucleons in the target. This antisymmetrizaton correction is
phenomenologically taken into account by reducing(increasing) the real(imaginary) central part of the
optical potential.
Proton and neutron coordinates rp, rn are expressed by the center of mass and relative coordinates by
the following relation,
R = (rn +rp)/2, r = (rn−rp)
Coupled channels equation for the R coordinates are written by partial wave expansion, solved numeri-
cally and S-matrices are obtained. In handling the nucleon spin-orbit potential, terms with (sp − sn) are
neglected.
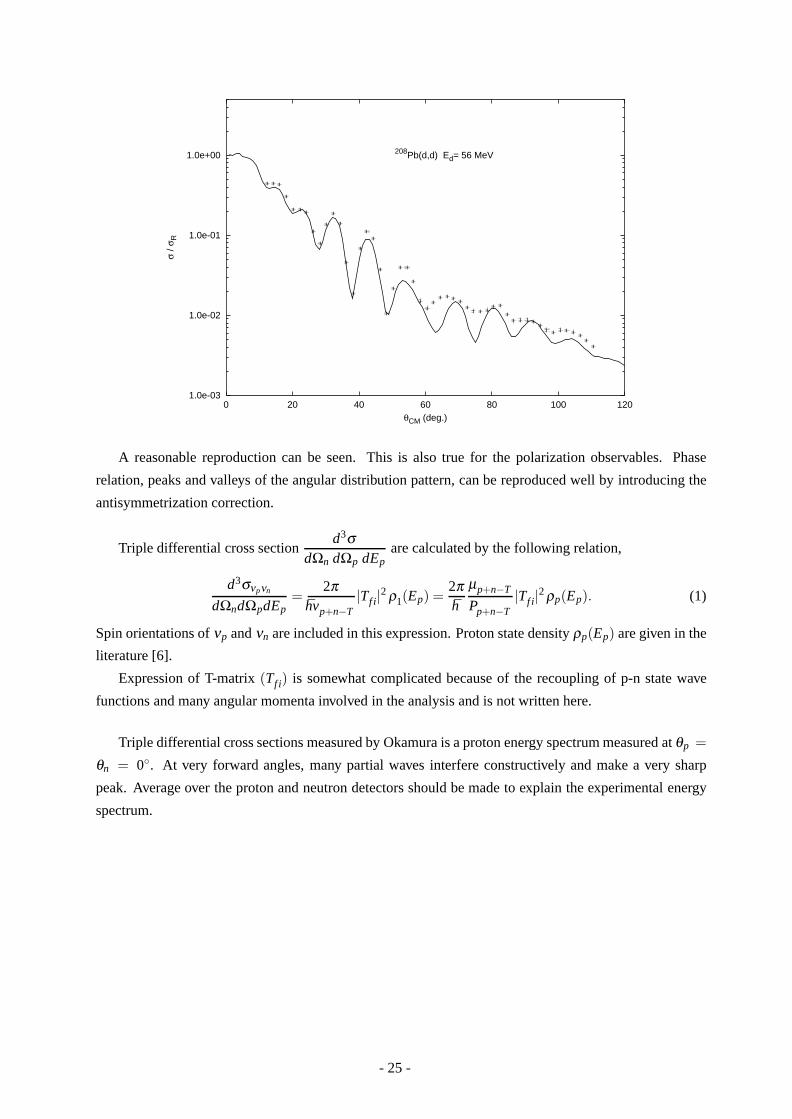
A detailed data of elastic scattering by Matsuoka [4] and triple differential cross sections by Okamura
[5] are taken into account and the case of 56 MeV deuteron + 208Pb are considered.
Elastic differential cross section and other polarization observables are calculated from the elastic S-
matrices. Differential cross section of experimental data and the present analysis are compared in fig.
1.
- 24 -
1.0e-03
1.0e-02
1.0e-01
1.0e+00
0 20 40 60 80 100 120
σ / σ
R
θCM (deg.)
208Pb(d,d) Ed= 56 MeV
A reasonable reproduction can be seen. This is also true for the polarization observables. Phase
relation, peaks and valleys of the angular distribution pattern, can be reproduced well by introducing the
antisymmetrization correction.
Triple differential cross sectiond3σ
dΩn dΩp dEpare calculated by the following relation,
d3σνpνn
dΩndΩpdEp=
2πhvp+n−T
|Tf i|2 ρ1(Ep) =2πh
µp+n−T
Pp+n−T|Tf i|2 ρp(Ep). (1)
Spin orientations of νp and νn are included in this expression. Proton state density ρp(Ep) are given in the
literature [6].
Expression of T-matrix (Tf i) is somewhat complicated because of the recoupling of p-n state wave
functions and many angular momenta involved in the analysis and is not written here.
Triple differential cross sections measured by Okamura is a proton energy spectrum measured at θp =
θn = 0. At very forward angles, many partial waves interfere constructively and make a very sharp
peak. Average over the proton and neutron detectors should be made to explain the experimental energy
spectrum.
- 25 -

0
50
100
150
200
250
300
350
400
450
500
10 15 20 25 30 35 40 45 50
d3 σ/dE
p dΩ
p dΩ
n (m
b/ M
eV s
r2 )
Ep (MeV)
µI= 1
µI=0
unpol. d
208Pb(d,pn)
Ed= 56 MeV
Fig. 2 compares the experimental data with the averaged triple differential cross sections for polarized
and unpolarized deuterons. Polarization axis is along the beam direction.
One can see a large peak at Ep = 30 MeV, while experimental peak is located at about Ep = 31-32 MeV.
Large valleys can be seen on both sides of the peak, which are not seen in the experimental data. The origin
of these valleys can be ascribed to the destructive interference of nuclear and Coulomb contributions for
this reaction. This statement can be confirmed by limiting the maximum angular momentum and drawing
an energy spectrum.
Importance of continuum coupling can also be confirmed as follows.
-4
-3
-2
-1
0
1
2
3
4
0 5 10 15 20 25 30 35 40 45 50
arb. unit
R (fm)
d(S) <=>3D2
d(S) <=>3P1
3P1 <=>3D2
Coul. int. matrix elementsk=0.1 -- 0.2 (1/fm)
Fig. 3 compares three matrix elements, which connect three states in p-n system,the S-state of the
- 26 -
deuteron, 3P1 and 3D2. Wave number of these scattering states are kp−n = 0.1−0.2 f m−1. Continuum-
continuum coupling, in this case, is much larger than the direct break up matrix elements. We can study
the elastic break-up cross section by plotting the following quantity,
10π3K2
p+n(2J +1)|SJ(break−upchannel)|2
By using this quantity, we can compare quantitatively at what J and to what breakup channel, the incident
flux is actually directed. Ratio of positive to negative parity break up can be studied by changing the
amplitudes of these off diagonal matrix elements.
References
1 M. Kamimura, M. Yahiro, Y. Iseri, Y. Sakuragi, H. Kameyama and M. Kawai, Prog. Theor. Phys. 89
1986
2 R.V. Reid, Jr., Ann. Phys.50(1968) 411
3 R.L. Varner, W.J. Thompson, T.L. McAbee, E.J. Ludwig and T.B. Clegg, Phys. Rep. 201(1991) 59
4 N.Matsuoka, H.Sakai, T. Saito, K. Hosono, M. Kondo, H. Ito, K. Hatanaka, T. Ichihara, A. Okihana,
K. Imai, K. Nishimura, Nucl. Phys. A455 (1986) 413
5 H.Okamura, A.Ishida, N. Sakamoto, O.Otsu, T. Uesaka, T. Wakasa, H. Sakai, T. Niizeki, H. Toyokawa,
Y. Tajima, H. Ohnuma, M. Yosoi, K. Hatanaka and T. Ichihara, Phys. Rev. C58 (1998) 2180
6 G.G. Ohlsen, Nucl. Instr. Meth. 37(1965) 240.
- 27 -
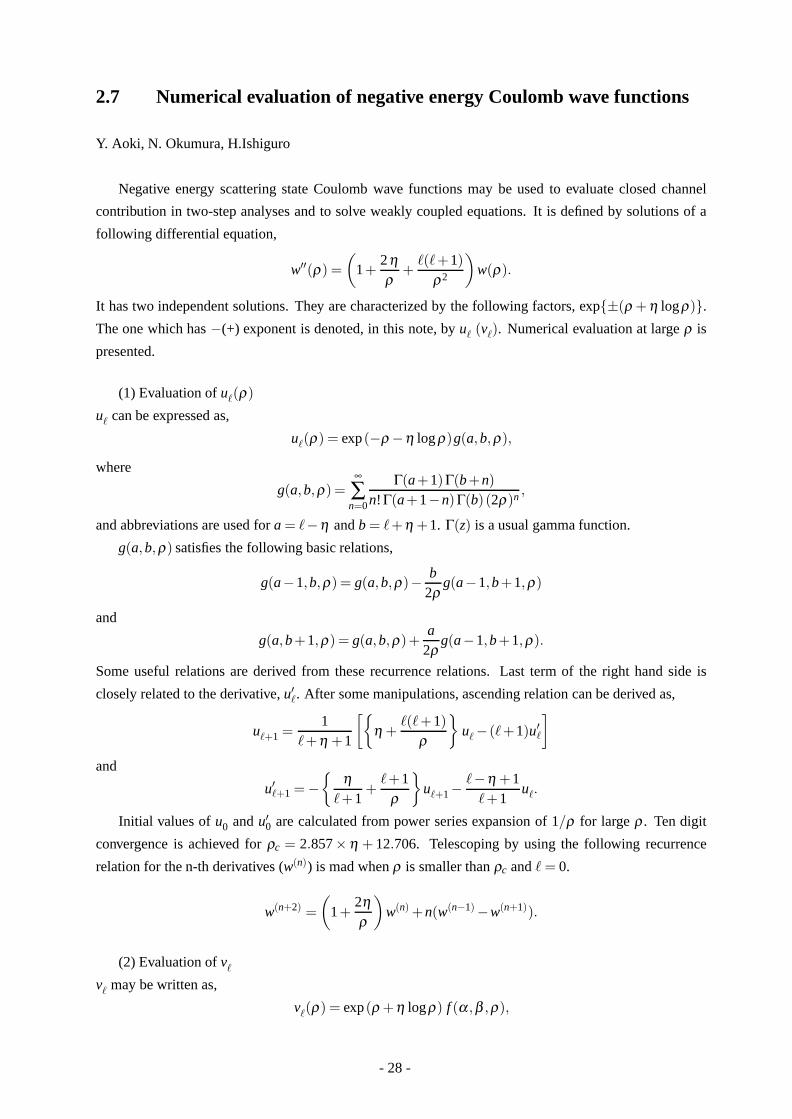
2.7 Numerical evaluation of negative energy Coulomb wave functions
Y. Aoki, N. Okumura, H.Ishiguro
Negative energy scattering state Coulomb wave functions may be used to evaluate closed channel
contribution in two-step analyses and to solve weakly coupled equations. It is defined by solutions of a
following differential equation,
w′′(ρ) =(
1+2ηρ
+(+1)
ρ2
)w(ρ).
It has two independent solutions. They are characterized by the following factors, exp±(ρ + η logρ).
The one which has −(+) exponent is denoted, in this note, by u (v). Numerical evaluation at large ρ is
presented.
(1) Evaluation of u(ρ)
u can be expressed as,
u(ρ) = exp (−ρ −η log ρ)g(a,b,ρ),
where
g(a,b,ρ) =∞
∑n=0
Γ(a+1)Γ(b+n)n!Γ(a+1−n)Γ(b) (2ρ)n ,
and abbreviations are used for a = −η and b = +η +1. Γ(z) is a usual gamma function.
g(a,b,ρ) satisfies the following basic relations,
g(a−1,b,ρ) = g(a,b,ρ)− b2ρ
g(a−1,b+1,ρ)
and
g(a,b+1,ρ) = g(a,b,ρ)+a
2ρg(a−1,b+1,ρ).
Some useful relations are derived from these recurrence relations. Last term of the right hand side is
closely related to the derivative, u′. After some manipulations, ascending relation can be derived as,
u+1 =1
+η +1
[η +
(+1)ρ
u− (+1)u′
]
and
u′+1 = −
η+1
++1
ρ
u+1−
−η +1+1
u.
Initial values of u0 and u′0 are calculated from power series expansion of 1/ρ for large ρ . Ten digit
convergence is achieved for ρc = 2.857×η + 12.706. Telescoping by using the following recurrence
relation for the n-th derivatives (w(n)) is mad when ρ is smaller than ρc and = 0.
w(n+2) =(
1+2ηρ
)w(n) +n(w(n−1)−w(n+1)).
(2) Evaluation of v
v may be written as,
v(ρ) = exp (ρ +η logρ) f (α ,β ,ρ),
- 28 -
where,
f (α ,β ,ρ)=∞
∑n=0
(−1)n Γ(α +1)Γ(β +n)n!Γ(α +1−n)Γ(β ) (2ρ)n ,
α = +η and β = −η +1. f (α ,β ,ρ) satisfies the following relations,
f (α −1,β ,ρ) = f (α ,β ,ρ)+β2ρ
f (α −1,β +1,ρ)
and
f (α ,β +1,ρ) = f (α ,β ,ρ)− α2ρ
f (α −1,β +1,ρ)
Descending formulae for follow as,
v =1
+η +1
[η +
(+1)2
ρ
v+1 − (+1)v′+1
]
and
v′+1 =1
+1
[η +
(+1)2
ρ
v +(−η +1)v+1
]
Key values of v and v′ can be evaluated as follows. We notice a recurrence relation for contiguous β and
fixed α ,
(1+
α +β +12ρ
)f (α ,β +1,ρ) = f (α ,β ,ρ)+
β +12ρ
f (α ,β +2,ρ).
This relation is converted to the following continued fraction,
fβ ≡ f (α ,β ,ρ)f (α ,β +1,ρ)
= b0 +a1
b1 +a2
b2 + · · · ,
b0 = 1+α +β +1
2ρ= 1+
+1ρ
,
an = −(β +n) = −(−η +n+1),
and
bn = 2ρ +α +β +n+1 = 2(ρ ++1)+n.
This continued fraction converges very fast for large .
By using the recurrence relations for f (α ,β ,ρ) and Wronskian relation v′ u − v u′ = 1, v(ρ) and
v′(ρ) are written as,
v =
[u
1+
1ρ
(+1− +1−η
fβ
)−u′
]−1
and
v′ =
1+
+1ρ
− +1−ηρ fβ
v.
All the logic is confirmed by checking the Wronskian relations for any .
Detailed derivation, in Japanese, and FORTRAN program (cwf.tex) can be downloaded from
http://www.tac.tsukuba.ac.jp/∼yaoki.
- 29 -

3.1 Equilibrium charge states of Cu, Br and I ions passing through Be foils
K.Shima, N.Okumura, H.Koubai, S.Ishii and K.Sasa
Charge distributions of energetic ions after the passage through thin foils differ by the atomic number
Z2 of foils. For ions of 28.5 and 59 MeV
19
F, 29-109 MeV 28
Si, 23.5-108.5 MeV 35
Cl and 117 MeV 63
Cu,
equilibrium mean charges, qb, were found to oscillate with Z
2when q
b values are compared at a common
projectile energy[1-3]. For all these ions and energies, the general characteristics is that the qb values
increase with decreasing Z2 by showing an oscillatory behavior although the oscillatory behavior is not so
remarkable in 19
F ions. Within the framework of investigated foils, ions after the passage through Be foil
exhibited the highest qb, and those after the passage through C foil exhibited the second highest q
b value.
In view of accelerator technology such as settling a charge stripper in the course of acceleration tube,
it is very important to investigate the problem that the above mentioned fact of the Be foil exhibiting the
most highly charged ions is true or not for any ion species. Actually, except for the case of 117 MeV 63
Cu,
there has been no report on heavier ions than Cu after the passage through Be foils in tandem accelerator
energy region [4]. In this report, projectile ion species and energy have been extended to 50-150 MeV 63
Cu,
79
Br, and 127
I ions, and equilibrium charge distributions have been measured after the passage through Be
foil. In some cases of ions and energies, the charge distributions were also measured by using foils with
some different Z2.
The procedure to measure the charge distribution is described elsewhere [2]. After the passage
through a self-supporting foil, the ions with charge state q were analyzed by using a magnetic spectrograph
ESP-90, and are collected with a Faraday cup. On the other hand, the scattered ions or recoiled target
atoms were detected with a surface barrier detector. Charge fraction F(q) for each q was obtained from the
integrated beam current and the scattered or recoiled particle counts during the measurement.
Obtained results of equilibrium mean charges , qb , are plotted in Figs.1-3 for Cu, Br, I ions after the
passage through Be and C foils as a function of projectile exit energy from a foil, E. In the figures, present
data as well as already reported data elsewhere [1,2,3,5,6] are shown.
Figs.1 to 3 demonstrate that even in the heavy ions of Cu, Br and I, the mean charges after the passage
through Be foil, qb(Be), are higher than those after the C foil, q
b(C), at about E>50 MeV for Cu and Br ions
and E>100 MeV for I ions. Figures also show that the difference between qb(Be) and q
b(C) increases with
increasing E. Above mentioned two trends are similar to those observed in the lighter ions like F, Si or Cl
[1-3]. On the other hand, It should be noticed that the trend of higher qb values for lower Z
2 is also
preserved at much higher E region than the present energy region of around 0.5-2 MeV/u. Gauvin et al.
reported that the qb values of 4.35 to 40 MeV/u Kr ions after the passage through Be, Al, Cu Ag, Au foils
are higher for lower Z2 [7]. Present information is useful in the construction of ion accelerator,
particularly for the selection of the material charge strippers placed not only at the terminal of a tandem
accelerator but also at some stages of the higher energy stages along the accelerated beam line.
- 30 -

References:
[1] K.Shima, Nucl. Instr. And Meth. B10/11 (1985) 45.
[2] K.Shima, T.Ishihara, T.Miyoshi, T.Momoi, and T.Mikumo, Phys. Rev. A29 (1984)1763.
[3] K.Shima, T.Ishihara, T.Momoi, T.Miyoshi, K.Numata and T.Mikumo, Phys. Lett. 98A (1983) 106.
[4] K.shima, S.Nagai and T.Ishihara, Nucl. Instr. and Meth. A244 (1986) 330.
[5] S.Datz, C.D.Moak, H.O.Lutz, L.C.Northcliffe and L.B.Bridwell, Atomic Data 2 (1971) 273.
[6] K.Shima, T.Mikumo and H.Tawara, At. Data and Nucl. Data Tables 34 (1986) 357.
[7 ] H.Gauvin, R.Bimbot, J.Herault and B.Kubica, Nucl.Instrum. and Meth. B47 (1990) 339.
Fig.1. Equilibrium mean charge of Cu ions Fig.2. Equilibrium mean charge of Br ions
passing through a Be or C foil. passing through a Be or C foil.
Fig.3. Equilibrium mean charge of I ions passing
through a Be or C foil.
14
16
18
20
22
24
20 40 60 80 100 120 140 160 180
63
Cu ions
Eq
uilib
riu
m m
ean
ch
arg
e
Energy of
63
Cu [MeV]
Be
C
15
17
19
21
23
25
30 50 70 90 110 130 150 170
79
Br ions
Eq
uilib
riu
m m
ean
ch
arg
e
Energy of79
Br [MeV]
C
Be
20
22
24
26
28
30
40 60 80 100 120 140 160
127
I ions
Eq
uilib
riu
m m
ea
n c
ha
rg
e
Be
C
- 31 -

3.2 Electron emission by fast cluster impact on solids
W. Iwazaki, T. Suguri, H. Kudo, Y. Saitoh1, S. Yamamoto1, K. Narumi1, H. Naramoto1
When a solid target is bombarded by a fast atom-cluster beam, the atomic collisions near the surface
are sometimes affected by the correlated impacts on a nano-sized area on the surface. They are different
from those induced by impact of a single ion or a small molecule. Actually, fast cluster ions in the
MeV/atom velocity range give rise to nonlinear radiation effects on solid targets with respect to the number
of constituent atoms in the cluster n. This topic has been reviewed recently by Jacquet and Beyec [1], and
by Parilis [2].
The nonlinearity has so far been reported for energy loss (stopping power) [3, 4], sputtering [5], lattice
damage [6, 7, 8], secondary ion emission [9], and total electron emission yield (corresponding to the
emission current) [10]. It is notable that the total electron emission yield per atom depends sublinearly on
n. This is contrast to the radiation effects accompanying atomic displacements, i.e., sputtering or lattice
damage, for which the n–dependence is stronger than linear.
The aim of the present study is to investigate the cluster effect in the ion-induced electron emission.
Key information for the cluster-solid interactions will be included in the electron yield possibly at ener-
gies lower than ∼50 eV, which should reflect soft interactions of the cluster as a whole, rather than of
the constituent atoms, with the target atoms. A better understanding of the cluster-induced electron emis-
sion would provide not only knowledge about the atomic and electronic processes of the cluster impact
phenomena, but also an insight into the related effects resulting from energetic cluster-solid interactions.
Such basic approach will also be of practical importance for future material processing by cluster impact.
pA
Spectrometer
FC
Target
Beam
3-mm-diam aperture
Scale(cm)
e
pA
2 640
45
Fig. 1: Experimental setup.
The 0.5 MeV/atom C+n (n = 1, 4, 8) beams obtained from the 3 MV tandem accelerator at JAERI-
Takasaki were incident on the samples of evaporated Nb on alumina, pyrolytic graphite with cleaved
(0001) surface, and chemically cleaned Si(100). The secondary electrons were measured at 135 with
respect to the beam direction, using a 45 parallel-plate electrostatic spectrometer of the double-deflection
type, as shown in Fig. 1. To reduce the influence of environmental magnetic field on the motion of low-
energy electrons, the spectrometer was designed to be a smaller size than reported previously. The electron1JAERI
- 32 -
measurements were carried out at room temperature under a pressure of ∼6×10⁻⁶ Pa. The existence of
contaminant atoms on the surfaces is anticipated under the present vacuum conditions. This should slightly
change the transmission of outgoing electrons across the surface, but should not affect the n dependence
of the electron energy spectra, which is of primary interest in the present studies.
The energy spectra of electrons presented here are raw data, i.e., the yield in the vertical axis is the
number of electron signals counted. Accordingly, the spectra include no correction for the energy accep-
tance of the spectrometer, which is proportional to the electron energy, nor for the energy dependence of
the efficiency of the electron multiplier. This is of minor importance in the analysis of the data because the
measured electron yields for different experimental conditions are compared always at the same electron
energy.
C1+
C4+
C8+
0050 100 150
0.2
0.4
2.5
0.5MeV/atom C on NbnC1
+
C4+
C8+
20 40
0.5
1.0
1.5
2.0
2.5
Relative yield (103
counts)
Electron energy (eV)
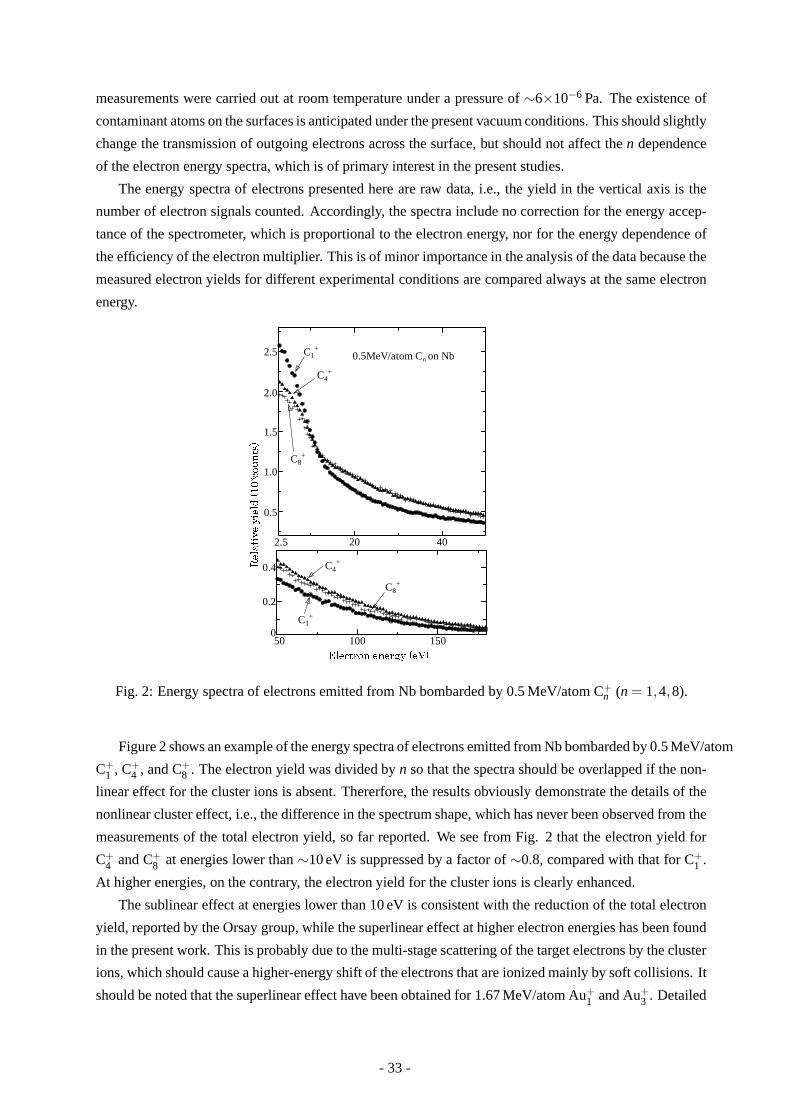
Fig. 2: Energy spectra of electrons emitted from Nb bombarded by 0.5 MeV/atom C+n (n = 1,4,8).
Figure 2 shows an example of the energy spectra of electrons emitted from Nb bombarded by 0.5 MeV/atom
C+1 , C+
4 , and C+8 . The electron yield was divided by n so that the spectra should be overlapped if the non-
linear effect for the cluster ions is absent. Thererfore, the results obviously demonstrate the details of the
nonlinear cluster effect, i.e., the difference in the spectrum shape, which has never been observed from the
measurements of the total electron yield, so far reported. We see from Fig. 2 that the electron yield for
C+4 and C+
8 at energies lower than ∼10 eV is suppressed by a factor of ∼0.8, compared with that for C+1 .
At higher energies, on the contrary, the electron yield for the cluster ions is clearly enhanced.
The sublinear effect at energies lower than 10 eV is consistent with the reduction of the total electron
yield, reported by the Orsay group, while the superlinear effect at higher electron energies has been found
in the present work. This is probably due to the multi-stage scattering of the target electrons by the cluster
ions, which should cause a higher-energy shift of the electrons that are ionized mainly by soft collisions. It
should be noted that the superlinear effect have been obtained for 1.67 MeV/atom Au+1 and Au+
3 . Detailed
- 33 -
analysis of the results are now being carried out.
References
[1] D. Jacquet, Y. Le Beyec, Nucl. Instrum. Methods B 193 (2002) 227.
[2] E. Parilis, Nucl. Instrum. Methods B 193 (2002) 240.
[3] W. Brandt, A. Ratkowski, and R. H. Ritchie, Phys. Rev. Lett. 33 (1974) 1325.
[4] K. Baudin, A. Brunelle, M. Chabot, S. Della-Negra, J. Depauw, D. Gardes, P. Hakansson, Y. Le
Beyec, A. Billebaud, M. Fallavier, J. Remillieux, J. C. Poizat, J. P. Thomas, Nucl. Instrum. and
Methods B 94 (1994) 341.
[5] H. H. Andersen, A. Brunelle, S. Della-Negra, J. Depauw, D. Jaquet, Y. Le Beyec, J. Chaumont, H.
Bernas, Phys. Rev. Lett. 33 (1998) 5433.
[6] M. Dobeli, R. M. Ender, U. S. Fischer, M. Suter, H. A. Synal, D. Vetterli, Nucl. Instrum. and Methods
B 94 (1994) 388.
[7] H. Shen, C. Brink, P. Hvelplund, S. Shiryaev, PeiXiong Shi, J. A. Davies, Nucl. Instrum. and Meth-
ods B129 (1997) 203.
[8] J. R. Liu, X. M. Wang, L. Shao, H. Chen, W. K. Chu, Nucl. Instrum. and Methods B197 (2002) 101.
[9] A. Brunelle, S. Della-Negra, J. Depauw, D. Jaquet, Y. Le Beyec, and M. Pautrat, K. Baudin, H. H.
Andersen, Phys. Rev. A 63 (2001) 022902.
[10] M. Fallavier, R. Kirsch, J. C. Poizat, J. Remillieux, J. P. Thomas, Nucl. Instrum. and Methods B
164-165 (2000) 920.
- 34 -

3.3 Low-energy electron emission from solids bombarded by fastdressed ions
T. Suguri, W. Iwazaki, C. Sakurai, S. Numazawa, I. Arano, H. Kudo
Low-energy electrons emitted from a solid surface bombarded by fast heavy ions reflect the screening
effect of the charge-exchanged, dressed (not fully-stripped) ions passing through the surface layer. The
present work provides comprehensive approaches to the pre-equilibrium charge states of the incident ions
from the experimental data of the low-energy electron yield, the effective nuclear charges for the loss
electron yield, and the binary-encounter electron yield reported previously.
The electron emission from fast dressed ions in collision with atoms has been one of the attractive
phenomena in atomic collision studies [1]. The observation of the emitted electrons, in particular, the
loss electrons, provides knowledge about the ionization processes in a reversed situation of the collision-
induced ionization of a target atom in the laboratory frame. Indeed, the loss electron yield is maximal at a
loss-peak energy EL, which is equal to the kinetic energy of an electron moving at the same speed as the
ion. The fundamental aspects of the loss electron yield have been studied experimentally and theoretically
since its discovery in the 1970s. In these basic studies, the workers focused on the loss electron spectra
resulting from an ion–atom single collision process which is realized in gas-target experiments.
For a solid target, loss electrons produced below the surface generally suffer elastic and inelastic
scattering before they are emitted from the surface. Accordingly, the energy and angular distributions
of the loss electron yield at a backward angle from a solid target are inherently degraded from those
in the produced stage. This is probably one of the reasons that there are only a few related studies so
far reported. For example, Koyama and coworkers studied the dependence of the loss peak energies for
impact of 1.1 MeV/u He+ on the atomic number of the metal targets [2]. Other related studies include
those of convoy peaks by foil transmission experiments [3].
Since the loss electron yield results directly from the charge changing process of the incident ions, we
may obtain knowledge about the evolution of the charge states of fast dressed ions from the analysis of the
loss electron yield. Also, further knowledge will be provided from the low-energy electron yield which
should reflect the effective charge state of the ion at the surface. Both approaches will be complementary
for a detailed analysis of the charge changing process in a solid target. With these as a prospect, this paper
reports experimental studies of pre-equilibrium charge states of fast ions in solids by electron spectroscopy
combined with the ion channeling technique [4].
The 2.5 and 3.5 MeV/u C4+, C6+, O5+, and O8+ beams obtained from the tandem accelerator at
the University of Tsukuba were incident on chemically cleaned Si(110) and Ge(110) surfaces under a
pressure of ∼1×10⁻⁶ Pa. Only the 〈110〉 axial direction normal to the Si or Ge surface was chosen for
the channeling measurements since the dependence of the electron spectra on the channeling direction is
not of essential importance in the present study. The energy spectra of the ion-induced electrons were
measured in the high (0.3–3.5 keV) and low (less than 30 eV) energy ranges. In the high-energy range,
the spectra have been measured at 180 with respect to the ion beam direction, adopting the experimental
setup similar to that described elsewhere [4].
In the low-energy range, the spectra have been measured at a backward angle of 135 using a 45
- 35 -

Suppressor plate (−300 or 0V)
Acceleration grid(+600V)
Electron multiplier
e
Target holder on3-axis goniometer
Target crystalScale (cm)0 1 2 3
Ion beam
[Electron spectrometer]
Fig. 1: Experimental setup for measurements of ion-induced electrons in the energy range below ∼30 eV.
parallel-plate spectrometer of the double deflection type, as shown in Fig. 1. The post-acceleration field
(+600 V) in the spectrometer was necessary to generate the signals of the low-energy electrons. The
relative energy resolution of the spectrometer is ∼3%. During the measurements, the ion beam current
was not monitored since the operation of the suppressor plate (−300 V) to repel back the emitted electrons
is necessary for beam current measurements. Therefore, the measured electron yields without operating
the suppressor were normalized using the beam current values, 0.7–0.8 nA, monitored with operating the
suppressor. Typically, the fluctuation of the beam current was within ±3%. The beam dose required for
accumulating a spectrum was ∼3×10¹⁴ ions/cm2. The spectra were effectively reproduced even after 3
repeated cycles of the measurements.
It should be noted that the KLL Auger peaks due to C and O atoms on the crystal surfaces were
slightly recognized, indicating existence of contaminants of effectively less than a monolayer, according to
a comparison with the Auger peaks from reference targets. These light contaminant atoms should slightly
change the transmission of outgoing electrons across the surface, but should not affect the input-charge
dependence of the projectile or target ionization, which is of primary interest in the present studies.
The energy spectra of electrons presented here are raw data, i.e., the yield in the vertical axis is
the number of electron signals counted. Accordingly, the spectra include no correction for the energy
acceptance of the spectrometer, which is proportional to the electron energy, nor for the energy dependence
of the efficiency of the electron multiplier. This is because the measured electron yields for different
experimental conditions are compared always at the same electron energy.
Figures 2 and 3 show energy spectra of electrons induced by 2.5 and 3.5 MeV/u C4+ and C6+ under
〈110〉 and random (nonchanneling) incidence conditions of Si and Ge, measured at 180 with respect to
the ion beam direction. The electron yields shown are normalized to the same number of incident ions.
The enhanced electron yields at ∼1.5 keV for Si and at ∼1.0 keV for Ge are due to Si-KLL and Ge-LMM
Auger electrons, respectively. We first estimate the background yield, consisting of the continuum and
the Auger yields, on which the loss electron yield is superimposed. In Figs. 2 and 3, the electron yields
for C4+ and C6+ for each pair of 〈110〉 and random cases are effectively equal at energies higher than
- 36 -
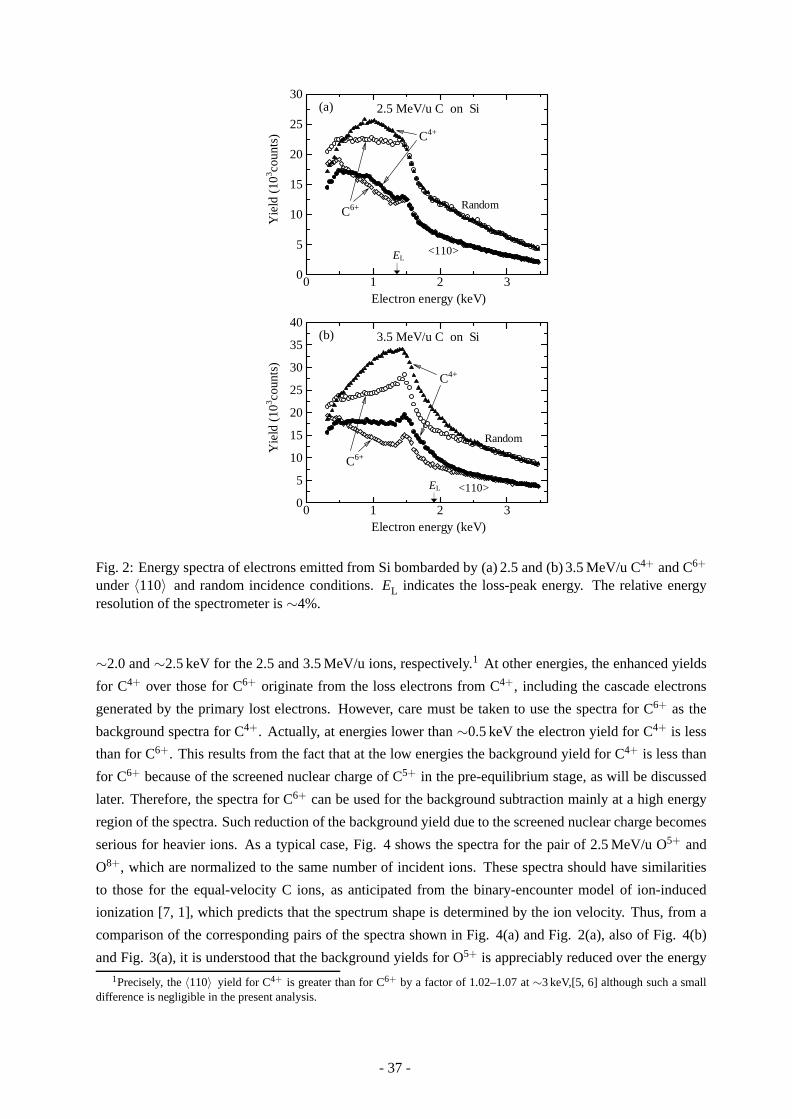
EL
EL
Yie
ld(1
03 coun
ts)
Electron energy (keV)
<110>
Random
2.5 MeV/u C on Si(a)
C4+
C6+
0 1 2 30
5
10
15
20
25
30
Yie
ld(1
03 coun
ts)
Electron energy (keV)
<110>
Random
3.5 MeV/u C on Si(b)
C4+
C6+
0 1 2 30
5
10
15
20
25
30
35
40
Fig. 2: Energy spectra of electrons emitted from Si bombarded by (a) 2.5 and (b) 3.5 MeV/u C4+ and C6+
under 〈110〉 and random incidence conditions. EL indicates the loss-peak energy. The relative energyresolution of the spectrometer is ∼4%.
∼2.0 and ∼2.5 keV for the 2.5 and 3.5 MeV/u ions, respectively.1 At other energies, the enhanced yields
for C4+ over those for C6+ originate from the loss electrons from C4+, including the cascade electrons
generated by the primary lost electrons. However, care must be taken to use the spectra for C6+ as the
background spectra for C4+. Actually, at energies lower than ∼0.5 keV the electron yield for C4+ is less
than for C6+. This results from the fact that at the low energies the background yield for C4+ is less than
for C6+ because of the screened nuclear charge of C5+ in the pre-equilibrium stage, as will be discussed
later. Therefore, the spectra for C6+ can be used for the background subtraction mainly at a high energy
region of the spectra. Such reduction of the background yield due to the screened nuclear charge becomes
serious for heavier ions. As a typical case, Fig. 4 shows the spectra for the pair of 2.5 MeV/u O5+ and
O8+, which are normalized to the same number of incident ions. These spectra should have similarities
to those for the equal-velocity C ions, as anticipated from the binary-encounter model of ion-induced
ionization [7, 1], which predicts that the spectrum shape is determined by the ion velocity. Thus, from a
comparison of the corresponding pairs of the spectra shown in Fig. 4(a) and Fig. 2(a), also of Fig. 4(b)
and Fig. 3(a), it is understood that the background yields for O5+ is appreciably reduced over the energy1Precisely, the 〈110〉 yield for C4+ is greater than for C6+ by a factor of 1.02–1.07 at ∼3 keV,[5, 6] although such a small
difference is negligible in the present analysis.
- 37 -
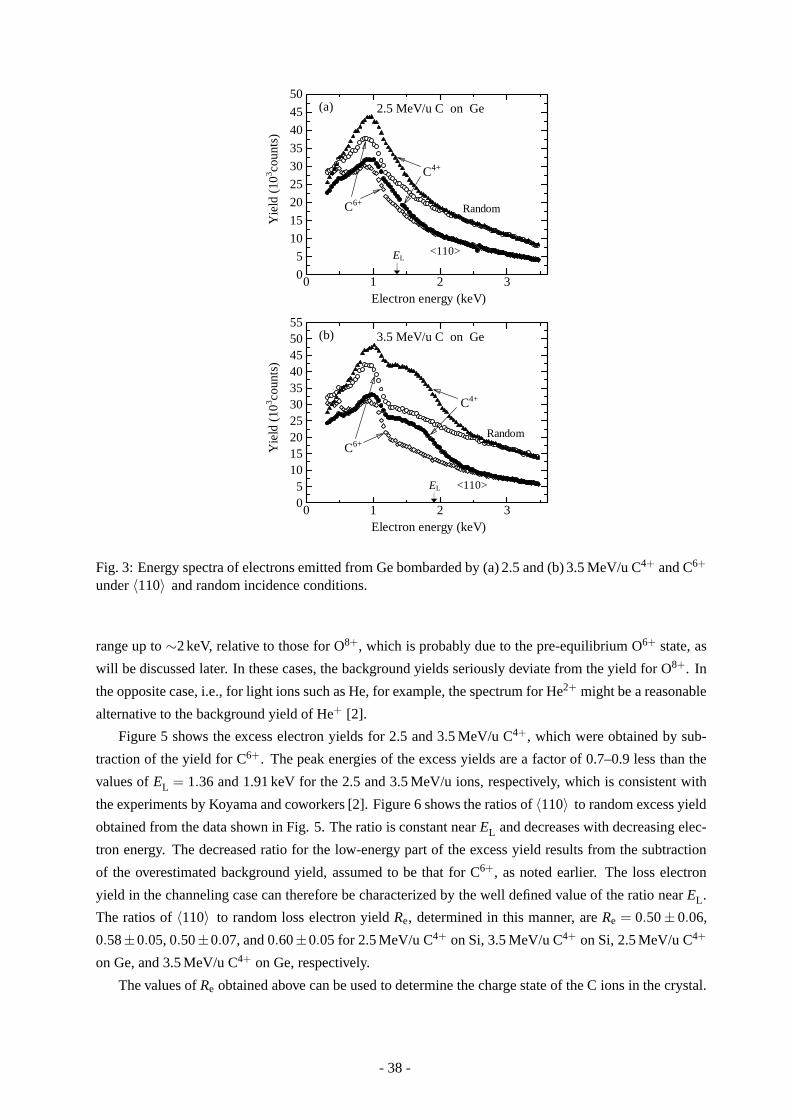
EL
EL
Yie
ld(1
03 coun
ts)
Electron energy (keV)
<110>
Random
2.5 MeV/u C on Ge(a)
C4+
C6+
0 1 2 30
5
10
15
20
25
30
35
40
45
50
Yie
ld(1
03 coun
ts)
Electron energy (keV)
<110>
Random
3.5 MeV/u C on Ge(b)
C4+
C6+
0 1 2 305
10152025303540455055
Fig. 3: Energy spectra of electrons emitted from Ge bombarded by (a) 2.5 and (b) 3.5 MeV/u C4+ and C6+
under 〈110〉 and random incidence conditions.
range up to ∼2 keV, relative to those for O8+, which is probably due to the pre-equilibrium O6+ state, as
will be discussed later. In these cases, the background yields seriously deviate from the yield for O8+. In
the opposite case, i.e., for light ions such as He, for example, the spectrum for He2+ might be a reasonable
alternative to the background yield of He+ [2].
Figure 5 shows the excess electron yields for 2.5 and 3.5 MeV/u C4+, which were obtained by sub-
traction of the yield for C6+. The peak energies of the excess yields are a factor of 0.7–0.9 less than the
values of EL = 1.36 and 1.91 keV for the 2.5 and 3.5 MeV/u ions, respectively, which is consistent with
the experiments by Koyama and coworkers [2]. Figure 6 shows the ratios of 〈110〉 to random excess yield
obtained from the data shown in Fig. 5. The ratio is constant near EL and decreases with decreasing elec-
tron energy. The decreased ratio for the low-energy part of the excess yield results from the subtraction
of the overestimated background yield, assumed to be that for C6+, as noted earlier. The loss electron
yield in the channeling case can therefore be characterized by the well defined value of the ratio near EL.
The ratios of 〈110〉 to random loss electron yield Re, determined in this manner, are Re = 0.50 ± 0.06,
0.58±0.05, 0.50±0.07, and 0.60±0.05 for 2.5 MeV/u C4+ on Si, 3.5 MeV/u C4+ on Si, 2.5 MeV/u C4+
on Ge, and 3.5 MeV/u C4+ on Ge, respectively.
The values of Re obtained above can be used to determine the charge state of the C ions in the crystal.
- 38 -

Yie
ld(1
03 coun
ts)
Electron energy (keV)
<110>
Random
2.5 MeV/u O on Si(a)
O5+ O8+
0 1 2 30
5
10
15
20
25
30
35
40
45
50
EL
EL
Yie
ld(1
03 coun
ts)
Electron energy (keV)
<110>
Random
2.5 MeV/u O on Ge(b)
O5+
O8+
0 1 2 30
10
20
30
40
50
60
70
80
Fig. 4: Energy spectra of electrons emitted from Si and Ge bombarded by 2.5 MeV/u (a) O5+ and (b) O8+
under 〈110〉 and random incidence conditions.
Obviously, the present results of Re 0.5 correspond to one- and two-electron loss of C4+ for the 〈110〉and random incidence, respectively. Such simple correspondence is mainly due to the same order of
ionization energies, I, of C4+ (I = 392 eV) and C5+ (I = 490 eV) [8]. The base width of the electron-
loss peak for a gas target is approximately given by 4√
ELI, according to Stolterfoht and coworkers [9].
Therefore, an electron ionized from a deeper atomic level of the projectile should contribute less to the
enhancement of the loss electron yield near EL, corresponding to a wider loss peak expected from the
above formula. More detailed discussion of this effect must include escape processes of the electrons lost
from the ion in the solid target.
In the following analysis, the effective nuclear charge of the C ion in the channeling case ZC has been
determined under the assumption that in the random case the C ions are fully stripped, as inferred above.
This assumption is consistent with the charge-state data of fast ions passing through thin foils [10]. It is
also notable that the assumption has been successfully used to determine the charge states of C ions in the
crystals from the analysis of the binary-encounter electron yield [5, 6, 4]. In a simple treatment, ZC = 4 if
there is no electron loss from C4+ in the crystal, i.e., Re = 0. Also, ZC = 6 if C4+ is fully stripped near the
crystal surface, i.e., Re = 1, like in the the random case. ZC can therefore be written as
ZC = 4+2Re . (1)
- 39 -

<110>
Random
2.5 MeV/u C4+ on Ge
0
2
4
6
8
10
Exc
ess
yiel
d(1
03 coun
ts)
Electron energy (keV)
<110>
Random
3.5 MeV/u C4+ on Ge
0.5 1.0 1.5 2.0 2.50369
1215
<110>
Random
2.5 MeV/u C4+ on Si
0123456
Exc
ess
yiel
d(1
03 coun
ts)
Electron energy (keV)
<110>
Random
3.5 MeV/u C4+ on Si
0.5 1.0 1.5 2.0 2.502468
10
Fig. 5: Excess yield for C4+ obtained from subtraction of the yield for C6+.
The values of ZC determined using Eq. (1) are summarized in Table 1. An uncertainty in the values ±0.1
stems from that of Re. The values of ZC are effectively equal to 5, which indicates that C5+ is the main
charge state for 〈110〉 incidence of C4+ on Si and Ge.
Further knowledge on the charge states can be obtained from the low-energy spectra of the emitted
electrons, according to Koyama and coworkers [11, 12, 3]. Figure 7 shows energy spectra of electrons
emitted from Si bombarded by 2.5 MeV/u C4+,6+ and 3.5 MeV/u O5+,8+, together with the ratio of the
yield α for the dressed to the fully stripped case. The spectra are normalized to a fixed number of the
incident ion. In contrast to the loss electron yield, the low-energy electron yield showed no discernible
change associated with ion channeling, within a statistical error of ∼2% in the measured yield. This
implies that the low-energy electrons are produced mainly by distant collisions with the target electrons.
In a rough estimate, an average ion–electron distance for ionization of a target electron by a fast ion of
velocity v is given by the adiabatic radius ρ = v/(I + ε), where I and ε are the binding energy and the
emission energy of the electron [9, 1]. For example, ρ 1.4 A for ionization of Si L-shell electrons
(I 100 eV for L2,3 shell) under the condition of ε ≤ 30 eV, corresponding to the present case shown in
Fig. 7. This value is comparable to the interatomic distance in Si, which accounts for the absence of the
channeling-related behavior of the low-energy electron yield, considering that (i) Si K-shell electrons make
only minor contribution to the observed electron yield [4], and (ii) the ionization of widely distributed
valence electrons should not suffer channeling effect. It is noticeable in Fig. 7 that α is constant, i.e.,
α = 0.70± 0.02 (at 15–27 eV) and α = 0.58± 0.01 (at 5–27 eV) for incidence of 2.5 MeV/u C4+ and
3.5 MeV/u O5+, respectively. α is actually the low electron-energy limit of the ratios of the background
yield both for the 〈110〉 and random cases. Similar results for Ge are shown in Fig. 8.
The ionization by distant collisions are caused by the screened Coulomb field of the partially stripped
ion, and can be described in terms of the effective nuclear charge, i.e., an alternative point charge Zeff. It
is therefore expected that α is proportional to Z2eff [3, 1]. We may assume that Zeff is equal to the atomic
- 40 -

2.5 MeV/u C4+ on Ge
00.2
0.4
0.6
0.8
1.0
3.5 MeV/u C4+ on Ge
Electron energy (keV)
Rat
ioof
<11
0>to
rand
omex
cess
yiel
d
0.5 1.0 1.5 2.0 2.50
0.20.40.60.81.03.5 MeV/u C4+ on Si
Electron energy (keV)
Rat
ioof
<110
>to
rand
omex
cess
yiel
d
0.5 1.0 1.5 2.0 2.50
0.20.40.60.81.0
2.5 MeV/u C4+ on Si
00.2
0.4
0.6
0.8
1.0
EL
EL EL
EL
Fig. 6: Ratios of 〈110〉 to random excess yield, obtained from the results shown in Fig. 5. The loss-peakenergies EL are indicated.
Table 1: Comparison of ZC, Zeff, and Z∗eff for 〈110〉 channeling in Si and Ge. The values of ZC and Zeff
have been obtained in the present work, while those of Z∗eff were obtained previously using the binary-
encounter electron yield [5, 6, 4]. An estimated uncertainty in the values of ZC, Zeff, and Z∗eff is roughly
±0.1. Note that Zeff is independent of the incident direction, i.e., channeling or random incidence, on thecrystal target.
Projectile Crystal ZC Zeff Z∗eff
2.5 MeV/u C4+ Si 5.0 5.0 4.82.5 MeV/u C4+ Ge 5.0 5.1 5.73.5 MeV/u C4+ Si 5.2 5.3 5.13.5 MeV/u C4+ Ge 5.2 5.4 –3.5 MeV/u O5+ Si – 6.1 6.0
number of the ion Z1 for incidence of the fully stripped 2.5 MeV/u C6+ and 3.5 MeV/u O8+, since these
are the most probable charge states for random incidence, as noted earlier. It follows that Zeff for the
partially stripped ion is given by
Zeff = Z1
√α . (2)
The values obtained from Eq. (2) are, for example, Zeff = 5.0 ± 0.1 and 6.1 ± 0.1 for incidence of
2.5 MeV/u C4+ and 3.5 MeV/u O5+ on Si, respectively, and are summarized in Table 1.
The evolution of the charge states of the ions can be deduced from a comparison among the three
effective nuclear charges shown in Table 1, i.e., ZC, Zeff, and Z∗eff which was determined previously from
the binary-encounter electron yield produced under channeling incidence conditions [5, 6, 4]. Such an
approach allows a comprehensive understanding of the experimental results because of the different char-
acter of the three effective nuclear charges. While ZC directly corresponds to the average charge state,
- 41 -

2.5 MeV/u C on Si
Yie
ld(1
03co
unts
)C4+
C6+
0
5
10
15
203.5 MeV/u O on Si
Yie
ld(1
03co
unts
)
O5+
O8+
0
5
10
15
2.5 MeV/u C on Si
Electron energy (eV)
Rat
ioα
0 10 20 30
0.6
0.7
0.83.5 MeV/u O on Si
Electron energy (eV)
Rat
ioα
0 10 20 30
0.5
0.6
0.7
Fig. 7: Energy spectra of electrons emitted from Si bombarded by 2.5 MeV/u C and 3.5 MeV/u O ions,measured at 135 with respect to the beam direction. The yields are normalized to the same number ofincident ions. Also shown are the ratios α of the yield for the dressed to the fully stripped case. Note thatthese spectra showed no discernible change associated with ion channeling.
Zeff and Z∗eff are associated with the screening of nuclear charges, and accordingly, they depend on the
ion–electron or ion–atom distance of interaction for the observed phenomenon of interest. Also, ZC and
Z∗eff are associated with stable charge states realized by the balance between the electron capture and loss
processes, in contrast to Zeff which probably reflects the pre-equilibrium stage of the incident ions.
The data shown in Table 1 indicate that in most cases the values of ZC, Zeff , and Z∗eff are effecftively
equal to 5. It is inferred from this fact that an incident C4+ mainly loses one electron in a thin surface
layer and most of the target electrons are ionized by C5+. C5+ loses one more electron in the random case,
while it remains unchanged in the channeling case. A similar change in the charge state is anticipated for
O5+. The distance from the surface L, where the one-electron loss of the incident ion is completed, can
be estimated by considering that Z∗eff is characterized by the channeling orbits. The ion–atom glancing
collisions starting from the surface, by which the channeling orbits are established, mainly occur from the
surface to the depth L1 where the close-encounter probability of ions with the aligned atoms decreases to
50%. L1 can be evaluated from the computer simulations of channeling [13, 14], which allow to calculate
the close-encounter probability as a function of distance along the axial direction. In the present case,
the simulations conclude L1 ∼ 40 and 30 A for Si and Ge, respectively.2 Therefore, we may estimate
L ≤ 10 A in the actual case, from the condition of L L1. According to the previous analysis, Z∗eff 5,
i.e., the channeling orbits are established mainly by C5+. It is therefore concluded that the frozen charge
state of the channeled C5+ (and probably O6+) is established not by the ion–atom glancing collisions, but
predominantly by the quick freezing of the pre-equilibrium charge state at the surface.
Finally, an essential aspect of the low-energy electron yield from a solid target is pointed out. The2These values can be obtained also from a universal curve of the simulation results, as given by Stensgaard and coworkers
[15, 13].
- 42 -
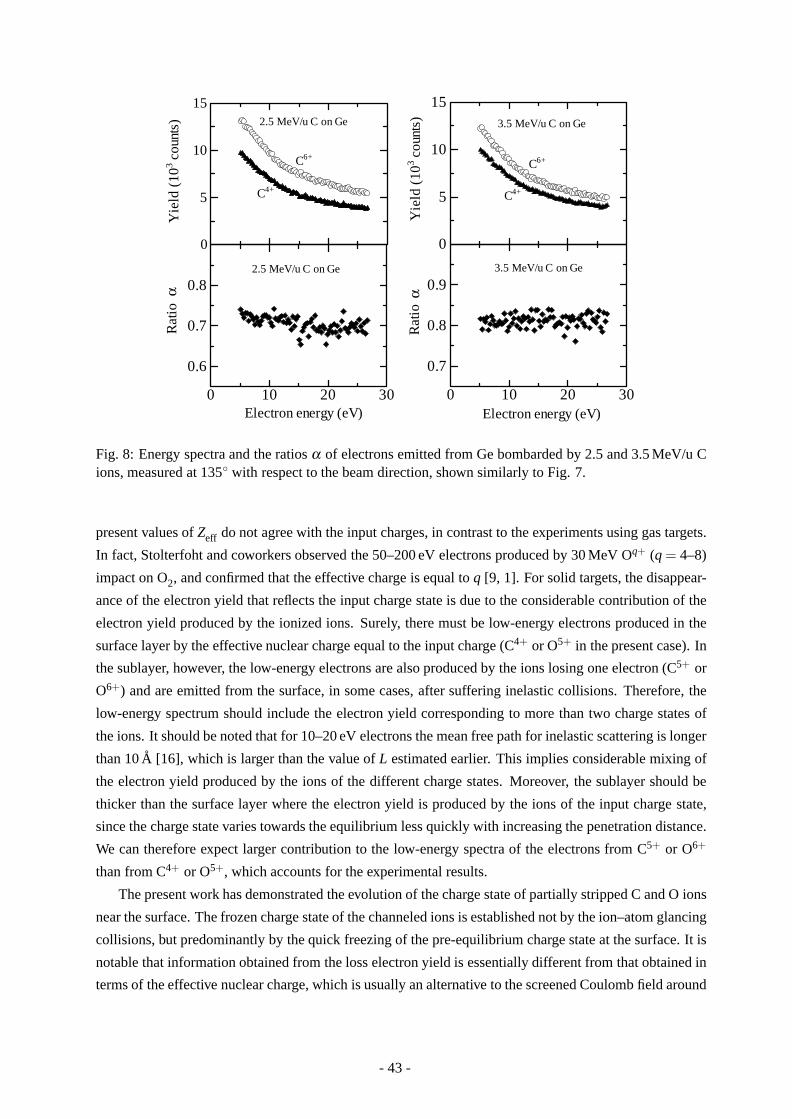
2.5 MeV/u C on Ge
Yie
ld (
103 c
ount
s)C6+
C4+
0
5
10
153.5 MeV/u C on Ge
Yie
ld (
103 c
ount
s)
C4+
C6+
0
5
10
15
2.5 MeV/u C on Ge
Electron energy (eV)
Rat
ioα
0 10 20 30
0.6
0.7
0.83.5 MeV/u C on Ge
Electron energy (eV)R
atio
α0 10 20 30
0.7
0.8
0.9
Fig. 8: Energy spectra and the ratios α of electrons emitted from Ge bombarded by 2.5 and 3.5 MeV/u Cions, measured at 135 with respect to the beam direction, shown similarly to Fig. 7.
present values of Zeff do not agree with the input charges, in contrast to the experiments using gas targets.
In fact, Stolterfoht and coworkers observed the 50–200 eV electrons produced by 30 MeV Oq+ (q = 4–8)
impact on O2, and confirmed that the effective charge is equal to q [9, 1]. For solid targets, the disappear-
ance of the electron yield that reflects the input charge state is due to the considerable contribution of the
electron yield produced by the ionized ions. Surely, there must be low-energy electrons produced in the
surface layer by the effective nuclear charge equal to the input charge (C4+ or O5+ in the present case). In
the sublayer, however, the low-energy electrons are also produced by the ions losing one electron (C5+ or
O6+) and are emitted from the surface, in some cases, after suffering inelastic collisions. Therefore, the
low-energy spectrum should include the electron yield corresponding to more than two charge states of
the ions. It should be noted that for 10–20 eV electrons the mean free path for inelastic scattering is longer
than 10 A [16], which is larger than the value of L estimated earlier. This implies considerable mixing of
the electron yield produced by the ions of the different charge states. Moreover, the sublayer should be
thicker than the surface layer where the electron yield is produced by the ions of the input charge state,
since the charge state varies towards the equilibrium less quickly with increasing the penetration distance.
We can therefore expect larger contribution to the low-energy spectra of the electrons from C5+ or O6+
than from C4+ or O5+, which accounts for the experimental results.
The present work has demonstrated the evolution of the charge state of partially stripped C and O ions
near the surface. The frozen charge state of the channeled ions is established not by the ion–atom glancing
collisions, but predominantly by the quick freezing of the pre-equilibrium charge state at the surface. It is
notable that information obtained from the loss electron yield is essentially different from that obtained in
terms of the effective nuclear charge, which is usually an alternative to the screened Coulomb field around
- 43 -
the ion, and cannot be directly related to the charge state.
Evidently, the charge-state analysis using loss electrons is applicable when the electron loss process
plays a significant role in the evolution of the charge state in solids. For example, the present technique
might allow a different type of observations of the resonant coherent excitation, rather than by usual
transmission experiments [17], or by grazing scattering at a crystal surface [18].
References
[1] N. Stolterfoht, R. D. DuBois, R. D. Rivarola, Electron Emission in Heavy Ion–Atom Collisions
(Springer, Berlin, Heidelberg, 1997), Sect. 6.4.
[2] A. Koyama, O. Benka, Y. Sasa, H. Ishikawa, M. Uda, Phys. Rev. B 36 (1987) 4535.
[3] D. Hasselkamp, H. Rothard, K.-O. Groeneveld, J. Kemmler, P. Varga, H. Winter, Particle Induced
Electron Emission II (Springer, Berlin, Heidelberg, 1991).
[4] H. Kudo, Ion-Induced Electron Emission from Crystalline Solids (Springer Tracts in Modern Physics
Vol. 175, Springer, Berlin, Heidelberg, 2002).
[5] H. Kudo, T. Fukusho, T. Ishihara, H. Takeshita, Y. Aoki, S. Yamamoto, H. Naramoto, Phys. Rev. A
50 (1994) 4049.
[6] H. Kudo, A. Tanabe, T. Ishihara, S. Seki, Y. Aoki, S. Yamamoto, P. Goppelt-Langer, H. Takeshita,
H. Naramoto, Nucl. Instrum. Methods B 115 (1996) 125.
[7] M. E. Rudd, Y.–K. Kim, D. H. Madison, T. J. Gay, Rev. Mod. Phys. 64 (1992) 441.
[8] NIST Atomic Spectra Database, National Institute of Standards and Technology,
http://www.physics.nist.gov/cgi-bin/AtData/main asd.
[9] N. Stolterfoht, D. Schneider, D. Burch, H. Wieman, J. S. Risley, Phys. Rev. A 49 (1994) 5112.
[10] K. Shima, T. Mikumo, H. Tawara, At. Data Nucl. Data Tables 34 (1986) 357.
[11] A. Koyama, O. Benka, Y. Sasa, M. Uda, Nucl. Instr. and Meth. B 13 (1986) 637.
[12] A. Koyama, H. Ishikawa, Y. Sasa, O. Benka, M. Uda, Nucl. Instr. and Meth. B 33 (1988) 338.
[13] L. C. Feldman, J. W. Mayer, S. T. Picraux, Materials Analysis by Ion Channeling (Academic, New
York, 1982) Chap. 1.
[14] J. S. Williams, R. G. Elliman: Ion Beams for Material Analysis, ed. by J. R. Bird, J. S. Williams
(Academic Press, Sydney, 1989) Chap. 6.
[15] I. Stensgaard, L. C. Feldman, P. J. Silverman, Surf. Sci. 77 (1978) 513.
[16] M. P. Seah, W. A. Dench, Surf. Interface Anal. 1 (1979) 2.
[17] H. F. Krause, S. Datz, Adv. At. Mol. Opt. Phys. 37 (1996) 139.
[18] C. Auth, H. Winter, Phys. Rev. A 62 (2000) 012903.
- 44 -

3.4 Elastic recoil detection analysis of polyimide-based layers fabricatedon Si
S. Numazawa, H. Kudo, and S. Ishii
For fablication of thin polymer layers on substrates, it is of essential importance to investigate the
hydrogen and, in some cases, deuterium content as added marker atoms. Elastic recoil detection analysis
(ERDA) using a MeV ion beam might be one of the most suitable analysis techniques for the composional
studies of H and D [1, 2], if it can be applied under low beam damage on the polymer structure. The
feasibility of ERDA for polymer layers can reasonably be inferred from the recent compositional analyses
of polymer layers of micrometer thickness by Rutherford backscattering of MeV light ions [3, 4]. The
present work demonstrates ERDA determination of the relative numbers of H and D atoms contained in
the polyimide-based layers which are under development as low-k–dielectric as well as moisture-resisted
coating materials for use in microelectronics.
The samples were prepared by spin coating of polyimide (PI) and polyamic acid (PAA) on Si(100)
substrates. In the coating layers, H atoms are partly replaced by D atoms as a marker for the fablication
processes. The thicknesses of the polymer layers are ∼60 nm, estimated from the spin-coating conditions.
1.2 MeV He+ Sample
Particle detector
15°
25°
Stopper foil(4 µm mylar)
Recoiled H, D
Rotation axis of the sample holder(45° from the He+ beam axis)
Faraday cup
α−source (241Am)
50 mm
Fig. 1: Experimental setup for ERDA.
The experimental setup in the vacuum chamber is schematically illustrated in Fig. 1. The beam
of 1.2 MeV He+ from the Tandetron accelerator is incident on the sample at 15 relative to the sample
surface, and the recoiled H or D atoms are detected at a recoil angle of 25. The presssure in the chamber
was 1.5×10⁻⁵ Pa during the experiments. The samples were fixed on the surface of the conical sample
holder, whose conic axis, i.e., the rotation axis, is at 45 from the beam axis (Fig. 1). By rotating the
sample holder, ERDA for different samples can be carried out under the same geometrical conditions.
A mylar film of 4 µm thickness was used as a filter for the solid-state particle detector, so that it stops
the scatterd He ions, while it is transparent for the recoiled H and D because of the smaller stopping powers
than for the He ions by a factor of ∼0.2. The 241Am α source, which emits 5.48 MeV He2+, was used
for calibration of the particle detector. The energy resolution of the detector is ∼15 keV for 5.48 MeV
He2+. The beam spot on the target is a rectangular area of 1 mm×2 mm. The beam current during the
- 45 -

measurements was ∼1.3 nA, which was often monitored by the Faraday cup, shown in Fig. 1, by rotating
the sample holder to a position off from the beam path.
500 600 7000
30
60
90
Energy (keV)
Yie
ld(c
ount
s)
PI
PI+PAA
PI on PAA
300 400 500 600 7000
100
200
300
400
500
Fig. 2: Energy spectra of the recoiled H and D from the “PI”, “PI+PAA”, and “PI on PA” samples. Theinset shows the magnified yield at 500–730 keV.
The energy spectra of the recoiled H and D are shown in Fig. 2. The three spectra correspond to
(i) a 60 nm-thick PI layers (“PI”), (ii) a blended 60 nm-thick layer of PI and PAA (“PI+PAA”), and (iii)
a double layer of 48 nm thick PI on 12 nm thick PAA (“PI on PAA”). The stoichiometries of the layers
are C:N:O:H:D=52:6:13:16:13 for PI, C:N:O:H=47:4:13:36 for PAA, and C:N:O:H:D=47:5:13:33:2 for
PI+PAA. It should be noted that the dependence of the spectrum on the beam dose has been measured (for
an interval of ∼1013 He+/cm2) to investigate the influence of the radiation effects. However, the spectra
showed no discernible change within the present beam dose up to 2.4×10¹⁴ He+/cm2, which is required
to measure each of the spectra shown in Fig. 2.
The two peaks at 300–500 and 520–680 keV in the observed spectra, corresponding to H and D,
respectively, are clearly resolved under the present experimental conditions. For the three H peaks, the
full width at half maximum is effectively equal (∼100 keV width), corresponding to the layers of ∼60 nm
thickness on Si. Furthermore, the D peak for the “PI on PAA” sample is located on the higher energy
side than for the other samples, reflecting the distribution of D in the upper PI layer only. In contrast,
D is distributed throughout the blended layer (PI+PAA), indicating that PI and PAA are well mixed.
Obviously, the effective depth resolution of the order of 20 nm has been obtained in the present analysis.
The area under the peak is proportional to the number of H or D contained in the layer(s), and also to
the Rutherford recoil differential cross section dσ/dΩ with respect to the solid angle Ω. Accordingly, the
ratio of the number of D to H atoms contained in the layer RD/H is given by,
RD/H =SD(dσ/dΩ)H
SH(dσ/dΩ)D, (1)
where SH and SD are the areas under the peaks for H and D in Fig. 2, respectively. Since dσ/dΩ depends
on the the mass MH,D of the recoiled atom as (1+MH,D/MHe)2, where MHe = 4 is the mass of the projectile,
- 46 -

Table 1: ERDA results of the ratios of D to H contents, RD/H, for the fabricated layers of PI, PI+PAA,and PI on PA. The values of RD/H anticipated from the stoichiometries of PI and PAA are also shown inthe pharentheses.
Sample RD/H
PI 0.64±0.02 (0.81)PI+PAA 0.101±0.003 (0.061)PI on PAA 0.33±0.015 (– – –)
it follows that
RD/H = (25/9)(SD/SH) . (2)
It is also pointed out that from the mass dependence of dσ/dΩ, noted above, ERDA in the present case is
less sensitive to D than H by a factor of 9/25.
The analysis results using eq. (2) are summarized in Table 1, together with the content ratios of H
and D anticipated from the stoichiometries, noted earlier, for comparison. The uncertainty in the val-
ues of RD/H mainly stems from the separation of the slightly overlapped tails of the H and D peaks at
520–530 keV, seen in Fig. 2. Usually, ERDA requires careful check for the background H yield which
results mainly from the residual hydrocarbons and water in the vacuum. In the present case, background
H yields corresponding to typically 2–3% of the measured H in the polymer layers have been detected for
chemically cleaned Si. Such a background, however, causes only minor influence (within the uncertainty
shown in Table 1) on the present results. The present characterization has concluded that the values of
RD/H estimated from the stoichiometry are appreciably deviated from the values determined by ERDA.
ERDA thus allows structural studies of multi-layered polymers using D as a marker. Evidently, the direct
detection of H and D by ERDA is of essential advantage for controlled polymer-layer processing.
We thank Prof. Y. Tagishi for technical suggestions, and Prof. T. Inoue (Iwaki Meisei University) for
valuable comments on this work. We also thank The JSR Corporation for preparation of the samples.
References
[1] Ion Beams for Material Analysis, ed. by J. R. Bird, J. S. Williams (Academic Press, Sydney, 1989),
pp. 144-148.
[2] Handbook of Modern Ion Beam Materials Analysis, ed. by J. R. Tesmer, M. Nastasi (Materials
Research Society, Pittsburgh, 1995).
[3] T. E. Shearmur, D. W. Drew, A. S. Clough, M. G. D. van der Grinten, A. T. Slark, Polymer 37 2695
(1996).
[4] N. Sundararajan, C. F. Keimel, N. Bhargava, C. K. Ober, J. Opiz, R. D. Allen, G. Barclay, G. Xu, J.
Photopolym. Sci. Technol., [12) 457 (1999).
- 47 -

3.557
Fe Moessbauer study of α’ iron-nitride
T. Koyano, E. Kita, T. Ohba1
, H. Ohtsuka2
and H. Wada2
Magnetization of iron nitrides in bct structure, α’ [1] and α” [2] phases, has attracted much attention
after Kim and Takahashi reported “giant magnetization” of the α” phase [3]. Thin film technique such as
MBE and sputtering successfully produced single crystal or single phase samples of iron nitrides [4-7], but
substantial confusion still exists in value of magnetization for the α” phase. In order to shed a light into
this argument over 30 years, magnetization measurement for bulk samples is best suited, but no single
phase sample of α’ or α” is obtained yet. Therefore, it is necessary to estimate mass fraction of phases in
samples as precise as determination of gross magnetization.
The nitrogen atoms in Fe-N alloys occupy the octahedral interstitial sites in the same manner as carbon
atoms do in the Fe-C steel [1]. The austenite (γ) phase with fcc structure spontaneously undergoes the
fcc -> bct Martensitic transformation when it is quenched below the Ms temperature, and the α’ phase is
formed. Because nitrogen atoms in γ phase are randomly dispersed on the octahedral sites in the fcc
matrix with some interaction among solute atoms and the transformation proceeds without diffusion
process, nitrogen atoms are also irregularly distributed on corresponding sites in the α’ phase. Heat
treatment at 120 C orders interstitial nitrogen atoms and the α” phase is formed [2]. It can be said the α’
phase is precursor to the α” phase. The Martensitic transformation accompanies a large atomic volume
increase causing substantial internal stress in the matrix, which suppresses further development of the
structure change. This mechanism immediately tells us why the γ phase always remains in the sample as
far as high nitrogen γ phase is concerned, and single phase sample of α’ can not be obtained when one just
cooled the γ phase below its Ms temperature. Because a change in magnetization upon α” phase
formation can not be analyzed properly without having a correct value of magnetization for the α’ phase,
determination of γ phase amount is of vital importance to elucidate whether the giant magnetization exists
or not.
We have applied static external magnetic field up to 35 T on the γ phase at low temperatures to increase
the volume fraction of the α’ phase [8-10]. Magnetic field lowers the Gibbs’ free energy of
ferromagnetic α’ phase whereas no substantial change takes place for paramagnetic γ phase. Obviously,
this drastic change in free energy drives the transformation. With combining X-ray diffraction and
magnetic measurement data, we have proved 35 T of field at 4.2 K reduces residual austenite to less than a
quarter of the amount at zero magnetic field.
From point of view of 57
Fe Moessbauer spectroscopy, the γ and α’ phases are unambiguously
distinguishable. Spectrum for γ phase is a combination of a singlet and quadrupole doublets whereas the
α’ phase spectrum consists of sets of magnetic sextet. As well known in the theory for resonant
absorption of γ-ray, energy integral of an absorption line is proportional to the number of resonant
1 Department of Material Science, Shimane Univ., Matsue, Shimane, 690-8504 Japan.
2 National Institute for Materials Science, Sakura, Tsukuba, Ibaraki 305-0003 Japan.
- 48 -
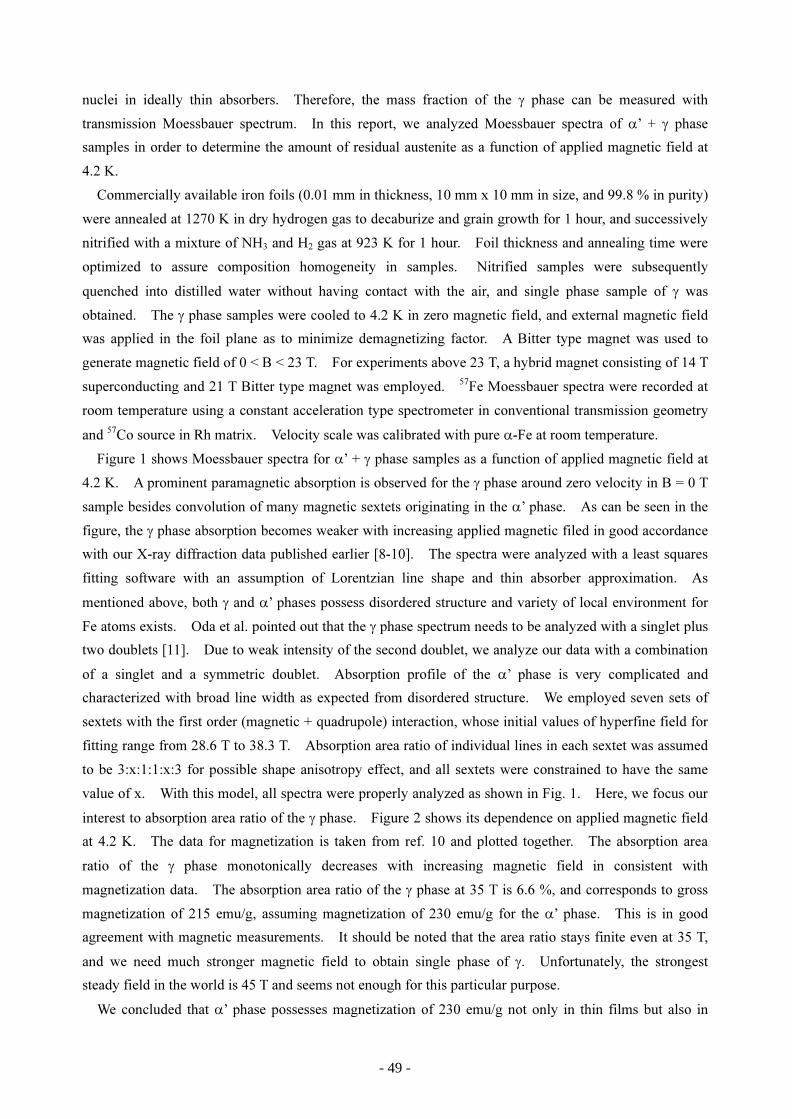
nuclei in ideally thin absorbers. Therefore, the mass fraction of the γ phase can be measured with
transmission Moessbauer spectrum. In this report, we analyzed Moessbauer spectra of α’ + γ phase
samples in order to determine the amount of residual austenite as a function of applied magnetic field at
4.2 K.
Commercially available iron foils (0.01 mm in thickness, 10 mm x 10 mm in size, and 99.8 % in purity)
were annealed at 1270 K in dry hydrogen gas to decaburize and grain growth for 1 hour, and successively
nitrified with a mixture of NH3 and H2 gas at 923 K for 1 hour. Foil thickness and annealing time were
optimized to assure composition homogeneity in samples. Nitrified samples were subsequently
quenched into distilled water without having contact with the air, and single phase sample of γ was
obtained. The γ phase samples were cooled to 4.2 K in zero magnetic field, and external magnetic field
was applied in the foil plane as to minimize demagnetizing factor. A Bitter type magnet was used to
generate magnetic field of 0 < B < 23 T. For experiments above 23 T, a hybrid magnet consisting of 14 T
superconducting and 21 T Bitter type magnet was employed. 57
Fe Moessbauer spectra were recorded at
room temperature using a constant acceleration type spectrometer in conventional transmission geometry
and57
Co source in Rh matrix. Velocity scale was calibrated with pure α-Fe at room temperature.
Figure 1 shows Moessbauer spectra for α’ + γ phase samples as a function of applied magnetic field at
4.2 K. A prominent paramagnetic absorption is observed for the γ phase around zero velocity in B = 0 T
sample besides convolution of many magnetic sextets originating in the α’ phase. As can be seen in the
figure, the γ phase absorption becomes weaker with increasing applied magnetic filed in good accordance
with our X-ray diffraction data published earlier [8-10]. The spectra were analyzed with a least squares
fitting software with an assumption of Lorentzian line shape and thin absorber approximation. As
mentioned above, both γ and α’ phases possess disordered structure and variety of local environment for
Fe atoms exists. Oda et al. pointed out that the γ phase spectrum needs to be analyzed with a singlet plus
two doublets [11]. Due to weak intensity of the second doublet, we analyze our data with a combination
of a singlet and a symmetric doublet. Absorption profile of the α’ phase is very complicated and
characterized with broad line width as expected from disordered structure. We employed seven sets of
sextets with the first order (magnetic + quadrupole) interaction, whose initial values of hyperfine field for
fitting range from 28.6 T to 38.3 T. Absorption area ratio of individual lines in each sextet was assumed
to be 3:x:1:1:x:3 for possible shape anisotropy effect, and all sextets were constrained to have the same
value of x. With this model, all spectra were properly analyzed as shown in Fig. 1. Here, we focus our
interest to absorption area ratio of the γ phase. Figure 2 shows its dependence on applied magnetic field
at 4.2 K. The data for magnetization is taken from ref. 10 and plotted together. The absorption area
ratio of the γ phase monotonically decreases with increasing magnetic field in consistent with
magnetization data. The absorption area ratio of the γ phase at 35 T is 6.6 %, and corresponds to gross
magnetization of 215 emu/g, assuming magnetization of 230 emu/g for the α’ phase. This is in good
agreement with magnetic measurements. It should be noted that the area ratio stays finite even at 35 T,
and we need much stronger magnetic field to obtain single phase of γ. Unfortunately, the strongest
steady field in the world is 45 T and seems not enough for this particular purpose.
We concluded that α’ phase possesses magnetization of 230 emu/g not only in thin films but also in
- 49 -
bulk sample. This means a new bulk material having larger magnetization than pure iron can be
synthesized from iron and nitrogen, provided if one find out a method to reduce the residual austenite
further.
References
[1] K. H. Jack, Proc. R. Soc. London, Ser. A 208, (1951) 200-215.
[2] K. H. Jack, Proc. R. Soc. London, Ser. A 208, (1951) 216-224.
[3] T.K.Kim and M.Takahashi: Appl. Phys. Lett., 20, (1972) 492-494.
[4] Y. Sugita, H. Takahashi, M. Komuro, K. Mitsuoka, and A. Sakuma, J. Appl. Phys., 76, (1994)
6637-6641.
[5] Y. Takahashi, H. Shoji, and M. Takahashi, J. Magn. Magn. Mater, 210, (2000) 333-340.
[6] S. Okamoto, O. Kitakami, Y. Shimada, J. Magn. Magn. Mater., 208, (2000) 102-114.
[7] K. Nakajima and S. Okamoto, Appl. Phys. Lett., 56, (1990) 92-94.
[8 ] T. Koyano, H. Ikeda, R. Yoshizaki, and A. Tasaki, J. Magn. Soc. Jpn., 22, (1998) 1069-1073.
[9] T. Koyano, H. Ikeda, R. Yoshizaki, K. Uehara, A. Tasaki, H. Ohtsuka, T. Takamasu, H. Wada, G. Kido,
and T. Ohba, Mater. Trans., JIM., 41, (2000) 923-927.
[10] T. Koyano, T.Nomiyama, H. Ikeda, N.Kanoh, T.Ohba, H. Ohtsuka, and H. Wada, Mater. Res. Soc. Jpn
(2003) in press.
[11] K. Oda, K. Umezu, and H. Ino, J. Phys. Condens. Matter., 2, (1990) 10147.
- 50 -
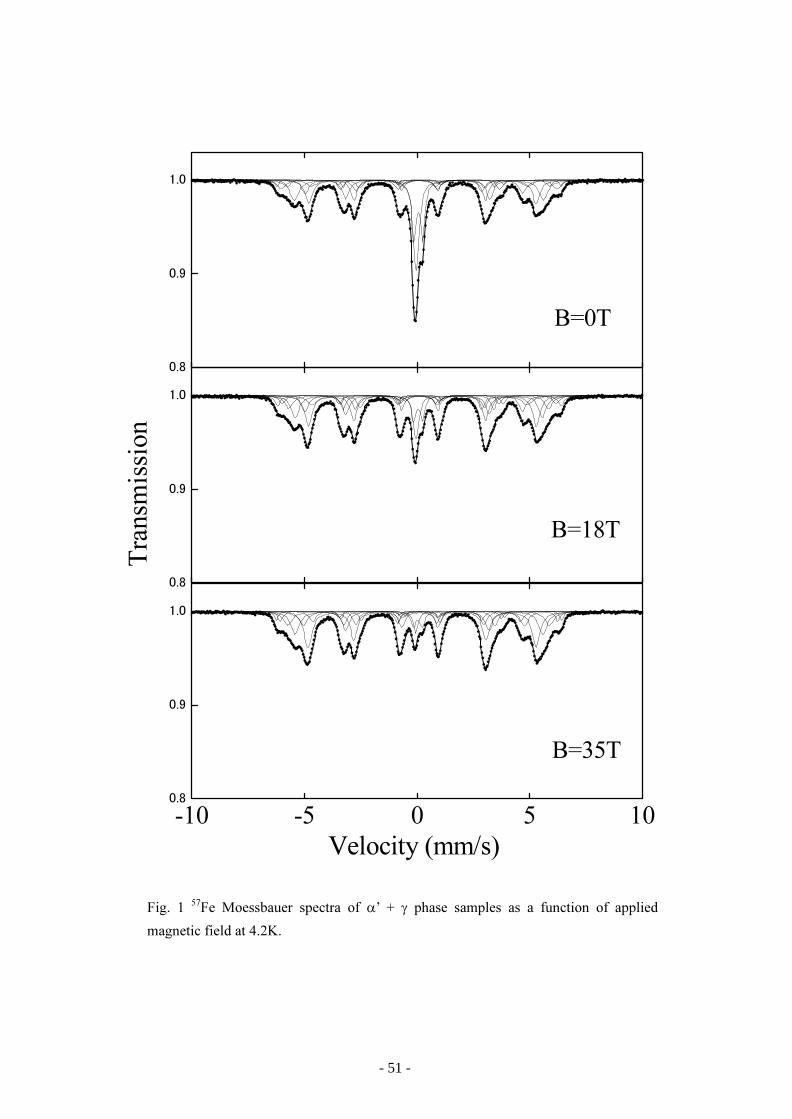
-10 -5 0 5 10
B=0T
B=35T
Transmission
B=18T
Velocity (mm/s)
Fig. 1 57
Fe Moessbauer spectra of α’ + γ phase samples as a function of applied
magnetic field at 4.2K.
- 51 -

0 10 20 30 40
0
5
10
15
20
25
30
35
0
50
100
150
200
250
Magnetization (em
u/g)
Absorption area ratio of the γ phase (%
)
Applied magnetic field at 4.2K (T)
Fig. 2 Absorption area ratio of the γ phase (solid line) and magnetization (dashed line)
plotted against applied magnetic field at 4.2K. Magnetization data are taken from ref. 10.
- 52 -
3.6 Characteristic mechanical properties of high-density nanocrystalline
FCC metals
H. Tanimoto, T. Yamada, N. Yagi, H. Mizubayashi,
1. Introduction
Whereas an increased volume fraction of the grain boundaries (GBs) may modify the properties
of nanocrystalline (n-) materials, the present knowledge on the GB regions is very limited. Recent
mechanical studies on high-density n-metals reveal that the Young’s modulus of n-metals is not much
lower than that of the conventional polycrystalline (poly-) metals [1-3]. For example, the Young’s
modulus of the high-density n-Au at 10 K is almost the same to the value of poly-Au after taking into
account the crystalline texture [3]. In contrast, it is found that the anelastic strains revealed for the
strain, ε, range above 10-4
in the prolonged time scale of the order of 104
sec, start to strongly increase
above 200 K, where the slow anelastic process in the GB regions is excited [4]. On the other hand,
the increase in the anelastic strain above 200 K is also found in the dynamic measurements at 102
Hz,
where the fast anelastic process in the GB regions is excited. The magnitude of the fast anelastic
process is much lower than that of the slow anelastic process. We surmise that the fast anelastic
process is associated with the simple underlying anelastic processes in the GB regions. In the present
work, we pursued the fast anelastic process by means of the vibrating reed method at about 200 Hz.
That is, we measured the strain amplitude dependence (SAMD) of the resonant frequency, f, and the
internal friction, Q-1
, and effects of the low temperature irradiation of 2 MeV electrons or 20 MeV
protons on them.
2. Experimental Procedure
High-density n-Au ribbons 0.02 ~ 0.1 mm thick, 1 mm wide and 23 mm long were prepared by the
gas-deposition (GD) method [3]. The density was measured by the Archimedes’ method using high-
purity ethanol, indicating that the relative density to the theoretical value (ρ/ρ0) is more than 99 %.
The mean grain size, d, estimated from the peak broadening of the X-ray diffraction was about 20 ~ 30
nm. No contamination were detected from the electron probe microanalysis and the thermal gas-
desorption measurement in vacuum.
The electrostatically excited flexural vibration at about 300 Hz was used for the strain range below
10-4
. The electromagnetically excited vibration of the “U”-shape composite reed at about 100 Hz was
used for the strain range between 10-4
and 5x10⁻³
[5]. The temperature dependence of f and Q-1
was
measured by the electrostatic method with ε of 10-6
, where the low temperature irradiation was made
to get an insight into the grain boundaries through a probable modification by irradiation. The 2MeV
electron irradiation at temperature, T, below 15 K was carried out by using the 3MeV single-ended
electrostatic accelerator of TIARA, JAERI. The 20MeV proton irradiation at T < 5 K was carried out
by using the tandem accelerator of University of Tsukuba.
3. Results and Discussion
- 53 -

Figure 1 shows an example of the SAMD observed for the n-Au specimens in the as-prepared state
at various temperatures. The outline of the SAMD is as follows : For ε < 10-4
, f observed at 90 K
shows a monotonous decrease by about 1 % with increasing ε, and f at 303 K shows a decrease for ε
below 4x10⁻⁵
and then saturation for ε above 4x10⁻⁵
(Fig. 1(a)). Q-1
shows a monotonous increase
with increasing ε for all the temperatures (Fig. 1(b)). The SAMD of f and Q-1
observed at 258 K is
intermediate between those at 90 and 303 K. In Fig. 1(c) for ε > 10-4
, f at 293 K remains almost
constant for ε < 3x10⁻⁴
, and then increases by about 1 % showing saturation with increasing ε to 8 x10-
4
. On the other hand, f at 90 K remains almost constant for the present strain range. The SAMD of f
observed at 223 K is intermediate between those found at 90 K and 293 K. For the strain range
shown in Fig. 1(d), Q-1
shows a monotonous increase as like as Q-1
shown in Fig. 1(b).
The SAMD of f seen in Fig. 1 is so different from that of conventional poly-Au specimens. No
plastic deformations are detected for the n-Au specimens after the SAMD measurements for ε up to
2x10⁻³
at 300 K, although the microyielding takes place for ε below 10-5
for conventional
polycrystalline Au specimens [6]. After the low-temperature irradiation, the Q-1
spectrum was
remained unchanged, in contrast, f showed a large monotonous increase which showed a recovery by
warm-up after the irradiation [7]. These changes in f by irradiation and warm-up suggest the
accumulation of irradiation-induced defects and the annealing out, respectively. From the combination
of the observed results for the SAMD in f and the low temperature irradiation experiments, we surmise
that the characteristic SAMD of f found for the n-Au specimens is associated with a certain anelastic
process other than dislocation motions, where the GB regions may play some role [8]. It is noted that
the SAMD of f reported for amorphous alloys is qualitatively similar to that observed for the n-Au
specimens shown in Fig. 1, and is explained by the cooperative motion of many atoms [5]. For the
atomic diffusion in the GB regions, the cooperative motion of three or four atoms are suggested after
the computer simulations [9,10], indicating that one part of the GB regions may be soft mechanically.
Possible explanation for the characteristic SAMD of f found for the n-Au specimens is a cooperative
motion of a crystallite which is surrounded by the GB regions being mechanically soft in a relative
sense. However, quantitatively, the SAMD of f for the n-Au specimens is much smaller than that
found in amorphous alloy, suggesting that the fractional volume of such soft GB regions should be
very low.
Figure 2 shows a relative change in the Young’s modulus as a function of f, where f was adjusted
by changing the reed length and the Young’s modulus found at the lowest f is taken as the reference.
Whereas the experimental accuracy is not enough, the general tendency of increase in the Young’s
modulus can be seen at 293 K, and the Young’s modulus remains almost constant at 100 K. It is
suggested that the anelastic strain at 293 K is as large as the dynamic modulus change detected by
increasing f for the present frequency range, and the anelastic strain is much smaller at 100 K than at
293 K. On the other hand, a large decrease in the dynamic modulus is reported for the amorphous
alloys [5] and it is attributed to the excitation of the cooperative motion of many atoms in resonance.
As already mentioned, the behavior of the cooperative motion in n-Au metals may be quantitatively
- 54 -

different from that in the amorphous alloys. As well as the similar measurements for high-density n-
Cu, the further study is now in progress.
References
[1] P. G. Sanders, J. A. Eastman and J. R. Weertman, Acta Mater., 45(1997)4019.
[2] X. Y. Qin, X. R. Zhang, G. S. Cheng and L. D. Zhang, Nanostruct. Mater., 4(1998)661.
[3] S. Sakai, H. Tanimoto and H. Mizubayashi, Acta Mater. 47(1999)211.
[4] S.Sakai, H.Tanimoto, K.Otsuka, T.Yamada, Y.Koda, E.Kita and H.Mizubayashi, Scripta Mater.,
45(2001)1313.
[5] H. Mizubayashi, T. Okamoto, K. Koyama and M. Horiuchi, Acta Mater., 46(1998)1257.
[6] G. Fantozzi, C. Esnoug, W. Benoit and C. Bonjour, Proc. 4th
Inter. Conf. on the Strength of Metals
and Alloys, (Nancy, France, 1976), p.351.
[7] H. Tanimoto, H. Mizubayashi, H. Fujita and S. Okuda, J. de Phys., 6(1996)C8-199.
[8] H. Tanimoto, S. Sakai and H. Mizubayashi, Mater. Trans., 44(2003)94 : Mat. Sci. Eng. A, in press.
[9] M.R. Sørensen, Y. Mishin and A.F. Voter, Phys. Rev. B, 62(2000)3658.
[10] P. Keblinski, D. Wolf, S. R. Phillpot and H. Gleiter, Phil. Mag. A, 79(1999)2735.
Figure 1. Strain amplitude dependence of the
resonant frequency, f, and the internal friction,
Q-1
, observed for the n-Au specimens, where (a)
and (b) are measured by the electrostatic
method, and (c) and (d) by the electromagentic
th d
Figure 2. Dynamic Young’s modulus, E, as
a function of the measurement frequency
observed for n-Au with ε = ~ 10-6
at (a) 100
K and (b) 293 K, where E0 is E observed at
the lowest frequency. d is the mean grain
size estimated from the X-ray diffraction.
320
330
340
f / H
z
(a)
0 0.2 0.4 0.6 0.8 1
0
1
2
3
Q-1
/ 1
0
-2
: 90 K
: 258 K
: 303 K (b)
105
110
115
f / H
z
: 90 K
: 223 K
: 293 K
(c)
10 20
0
1
2
3
Strain Amplitude / 10-4
Q-1
/ 1
0
-2
(d)
10
1
10
2
10
3
10
4
0.95
1.00
1.05
1.10
E/E0
100 K
: 28 nm
: 35 nm
: 32 nm
: 28 nm
0.95
1.00
1.05
1.10
E/E0
f / Hz
293 K
: d = 28nm
- 55 -
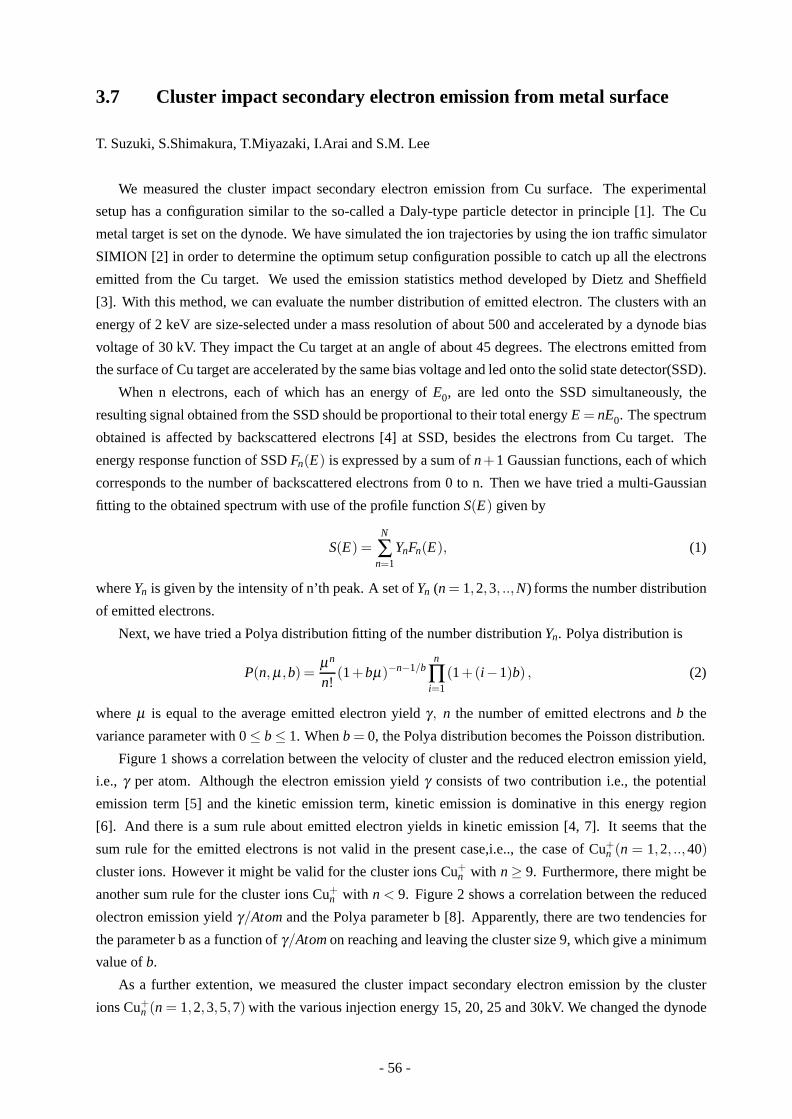
3.7 Cluster impact secondary electron emission from metal surface
T. Suzuki, S.Shimakura, T.Miyazaki, I.Arai and S.M. Lee
We measured the cluster impact secondary electron emission from Cu surface. The experimental
setup has a configuration similar to the so-called a Daly-type particle detector in principle [1]. The Cu
metal target is set on the dynode. We have simulated the ion trajectories by using the ion traffic simulator
SIMION [2] in order to determine the optimum setup configuration possible to catch up all the electrons
emitted from the Cu target. We used the emission statistics method developed by Dietz and Sheffield
[3]. With this method, we can evaluate the number distribution of emitted electron. The clusters with an
energy of 2 keV are size-selected under a mass resolution of about 500 and accelerated by a dynode bias
voltage of 30 kV. They impact the Cu target at an angle of about 45 degrees. The electrons emitted from
the surface of Cu target are accelerated by the same bias voltage and led onto the solid state detector(SSD).
When n electrons, each of which has an energy of E0, are led onto the SSD simultaneously, the
resulting signal obtained from the SSD should be proportional to their total energy E = nE0. The spectrum
obtained is affected by backscattered electrons [4] at SSD, besides the electrons from Cu target. The
energy response function of SSD Fn(E) is expressed by a sum of n+1 Gaussian functions, each of which
corresponds to the number of backscattered electrons from 0 to n. Then we have tried a multi-Gaussian
fitting to the obtained spectrum with use of the profile function S(E) given by
S(E) =N
∑n=1
YnFn(E), (1)
where Yn is given by the intensity of n’th peak. A set of Yn (n = 1,2,3, ..,N) forms the number distribution
of emitted electrons.
Next, we have tried a Polya distribution fitting of the number distribution Yn. Polya distribution is
P(n, µ ,b) =µn
n!(1+bµ)−n−1/b
n
∏i=1
(1+(i−1)b) , (2)
where µ is equal to the average emitted electron yield γ , n the number of emitted electrons and b the
variance parameter with 0 ≤ b ≤ 1. When b = 0, the Polya distribution becomes the Poisson distribution.
Figure 1 shows a correlation between the velocity of cluster and the reduced electron emission yield,
i.e., γ per atom. Although the electron emission yield γ consists of two contribution i.e., the potential
emission term [5] and the kinetic emission term, kinetic emission is dominative in this energy region
[6]. And there is a sum rule about emitted electron yields in kinetic emission [4, 7]. It seems that the
sum rule for the emitted electrons is not valid in the present case,i.e.., the case of Cu+n (n = 1,2, ..,40)
cluster ions. However it might be valid for the cluster ions Cu+n with n ≥ 9. Furthermore, there might be
another sum rule for the cluster ions Cu+n with n < 9. Figure 2 shows a correlation between the reduced
olectron emission yield γ/Atom and the Polya parameter b [8]. Apparently, there are two tendencies for
the parameter b as a function of γ/Atom on reaching and leaving the cluster size 9, which give a minimum
value of b.
As a further extention, we measured the cluster impact secondary electron emission by the cluster
ions Cu+n (n = 1,2,3,5,7) with the various injection energy 15, 20, 25 and 30kV. We changed the dynode
- 56 -

bias voltage to obtain the required injection energies. The optimum setup configuration to catch up all the
secondary electrons was determined by a SIMION simulation for such energy change. We show the result
of measutrement in Figure 3 and 4. In Figure 3, it seems that the sum rule for the emitted electrons is
valid. There is no remarkable energy dependence. In Figure 4, the parameter b shows an increasing trend
with an increase of γ/Atom.
Velocity v [m/sec]
x1040
0.5
1
1.5
2
2.5
3
3.5
4
4.5
5
0 5 10 15 20 25 30 35
Cu9+
Re
du
ced
Yie
ldγ/
Ato
m
Fig. 1. Correlation between the reduced emittedelectrons yield γ/Atom and the velocityof cluster ion; the solid line is a result ofleast square fitting.
Par
amet
erb
0
0.05
0.1
0.15
0.2
0.25
0.3
0 1 2 3 4 5
Reduced Yield
Cu9+
γ/Atom
Fig. 2. Correlation between the reduced emit-ted electrons yield γ/Atom and the Polyaparameter b.
00.5
11.5
22.5
33.5
44.5
5
5 10 15 20 25 30Velocity v [m/sec]
x104
Reduce
d Y
ield
γ/A
tom
CuCuCuCuCu
1
2 3 5 7
Fig. 3. The same as Fig.1. The solid line is a re-sult of least square fitting. Each symbolmeans a cluster size.
00.050.1
0.150.2
0.250.3
0.350.4
0.450.5
0.5 1 1.5 2 2.5 3 3.5 4
CuCuCuCuCu
Reduced Yield γ/Atom
Par
amet
erb
1
2 3 5 7
Fig. 4. The same as Fig.2. Each symbol meansa cluster size.
References
[1] N.R.Daly, Rev. Sci. Instr., 31, (1960)264.
[2] SIMION3D, Idaho National Engineering Laboratory Chemical Materials & Processes DepartmentLockheed Idaho Technologies Company.
[3] L.A.Dietz and L.C.Sheffield, Rev. Sci. Instr., 44, (1973)183.
[4] G.Lakits, F.Aumayr and H.Winter, Rev. Sci. Instr., 60, (1989)3151.
[5] L.M.Kishinevskii, Rad. Effects, 19, (1973)23.
[6] F.Thum, W.O.Hofer, Suf. Sci., 90, (1979)331.
[7] Hasselkanp et.al., Particles Induced Electron Emission II, Springer-Verlag, Berlin(1992).
[8] A.Itoh et al., Nucl. Instr. Meth. in Phys. Res., B193, (2002)626.
- 57 -

3.8 TOF mass spectrometer for the experiment with highly-charged ionbeam
Y. Takanashi, H. Sasaki and M. Imanaka, H. Arai, I. Arai and S.M. Lee
We have developed a TOF mass spectrometer system to measure the mass to charge ratio of the prod-
ucts generated by collision between a highly charged ion (HCI) and a neutral molecule or cluster. In this
report, we introduce this system and preliminary spectra of collision products observed with fullerene C60
target irradiated by laser and HCI.
A schematic view of the system is illustrated in Fig.1. The HCI beam is provided from an electron
cyclotron resonance ion source[1] and separated according to mass to charge ratio by the 90 degree an-
alyzer magnet. We used a Xe20+ beam extracted by a voltage of 15 kV the current of which was 1 mA.
The charge selected beam is chopped into a pulsed beam with a time duration of 200 ns long by a pulsing
electric field generated by the deflecting electrode. To make a pulsed high voltage swing from 0 V to 2.8
kV on the electrode, we use a high speed push-pull switch (Bhelke Electronic, HTS31-GSM). The pulsed
ion beam passes through the diaphragm of 1 mm in diameter and intersects the target chamber. The base
pressure of target chamber is 10−8 torr. In the experiment, we fill the target chamber with the fullerene va-
por at a typical pressure of 7.0×10⁻⁸ torr by heating fullerene powder up to 673K. The extraction region
consists of the ionization region and the acceleration region. After a HCI beam has passed the ionization
region, the extraction field can be pulsed with a high speed push-pull switch and the ions of collision
products enter the acceleration region. In the acceleration region, there are applied two electric fields with
different gradients from each other. The two stage extraction can focus the flight time of the ion which was
produced with the same m/q but at a different position in the ionization region. An acceleration voltage of
2700 V is applied in a region of 5 cm in length giving a field gradient of 107 V/cm for the first acceleration
region, while the same voltage is applied in a region of 4 cm giving a field gradient of 525 V/cm for the
second acceleration. The intermediate electrodes (1 cm apart from each other) in the acceleration region
ensure a good homogeneity of electric field necessary for a high mass resolution. The path of the ions is
corrected by the electrostatic steerer and focused by the Einzel lens. The ions fly in a field free region
of 2 m and finally go into the detector. We used a micro channel plate detector with a cup-type electron
conversion dynode. We measured TOF spectra by using a trigger signal of the extraction pulse switch as
a start signal and an output signal of the detector as a stop signal, both of which were lead to a 2 GHz
multi-stop time to digital converter (P7886E, FAST ComTec).
Fig.2 shows the result obtained in collision with highly charged Xe20+ ions. There are the clearly
identified peaks of the fullerene ions C+60, C2+
60 , ... , C6+60 in addition to those of the residual gas ions.
The mass resolution estimated from the peak of C+60 is about 200. Espetially, the ion Cq+
60with q upto 6
is observed dominantly while its fragment such as Cq+58
amounts to little there. This result is very much
different from the case of C60 bombarded with a much more highly charged ion such as Au69+[2]. In the
present case, it seems that C60 has been ionized gently without receiving so much internal energy on its
way crossing Xe20+. The situation is similar to the collisional ionization of sodium clusters with use of
highly charged ions[3], the collisional ionization of C60 with use of highly charged high-energy Xe ions[4]
or the femtosecond laser driven ionization[5][6].
- 58 -

Now, we are planning to measure abundance spectra of cluster ions from the metal surface bombarded
with slow highly charged ions, and to discuss in details about the mechanism of cluster formation domi-
nated there in comparison with the one in neutral Xe atom bombardment[7][8].
90˚ magnet
from ECRIS
steerer
steerer
diaphragm(φ3)
variablediaphragm
einzel lens
einzel lens
lens
extract electrode
CaF2 window
mirrorYAG laser
e-converter
ToF spectrometer
0 500 1000 mm
MCP
Fig. 1. Top view of beam line and TOF system.
Fig. 2. Mass/Charge distribution of collision products observed with C60 target irradiated by Xe20+.
References
[1] T. Kurita, Doctor thesis, University of Tsukuba(2001).
[2] T. Schenkel, et al, Eur. Phys. J., D1, 297 (1998).
[3] F. Chandezon et al., Phys. Rev. Lett., bf 87, 153402-1-4(2001).
[4] S. Cheng, et al, Phys. Rev., bf A54, 3182 (1996).
[5] E.E.B. Campbell et al., Eur. Phys. J., bf D16, 345(2001).
[6] P.G. Reinhard and E. Suraud, Int. J. Mol. Sci.,bf 1, 92(200).
- 59 -

[7] T. Sekioka, et al, Nuc. Inst. Meth. Phys. Res. bf B182, 121(2001)
[8] T. Schenkel et al., Prog. Sur. Sci., bf 61, 23(1999).
- 60 -

3.9 Cluster abundance spectra of In, Ga, Bi and Sn cluster produced
by sputtering with Xe atoms
S.Hamajima, K.Teranishi, I.Arai, and S.M.Lee
We have produced 3-d transition metal cluster by bombardment of 6keV Xe atoms in a previous
experiment, and observed its abundance spectra. The abundance spectra of clusters obtained were well
expressed by a power function. We successfully apply the scaling hypothesis with a critical exponent –2.0
to such observed power function. To understand deeply, we carried out calculations based on percolation
theory [1][2]. Suppose that the metal surface consists of mutually bond connected atoms and formation of
a cluster takes place when all the bonds surrounding it are broken, the resulting cluster abundance spectra
was represented well by employing a suitable value of the only parameter P, i.e., the broken bond
probability. Furthermore, we have observed strongly correlation between P and melting temperature of
metal. To explain the correlation, let us suppose the thermal diffusion model. In this model we assume the
sputtering process like this. When the atoms bombard the target metal, thermal diffusion happens along
the surface. The associated formation of thermally isolated small area, the equilibrium temperature being
kept much higher than the melting temperature at around the bombardment position, and cluster formation
within the thermally isolated area as a result of bond breaking.
In the present experiment we have investigated cluster abundance spectra for low melting temperature
metals, In, Ga, Sn, and Bi,. The experiments were performed with a FAB ion source in conjunction with
high resolution double focusing mass analyzer (JEOL JMS-HX110). Cluster cations sputtered from the
surface of target materials under bombardment with 6keV Xe neutral atoms.
The spectra obtained show a quite different nature compared with the previously observed spectra for the
3d transition metals. As a result, we have identified two new types of spectra. One is a combination of an
exponential function and a power function in the case of In and Ga and the other a combination of an
exponential function and a log-normal function in the case of Sn and Bi. The exponential function-like
behavior suggests the occurrence of an explosive release of monomer atoms just after the bombardment
followed by a cluster formation via monomer absorption. A power function-like behavior may be
interpreted as a cluster formation via bond-breaking on the remnant surface, while the log-normal
function-like behavior is rather common to a cluster formation via cluster coalescense under the course of
aggregation process in high density gaseous environment, which is unlikely to occur in the present case,
i.e., a singly driven short time phenomenon. However, if it is the case an occurrence of an explosive
release of monomer atoms with highly density core is strongly suggested.
In order to confirm this interpretation further, we have observed the change of abundance spectrum for
In under changing the target temperature and the projectile energy. Figure 1 shows the abundance spectra
measured for various target temperature. In the figure, the dependence on the target temperature is not
observed at all. This effect is interpreted in the following way. At first, as for the explosive release of
monomer atoms, the energies of participant atoms are too high to be affected by tiny thermal energies
obtained at the initial target temperature. Secondly, as for the cluster formation via bond-breaking, the
- 61 -
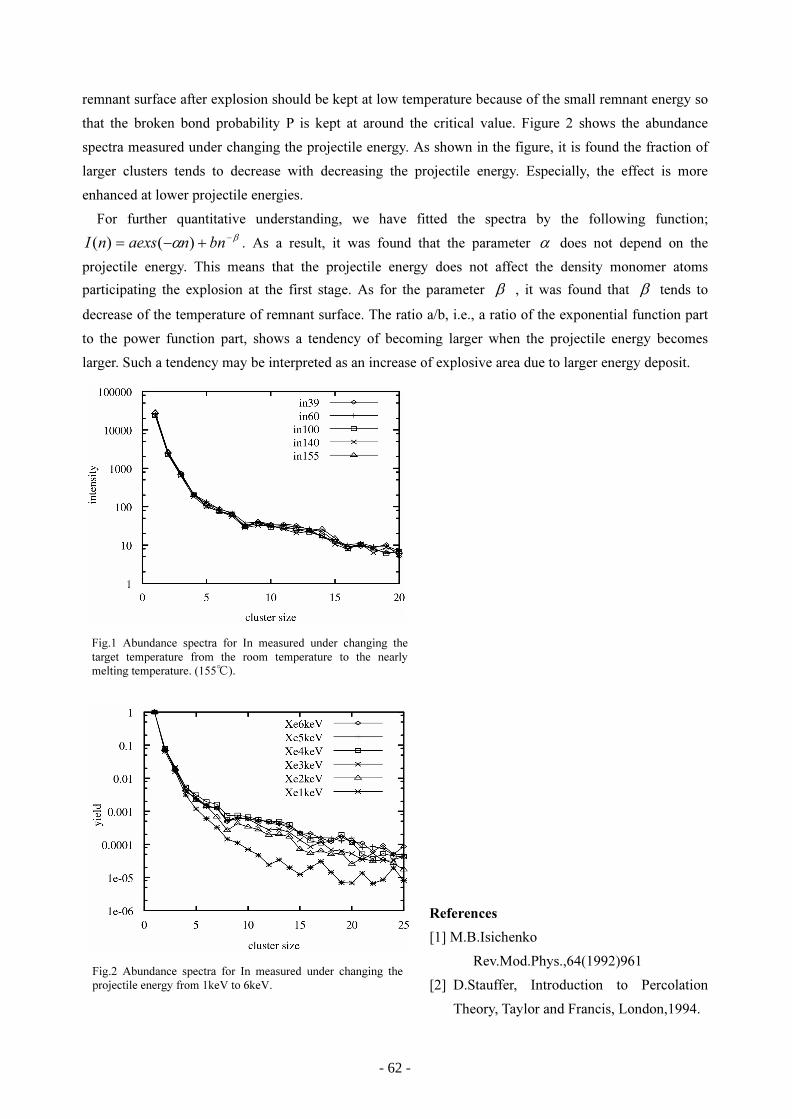
remnant surface after explosion should be kept at low temperature because of the small remnant energy so
that the broken bond probability P is kept at around the critical value. Figure 2 shows the abundance
spectra measured under changing the projectile energy. As shown in the figure, it is found the fraction of
larger clusters tends to decrease with decreasing the projectile energy. Especially, the effect is more
enhanced at lower projectile energies.
For further quantitative understanding, we have fitted the spectra by the following function;
β
α
−
+−= bnnaexsnI )()( . As a result, it was found that the parameter α does not depend on the
projectile energy. This means that the projectile energy does not affect the density monomer atoms
participating the explosion at the first stage. As for the parameter β , it was found that β tends to
decrease of the temperature of remnant surface. The ratio a/b, i.e., a ratio of the exponential function part
to the power function part, shows a tendency of becoming larger when the projectile energy becomes
larger. Such a tendency may be interpreted as an increase of explosive area due to larger energy deposit.
References
[1] M.B.Isichenko
Rev.Mod.Phys.,64(1992)961
[2] D.Stauffer, Introduction to Percolation
Theory, Taylor and Francis, London,1994.
Fig.1 Abundance spectra for In measured under changing the
target temperature from the room temperature to the nearly
melting temperature. (155).
Fig.2 Abundance spectra for In measured under changing the
projectile energy from 1keV to 6keV.
- 62 -
3.10 Plasma diagnostics of the plasma of liquid-He-free superconductingECR ion source with use of a laser ablation method
H.Arai, M.Imanaka, M.Tsukada, T.Nakagawa1, I.Arai and S.M.Lee
Short pulses of the neutral particles generated by laser ablation are injected into the plasma. The
injected neutral metal atoms are ionized sequentially by the electron impact. Using the laser ablation
method, we can measure the creation and subsequent decay of the individual charge state ions in plasma
by observing their time dependent loss from ECRIS. Although these measurements are actually carried out
in sequential step, they constitute the direct measurement of confinement and ionization time for highly
charged ions in plasma of ECRIS. This tecgnique has been applied to the plasma diagnostics of several
ECRISs with very promising insight into the plasma parameters. In the present study, the laser ablation of
metal sample has been made.
The experimental setup for laser ablation method is shown in Fig.1. The laser beam is generated by
an Nd:yttrium-aluminum-garnet (YAG) laser system with a wavelength of 1.06µm. The target sample of
aluminum is placed on the biased electrode of SHIVA. The laser beam is focused by a lens of 3000mm
focal length, and irradiate the aluminum target across the plasma.
The ejected pulsed neutral atoms were introduced into the ECR plasma and trapped in it.The neutral
atoms were ionized by electron impact, and increased their charges step by step. The produced multi-
ply charged ions were extracted by potential difference between the plasma electrode and the extraction
electrode. These ions were separated and identified by the analyzing magnet. The beam intensity of each
charge state heavy ions was measured by the Faraday cup, and we observed time structures of the beam
intensity with use of digital storage oscilloscope.
To determine the plasma parameters as a function of Bmin, we performed the measurements at Bmin of
0.24T, 0.3T, 0.4T, and 0.45T, where Binj and Bext were fixed at 1.85T and 1.18T, respectively. Fig.2 shows
a typical time structure of alminum ion current.
For analyzing the time structure of aluminum ion current, it is necessary to solve the rate equation[1]
as follows:
dn0
dt= −neχ ion
0→1n0 +ngasξ ex1→0n1 −
n0
τ0...dni
dt= +neχ ion
i−1→ini−1−neχ ioni→i+1ni −ngasξ ex
i→i−1ni +ngasξ exi+1→ini+1−
ni
τi
We carried out numerical calculations to solve the rate equation, taking the electron density ne, the
electron temperature Te and the ion confinement time τc as free parameters. Fig.3 shows an example of
calculated results for the time structure of aluminum ion current.
Fig 4. shows the resulting plasma parameters ne, Te and τc as a function of Bmin. Binj and Bext were
fixed to 1.85T and 1.18T. The electron density ne gradually increases with increasing Bmin up to 0.4T
and then decreases at Bmin greater than 0.4T. While the electron temperature Te increases slowly with1The Institute of Physical and Chemical Reserch (RIKEN)
- 63 -
increasing Bmin, the ion confinement time τc decreases slowly with increasing Bmin.
References
[1] Grigori D.Shirkov and Gonter Zschornack, Electron Impact Ion Sources For Charged Heavy Ions,
page 134. Vieweg & Sohn Verlagsgesellschaft mbH,1996
- 64 -
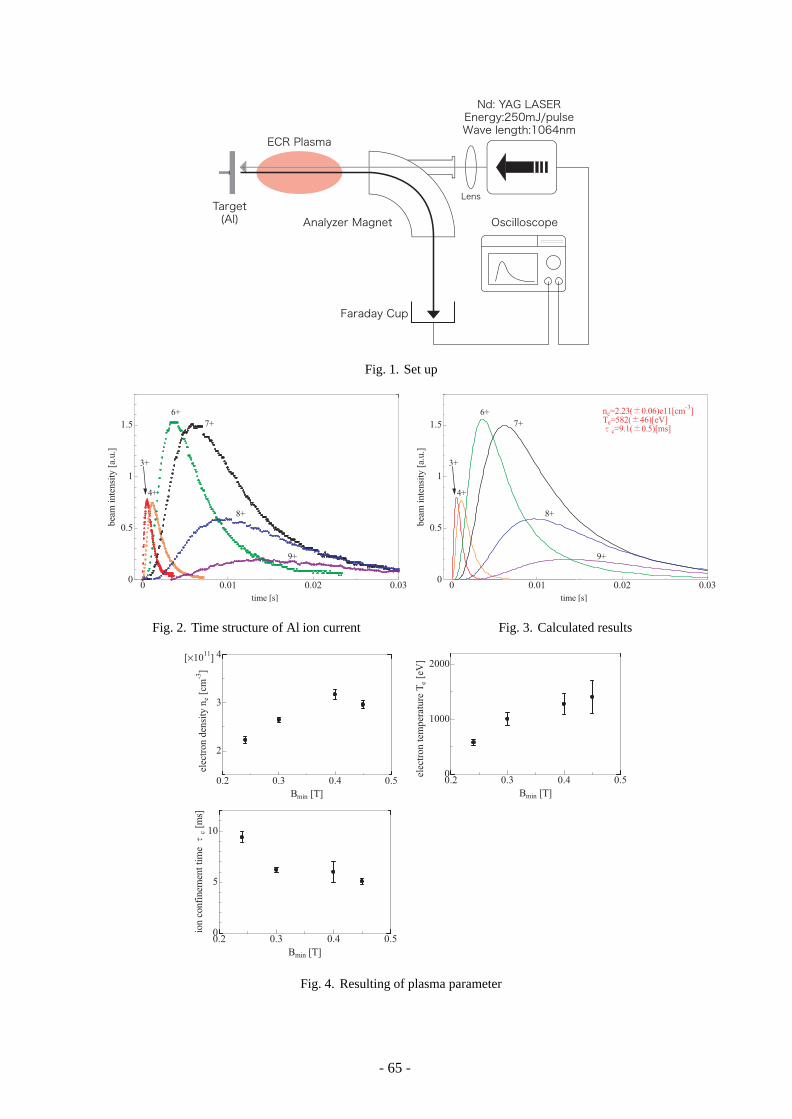
Nd: YAG LASEREnergy:250mJ/pulseWave length:1064nm
Lens
ECR Plasma
Target(Al) Analyzer Magnet
Faraday Cup
Oscilloscope
Fig. 1. Set up
0 0.01 0.02 0.030
0.5
1
1.5
bea
m i
nte
nsi
ty [
a.u.]
6+
7+
8+
9+
3+
4+
time [s]
Fig. 2. Time structure of Al ion current
0 0.01 0.02 0.030
0.5
1
1.5bea
m i
nte
nsi
ty [
a.u.]
ne=2.23( 0.06)e11[cm-3
]Te=582( 46)[eV]
c=9.1( 0.5)[ms]
time [s]
6+
7+
8+
9+
3+
4+
Fig. 3. Calculated results
0.2 0.3 0.4 0.5
2
3
4[×1011
]
elec
tron d
ensi
ty n
e [c
m-3
]
Bmin [T]
0.2 0.3 0.4 0.50
5
10
ion c
onfi
nem
ent
tim
e c
[ms]
Bmin [T]
0.2 0.3 0.4 0.50
1000
2000
elec
tron t
emper
ature
Te
[eV
]
Bmin [T]
Fig. 4. Resulting of plasma parameter
- 65 -
3.11 The science of 3d transition-metal oxide system
M. Onoda, J. Hasegawa, K. Sekine, T. Ikeda, T. Ohki, T. Harigae, S. Miyasaka and T. Mutoh
We have explored structural and electronic properties of 3d transition-metal oxides and bronzes by
means of x-ray four-circle diffraction and through measurements of magnetic resonance (NMR and EPR),
magnetization, and electronic transport, in order to extract characteristic properties in the correlated elec-
tron system, electron-phonon-coupling system, quantum spin-fluctuation system, and novel materials. At
the Tandem Accelerator Center, Varian continuous-wave and Bruker pulse NMR spectrometers have been
used.In 2002–2003, the following investigations were performed and a part of them have been published
elsewhere [1–5]:
• Correlated-electron and electron-phonon-coupling systems
– Metal-insulator transitions in V6O13 and CuxV4O11
– Metallic properties for Sr1−xMxVO3 (M = Na, K, Tl and vacancy), SrV2O4 and SrmVnOm+n
• Quantum spin-fluctuation system
– Geometrical frustrations in CdxZn1−xV2O4 and LiV2−xMxO4 (M = Al and Ga)
– Spin-gap states in δ-MxV2O5 (M = Ag, Tl, Na, K and Sr)
– Superexchange interactions in MVnO2n+1 (M= divalent ion; n = 1–5), CdVO3, Cd1−xCaxV3O7, SrV5O11,etc.
• Composite crystal system
– Superspace group approach to CuxV4O11
• Secondary ion battery system
– Li inserition effects in M1+xV3O8 (M = Li, Na and Ag), Ag2V4O11, CuxV4O11 and V6O13
This report describes briefly recent progress for the geometrically frustrated system, which has beenselected for inclusion in IOP Select1 [4].
Geometrically frustrated spinel system
The normal spinel-type S = 1 insulator MV2O4, where M is a nonmagnetic divalent ion surrounded
tetrahedrally (the so-called A site) and the trivalent V has an octahedral coordination (the B site), exhibits
the frustration effect, since the network of the V ions with antiferromagnetic interaction is achieved by
the linkage of a regular tetrahedron block that has the V ion at each apex. The compounds with M =
Cd, Mg and Zn exhibit the cubic−tetragonal transition due to a Jahn-Teller effect and a jump of magnetic
susceptibility at Tc1. In addition, at the lower Tc2, the temperature dependence of susceptibility shows
a kink without significant change of structure, suggesting the transition to the Neel state, in which spins
are ordered antiferromagnetically in the chain of the tetragonal c-plane. Here, Tc1 and Tc2 are 97 and 35
K for M = Cd; 64.5 and 45 K for M = Mg; and 52 and 44 K for M = Zn. Using the high-temperature
series expansion (HTSE) of up to the 8th-order, the Curie constant C and the nearest-neighbour exchange-
coupling constant J for the cubic phase are estimated as follows: C = 0.98(2), 0.93(3) and 0.96(6) emu K
(mol V)−1, and J = 44(1), 92(7) and 92(7) K for M = Cd, Mg and Zn, respectively.1http://Select.iop.org
- 66 -
A tetrahedral mean-field (TMF) model was presented previously on the basis of the exact solution
of the magnetic susceptibility for a set of four interacting spins with Jtet for the spinel B sublattice or the
pyrochlore lattice. In the MV2O4 system, this model was applicable at temperatures above T ≈ Jtet, where
Jtet apparently corresponds to 2J. Recently, a modified theory, referred to as the generalized constant
coupling (GCC) approximation, has been proposed. It gives essentially exact results for the susceptibility
and specific heat of the classical Heisenberg antiferromagnet on the spinel B sublattice. Mechanisms for
lifting the frustration through a coupling between spin and lattice of freedom were also investigated.
For the MV2O4 system, neither of the analyses for the crystal structure below Tc1 and the magnetic
susceptibility between Tc1 and Tc2 have been performed. In this work, the structures of CdV2O4 at 299
and 85 K (below Tc1) are determined by means of x-ray four-circle diffraction to understand the essence of
structural and magnetic anomalies at Tc1. Using the exchange-coupling constant obtained in the previous
work, magnetic susceptibilities above Tc1 are examined with the GCC for spin-singlet V4-tetramers that
are not isolated but interactive to each other, called pseudotetramers. On the basis of the low-temperature
structure, the tetragonally distorted pseudotetramer model is considered, and it is applied to the suscepti-
bility data between Tc1 and Tc2.
Figure 1(a) shows the crystal structure at 85 K projected on the tetragonal c-plane. Here, the VO6
octahedron has four V−O bonds with 2.041 Å in the c-plane and two bonds with 2.014 Å along the c-axis.
Therefore, the dxy-character for the ground-state wavefunction is expected to be enhanced slightly, which
may be attributed to the Jahn-Teller effect. The average V−O bond is 2.032 Å, which is equal to the value
at 299 K within a standard deviation and is normal for V3+ ion. The network of V ions is expressed by the
linkage of a distorted V4 tetrahedron block consist of four V−V bonds with 3.066 Å and two bonds with
3.085 Å as shown in Fig. 1(b). The CdO4 tetrahedron has equal Cd−O bonds with 2.145 Å in agreement
with the values at 299 K and with those expected from the ionic radius of Cd2+ coordinated in a similar
manner. The crystals used at 299 and 85 K have the occupancy probabilities 0.992(3) and 0.990(5) for Cd,
respectively, indicating that both of them are nearly stoichiometric.
The magnetic susceptibilities χ of MV2O4 with M = Cd, Mg and Zn for the cubic phase consist of the
d-spin term χd and the temperature-independent one χ0 from the Van Vleck and diamagnetic components.
Using C and J for the d-spin, and χ0 determined with the HTSE, the reduced spin-susceptibilities defined
as χdJ/C are shown as a function of J/T in Fig. 2(a). The dotted curve and the dashed one indicate
results of the HTSE (χHTSEJ/C) and TMF (χtetJ/C) with Jtet = 2J, respectively, calculated following
their expressions given in [3]. According to the GCC without next nearest-neighbour interaction, the spin
susceptibility is given by
χGCC =CT
1 + ε1 − ε (1)
where ε = χtetT/C − 1. The full curve in Fig. 2(a) is drawn with Jtet = J (not 2J). This model accounts
for the data in the cubic phase for CdV2O4 with J < Tc1 as well as those at temperatures above T J for
MgV2O4 and ZnV2O4 with J > Tc1, taking account of an error in C (2−6 %).
The detailed low-temperature behaviours of the reduced spin-susceptibilities as a function of T/J are
plotted in Fig. 2(b). There exists a significant difference between the experimental and calculated results
as shown by the dashed curve. This indicates that the exchange couplings for the V network change below
- 67 -
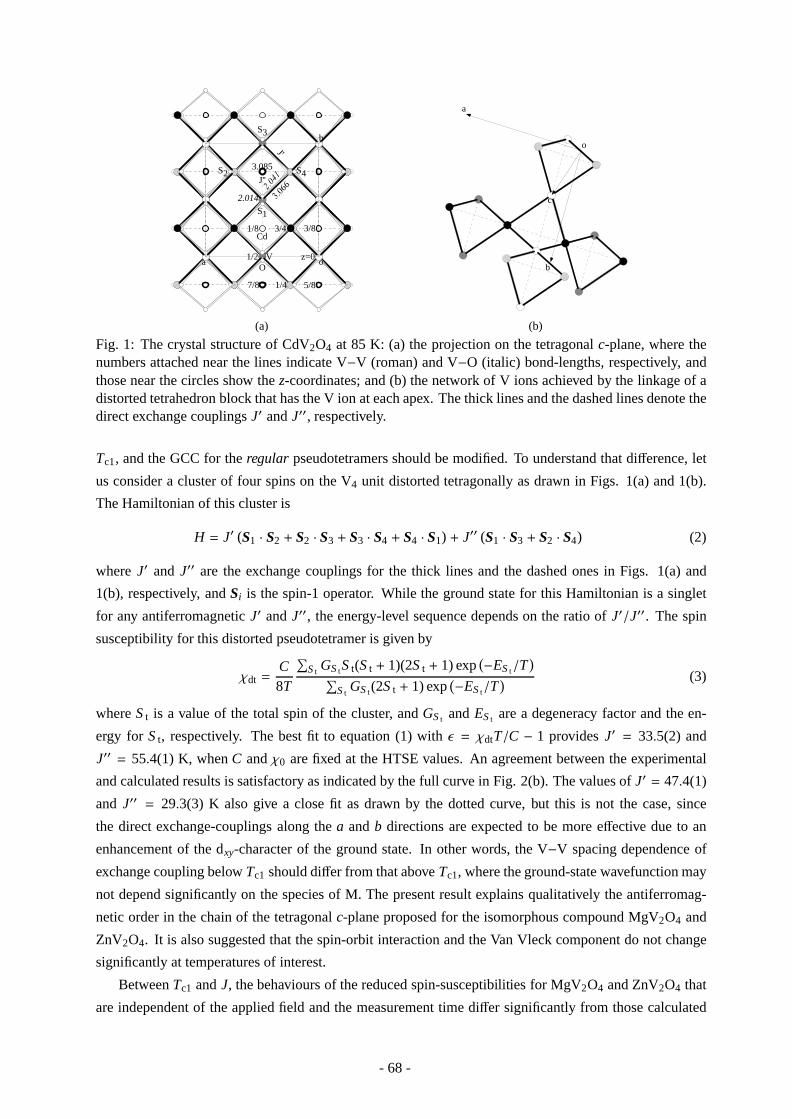
O
Cd
Voa
b
3.085
2.014
J''
S1
S2
S3
S4
z=01/2
3/81/8
5/87/8 1/4
3/4
(a)
a
c
b
o
(b)
Fig. 1: The crystal structure of CdV2O4 at 85 K: (a) the projection on the tetragonal c-plane, where thenumbers attached near the lines indicate V−V (roman) and V−O (italic) bond-lengths, respectively, andthose near the circles show the z-coordinates; and (b) the network of V ions achieved by the linkage of adistorted tetrahedron block that has the V ion at each apex. The thick lines and the dashed lines denote thedirect exchange couplings J′ and J′′, respectively.
Tc1, and the GCC for the regular pseudotetramers should be modified. To understand that difference, let
us consider a cluster of four spins on the V4 unit distorted tetragonally as drawn in Figs. 1(a) and 1(b).
The Hamiltonian of this cluster is
H = J′ (S1 · S2 + S2 · S3 + S3 · S4 + S4 · S1) + J′′ (S1 · S3 + S2 · S4) (2)
where J′ and J′′ are the exchange couplings for the thick lines and the dashed ones in Figs. 1(a) and
1(b), respectively, and Si is the spin-1 operator. While the ground state for this Hamiltonian is a singlet
for any antiferromagnetic J′ and J′′, the energy-level sequence depends on the ratio of J′/J′′. The spin
susceptibility for this distorted pseudotetramer is given by
χdt =C8T
∑S t
GS tS t(S t + 1)(2S t + 1) exp(−ES t/T
)
∑S t
GS t (2S t + 1) exp(−ES t/T
) (3)
where S t is a value of the total spin of the cluster, and GS t and ES t are a degeneracy factor and the en-
ergy for S t, respectively. The best fit to equation (1) with ε = χdtT/C − 1 provides J′ = 33.5(2) and
J′′ = 55.4(1) K, when C and χ0 are fixed at the HTSE values. An agreement between the experimental
and calculated results is satisfactory as indicated by the full curve in Fig. 2(b). The values of J′ = 47.4(1)
and J′′ = 29.3(3) K also give a close fit as drawn by the dotted curve, but this is not the case, since
the direct exchange-couplings along the a and b directions are expected to be more effective due to an
enhancement of the dxy-character of the ground state. In other words, the V−V spacing dependence of
exchange coupling below Tc1 should differ from that above Tc1, where the ground-state wavefunction may
not depend significantly on the species of M. The present result explains qualitatively the antiferromag-
netic order in the chain of the tetragonal c-plane proposed for the isomorphous compound MgV2O4 and
ZnV2O4. It is also suggested that the spin-orbit interaction and the Van Vleck component do not change
significantly at temperatures of interest.
Between Tc1 and J, the behaviours of the reduced spin-susceptibilities for MgV2O4 and ZnV2O4 that
are independent of the applied field and the measurement time differ significantly from those calculated
- 68 -

0.0 0.2 0.4 0.6 0.8 1.0 1.2
0.04
0.08
0.12
0.16χ d
J/C
J/T
MV2O4
M=Cd
Mg
Zn
Tc1
(a)
0.0 0.4 0.8 1.2 1.6 2.0 2.4
0.12
0.13
0.14
0.15
T/J
χ dJ/
C
MV2O4
M=Cd
Mg
Zn
Tc2
Tc1
(b)
Fig. 2: (a) The reduced spin-susceptibilities χdJ/C as a function of J/T for MV2O4 with M = Cd, Mgand Zn, where the full and dashed curves indicate fits to the GCC and TMF models, respectively; and thedotted curve denotes result calculated in terms of the HTSE. (b) The reduced spin-susceptibilities χdJ/Cas a function of T/J for MV2O4 with M = Cd, Mg and Zn, where the full (dotted) curve indicates a fitto the GCC for the tetragonally distorted pseudotetramers with exchange couplings J′ = 33.5 (47.4) andJ′′ = 55.4 (29.3) K, and the dashed curve corresponds to the full curve in (a).
for the pseudotetramer with the GCC. It should be noted that Zn0.5Cd0.5V2O4 (one of the Zn−Cd solid-
solution system), in which the V3+−V3+ interaction is modified randomly to give bond disorder, exhibits
a transition to spin-glasslike phases at certain temperature Tg without structural change as in the case of
the site-disordered system Mg(V1−xAlx)2O4. The temperature dependence of the susceptibility between
Tc1 and J is rather similar to that for Zn0.5Cd0.5V2O4 between Tg and J. Therefore, the deviation from
the pseudotetramer model at temperatures below J is considered a common nature for the S = 1 spinel B
sublattice which does not depend significantly on disordered effects.
Below Tc1, the frustration for interchains via J′ or excited dyz,zx orbital exists, since preliminary mea-
surements of x-ray diffraction below Tc2 indicate the crystal symmetry to be tetragonal. As introduced
before, the mechanisms of transition to the Neel state have been discussed theoretically.
In conclusion, the structure at 85 K is tetragonal and the dxy-character of the ground state is enhanced
due to the usual Jahn-Teller effect, leading to the anisotropy of the exchange-coupling constant J. The
magnetic susceptibilities for the cubic phase with J < Tc1 are explained in terms of the GCC with regular
pseudotetramers using the same J as determined by the HTSE. The maximum phenomena for the suscep-
tibilities between Tc1 and Tc2 (near to J) are also understood by the GCC for the distorted pseudotetramers
with two kinds of exchange coupling. While this phase does not have a spin order, it is accompanied with
significant modulation of exchange interaction. For the isomorphous compound MgV2O4 and ZnV2O4
with J > Tc1, the GCC with regular pseudotetramers accounts for the susceptibility data at T > J. How-
ever, contrary to the behaviour expected from the GCC, the susceptibility for the cubic phase between J
and Tc1 increases rapidly with decreasing temperature, which does not depend significantly on the disor-
dered effect. Our scenario for CdV2O4 presented here seems to be basically effective for the isomorphous
compounds, but in order to understand quantitatively the susceptibility anomalies at Tc1, detailed theories
for T < J are necessary.
- 69 -

References
[1] M. Onoda and J. Hasegawa: J. Phys.: Condens. Matter 14 (2002) 5045-5059.
[2] N. Nishiguchi, M. Onoda and K. Kubo: J. Phys.: Condens. Matter 14 (2002) 5731-5746.
[3] N. Nishiguchi and M. Onoda: J. Phys.: Condens. Matter 14 (2002) L551-L557.
[4] M. Onoda and J. Hasegawa: J. Phys.: Condens. Matter 15 (2003) L95-L102.
[5] M. Onoda and I. Amemiya: J. Phys.: Condens. Matter in press.
- 70 -
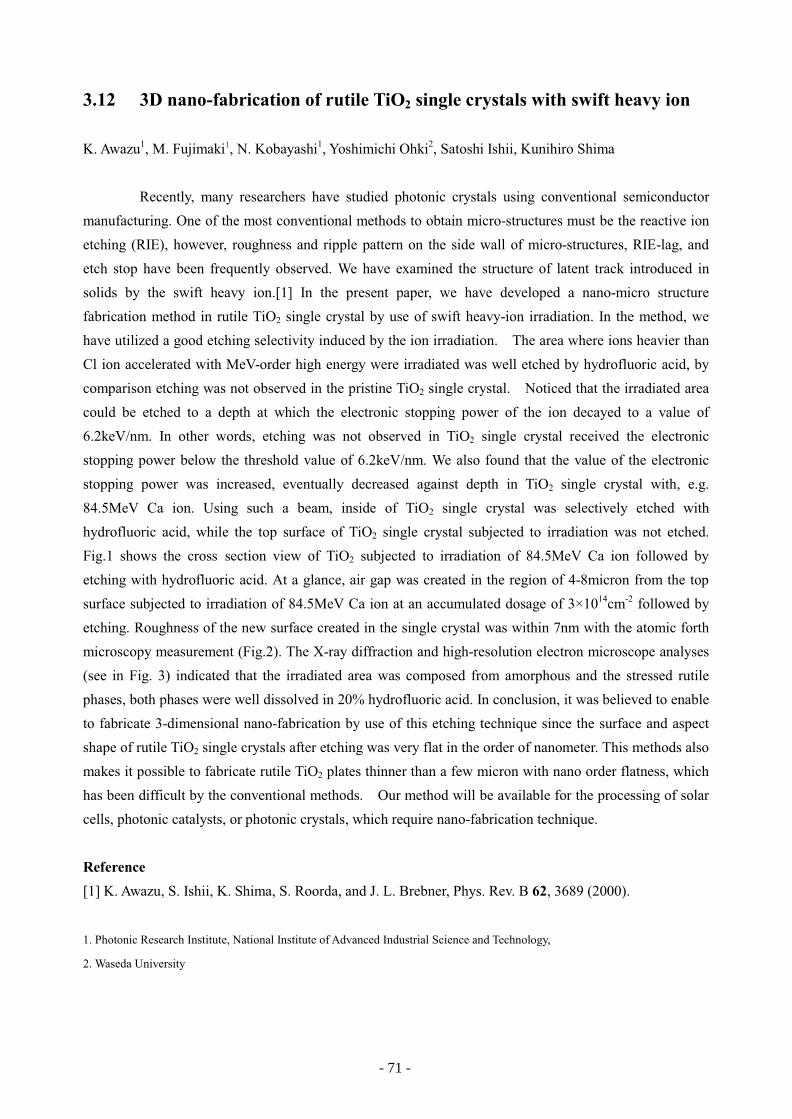
3.12 3D nano-fabrication of rutile TiO2 single crystals with swift heavy ion
K. Awazu1, M. Fujimaki , N. Kobayashi
1, Yoshimichi Ohki
2, Satoshi Ishii, Kunihiro Shima
Recently, many researchers have studied photonic crystals using conventional semiconductor
manufacturing. One of the most conventional methods to obtain micro-structures must be the reactive ion
etching (RIE), however, roughness and ripple pattern on the side wall of micro-structures, RIE-lag, and
etch stop have been frequently observed. We have examined the structure of latent track introduced in
solids by the swift heavy ion.[1] In the present paper, we have developed a nano-micro structure
fabrication method in rutile TiO2 single crystal by use of swift heavy-ion irradiation. In the method, we
have utilized a good etching selectivity induced by the ion irradiation. The area where ions heavier than
Cl ion accelerated with MeV-order high energy were irradiated was well etched by hydrofluoric acid, by
comparison etching was not observed in the pristine TiO2 single crystal. Noticed that the irradiated area
could be etched to a depth at which the electronic stopping power of the ion decayed to a value of
6.2keV/nm. In other words, etching was not observed in TiO2 single crystal received the electronic
stopping power below the threshold value of 6.2keV/nm. We also found that the value of the electronic
stopping power was increased, eventually decreased against depth in TiO2 single crystal with, e.g.
84.5MeV Ca ion. Using such a beam, inside of TiO2 single crystal was selectively etched with
hydrofluoric acid, while the top surface of TiO2 single crystal subjected to irradiation was not etched.
Fig.1 shows the cross section view of TiO2 subjected to irradiation of 84.5MeV Ca ion followed by
etching with hydrofluoric acid. At a glance, air gap was created in the region of 4-8micron from the top
surface subjected to irradiation of 84.5MeV Ca ion at an accumulated dosage of 3×10¹⁴
cm-2
followed by
etching. Roughness of the new surface created in the single crystal was within 7nm with the atomic forth
microscopy measurement (Fig.2). The X-ray diffraction and high-resolution electron microscope analyses
(see in Fig. 3) indicated that the irradiated area was composed from amorphous and the stressed rutile
phases, both phases were well dissolved in 20% hydrofluoric acid. In conclusion, it was believed to enable
to fabricate 3-dimensional nano-fabrication by use of this etching technique since the surface and aspect
shape of rutile TiO2 single crystals after etching was very flat in the order of nanometer. This methods also
makes it possible to fabricate rutile TiO2 plates thinner than a few micron with nano order flatness, which
has been difficult by the conventional methods. Our method will be available for the processing of solar
cells, photonic catalysts, or photonic crystals, which require nano-fabrication technique.
Reference
[1] K. Awazu, S. Ishii, K. Shima, S. Roorda, and J. L. Brebner, Phys. Rev. B 62, 3689 (2000).
1. Photonic Research Institute, National Institute of Advanced Industrial Science and Technology,
2. Waseda University
- 71 -
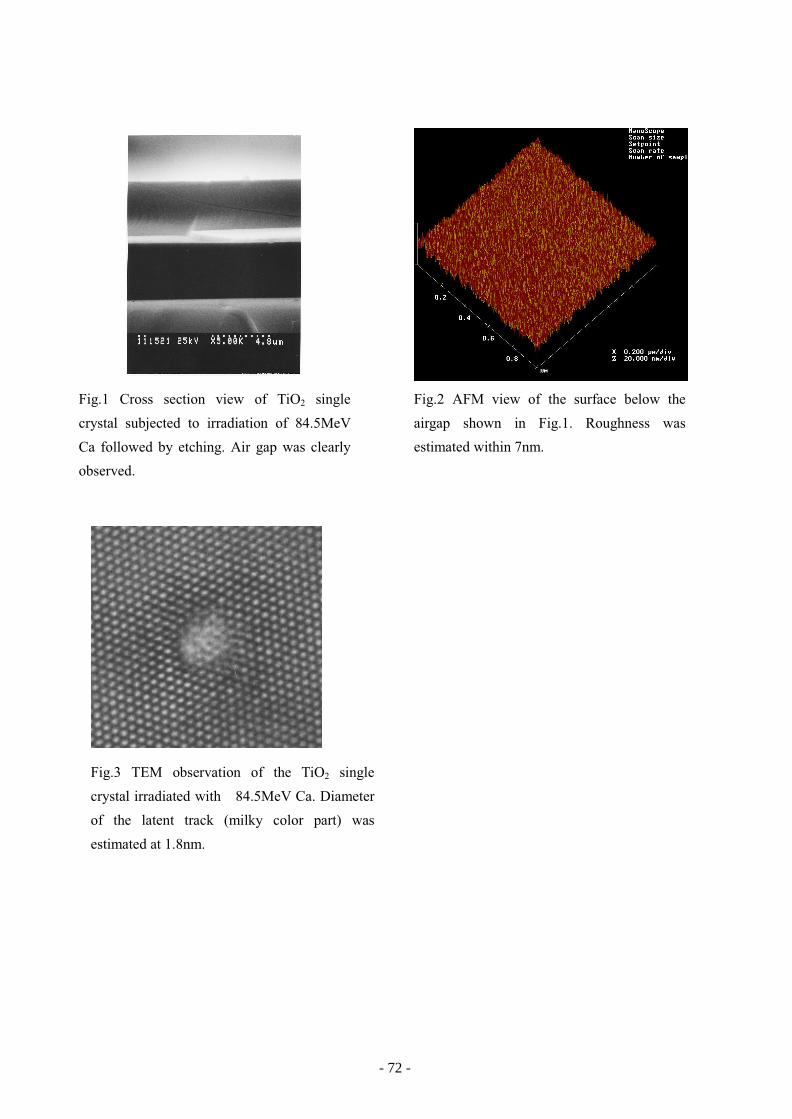
Fig.1 Cross section view of TiO2 single
crystal subjected to irradiation of 84.5MeV
Ca followed by etching. Air gap was clearly
observed.
Fig.2 AFM view of the surface below the
airgap shown in Fig.1. Roughness was
estimated within 7nm.
Fig.3 TEM observation of the TiO2 single
crystal irradiated with 84.5MeV Ca. Diameter
of the latent track (milky color part) was
estimated at 1.8nm.
- 72 -
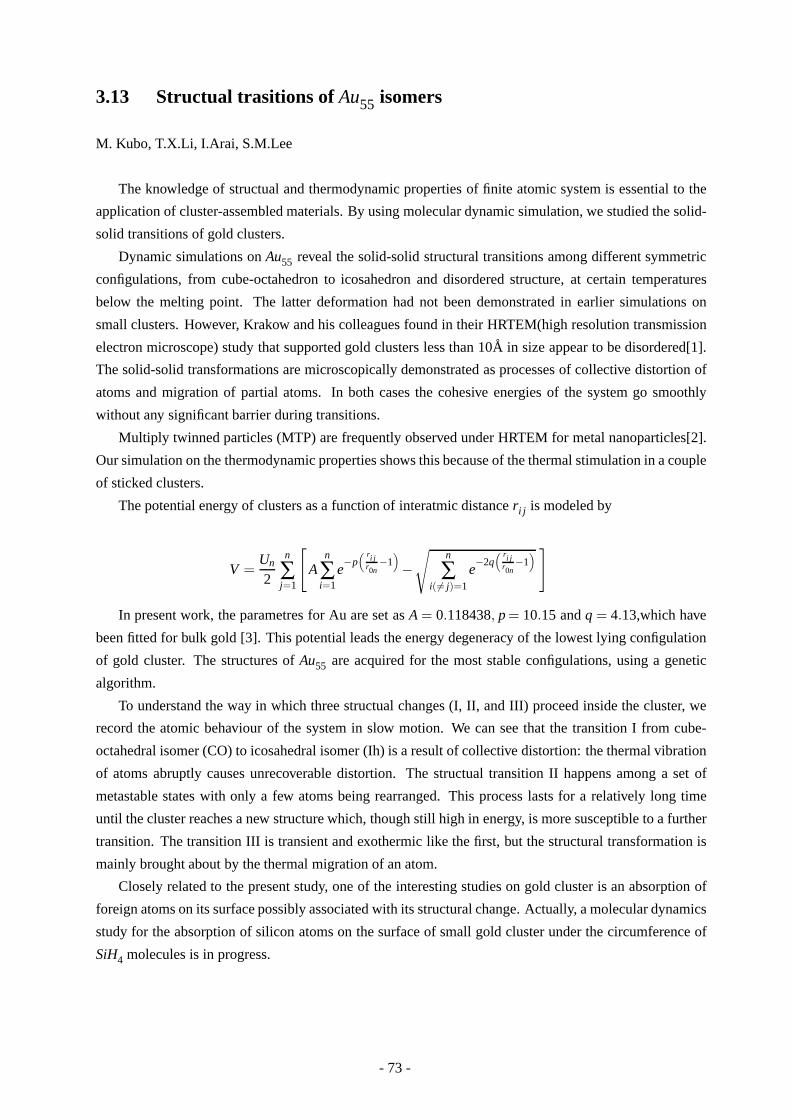
3.13 Structual trasitions of Au55 isomers
M. Kubo, T.X.Li, I.Arai, S.M.Lee
The knowledge of structual and thermodynamic properties of finite atomic system is essential to the
application of cluster-assembled materials. By using molecular dynamic simulation, we studied the solid-
solid transitions of gold clusters.
Dynamic simulations on Au55 reveal the solid-solid structural transitions among different symmetric
configulations, from cube-octahedron to icosahedron and disordered structure, at certain temperatures
below the melting point. The latter deformation had not been demonstrated in earlier simulations on
small clusters. However, Krakow and his colleagues found in their HRTEM(high resolution transmission
electron microscope) study that supported gold clusters less than 10A in size appear to be disordered[1].
The solid-solid transformations are microscopically demonstrated as processes of collective distortion of
atoms and migration of partial atoms. In both cases the cohesive energies of the system go smoothly
without any significant barrier during transitions.
Multiply twinned particles (MTP) are frequently observed under HRTEM for metal nanoparticles[2].
Our simulation on the thermodynamic properties shows this because of the thermal stimulation in a couple
of sticked clusters.
The potential energy of clusters as a function of interatmic distance ri j is modeled by
V =Un
2
n
∑j=1
[A
n
∑i=1
e−p
( ri jr0n
−1)−
√n
∑i(= j)=1
e−2q
( ri jr0n
−1) ]
In present work, the parametres for Au are set as A = 0.118438, p = 10.15 and q = 4.13,which have
been fitted for bulk gold [3]. This potential leads the energy degeneracy of the lowest lying configulation
of gold cluster. The structures of Au55 are acquired for the most stable configulations, using a genetic
algorithm.
To understand the way in which three structual changes (I, II, and III) proceed inside the cluster, we
record the atomic behaviour of the system in slow motion. We can see that the transition I from cube-
octahedral isomer (CO) to icosahedral isomer (Ih) is a result of collective distortion: the thermal vibration
of atoms abruptly causes unrecoverable distortion. The structual transition II happens among a set of
metastable states with only a few atoms being rearranged. This process lasts for a relatively long time
until the cluster reaches a new structure which, though still high in energy, is more susceptible to a further
transition. The transition III is transient and exothermic like the first, but the structural transformation is
mainly brought about by the thermal migration of an atom.
Closely related to the present study, one of the interesting studies on gold cluster is an absorption of
foreign atoms on its surface possibly associated with its structural change. Actually, a molecular dynamics
study for the absorption of silicon atoms on the surface of small gold cluster under the circumference of
SiH4 molecules is in progress.
- 73 -
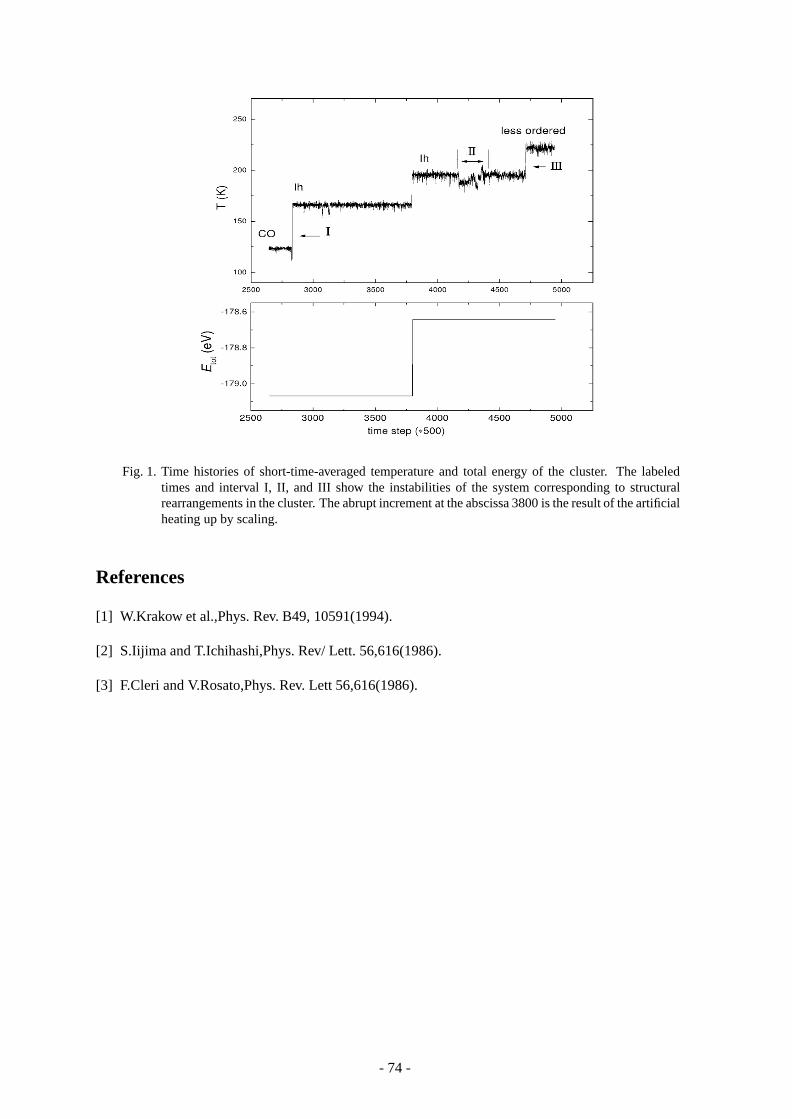
Fig. 1. Time histories of short-time-averaged temperature and total energy of the cluster. The labeledtimes and interval I, II, and III show the instabilities of the system corresponding to structuralrearrangements in the cluster. The abrupt increment at the abscissa 3800 is the result of the artificialheating up by scaling.
References
[1] W.Krakow et al.,Phys. Rev. B49, 10591(1994).
[2] S.Iijima and T.Ichihashi,Phys. Rev/ Lett. 56,616(1986).
[3] F.Cleri and V.Rosato,Phys. Rev. Lett 56,616(1986).
- 74 -
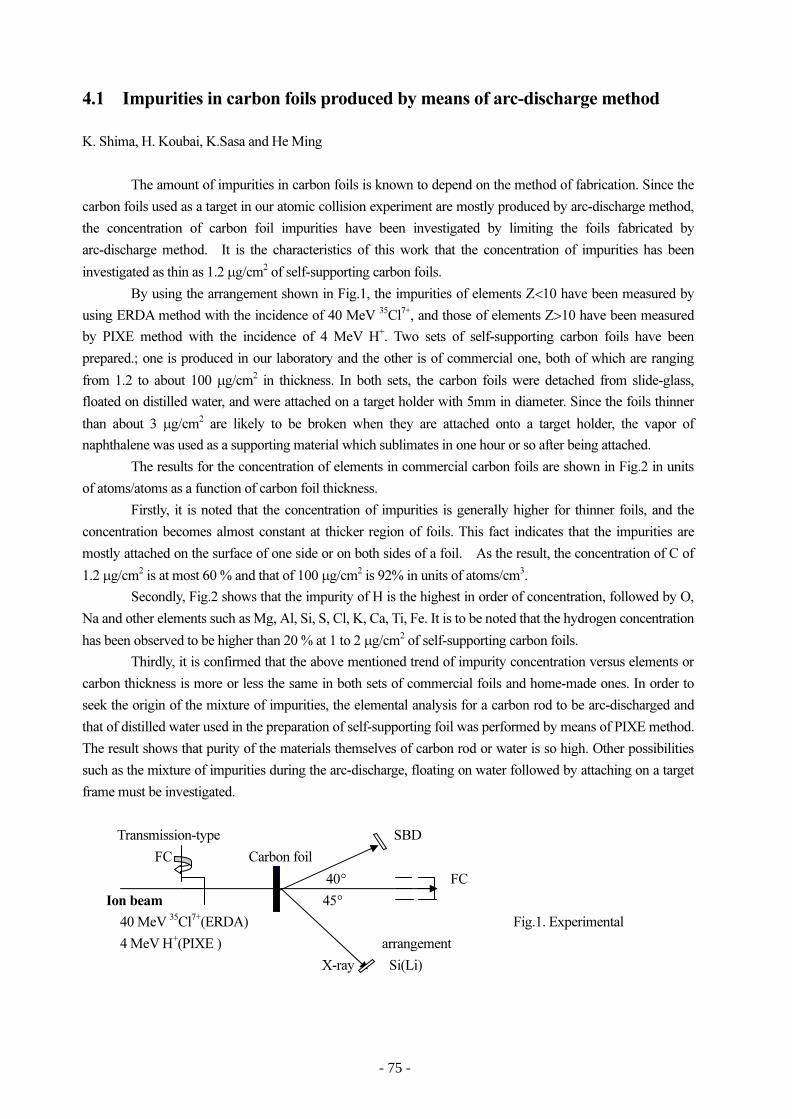
4.1 Impurities in carbon foils produced by means of arc-discharge method
K. Shima, H. Koubai, K.Sasa and He Ming
The amount of impurities in carbon foils is known to depend on the method of fabrication. Since the
carbon foils used as a target in our atomic collision experiment are mostly produced by arc-discharge method,
the concentration of carbon foil impurities have been investigated by limiting the foils fabricated by
arc-discharge method. It is the characteristics of this work that the concentration of impurities has been
investigated as thin as 1.2 µg/cm2
of self-supporting carbon foils.
By using the arrangement shown in Fig.1, the impurities of elements Z<10 have been measured by
using ERDA method with the incidence of 40 MeV 35
Cl7+
, and those of elements Z>10 have been measured
by PIXE method with the incidence of 4 MeV H+
. Two sets of self-supporting carbon foils have been
prepared.; one is produced in our laboratory and the other is of commercial one, both of which are ranging
from 1.2 to about 100 µg/cm2
in thickness. In both sets, the carbon foils were detached from slide-glass,
floated on distilled water, and were attached on a target holder with 5mm in diameter. Since the foils thinner
than about 3 µg/cm2
are likely to be broken when they are attached onto a target holder, the vapor of
naphthalene was used as a supporting material which sublimates in one hour or so after being attached.
The results for the concentration of elements in commercial carbon foils are shown in Fig.2 in units
of atoms/atoms as a function of carbon foil thickness.
Firstly, it is noted that the concentration of impurities is generally higher for thinner foils, and the
concentration becomes almost constant at thicker region of foils. This fact indicates that the impurities are
mostly attached on the surface of one side or on both sides of a foil. As the result, the concentration of C of
1.2 µg/cm2
is at most 60 % and that of 100 µg/cm2
is 92% in units of atoms/cm3
.
Secondly, Fig.2 shows that the impurity of H is the highest in order of concentration, followed by O,
Na and other elements such as Mg, Al, Si, S, Cl, K, Ca, Ti, Fe. It is to be noted that the hydrogen concentration
has been observed to be higher than 20 % at 1 to 2 µg/cm2
of self-supporting carbon foils.
Thirdly, it is confirmed that the above mentioned trend of impurity concentration versus elements or
carbon thickness is more or less the same in both sets of commercial foils and home-made ones. In order to
seek the origin of the mixture of impurities, the elemental analysis for a carbon rod to be arc-discharged and
that of distilled water used in the preparation of self-supporting foil was performed by means of PIXE method.
The result shows that purity of the materials themselves of carbon rod or water is so high. Other possibilities
such as the mixture of impurities during the arc-discharge, floating on water followed by attaching on a target
frame must be investigated.
Transmission-type SBD
FC Carbon foil
40° FC
Ion beam 45°
40 MeV 35
Cl7+
(ERDA) Fig.1. Experimental
4 MeV H+
(PIXE ) arrangement
X-ray Si(Li)
- 75 -

Fig.2. Ovserved concentration of elements in commercial carbon foils in units of atoms/atoms as a
Function of carbon thickness.
10
-6
10
-5
0.0001
0.001
0.01
0.1
1
1 10 100
Co
ncen
tratio
n o
f elem
en
t in
C
[ato
m/ato
m]
C thickness [ug/cm2
]
C
H
O
Na
Cl
Si
Ca
Mg
P
Fe
Ti
S
K
- 76 -
4.2 Calibration of hydrogen concentration by alpha-gammaangular correlation method
K.Furuno, M.Ishizuka, H.Ohshima, Y.Yamato, K.Sasa and T.Komatsubara
In the hydrogen analysis with the resonant nuclear reaction 1H(19F,α γ)16O (NRA), the distribution of
hydrogen atoms can be derived from an experimental excitation function. The yield of 6∼7-MeV γ rays
observed at an incident 19F energy E0 is given by
Y(E0) =Ω4π
εηQ0
∫ R0−Rm
0
∫ ∞
−∞n(x) f (E0,ER,E ′,x)dE ′dx, (1)
where Q0 is the integrated charge of 19F ion beam, ε stands for the intrinsic detection efficiency of a
γ-ray detector, η denotes the branching ratio of α decays to excited states in 16O. In eq.(1), the function
f (E0,ER,E ′,x) is described by
f (E0,ER,E ′,x) =1√
2π(σ2B +Ω2
S)∑i
BW (EiR)exp
[−E0−∆Ex −E ′2
2(σ 2B +Ω2
S)
]. (2)
In this expression, ∆Ex is the energy loss of the incident 19F from the sample surface to a depth x; σB is
the energy spread of the incident 19F beam; ΩS means the energy broadening due to energy straggling of19F in the sample. The cross section of the nuclear reaction is written as BW (Ei
R), which is well known
Breit-Wigner formula. Since a few different resonances should be taken into account for thick samples,
we write the Breit-Wigner formula of i-th resonance as
BW(EiR) = σ(Ei
R)Ei
R
E ′ ·Γ2
tot,i
4(E ′ −EiR)2 +Γ2
tot,i
. (3)
We can estimate σB and ΩS in good approximation for about 10 % precision of measured hydrogen
concentration. The cross sections BW (EiR) and the branching ratios η are measured with a precision
of 10 %. Using these values, we can calculate f (E0,ER,E′,x) numerically.
The quantity of Ωε/4π can be determined from an α − γ angular correlation experiment at E(19F) =
16.44 MeV with about 10 µm-thick hydrogen bearing sample[1]. If we measure the excitation function for
the sample with the same experimental set up as the α − γ angular correlation, the hydrogen distribution
n(x) can be obtained from the analysis of the excitation function, since Ωε/4π is already known. If
once the distribution n(x) is calibrated, we can use this sample as a standard to determine the detection
efficiency of any γ-ray detector in other system for hydrogen analysis with NRA.
We prepared a 10 µm thick n-type silicon disk. It was mounted on a stainless frame with glue, and
coated on one side with 400A thick gold by vacuum evaporation to make it electrically conductive between
the silicon disk and the frame. We implanted negative hydrogen ions into this silicon sample at 100 keV.
The area of implantation was defined with an aperture of 4 mm diameter and the beam was swept using a
deflector to obtain uniform lateral distribution of implanted hydrogen. The total charge was 8000 µC, so
that the areal density of hydrogen was
nH =8000×10−6
π × (0.2)2×1.6021×1019 = 3.97×10¹⁷ [H/cm2]. (4)
- 77 -

Since the integration of the negative beam current was not made in a Faraday cup with adequate suppres-
sion of secondary electrons, the uncertainty of the beam current integration is estimated to be 10 %.
The angular correlation experiment and the measurement of excitation function were performed using
the following experimental set up. A cylindrical target chamber of 100 mm diameter was placed at the
center of a goniometer for γ-ray angular-distribution measurements in nuclear physics. In this chamber,
the silicon sample was set at the center. A silicon surface barrier detector (SSD) was placed behind of
the silicon sample. A 6 µm thick aluminum foil was inserted between the silicon sample and SSD to
stop incident 19F ions and recoil 16O. The distance between the silicon sample and SSD was 13 mm. An
aperture of 6mm in diameter was mounted on SSD. From these geometrical arrangement, the emission of
α particles was restricted in a cone with a half angle of 16 along the beam direction. Gamma rays were
observed with a 76×76 mm BGO scintillation detector. The distance from the center to the front surface
of the BGO detector was 61.5 mm.
Bombarding Energy [MeV]
Cou
nts
per
1 m
icro
Cou
lom
b
A
B
C
D
16 17 18 19 200
500
1000
1500
2000
2500
3000
Figure 1: Excitation function(open circles) and calcula-tion assuming a thin hydrogen layer at the sample sur-face(full diamonds)
Lab. angle of gamma-ray detector [degree]
Rat
io o
f alp
ha-g
amm
a co
inci
denc
e co
unts
to a
lpha
sin
gles
cou
nts
-60 -30 0 30 60 90 1200.02
0.025
0.03
0.035
0.04
0.045
0.05
Figure 2: α − γ angular correlation
At first, we measured an excitation function to observe 16.44 MeV resonance by placing the γ-ray
detector in the beam direction. In Fig. 1, the peak A and B are ascribed to yields from a thin layer
of hydrogen adsorbed on the sample surface at energies 16.44 and 17.6 MeV. The peak C and D are
ascribable to implanted hydrogen at 16.44 and 17.6 MeV, respectively. To subtract the yield from the
surface hydrogen, we calculated γ-ray yields assuming a 50 nm thick hydrogen layer at the surface as
indicated by full diamonds in Fig. 1. The concentration of the surface hydrogen was normalized to the
experimental excitation function at 16.44 MeV.
In the second place, we performed an α − γ angular correlation experiment on the 16.44 MeV reso-
nance. The energy of incident 19F beam was fixed to 18.35 MeV (the peak C in Fig. 1). The experimental
results are plotted in Fig. 2. The angular correlation obtained in the present experimental arrangement is
in general expressed by Legendre polynomials[2], namely
R(θγ) = a0 +a2 P2(cos θγ)+a4 P4(cos θγ). (5)
Its zero-th order term gives the detection efficiency of the γ-ray detector including the solid angle[1]. The
solid line in Fig. 2 shows the result of this fit to Legendre polynominals. The statistical errors in γ-ray and
- 78 -

α-particle counts and systematic error due to mechanical movement of the goniometer were taken into
account for experimental values. The coefficients in eq.(5) are
Ωγ
4πεγ = a0 = (3.15±0.04)×10−2 (6)
a2 = (0.79±0.07)×10−2 (7)
and (8)
a4 = (0.24±0.08)×10−2. (9)
The value of χ2 was 3.72, so that the present fitting is reasonable for the degree of freedom 10.
The γ-ray singles angular distribution obtained at the same time as the angular correlation experiment
was isotropic within 5 %. The excitation function obtained before the angular correlation experiment,
therefore, can be used for the analysis of the hydrogen concentration n(x).
Num
ber
of h
ydro
gen
atom
s pe
r cm
Depth in units of microns
1022
3
0 0.5 1 1.50
0.5
1
1.5
2
2.5
Figure 3: Exracted hydrogen distribution
Bombardinng energy [MeV]
Cou
nts
per
1 m
icro
Cou
lom
b
17 18 19 200
1000
2000
3000
Figure 4: Open circles indicate excitation function cor-rected for interpolation, background subtraction and datasmoothing. The solid line shows the excitation functioncalculated from the extracted hydrogen distribution.
The procedure of data analysis is as follows. We subtracted the yield due to the surface hydrogen from
the experimental data indicated by open circles in Fig. 1. Then we subtracted 308 counts from the above
excitation function. The counts is an average of counts between 16.5∼17.5 MeV. We assumed that the 308
counts corresponded to the smooth non-resonant term in the cross section on the basis of the experimental
data reported by Spyrou et al.[3]. Furthermore, we made data smoothing by 3 point moving average.
As regards the hydrogen distribution n(x), we divided the silicon sample into 0.05 µm thick layers and
assumed that the distribution is uniform within each 0.05 µm thick layer. Initial values of the distribution
was derived by least squares method and negative solutions were put to null. The final derivation of n(x)
was performed according to the prescription by McGlone[4] and Smulders[5]. The weight in chi-square
minimization was assumed to be a sum of errors in the data correction, background subtraction and data
smoothing.
Fig. 3 shows the extracted hydrogen distribution n(x), while Fig. 4 displays the calculated excitation
function using the distribution. The value of χ2 is 23.5, and this extraction seems to be reasonable for the
- 79 -

degree of freedom 28. A depth distribution of implanted negative hydrogen ions was calculated with the
computer program SRIM[6]. The total number of implanted ions was assumed to be 1000. The results
is shown by small full circles in Fig. 3. The ordinate of this simulation is normalized to the extracted
hydrogen distribution. The depth distribution obtained from SRIM calculation is slightly shifted towards
surface side in comparison with experimental data, but the shape is in good agreement.
If we sum up n(x) in Fig. 3 from 0.5 to 1.1 µm assuming that these are implanted negative hydrogen
ions, we obtain the following areal density:
nH = (4.48±0.47)×1017 [H/cm2]
The uncertainties was evaluated as the sum of relative uncertainty of 5.7 % in the extraction of n(x), 8.3 %
in the cross section on resonance σ(ER), 2.7 % in the beam current integration and 1.3 % in the detection
efficiency. The overall relative uncertainty is 10.2 %.
As a calibration independent of NRA, the areal density of implanted hydrogen was measured by
proton-proton elastic-recoil coincidence spectroscopy at a proton energy of 20 MeV. We employed a
7.5 µm thick Kapton(C22H10N2O4) foil. The results are listed in Table1.
Table 1: Experimetal results of proton-proton elastic-recoil coincidence spectroscopy
samples yield relative integrated beam currentSilicon YS= 338±11 CS =1000Kapton YK= 2518±50 CK =200
The areal density of the Kapton foil was estimated to be ρK = 1.188±0.048 [mg/cm2]. This density
corresponds to the hydrogen density of ρK(H) = 32.5±1.3 [µg/cm2]. Since proton-proton elastic-recoil
coincidence spectroscopy does not discriminate the surface hydrogen, we estimated the relative ratio λof the surface to the implanted hydrogen to be 0.21±0.012 from the analysis of the excitation function.
With the mass of a hydrogen atom mH = 1.673×10⁻¹⁸ [µg], the areal density of the implanted hydrogen
is given by
nH = ρK(H) · YS
YK· CK
CS· 1
1+λ· 1
1.673×10¹⁸ [H/cm2]. (10)
Substituting each value into this formula, we obtained the following value. nH = (4.43±0.35)×1017[H/cm2].
The uncertainty includes the statistical errors of 3.3 % and 2 % in YS and YK , respectively, the uncertainty
of 4 % in the estimate of ρK(H) and uncertainty of 5.7 % in the estimate of λ . We ignored the uncertainty
of current integrations, because 20 MeV protons pass through the silicon sample and the Kapton foil with-
out appreciable energy loss and proton beam current was measured in a sufficiently deep Faraday cup with
adequate electron suppression. An overall relative uncertainty was 7.9 %.
Table 2 summarizes the areal densities of the implanted hydrogen obtained from three independent
methods. These areal densities are in good agreement within experimental uncertainties. An average
weighted by uncertainties and an arithmetic average for these three areal densities are
nH = (4.29±0.23)×1017 and nH = (4.29±0.41)×1017 [H/cm2]. (11)
Since the three areal densities are all evaluated in one measurement, their uncertainties would not be
reasonable as weights. In fact, the uncertainty of weighted average seems to be too small. Thus we
- 80 -
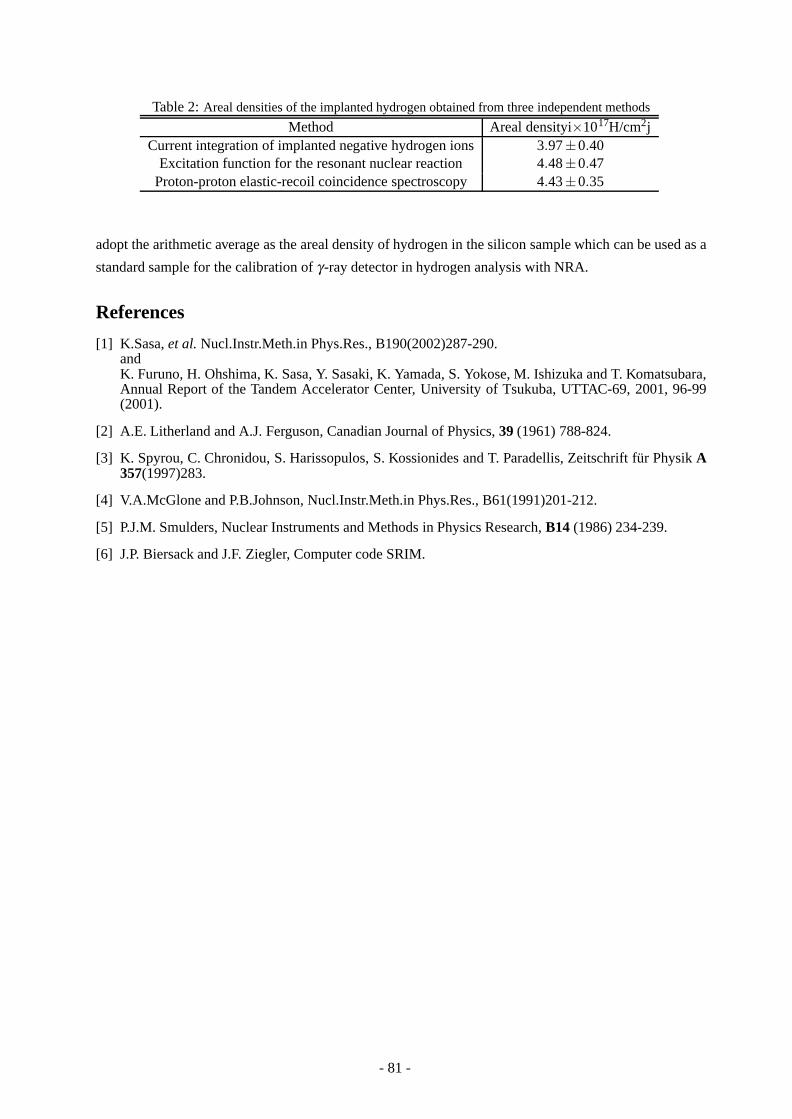
Table 2: Areal densities of the implanted hydrogen obtained from three independent methods
Method Areal densityi×1017H/cm2jCurrent integration of implanted negative hydrogen ions 3.97±0.40
Excitation function for the resonant nuclear reaction 4.48±0.47Proton-proton elastic-recoil coincidence spectroscopy 4.43±0.35
adopt the arithmetic average as the areal density of hydrogen in the silicon sample which can be used as a
standard sample for the calibration of γ-ray detector in hydrogen analysis with NRA.
References
[1] K.Sasa, et al. Nucl.Instr.Meth.in Phys.Res., B190(2002)287-290.andK. Furuno, H. Ohshima, K. Sasa, Y. Sasaki, K. Yamada, S. Yokose, M. Ishizuka and T. Komatsubara,Annual Report of the Tandem Accelerator Center, University of Tsukuba, UTTAC-69, 2001, 96-99(2001).
[2] A.E. Litherland and A.J. Ferguson, Canadian Journal of Physics, 39 (1961) 788-824.
[3] K. Spyrou, C. Chronidou, S. Harissopulos, S. Kossionides and T. Paradellis, Zeitschrift fur Physik A357(1997)283.
[4] V.A.McGlone and P.B.Johnson, Nucl.Instr.Meth.in Phys.Res., B61(1991)201-212.
[5] P.J.M. Smulders, Nuclear Instruments and Methods in Physics Research, B14 (1986) 234-239.
[6] J.P. Biersack and J.F. Ziegler, Computer code SRIM.
- 81 -
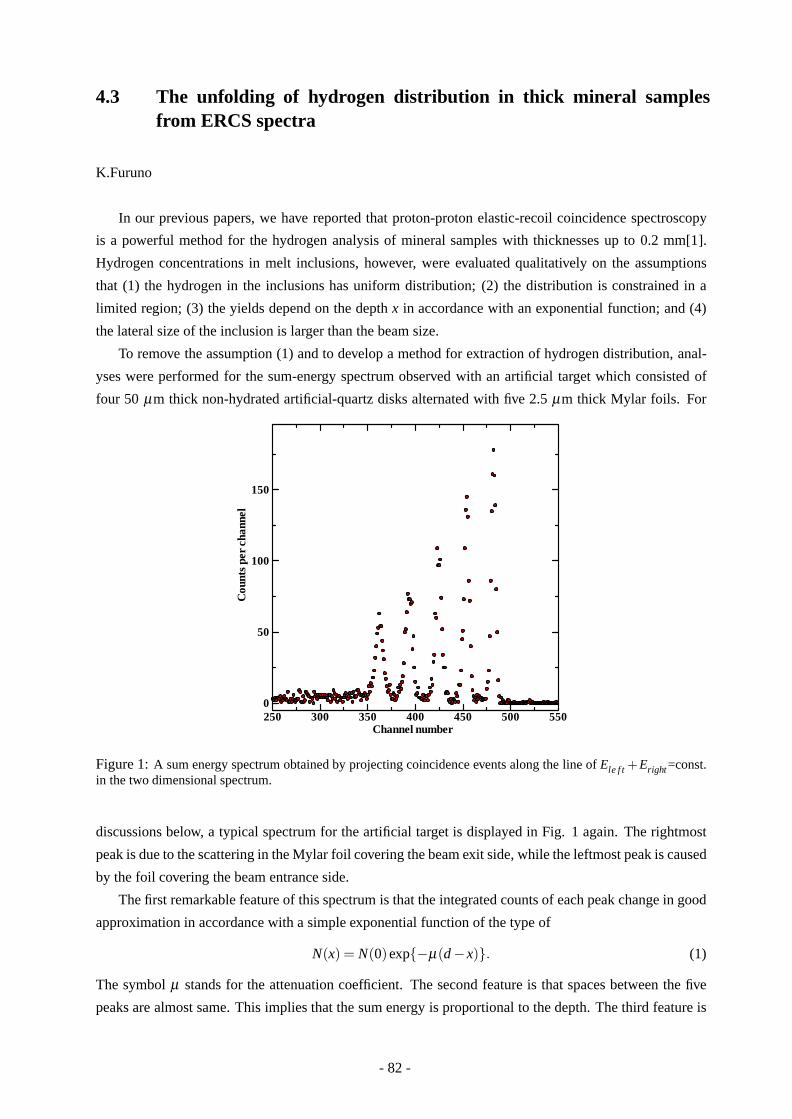
4.3 The unfolding of hydrogen distribution in thick mineral samplesfrom ERCS spectra
K.Furuno
In our previous papers, we have reported that proton-proton elastic-recoil coincidence spectroscopy
is a powerful method for the hydrogen analysis of mineral samples with thicknesses up to 0.2 mm[1].
Hydrogen concentrations in melt inclusions, however, were evaluated qualitatively on the assumptions
that (1) the hydrogen in the inclusions has uniform distribution; (2) the distribution is constrained in a
limited region; (3) the yields depend on the depth x in accordance with an exponential function; and (4)
the lateral size of the inclusion is larger than the beam size.
To remove the assumption (1) and to develop a method for extraction of hydrogen distribution, anal-
yses were performed for the sum-energy spectrum observed with an artificial target which consisted of
four 50 µm thick non-hydrated artificial-quartz disks alternated with five 2.5 µm thick Mylar foils. For
Channel number
Cou
nts
per
chan
nel
250 300 350 400 450 500 5500
50
100
150
Figure 1: A sum energy spectrum obtained by projecting coincidence events along the line of Ele f t +Eright=const.in the two dimensional spectrum.
discussions below, a typical spectrum for the artificial target is displayed in Fig. 1 again. The rightmost
peak is due to the scattering in the Mylar foil covering the beam exit side, while the leftmost peak is caused
by the foil covering the beam entrance side.
The first remarkable feature of this spectrum is that the integrated counts of each peak change in good
approximation in accordance with a simple exponential function of the type of
N(x) = N(0)exp−µ(d−x). (1)
The symbol µ stands for the attenuation coefficient. The second feature is that spaces between the five
peaks are almost same. This implies that the sum energy is proportional to the depth. The third feature is
- 82 -

that the width of peaks becomes wide as the sum energy decreases. The exponential decrease of integrated
counts is in agreement with the result reported by Cohen[2], and is ascribed to the decrease of the detection
efficiency for scattered and recoil protons due to the multiple scattering in the target. Hofsass et al. also
discussed the decrease of coincidence counts on the basis of the multiple scattering[3]. The broadening of
peaks is caused partly by the energy straggling and the intrinsic energy resolution of proton detectors, but
more seriously by the surface roughness of the sample.
The linear relation between the sum energy and the depth was confirmed with a calculation using
Computer code TRIM[4]. The energy broadening was estimated from the spectrum shown in Fig. 1. We
may assume a rectangular hydrogen distribution along the depth in Mylar foils in good approximation. If
we assume the energy broadening to be a Gaussian form, the resultant sum-energy spectrum is given by
convolution of the Gaussian function and the rectangular distribution. The convolution leads to
YM(E)dE =dM
EM2 −EM1Q0
nM
2
[Erf
(EM2 −E√
2σ
)−Erf
(EM1 −E√
2σ
)]dE, (2)
where Erf’s stand for error functions, σ is the standard deviation of the energy broadening, dM is the
thickness of the Mylar foil, nM is the number of hydrogen atoms per unit volume of the Mylar, EM2 and
EM1 are the sum energies at edges of the Mylar and Q0 is the product of integrated beam current I0, the
cross section σ(θ ) of proton-proton scattering at 45 and the effective solid angle dΩ of detectors.
In Fig. 1, the number of channels from the leftmost(lowest) peak to the rightmost(highest) peak is
120, which corresponds to the sample thickness of 200 µm. With this relation, the number of channels
corresponding to 2.5 µm thick Mylar foils becomes 1.5. The energies EM1 and EM2 in eq.(2) were assumed
to be the peak channel minus 0.75 and plus 0.75 channel for each peak. Several calculations of YM(E) in
eq.(2) were repeated to fit the experimental spectrum by adjusting two parameters of σ and a group of all
factors in front of square brackets. Two examples of this fit are shown in Figs. 2 and 3.
350 375 400 425 450 475 500Channel number
0
25
50
75
100
125
150
175
Num
ber
ofco
unts
Figure 2: Fit of the second peak to the error function
350 375 400 425 450 475 500Channel number
0
25
50
75
100
125
150
175
Num
ber
ofco
unts
Figure 3: Fit of the highest peak to the error function
Table 1 summarizes the results of fitting. The parameter σ is a linear function of the channel number
in good approximation. Denoting the parameter σ and its peak energy (peak channel) for the Mylar at the
beam exit surface by σ0 and E0, respectively, the parameter σ at an energy (channel) E is written as
σ(E) = σ01+α(E0 −E) with α = 0.0065. (3)
- 83 -

Table 1: Sammary of the analysis for energy broadening in each peak in Fig. 1
Peak channel number σ σ Peak area Peak area(channel) (realtive) (experiment) (calculation)
362.0 3.9 1.77 1130±34 1080393.5 3.5 1.59 1134±34 1080424.5 3.1 1.41 1140±34 1140454.0 2.6 1.18 1106±33 1110482.0 2.2 1.00 1103±33 1020
The calculation of hydrogen concentration n(x) was carried out in the following manner. The expo-
nential decrease is valid for integrated counts of each peak in Fig. 1, and not strictly valid for the spectrum
itself. However, if the range of the integration is sufficiently narrow, the decrease of counts in the spec-
trum can also be approximated by the same exponential function as the integration. Thus the sum energy
spectrum was assumed to be
Y(E)dE = Q0 n(x) exp−µ(d−x)dx. (4)
Since the sum energy E(x) is a linear function of the depth x, one may express it as
E(x) = E1 +1d(E2 −E1)x, (5)
where E1 and E2 are the energies at x = 0 and x = d. Substituting x in the above equation into eq.(4), one
may write the exponential part as
exp−µ(d−x) = exp
−µ d
E2 −E1· (E2 −E)
. (6)
The equation (4) reduces to
Y (E)dE = Q0 n(E) exp−κ(E2 −E) · dE2 −E1
dE, (7)
with replacements of κ = µd/(E2−E1), dx = d/(E2−E1)dE and n(x) → n(E).
The experimental sum-energy spectrum is the convolution of the above eq.(7) and the Gaussian distri-
bution with the standard deviation σ given by eq.(3). The explicit form is
Y(E)dE =d
E2−E1Q0
×[∫ ∞
0n(E ′) exp−κ(E2−E ′) 1√
2π σexp
−(E −E ′)2
2σ2
dE ′
]dE. (8)
In this integration, the combination of exponents in two exponential functions and subsequent transforma-
tion into a square term after the collection about E ′ result in a new Gaussian function with a mean value
of σ2κ +E. The calculation results in the following formula;
Y (E)dE =d
E2 −E1Q0
[exp−κ(E2−E)
×∫ ∞
0n(E ′) exp
(σ2κ2
2
)1√
2π σexp
−(σ2κ +E −E ′)2
2σ2
dE ′
]dE. (9)
- 84 -

The ratio of d/(E2 − E1) can be obtained from eq.(5) to be (dE(x)/dx)−1, but this is confusing with
stopping power. The following notation, therefore, will be used below;
dE(x)dx
−→(
δEδx
)S. (10)
The attached letter ”S” means different samples. The final expression for the sum-energy spectrum is
given by
Y (E)dE = Q0
(δEδx
)−1
S
[exp−κ(E2 −E)
×∫ ∞
0n(E ′) exp
(σ2κ2
2
)1√
2π σexp
−(σ2κ +E −E ′)2
2σ2
dE ′
]dE. (11)
Numerical calculations of hydrogen concentration n(x) started with the above eq.(11). A raw exper-
imental spectrum was corrected for background suntraction and data smoothing by three-point moving
averages. After the correction, the number of counts in each channel was multiplied by expκ(E2−E),
where E2 was taken to be the highest peak channel number. The energy E was converted to each channel
number. The validity of this treatment is easily understood in eq.(11), since exp−κ(E2 −E) in the
square bracket is independent of the integral variable E ′. The number of counts in each channel of this
corrected spectrum is written as
N(E j) = expκ(E2−E)Y(E)∆E
=Q0
(δEδx
)−1
S
[∫ ∞
0n(E ′) exp
(σ2κ2
2
)1√
2π σexp
−(σ2κ +Ej −E ′)2
2σ2
dE ′
]∆E. (12)
Here, ∆E is the energy corresponding to the width of the window of a pulse height analyzer. The hydrogen
concentration n(E ′) is in general continuous. In the numerical calculation, however, the sample was
divided into M thin layers. It was also assumed that the concentration n(E ′i) in the i-th layer was constant.
Then, the above integration was replaced by the following sum;[M
∑i=1
n(E ′i)
∫ E′i+∆E′
E′i
exp
(σ2κ2
2
)1√
2π σexp
−(σ2κ +Ej −E ′)2
2σ2
dE ′
]∆E. (13)
Since the above integration is characterized by Ej and E ′i , eq.(12) can be expressed as
N(E j) ∝M
∑i=1
n(E ′i)∆E F(E j,E
′i), (14)
where we put the integral simply to F(E j,E′i). The values of n(E ′
i)∆E were derived from chi-square mini-
mization by Marquardt method[5]. The result is displayed in Fig. 4. The concentration of the lowest peak
is split into two parts. Since the number of division is 35 and the thickness of one layer is 6.23 µm, this
splitting is too wide in comparison with the thickness of Mylar foils. Two depths corresponding to higher
energy peaks shift by 6.7 and 13 µm. In Fig. 5, the spectrum calculated from the extracted hydrogen
distribution is compared with the experimental spectrum. The calculated spectrum is in reasonable agree-
ment with the experimental data. The value of chi square is about 250. The number of the data is 138
- 85 -

and the degree of freedom is 131-35=96, so that the chi square is about three times as large as an optimal
value of 96. In spite of the shifts of the extracted concentration for higher two peaks, the corresponding
peaks in the calculated spectrum exhibit rather good agreement. Further works are necessary although the
present analysis is qualitatively reasonable.
Depth in units of microns
Rel
ativ
e co
ncen
trat
ion
0 50 100 150 2000
50
100
150
200
250
300
350
Figure 4: Hydrogen distrubution extracted from thespectrum shown in Fig. 1.
360 380 400 420 440 460 480Channel number
0
25
50
75
100
125
150
175
Num
ber
ofco
unts
Figure 5: Comparison of the spectrum calculated withthe extracted distrubution with the experimental spec-trum.
References
[1] K. Furuno, M. Kurosawa, H. Ohsima, T. Komatsubara, K. Sasa, Y. Yamato and N. Kawachi,
Measurement of hydrogen concentration in thick mineral or rock samples, Nucl. Instr. and Meth. in
Phys. Res. B, (in press).
[2] B.L. Cohen, C.L. Fink, J.H. Degnan, Jour. Appl. Phys. Vol. 43, No.1 (1972) 19-25.
[3] H.C. Hofsass, N.R. Parkith, M.L. Swanson, W.-K. Chu, Nucl. Instr. Meth. B45 (1990) 151-156.
[4] J.P. Biersack and J.F. Ziegler, Computer code TRIM.
[5] P.R. Bevington and D.K. Robinson, Data Reduction and Error Analysis for the Physical Sciences, 2nd
ed., MacGraw-Hill Inc., 1992.
- 86 -
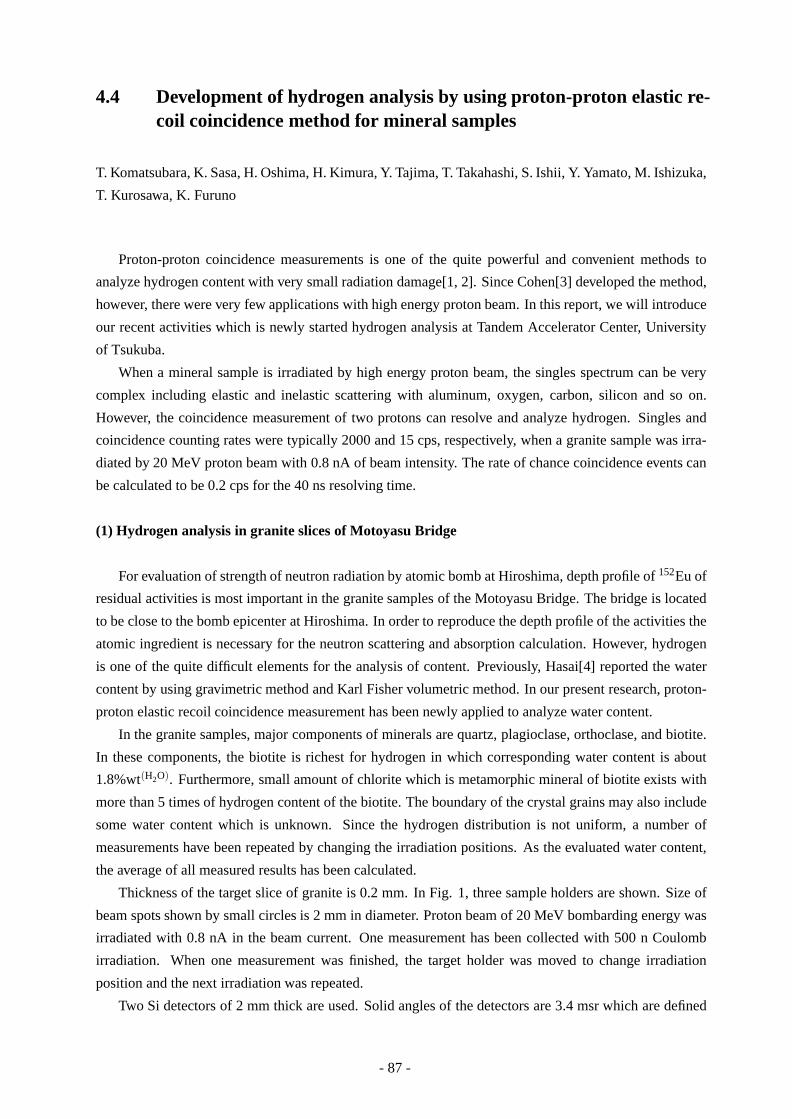
4.4 Development of hydrogen analysis by using proton-proton elastic re-coil coincidence method for mineral samples
T. Komatsubara, K. Sasa, H. Oshima, H. Kimura, Y. Tajima, T. Takahashi, S. Ishii, Y. Yamato, M. Ishizuka,
T. Kurosawa, K. Furuno
Proton-proton coincidence measurements is one of the quite powerful and convenient methods to
analyze hydrogen content with very small radiation damage[1, 2]. Since Cohen[3] developed the method,
however, there were very few applications with high energy proton beam. In this report, we will introduce
our recent activities which is newly started hydrogen analysis at Tandem Accelerator Center, University
of Tsukuba.
When a mineral sample is irradiated by high energy proton beam, the singles spectrum can be very
complex including elastic and inelastic scattering with aluminum, oxygen, carbon, silicon and so on.
However, the coincidence measurement of two protons can resolve and analyze hydrogen. Singles and
coincidence counting rates were typically 2000 and 15 cps, respectively, when a granite sample was irra-
diated by 20 MeV proton beam with 0.8 nA of beam intensity. The rate of chance coincidence events can
be calculated to be 0.2 cps for the 40 ns resolving time.
(1) Hydrogen analysis in granite slices of Motoyasu Bridge
For evaluation of strength of neutron radiation by atomic bomb at Hiroshima, depth profile of 152Eu of
residual activities is most important in the granite samples of the Motoyasu Bridge. The bridge is located
to be close to the bomb epicenter at Hiroshima. In order to reproduce the depth profile of the activities the
atomic ingredient is necessary for the neutron scattering and absorption calculation. However, hydrogen
is one of the quite difficult elements for the analysis of content. Previously, Hasai[4] reported the water
content by using gravimetric method and Karl Fisher volumetric method. In our present research, proton-
proton elastic recoil coincidence measurement has been newly applied to analyze water content.
In the granite samples, major components of minerals are quartz, plagioclase, orthoclase, and biotite.
In these components, the biotite is richest for hydrogen in which corresponding water content is about
1.8%wt(H2O). Furthermore, small amount of chlorite which is metamorphic mineral of biotite exists with
more than 5 times of hydrogen content of the biotite. The boundary of the crystal grains may also include
some water content which is unknown. Since the hydrogen distribution is not uniform, a number of
measurements have been repeated by changing the irradiation positions. As the evaluated water content,
the average of all measured results has been calculated.
Thickness of the target slice of granite is 0.2 mm. In Fig. 1, three sample holders are shown. Size of
beam spots shown by small circles is 2 mm in diameter. Proton beam of 20 MeV bombarding energy was
irradiated with 0.8 nA in the beam current. One measurement has been collected with 500 n Coulomb
irradiation. When one measurement was finished, the target holder was moved to change irradiation
position and the next irradiation was repeated.
Two Si detectors of 2 mm thick are used. Solid angles of the detectors are 3.4 msr which are defined
- 87 -

by φ4 slits located at 61 mm from the target. In order to reduce edge scattering from the slits buffer slits
were located just in front of the Si detectors. Distance from the slit to buffer slit is 66 mm.
As an example of the coincidence measurements, sum-energy spectrum is shown in Fig. 2(a) where
the irradiation point could be biotite. In this spectrum, the scattering yield decreases as the energy loss
increases, because a secondary scattering occurs when the recoils pass through rest of the sample target.
The decreasing yield is calculated by simple exponential function as
Y (x) = Y0e−µx
where x denotes distance from exit surface which corresponds to the energy loss. The reduction of the
yield can be observed by using mylar foils attached on both entrance and exit surfaces of the granite sam-
ple as shown in Fig. 2(c). Since stopping power is rather constant in this energy region, the observed
energy loss which is a shift of channels from the high energy edge can be considered as the depth. The
coefficient µ ′ can be calculated as
µ ′ =− log Yin
Yout
Iout − Iin
in a unit of [1/channel] where Yin and Yout denote observed yields from the mylar foils of entrance and exit
surfaces shown at Iin and Iout in the Fig. 2(c), respectively. The measured spectrum Y (I) is restored for the
reduction of the secondary scattering as shown in Fig. 2(b) by using a formula;
Ymod(I) = Y (I)×eµ ′(Iout−I)
where a flat distribution of depth profile is observed.
In the following analysis, depth profile is considered as flat. The measured spectra is integrated and
multiplied by a factor f ;
f =− loga1−a
a =Yin
Yout
to correct the secondary scattering.
By changing irradiation positions, 44 measurements have been done in which each irradiation charge
of the beam is 5.0 × 10⁻⁷ Coulomb. The yield of the coincidence events are widely distributed from
a few hundred to the thousands as shown in Fig. 3. Lower part of this distribution can be attributed to
quartz. Higher counts can be explained with existence of chlorite. The average of these measurements is
1900 ± 700 counts where the uncertainty is account as 2 σ level from consideration of unexpected local
concentration of hydrogen.
For the calibration of the scattering yield, standard materials were also irradiated. Measured results are
shown in Table 1 where surface densities of corresponding water(H2O) are shown instead of hydrogen(H).
- 88 -

Calibration factor is determined as 25.7 ± 2.3 counts for 5.0 × 10⁻⁷ Coulomb irradiation on 1 µg/cm2
water content. Reduction factor for the secondary scattering is evaluated to be 2.07 ± 0.04 from the mylar
measurements. Surface density of water is deduced as 153 ± 58 µg/cm2 (H2O). If we use a density of
granite reported as 2.64 g/cm3[4], corresponding water content is evaluated as 0.29 ± 0.11 % wt (H2O).
This result is consistent with previous report[4].
(2) Hydrogen analysis for inclusions in quartz with a micro beam
In geological science, hydrogen analysis of fluid inclusion or glass inclusion in mineral samples is
very important for study of magma. Since size of these inclusions are less than several hundred micro
meter, nondestructive analysis with micro beam system is quite valuable. The proton proton coincidence
spectrometry has been extended by using the micro beam system developed at UTTAC[6] to focus on the
inclusions in mineral samples.
For the measurements of the proton proton coincidence, two Si detectors were installed in the focus
point of the micro beam facility. Quartz samples of 200 µm in thickness were irradiated. For the detection
of the coincidence, the Si detectors of 2mm in thickness are placed at ±45 with respect to the beam axis.
Defining slits of 3.5 mm in diameter are located in front of the detectors. The distance from the target to
the slit is 17.7 mm. Solid angles of the detectors are 30.7 msr. Coincidence time window was adjusted to
be 40 nsec by using TAC module.
In order to hold small samples, kapton foils of 1.08±0.02mg/cm2 (266±5µg/cm2(H2O)) are used with-
out any glue. Proton yields from the kapton foils are also available for calibration of the scattering yield
and correction of the reduction by the secondary scattering.
In Fig. 4, a photograph of a quartz sample is shown. The origin of the quartz sample is Enda, Zao
in Fukushima prefecture. Size of the sample is nearly 5mm square and 200 µm in thickness. A glass
inclusion of 300 µm in diameter is located nearly the center of the quartz with substructures. The sample
is irradiated by a micro beam of 30 µ m in diameter by changing irradiation points. In Fig.5 hydrogen
distributions are shown as the results of the irradiation by using micro beam scanning method.
Furthermore, the sample is irradiated by a beam whose spot size is the same as the size of the inclu-
sion. A measured spectrum is shown in Fig. 6 with estimated levels of weight ratio of corresponding water
content. The estimated yield corresponding to one weight percent of water content can be calculated as
H1% =ρ [g/cm3] · t[µm] ·Yout
σ(Kapton)[µg/cm2(H2O)] · (Iout − Iin)
where ρ and t denote density and thickness of the sample, respectively.
The target position is controlled by a three-axis manipulator. When we measured yield with changing
the target position along to the beam axis, strong reduction of the coincidence yield was observed, as
shown in Fig. 7. When we move the target about 0.5 mm from the center of the proton detection system,
coincidence yield has been reduced to be 80%. When geometrical relation of the detected two protons is
considered, the area of the solid angle is estimated to overlap of two circles shown in Fig. 8. The reduction
of the detection area is calculated with following formula as a function of z;
- 89 -
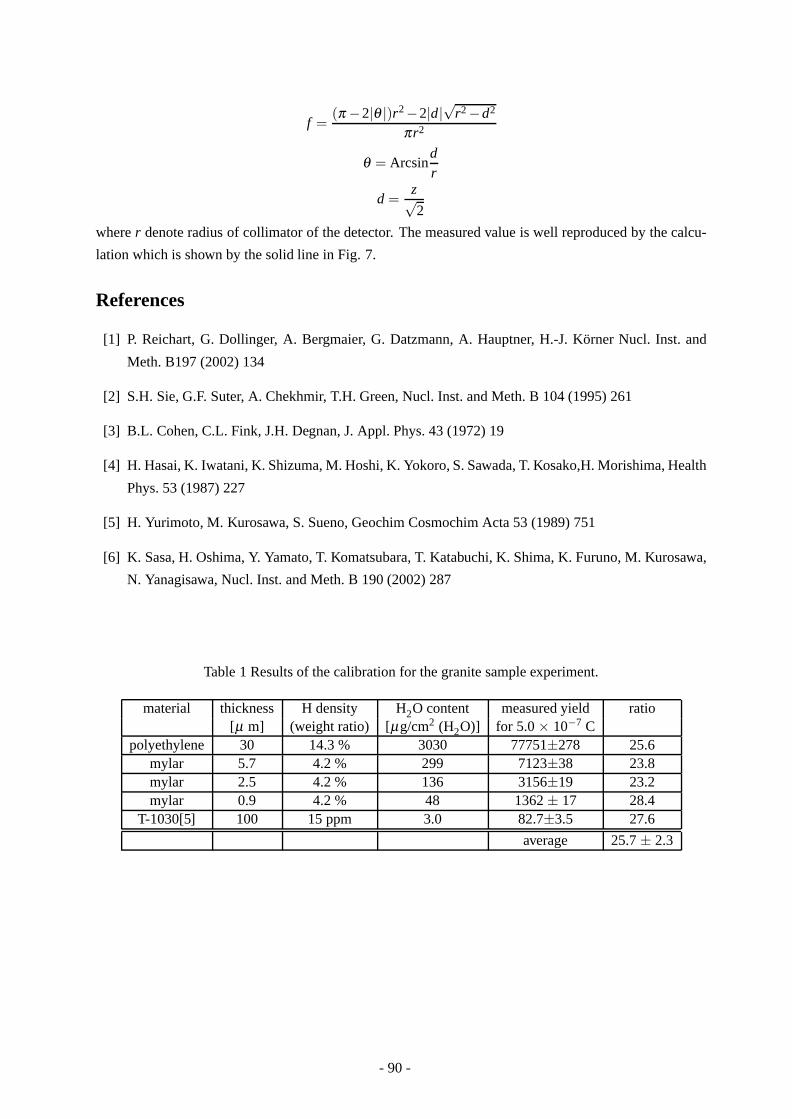
f =(π −2|θ |)r2−2|d|√r2 −d2
πr2
θ = Arcsindr
d =z√2
where r denote radius of collimator of the detector. The measured value is well reproduced by the calcu-
lation which is shown by the solid line in Fig. 7.
References
[1] P. Reichart, G. Dollinger, A. Bergmaier, G. Datzmann, A. Hauptner, H.-J. Korner Nucl. Inst. and
Meth. B197 (2002) 134
[2] S.H. Sie, G.F. Suter, A. Chekhmir, T.H. Green, Nucl. Inst. and Meth. B 104 (1995) 261
[3] B.L. Cohen, C.L. Fink, J.H. Degnan, J. Appl. Phys. 43 (1972) 19
[4] H. Hasai, K. Iwatani, K. Shizuma, M. Hoshi, K. Yokoro, S. Sawada, T. Kosako,H. Morishima, Health
Phys. 53 (1987) 227
[5] H. Yurimoto, M. Kurosawa, S. Sueno, Geochim Cosmochim Acta 53 (1989) 751
[6] K. Sasa, H. Oshima, Y. Yamato, T. Komatsubara, T. Katabuchi, K. Shima, K. Furuno, M. Kurosawa,
N. Yanagisawa, Nucl. Inst. and Meth. B 190 (2002) 287
Table 1 Results of the calibration for the granite sample experiment.
material thickness H density H2O content measured yield ratio[µ m] (weight ratio) [µg/cm2 (H2O)] for 5.0 × 10⁻⁷ C
polyethylene 30 14.3 % 3030 77751±278 25.6mylar 5.7 4.2 % 299 7123±38 23.8mylar 2.5 4.2 % 136 3156±19 23.2mylar 0.9 4.2 % 48 1362 ± 17 28.4
T-1030[5] 100 15 ppm 3.0 82.7±3.5 27.6
average 25.7 ± 2.3
- 90 -
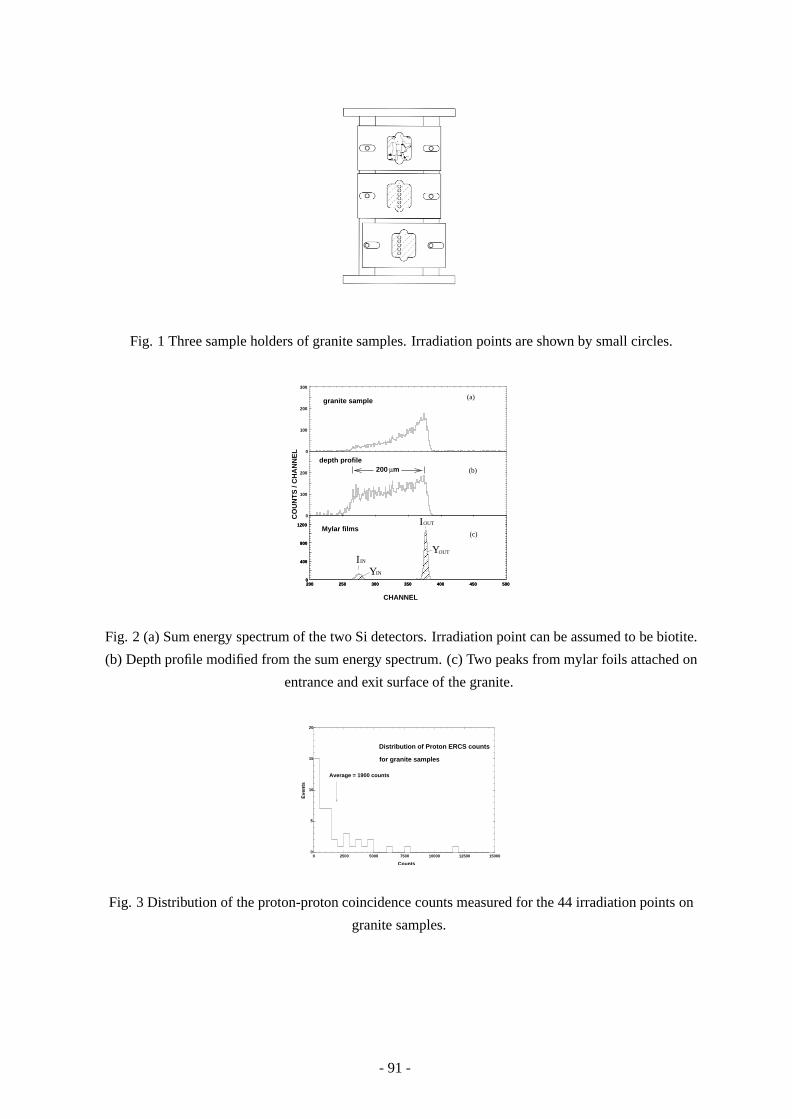
Fig. 1 Three sample holders of granite samples. Irradiation points are shown by small circles.
(a)
(c)
INYINI
YOUT
OUTICO
UN
TS
/ C
HA
NN
EL
CHANNEL
(b)
granite sample
Mylar films
mµ200depth profile
0
100
200
300
0
100
200
200 250 300 350 400 450 5000
400
800
1200
200 250 300 350 400 450 5000
400
800
1200
Fig. 2 (a) Sum energy spectrum of the two Si detectors. Irradiation point can be assumed to be biotite.
(b) Depth profile modified from the sum energy spectrum. (c) Two peaks from mylar foils attached on
entrance and exit surface of the granite.
Distribution of Proton ERCS counts
for granite samples
Counts
Eve
nts
Average = 1900 counts
0
5
10
15
20
2500 5000 7500 10000 12500 150000
Fig. 3 Distribution of the proton-proton coincidence counts measured for the 44 irradiation points on
granite samples.
- 91 -

Fig. 4 Picture of quartz sample
Sample : Enda 14
Beam spot : 30 micro m
0
100
200
300
400
500
0
100
200
300
400
0
100
200
300
400
0
100
200
300
400
300 400 500 600 700
0
100
200
300
400
0
300 400 500 600 700
0
100
200
300
400
300 400 500 600 700 400 500 600 700 800300
400 500 600 700 300 400 500 600 700 800
400 500 600 700 800
Fig. 5 Depth profiles measured by a micro beam of 30 µ m in diameter.
10%
5%
Enda #14
beam spot : 150 mirco m
0 200 400 600 800 1000
0
50
100
150
200
250
300
350
Fig. 6 Measured depth profile for the same sample of Fig. 5 by using 150 µm micro beam. The size of
the beam is nearly same as the glass inclusion. Estimated levels of water content are shown by lines.
- 92 -
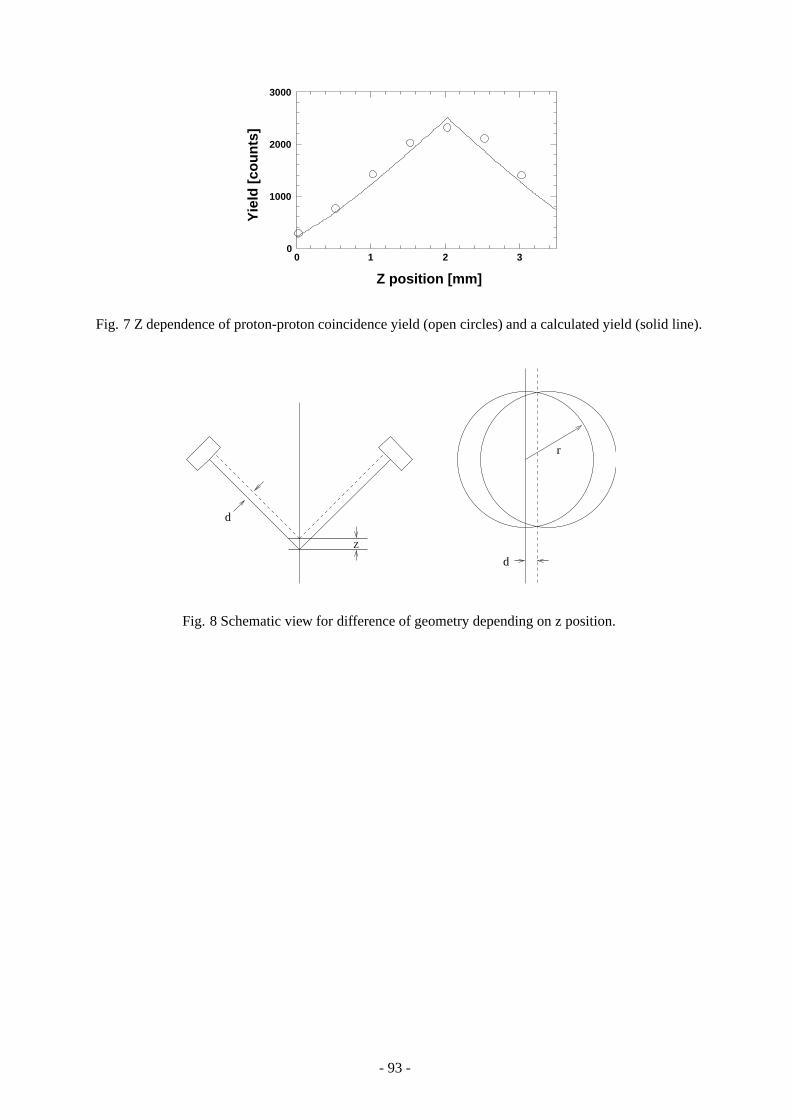
Yie
ld [
cou
nts
]
Z position [mm]
0
1000
2000
3000
0 1 2 3
Fig. 7 Z dependence of proton-proton coincidence yield (open circles) and a calculated yield (solid line).
d
d
Z
r
Fig. 8 Schematic view for difference of geometry depending on z position.
- 93 -

4.5 Status of Tsukuba AMS system
Y. Nagashima, R. Seki, T. Takahashi, T. Matsuhiro, K. Sasa, K. Sueki, T. Usui, K. Bessho, H. Matsumura,
T. Miura, Q. Wang, and K. Masumoto
The molecular pilot beam method we have developed is a principal of our AMS system.
Applying this method to our traditional big, 12MV acceleration voltage, Pelletron tandem accelerator, we
have realized successfully an accelerator mass spectrometry (AMS) without any modifications on the
tandem system.
In this year, AMS group has made great efforts towards achieving higher precision and
reproducibility on the 36
Cl measurements as well as several 36
Cl AMS measurements. As one of the
instrumental improvements, two beam profile monitors are prepared and are going to install into both an
exit of an AMS ion-source and the first focus point of an AMS beam line for 36
Cl particle detection. The
installation work is still going on. These beam profile monitors help us to find the optimum parameters of
the optical elements that construct the AMS system and to realize stable 36
Cl measurement.
In order to improve the stability of beam transportation in the accelerator, an inner diameter of a
charge exchange system at a high-voltage terminal section has been expanded. It was about 5mm in
effective diameter. This was too small to get enough stability in beam transportation because the estimated
beam diameter is about 7mm at the terminal section. As a preliminary result of the test experiment, it is
confirmed that the diameter of it is extended to about 10mm. It is expected that we can see a flattop
characteristics with a few mm flat and the reproducibility of the AMS measurements is improved.
A new room for a sample preparation has been opened. A powerful air-conditioning system
keeps the room condition dry. Humidity is constantly controlled under 40% even if the rainy season. A
small room is constructed in this room. The small room is keeping as clean as possible as well as dry. So,
the room has own air-conditioning system and is well shielded. The room air is only ventilated through a
ventilator with a HEPA filter system. A filling up in a target holder with samples such as AgCl is
performed in this clean room. In order to eliminate contamination at the sample preparation stages, an
ultra-pure-water system has been introduced. All of the lab-wares are rinsed with the ultra-pure-water as
well as the cleaning with an acid and an alkali solution.
It was estimated that the error of the calculated 36
Cl to Cl ratio of the standard material is to be
small enough, but we had not yet confirmed. So, this year, we tried to ensure the accuracy of our current
standards by comparing with other standards [1]. As a final conclusion of this study, we decided to change
a current standard to a new Tsukuba standard with 4.47x10⁻¹¹ of 36
Cl to Cl ratio because it is clearly
demonstrated that the current standards have a large error, about 17%.
In order to investigate the influence of nuclear power plants on an environment, 36
Cl in soils was
continuously studied. The 36
Cl is very suitable isotope to see the long-term environmental changes due to
such human activities as man made nuclear activities because of both its very long half-life of about 0.3
million years and very low natural abundance less than 10-14
in the ratio of 36
Cl to 35
Cl. In the last year, we
- 94 -

clearly demonstrated that the ratio of 36
Cl to 35
Cl of Tokai samples are 10 - 100 times as large as that of
Tsukuba samples, and that the ratios in the coastal area were much higher than those in the inland area.
Many facilities for nuclear research and plant are constructed and are operated in the coastal area of Tokai
village, but not so many in the inland area. In order to understand the origin of this high ratio of 36
Cl/Cl,
we continue to measure the 36
Cl contents in many samples taken from Hiroshima, Mie and Fukui
prefecture. These samples also contain a lot of Sulfur contamination. We are trying to remove this by
several chemical procedures with which we expect high reduction efficiency.
The 36
Cl density induced in shielding concretes is going to be measured by the KEK and
Tsukuba joint group. Up to now, various shielding concretes that were used in PS counter hall in KEK, in
SF cyclotron room in INS, Tokyo University and in LINAC room in LNS, Tohoku University are sampled
and measured [2]. The density of 36
Cl in the shielding concrete is rather strong because 36
Cl has a very
long half-life of 3x10⁵
year. It is generally too strong to measure by Tsukuba AMS. So, silver-chloride
samples are diluted by a suitable amount of ultra pure silver-chloride reagent.
The DS86 dosimetry system has been used for survivors of the Hiroshima and Nagasaki atomic
bombs since 1987. In the thermal neutron evaluation, a systematic discrepancy has been observed between
152
Eu data measured by Shizuma and Nakanishi and the calculation based on the DS86. As one of the
contribution to understand the source of the discrepancy, the measurements of 36
Cl in granite samples has
been commenced with the Tsukuba AMS system. Seventeen bombed granite samples were chosen and
analyzed. These granites are sampled at the location of 146 - 1400m distance from hypo-center. In
addition to the bombed granites, 7 un-bombed granite samples were prepared for background estimation
because36
Cl was also created in the granite itself as an in-situ formation. Each granite sample was
separated into 4 blocks and each block was sent to 4 laboratories. One laboratory at Kanazawa takes the
responsibility for 152
Eu measurement. Remaining 3 laboratories, Tsukuba, Munchen (Ruehm) and Utah
(Straume), bear the responsibility for 36
Cl measurement. The ratios of 36
Cl to 35
Cl of 14 samples have been
measured. It seems that there is little discrepancy between the DS86 calculation and the 36
Cl measurement.
Munchen and Utah have also measured the same samples we measured.
A new dosimetry system named DS02, Dosimetry System 2002, has been developed and
released this year [3]. The 36
Cl data play very important roles in this development stage. Especially, the
36
Cl data clearly settle the systematic discrepancy between 152
Eu γ data and DS86 calculation. All of the
36
Cl and 152
Eu data measured at four laboratories are shown in Fig.1. The results of our 36
Cl measurements
are consistent with the results of the other three laboratories. And also, the DS02 calculation nicely
reproduces the results of four laboratories.
References
[1] T. Matsuhiro, et.al., 3.33, UTTAC (2202).
[2] K.Bessho, et.al., 3.34, UTTAC (2002).
[3] R.Young, et.al., Dosimetry System 2002, (2003), In Press.
[4] Y.Nagashima et.al., Joint Meeting of U.S.-Japan Dosimetry Working Groups, (2001).
- 95 -
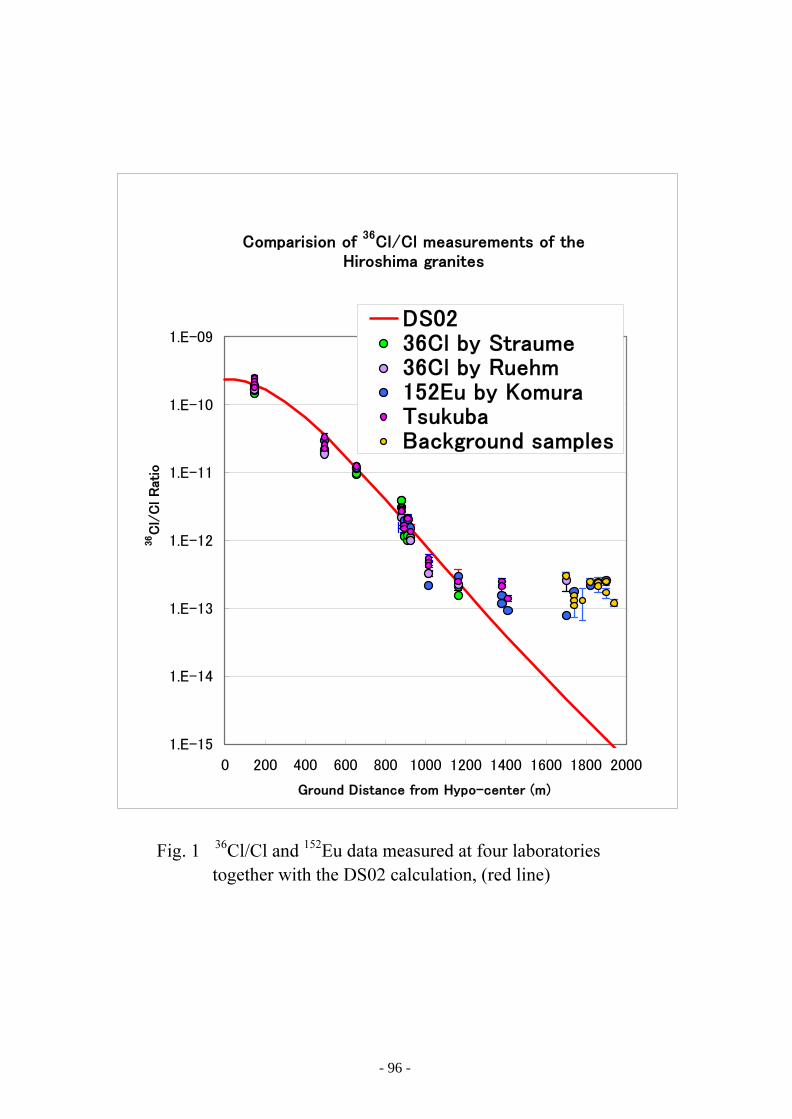
Fig. 1 36
Cl/Cl and 152
Eu data measured at four laboratories
together with the DS02 calculation, (red line)
!
- 96 -

4.6 Comparison of Cl-36 standard samples
T. Matsuhiro, R. Seki, Y. Nagashima, T. Takahashi, K. Sasa, K. Sueki, T. Usui, T. Miura1
, K. Bessho1
,
H. Matsumura1
, K. Masumoto1
, Q. Wang1
A36
Cl standard material plays a very important role in our 36
Cl AMS measurements because the
Tsukuba AMS system relies strongly on the accuracy of the standard materials to keep a reliability of the
36
Cl experimental result. The standard materials we are using were prepared with thermal neutron
absorption of 35
Cl material. Chrolide-Anmonium reagent, NH4Cl, was irradiated with neutron in a nuclear
reactor of JAERI in 1995 and was diluted with NH4Cl reagent. The error of the calculated
36
Cl to Cl ratio
is estimated to be small enough, but we had not yet confirmed it. So, this year, we tried to ensure the
accuracy of our current standards by comparing with other standards.
Two kind of new standard materials are prepared for this confirmation. One is the diluted material of
a36
Cl standard reference which is distributed commercially from National Institute of Standards and
Technology, USA. Another one is the standard samples prepared by Dr. Nishiizum, University of
California, Berkley. The Nishiizumi standards are used at more than half of AMS laboratories in the world
because the accuracy is well controlled and is keeping high reliable state. These new standards and the
current Tsukuba standards are listed in Table 1.
The36
Cl to Cl ratio measurements of the new standards have been alternated with the same
measurement of a current one. The 36
Cl to Cl ratio of current one is calculated at 1.52x10⁻¹²
. Therefore, the
ratio of the 36
Cl to Cl ratio of new one to the same of current one, which is interesting in this study, can be
extracted. The results are shown in Fig. 1.
Three kind of the current standard samples, marked with green triangle, are focused on a line of ratio
1. It is difficult to say that the calculated ratios, 36
Cl/Cl = 1.89x10⁻¹¹
, 1.52x10⁻¹²
and 1.52x10⁻¹³
, are
absolutely correct, but it is clearly demonstrated that the calculated ration represents the relative ratio
between these three standards. On the other hand, all new Tsukuba, red cycles, and Nishiizumi standards,
blue rhombs, except one Nishiizumi (36
Cl/Cl = 5.00x10⁻¹³
standard) are well centered on a line of ratio 1.2
(see Fig. 1). It is obvious that there is some difference in ratio estimation between the current standards
and the others. In due consideration of the accuracy of Nishiizumi standards, it becomes clear that the
calculated ratios of the current standards are overestimated. On the average, the true 36
Cl to Cl ratios of the
current standards are about 17% smaller than the calculated values.
As a conclusion of the comparison measurements of several 36
Cl standards, we decided to change the
standard material that is used in the Cl -36 AMS measurement. Both new Tsukuba standards and
Nishiizumi standards have no big difference in the accuracy of 36
Cl/Cl ratio estimation. So, as a new
current standard, the new Tsukuba standard having 4.47x10⁻¹¹
value of the 36
Cl to Cl ratio has been
selected. Furthermore, in order to ensure the accuracy of the current standard, comparison measurement of
the current standard and the Nishiizumi standard with the ratio of 1.00x10⁻¹¹
will be regularly scheduled.
1
High Energy Accelerator Research Organization
- 97 -
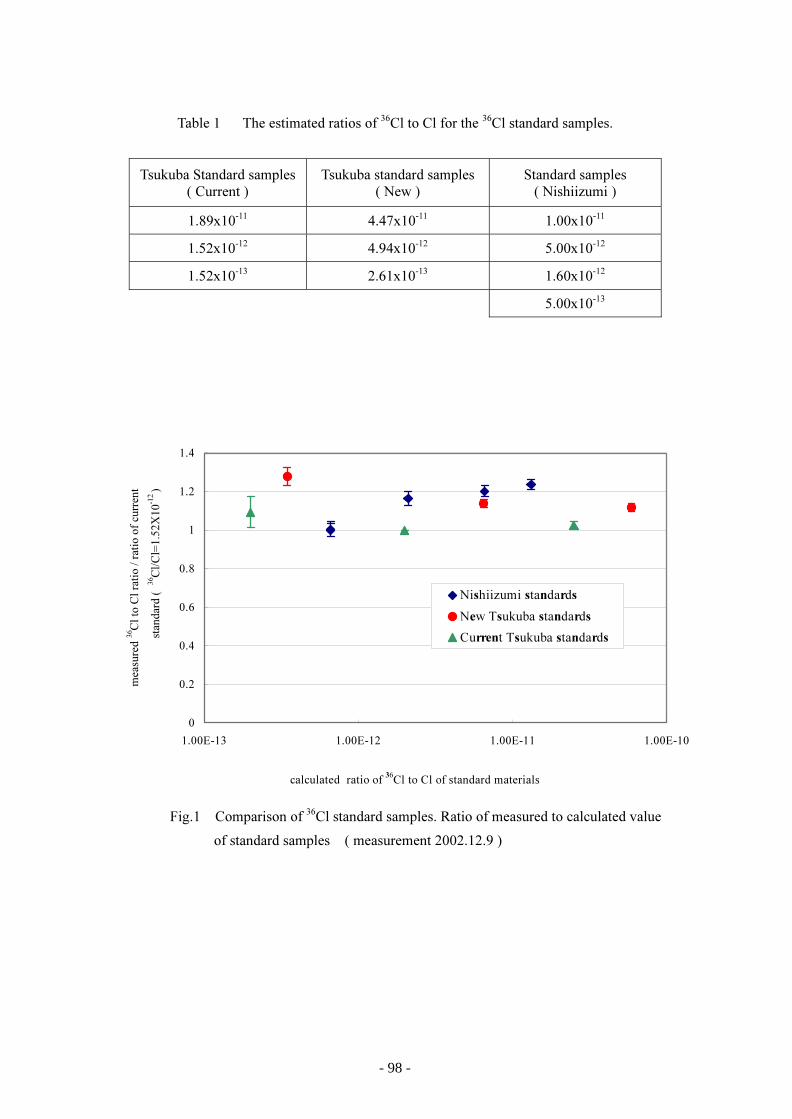
Table 1 The estimated ratios of 36
Cl to Cl for the 36
Cl standard samples.
Tsukuba Standard samples
( Current )
Tsukuba standard samples
( New )
Standard samples
( Nishiizumi )
1.89x10⁻¹¹
4.47x10⁻¹¹
1.00x10⁻¹¹
1.52x10⁻¹²
4.94x10⁻¹²
5.00x10⁻¹²
1.52x10⁻¹³
2.61x10⁻¹³
1.60x10⁻¹²
5.00x10⁻¹³
Fig.1 Comparison of 36
Cl standard samples. Ratio of measured to calculated value
of standard samples ( measurement 2002.12.9 )
0
0.2
0.4
0.6
0.8
1
1.2
1.4
1.00E-13 1.00E-12 1.00E-11 1.00E-10
calculated ratio of
36
Cl to Cl of standard materials
measured
36
Cl to C
l ratio / ratio of current
standard ( 36
Cl/C
l=
1.52X
10-12
)
Nishiizumi standards
New Tsukuba standards
Current Tsukuba standards
- 98 -

4.7 Measurement of 36
Cl induced in shielding concrete of various
accelerator facilities using AMS
K. Bessho1
, H. Matsumura1
, T. Miura1
, Q. Wang1
, K. Masumoto1
, T. Matsuhiro, Y. Nagashima, R. Seki,
T. Takahashi, K. Sasa, T. Usui and K. Sueki
At the accelerator facilities, shielding concrete of beam lines is exposed to secondary neutron,
and various long-lived radionuclides, such as 3
H,22
Na,36
Cl,54
Mn, 60
Co, 152
Eu and 154
Eu are accumulated.
Quantitative evaluation of radionuclides induced in the shielding concrete is important for radioactive
waste management in reconstruction or decommissioning of accelerator facilities. The above
radionuclides except for 36
Cl can be easily measured by Ge detectors for γ-emitters and liquid scintillation
counters for 3
H, respectively [1]. On the other hand for measuring low concentration of 36
Cl, accelerator
mass spectrometry (AMS) is advantageous because of extremely high sensitivity.
The AMS system constructed in the 12UD tandem accelerator of UTTAC has been applied to
36
Cl analysis in soil and concrete samples related to Hiroshima atomic bomb, JCO critical accident, and
other environmental samples. Chemical procedure for preparing an AgCl target has been investigated
and established [2]. However, 36
Cl / 35
Cl
ratios in shielding concrete of various
accelerators are considered to be higher than
the appropriate range for the UTTAC 36
Cl
AMS system ( 10-10
- 10-13
). Therefore,
dilution of isotope ratios is necessary for
36
Cl analysis in shielding concrete samples
by the UTTAC AMS system. Fig. 1 shows
the sample preparation scheme developed
for36
Cl AMS measurement of shielding
concrete. A part of Cl contained in
concrete samples was extracted into dilute
nitric acid by heating in pressurized
decomposition vessel, and the concentration
of the eluted Cl in the solution was
determined by ion chromatography. The
36
Cl / 35
Cl ratios were diluted by addition of
36
Cl free ( 36
Cl / 35
Cl below 5x10-14
) NaCl
solution. Precipitation of AgCl was formed
by addition of AgNO3 solution and purified
according to the method developed [2].
1
Radiation Science Center, High Energy Accelerator Research Organization
Concrete sample 1- 5 g
0.01 MHNO3 10 ml
Heating in pressurized decomposition vessel ( 130°C, 18h )
Solution Residue
13MHNO3 0.1 ml
30%H2O2 1 ml
Determination of Cl by ion chromatography
NaCl solution ( Cl free )
AgNO3 solution
Solution Precipitation (AgCl)
Purification
AMS target
Centrifugation
Fig. 1 Sample preparation scheme for Cl AMS
measument of shielding concrete of accelerators.
[2]
36
36
- 99 -
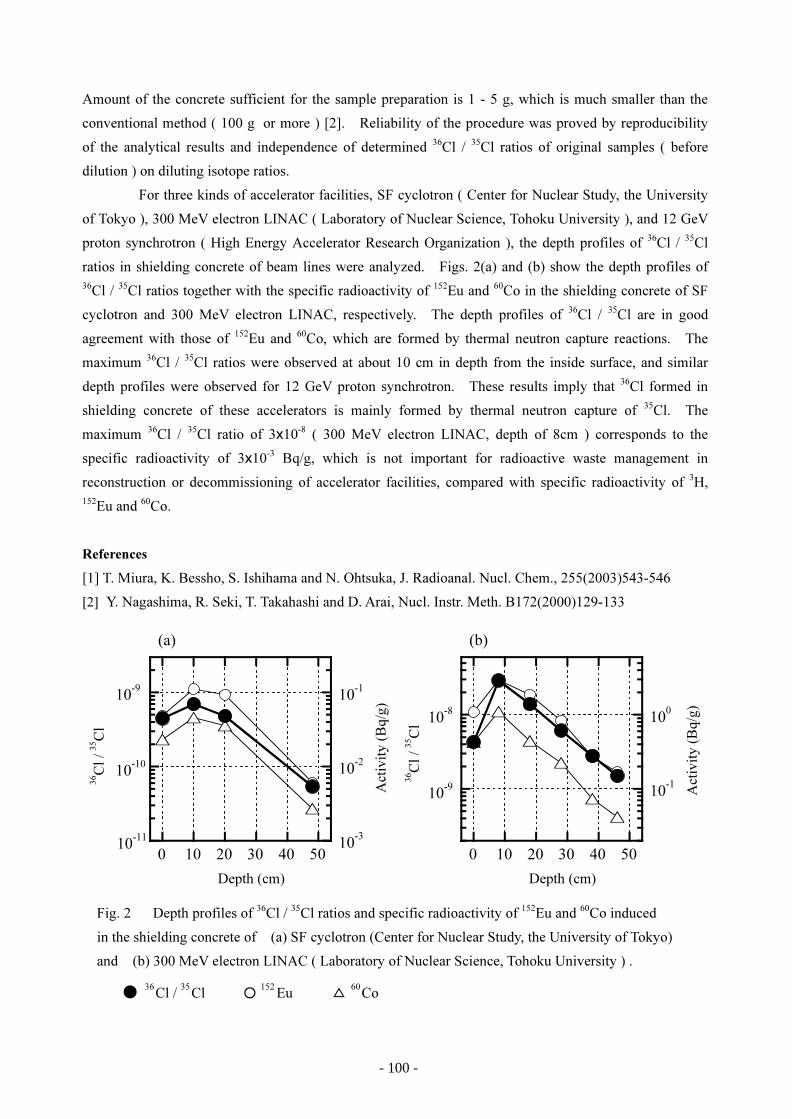
Amount of the concrete sufficient for the sample preparation is 1 - 5 g, which is much smaller than the
conventional method ( 100 g or more ) [2]. Reliability of the procedure was proved by reproducibility
of the analytical results and independence of determined 36
Cl / 35
Cl ratios of original samples ( before
dilution ) on diluting isotope ratios.
For three kinds of accelerator facilities, SF cyclotron ( Center for Nuclear Study, the University
of Tokyo ), 300 MeV electron LINAC ( Laboratory of Nuclear Science, Tohoku University ), and 12 GeV
proton synchrotron ( High Energy Accelerator Research Organization ), the depth profiles of 36
Cl / 35
Cl
ratios in shielding concrete of beam lines were analyzed. Figs. 2(a) and (b) show the depth profiles of
36
Cl / 35
Cl ratios together with the specific radioactivity of 152
Eu and 60
Co in the shielding concrete of SF
cyclotron and 300 MeV electron LINAC, respectively. The depth profiles of 36
Cl / 35
Cl are in good
agreement with those of 152
Eu and 60
Co, which are formed by thermal neutron capture reactions. The
maximum 36
Cl / 35
Cl ratios were observed at about 10 cm in depth from the inside surface, and similar
depth profiles were observed for 12 GeV proton synchrotron. These results imply that 36
Cl formed in
shielding concrete of these accelerators is mainly formed by thermal neutron capture of 35
Cl. The
maximum 36
Cl / 35
Cl ratio of 3x10⁻⁸
( 300 MeV electron LINAC, depth of 8cm ) corresponds to the
specific radioactivity of 3x10⁻³
Bq/g, which is not important for radioactive waste management in
reconstruction or decommissioning of accelerator facilities, compared with specific radioactivity of 3
H,
152
Eu and 60
Co.
References
[1] T. Miura, K. Bessho, S. Ishihama and N. Ohtsuka, J. Radioanal. Nucl. Chem., 255(2003)543-546
[2] Y. Nagashima, R. Seki, T. Takahashi and D. Arai, Nucl. Instr. Meth. B172(2000)129-133
Fig. 2 Depth profiles of 36
Cl / 35
Cl ratios and specific radioactivity of 152
Eu and 60
Co induced
in the shielding concrete of (a) SF cyclotron (Center for Nuclear Study, the University of Tokyo)
and (b) 300 MeV electron LINAC ( Laboratory of Nuclear Science, Tohoku University ) .
36
Cl /
35
Cl
152
Eu
60
Co
(b)(a)
0 10 20 30 40 50
10
-1
10
0
Activity (B
q/g)
Depth (cm)
36
Cl / 35
Cl
10
-8
10
-9
0 10 20 30 40 50
10
-3
10
-2
10
-1
Activity (B
q/g)
Depth (cm)
36
Cl / 35
Cl
10
-9
10
-10
10
-11
- 100 -

5. LIST OF PUBLICATIONS
NUCLEAR PHYSICS – EXPERIMENT
Y.H. Zhang, Y.J. Ma, Y. Sasaki, K. Yamada, H. Ohshima, S. Yokose, M. Ishizuka, T. Komatsubara, K.Furuno, A new level scheme of I-127 High Energy Physics and Nuclear Physics-Chinese Edition 26 (2):104-107 (2002)
Y.H. Zhang, T. Hayakawa, M. Oshima, J. Katakura, Y. Hatsukawa, M. Matsuda, H. Kusakari, M. Sug-awara, T. Komatsubara, K. Furuno, Experimental study of high-spin states in deformed odd-odd Ir-180High Energy Physics and Nuclear Physics-Chinese Edition 26 (6): 582-588 (2002)
C.B. Moon, T. Komatsubara, Y. Sasaki, T. Jumatsu, K. Yamada, K. Satou, K. Furuno, Signature inversionin the yrare band of Xe-119 Eur.Phys.J. A 14, 13-16 (2002)
J.H. Ha, J.C. Kim, C.S. Lee, J.H. Lee, J.Y. Huh, C.B. Moon, S.J. Chae, K. Furuno, T. Komatsubara, T.Schizuma, K. Matsuura, K. Kato, Y. Sadaki, H. Ishiyama, Y. Gono, T. Morikawa, S. Mitarai, M. Shibata,H. Watanabe, M. Miyake, E. Komatsu, A. Odahara, E. Ideguchi, X.H. Zhou, High-spin states in odd-oddLu-168 Journal of the Physical Society of Japan 71 (7):1663-1671 (2002)
C.B. Moon, S.J. Chae, J.H. Ha, T. Komatsubara, Y. Sasaki, T. Jumatsu, K. Yamada, K. Satou, K. Furuno,Signature anomaly in the yrare band of Xe-119 Journal of the Korean Physical Society 41 (2): 188-194(2002)
Y.H. Zhang, F.R. Xu, J.J. He, Z. Liu, X.H. Zhou, Z.G. Gan, T. Hayakawa, M. Oshima, T. Toh, T. Shizuma,J. Katakura, Y. Hatsukawa, M. Matsuda, H. Kusakari, M. Sugawara, K. Furuno, T. Komatsubara, T. Une,S.X. Wen, Z.M. Wang Signature Inversion Phenomena in Odd-Odd 182Au Eur.Phys.J. A 14, 271-274(2002)
Z. Liu, Y.H. Zhang, Y.J. Ma, Y. Sasaki, K. Yamada, H. Oshima, S. Yokose, M. Ishizuka, T. Komatsubara,K. Furuno High Energy Physics and Nuclear Physics-Chinese Edition 26 (12): High-spin states of theneutron-rich nucleus Sb-125 1195-1200 Dec (2002)
N. Kawachi, T. Katabuchi, M. Yamaguchi and Y. Tagishi Real-time measurement of implanted deuteronsby using the nuclear reaction 2H(d,p)3H, Nuclear Inst. and Methods in Physics Research, B 190, 195-198,2002
S. Hirowatati, Syafarudin, F.Aramaki, A.Nohtomi, G. Wakabayashi, Y. Uozumi, N. Ikeda, M. Matoba, Y.Aoki, K. Hirota, N. Okumura, T.Joh, 100Mo(p,d)99Mo reaction at 21 MeV and direct reaction analysis ofthe low-lying continuum spectrum, Nucl. Phys. A714, 3-20 page , (2003)
- 101 -

HIGH ENERGY NUCLEAR PHYSICS
K. Adcox, S. Esumi, Y. Miake, et.al., Centrality Dependence of π+ / π−, K+ / K−, P and anti-P productionfrom √sNN = 130-GeV Au+Au Collisions at RHIC, Phys. Rev. Lett. 88: 242301, 2002
M.M. Aggarwal, Y. Miake, et.al., Event-by-Event Fluctuations in Particle Multiplicities and TransverseEnergy Produced in 158-A-GeV Pb+Pb Collisions, Phys. Rev. C65: 054912, 2002
K. Adcox, S. Esumi, Y. Miake, et.al., Measurement of the Lambda and Anti-Lambda Particles in Au+AuCollisions at
√sNN = 130-GeV, Phys. Rev. Lett. 89: 092302, 2002
L. Ahle, Y. Miake, et.al., System, Centrality, and Transverse Mass Dependence of Two Pion CorrelationRadii in Heavy Ion Collisions at 11.6-A-GeV and 14.6-A-GeV, Phys. Rev. C66: 054906, 2002
K. Adcox, S. Esumi, Y. Miake, et.al., Event-by-Event Fluctuations in Mean P(t) and Mean E(t) in √sNN =130-GeV Au+Au Collisions, Phys. Rev. C66: 024901, 2002
K. Adcox, S. Esumi, Y. Miake, et.al., Net Charge Fluctuations in Au+Au Interactions at√
s = 130-GeV,Phys. Rev. Lett. 89: 082301, 2002
K. Adcox, S. Esumi, Y. Miake, et.al., Measurement of Single Electrons and Implications for Charm Pro-duction in Au+Au Collisions at
√sNN = 130-GeV, Phys. Rev. Lett. 88: 192303, 2002
K. Adcox, S. Esumi, Y. Miake, et.al., Transverse Mass Dependence of Two Pion Correlations in Au+AuCollisions at
√sNN = 130-GeV, Phys. Rev. Lett. 88: 192302, 2002
M. M. Aggarwal, Y. Miake et.al., One, Two, and Three Particle Distributions from 158-A-GeV/c CentralPb+Pb Collisions, Phys. Rev. C67: 014906, 2003
I. G. Bearden, S. Esumi, et.al., Particle Production in Central Pb+Pb Collisions at 158-A-GeV/c, Phys.Rev. C66: 044907, 2002
I.G. Bearden, S. Esumi, et.al., Deuteron and Triton Production with High Energy Sulphur and Lead Beams,Eur. Phys. J. C23: 237-247, 2002
D. Adamova, S. Esumi, et.al., Universal Pion Freezeout in Heavy Ion Collisions, Phys. Rev. Lett. 90:022301, 2003
D. Adamova, S. Esumi, et.al., Beam Energy and Centrality Dependence of Two Pion Bose-Einstein Cor-relations at SPS Energies, Nucl. Phys. A714: 124-144, 2003
- 102 -

ATOMIC AND SOLID STATE PHYSICS, AND CLUSTER SCIENCE
H. Kudo, K. Takeda, T. Suguri, W. Iwazaki, C. Sakurai, I. Arano, S. Numazawa and S. Seki, Electron lossfrom fast partially stripped C and O ions incident on crystal targets, Nuclear Instruments and Methods inPhysics Research Section B 207 pp.283-290 (2003)
M. Onoda and J. Hasegawa, The spin-gap state and the phase transition in the δ -phase TlxV2O5 polaronicbronze, Journal of Physics: Condensed Matter, Vol. 14, No. 19, pp. 5045-5059 (2002)
N. Nishiguchi, M. Onoda and K. Kubo, Superexchange interactions in the two-dimensional S = 12 system
MV3O7, Journal of Physics: Condensed Matter, Vol. 14, No. 23, pp. 5731-5746 (2002)
N. Nishiguchi and M. Onoda, A pseudotetramer in the geometrically frustrated spinel system CdV2O4,Journal of Physics: Condensed Matter, Vol. 14, No. 28, pp. L551-L557 (2002)
M. Onoda and J. Hasegawa, A distortion of pseudotetramers coupled with the Jahn-Teller effect in thegeometrically frustrated spinel system CdV2O4, Journal of Physics: Condensed Matter, Vol. 15, No. 3,pp. L95-L102 (2003) *IOP SELECT*
S. Sakai, H. Tanimoto, E. Kita and H. Mizubayashi, Characteristic Creep Behavior of Nanocrystalline (n-)Metals Found for High Density n-Gold, Phys. Rev. B, 66(2002), 214106 (9 pages)
H. Tanimoto, S. Sakai and H. Mizubayashi, Anelasticity Study on Motions of Atoms in the Grain Bound-ary Regions in Nanocrystalline Gold, Mater. Trans., 44 (2003) pp.53-58
H. Tanimoto, S. Sakai, E. Kita and H. Mizubayashi, Characterization and Elastic Property of High-DensityNanocrystalline Gold Prepared by Gas-Deposition Method, Mater. Trans., 44(2003) pp.94-103
M. Imanaka, T. Kurita, M. Tsukada, I. Arai, S. M. Lee, and T. Nakagawa, Effect of a biased electrode onoperation of ECR ion source using liquid He freesuperconduction solenoid coils, Rev. Sci. Instrum. 73,(2002) 592
T. Nakagawa, T. Kurita, M. Kidera, M. Imanaka, Y. Higurashi, M. Tsukada, S. M. Lee, M. Kase, and Y.Yano, Intense beam production from RIKEN 18 GHz ECRIS and liquid He free SC-ECRISs, Rev. Sci.Instrum. 73, (2002) 513
M. Imanaka, T. Kurita, T. Nakagawa, H. Sasaki, S.G. Lee, I. Arai and S.M. Lee, Highly-charged Ion beamfor study of cluster physics, Transactions of MRS-J, 27, (2002) 181
I. Arai, H. Sasaki, J. Hirose, K. Teranishi and S.M. Lee, Abundance Spectra of Clusters for Various Metalsin Sputtering and Their Formation Mechanism, Transactions of the Materials Research Society of Japan,27, (2002) 193
M. Imanaka, T. Kurita, M. Tukada, T. Nakagawa, M. Kidera and S.M. Lee, Effect of Magnetic FieldStrength on Beam Intensity of Highly Charged Xe. Ions from Liquid-He-Free Superconducting ECR IonSource, Jpn. J. Appl. Phys. 41, 6A, (2002) 3926
T. Kurita, M. Imanaka, M. Tsukada, T. Nakagawa, M. Kidera, I. Arai and S.M. Lee, Performance of anECR ion source using liquid-helium-free superconducting solenoid coils (SHIVA), Nucl. Instrum. Meth-ods Phys. Res. B192, (2002) 429
- 103 -

H. Arai, M. Imanaka, S.M. Lee, Y. Higurashi, T. Nakagawa, M. Kidera, T. Kageyama, M. Kase, Y.Yano and T. Aihara, Effect of minimum strength of mirror magnetic field (Bmin) on production of highlycharged heavy ions from RIKEN liquid-He-free superconducting electron cyclotron resonance ion source(RAMSES), Nucl. Instrum. Methods Phys. Res. A491 (2002) 9-41
T.X. Li, S.M. Lee, S.J. Han and G.H. Wang, Structural transitions of Au55 isomers, Phys. Lett. A,Vol.300, (2002) 86
T. Matsuhiro, Cl-36 Measurements of Hiroshima A-Bombed Granites, Proceedings of the Third Work-shop on Environmental Radioactivity, KEK-Proceedings 2002-7, pp.69-73 (2002)
K. Sasa, H. Ohshima, Y. Yamato, T. Komatsubara, T. Katabuchi, K. Shima, K. Furuno, M. Kurosawa, N.Yanagisawa, Hydrogen analysis of mineral samples at University of Tsukuba Nucl. Inst. Meth. B 190:287-290 (2002)
6. THESES
Ph. D. Theses
Naoki Kawachi Real-time measurement of implanted deuterium density by usingthe 2H(d,p)3H reaction
Mitsutaka Yamaguchi Measurement of Proton Polarization in 208Pb(d,p)209Pb Reactionat Incident Deuteron Energy of 20 MeV
M. Sc. Theses
Makoto Ishizuka Developement of Standard Samples for Hydrogen Analysis byusing Resonance Nuclear Reactions
Kouichi Teranishi Production of Clusters from Low Melting Temterature Metals byXe Atom Sputtering
Masatoshi Tsukada Diagnostics of Plasma in ECR Ion Source by Laser Ablation MethodHiroshi Masui Elliptic Azimuthal Anisotropies of High pT Particles in Au+Au
collsions√
sNN = 200 GeVShingo Sakai Elliptic Azimuthal Anisotropies of pions, kaons and protons in
Au+Au collsions at √sNN = 200 GeVYoshiaki Kuroki Directed Azimuthal Anisotropies of Particle Production in Au+Au
collsions at√
sNN = 200 GeVWataru Iwazaki Secondary Electron Emission from Solids Bombarded by Fast ClustersTakuya Suguri Low-Energy Electron Emissionfrom Solids by Fast Heavy Ion ImpactIsamu Arano Observation of Distorted Crystal Lattices with Ion-Induced Electron
SpectroscopyShuhei Numazawa Analysis of H and D Contents in Synthesized Polymer FilmsChizuko Sakurai Binary-Encounter Electron Emission by Grazingly Incident IonsKazuhiko Sekine NMR for the composite crystal CuxV4O11 and the application
to the secondary ion battery
- 104 -

7. SEMINARS
Date Speaker and Title2002May 23 Hans Paetz gen. Schieck (Univ. of Koln, Germany); Few-Body Research
Programme at the Cologne FN Tandem AcceleratorJune 31 Y. H. Zhang (Institute of Modern Physics, Lanzhou); Study of Semi-
Decoupled Bands in odd-odd NucleiX. H. Zhou (Institute of Modern Physics, Lanzhou); Brief Introduction on theIdentification of New Isotopes at IMP and Level Structure Study of 169Re
Sept. 25 Jiang Shan (China Institute of Atomic Energy); 41Ca & 36Cl Measurementsand their Applications
Oct. 10 M. Kamimura (Kyushu Univ.); The Latest Determination of Antiproton Massby Precision 3-body Calculation of Antiprotonic Helium Atoms
Nov. 6 H. Ishiyama (KEK); Direct Measurement of (α , n) Reaction Cross Sectionsusing Light Neutron-Rich Radioactive Beams
Dec. 11 M. Tsukada (Univ. of Tsukuba); Diagnostics of Plasma in ECR Ion Source byLaser Ablation MethodK. Teranishi (Univ. of Tsukuba); Production of Clusters from Low MeltingTemterature Metals by Xe Atom Sputtering
Dec. 18 M. Ishizuka (Univ. of Tsukuba); Developement of Standard Samples forHydrogen Analysis by using Resonance Nuclear ReactionsH. Masui (Univ. of Tsukuba); Elliptic Azimuthal Anisotropies of High pTParticles in Au+Au collsions
√sNN = 200 GeV
Dec. 25 M. Imanaka (Univ. of Tsukuba); Effect of Magnetic Field Configuration onthe Plasma of Liquid-He-Free Superconducting ECR Ion Source
2003Jan. 15 Y. Kuroki (Univ. of Tsukuba); Study of Azimuthal Directed Anisotropy of
Charged Particle Emission in√
sNN =200GeV Au+Au CollisionsS. Sakai (Univ. of Tsukuba); Azimuthal Anisotropy of pions, kaons andprotons Emission in
√sNN=200GeV Au+Au Collisions
Feb. 19 S. Takeuchi (JAERI); Development of Accelerating System for JAERI-Tandem Accelerator
March 7 K. Sagara (Kyushu Univ.); Experimental and Theoretical Aspects forThree Nucleon System
March 19 M. Igashira (Tokyo Institute of Technology); Fast-Neutron Capture byLight Nuclei relevant to Nucleosynthesis in the Universe
- 105 -
8. SYMPOSIUM
Workshop on Nuclear Synthesisand Radiactive Nuclei
3rd July 2002Tandem Accelerator Center, University of Tsukuba
Openning address, K. Furuno (Univ. of Tsukuba)Present Status and Perspective of Nucleosynthesis Studies – New Paradigm in Cosmology and Nucleosyn-thesis –, T. Kajino (National Astronomical Observatory of Japan)Perspectives of Nuclear Synthesis by using Accelerators, S. Kubono (CNS, Univ. of Tokyo)Nuclear Structure with Radiactive Nuclei, K. Yabana (Univ. of Tsukuba)Future Plans of RI Beam Factory, T. Suda (RIKEN)A KEK-JAERI RNB Facility Project and Recent RNB Experimental Works at JAERI-Tandem, H. Miy-atake (KEK)Reaserches on Unstable Nuclear Structure at RIKEN, A. Ozawa (RIKEN)Study on Nuclear Symthesis at RIKEN, S. Nishimura (RIKEN)Coulomb Break Up and CDCC, Y. Aoki (Univ. of Tsukuba)Study of Unstable Nuclear Structure with Transition Magnetic Field, T. Komatsubara (Univ. of Tsukuba)Study of p-precess at Supernova, T. Hayakawa (JAERI)Study of High Spin States by using Low Energy Secondary RI Beam, E. Ideguchi (RIKEN)Nuclear Physics conbind with RI Beam Factory and Tandem van de Graaff, I. Tanihata (RIKEN)
- 106 -

9. LIST OF PERSONEL
Accelerator CenterK. Furuno Director, ProfessorK. Shima Associate ProfessorT. Komatsubara Assistant ProfessorK. Sasa Assistant ProfessorS. Ishii Mechanical TechnicianH. Kimura Computer TechnicianH. Oshima Electric TechnicianY. Tajima Mechanical TechnicianT. Takahashi Electric TechnicianY. Yamato Electric TechnicianT.X. Li Research FellowK. Taga Administrative Stuff
Steering CommitteeK. Furuno Chairperson, Tandem Accelerator CenterY. Kajiwara Inst. of GeoscienceR. Kanzaki Inst. of Biological ScienceT. Komatsubara Tandem Accelerator CenterH. Kudo Inst. of Applied PhysicsY. Miake Inst. of PhysicsM. Onoda Inst. of PhysicsR. Seki Inst. of ChemistryK. Shima Inst. of Applied PhysicsY. Tagishi Inst. of PhysicsK. Yabana Inst. of PhysicsK. Yasuoka Inst. of Physics
Scientific Guests and FellowsK. Awazu National Lab. Advanced Industrial Science and TechnologyM. Fujimaki Waseda Univ.K. Nomura Waseda Univ.Y. Nagasawa Waseda Univ.N. Horikawa Nagoya Univ.I. Daito Nagoya Univ.T. Inagaki Nagoya Univ.T. Kobayashi Nagoya Univ.Li Wang Nagoya Univ.M. Iio Nagoya Univ.T. Mizota Tsukuba Nano-Tech.H. Ishiyama KEKH. Miyatake KEKM. Tanaka KEKM. Yoshikawa KEKS.C. Jeong KEKT. Miura KEKK. Masumoto KEKK. Bessho KEKH. Muramatsu KEK
- 107 -
Q.B. Wang KEKY. Watanabe KEKHe Ming China Institute of Atomic EnergyJiang Shan China Institute of Atomic EnergyY. H. Zhang Institute of Modern Physics, LanzhouX. H. Zhou Institute of Modern Physics, Lanzhou
Research MembersInst. of Physics
Y. Aoki I. Arai S. Esumi K. Furuno S. KatohT. Komatsubara S.M. Lee Y. Miake N. Okumura M. OnodaK. Sasa Y. Tagishi T. Une
Inst. of Applied PhysicsK. Akimoto E. Kita H. Kudo T. Murakami K. ShimaA. Uedono
Inst. of Material ScienceH. Ikeda T. Koyano H. Mizubayashi K. Takita H. TanimotoR. Yoshizaki
Inst. of GeoscienceR. Anma T. Katou M. Kurosawa M. Sugita
Inst. of ChemistryR. Seki K. Sueki
Inst. of Basic Medical ScienceY. Nagashima
Tandem Accelerator CenterT.X. Li
Graduate StudentsDoctoral Degree Programs of Physics
J. Hasegawa M. Imanaka N. Kawachi S.G. Lee K. SatohM. Yamaguchi
Doctoral Degree Programs of EngineeringT. Hao B. Hou N. Ookubo N. Umeda
Doctoral Degree Programs of Pure and Applied ScienceA. Hatanaka T. Harigae T. Ikeda W. Iwasaki M. KonnoH. Masui M. Nakazumi M. Nagata S. Sakai H. SasakiJ. Sawahata K. Sekine M. Shimomura T. Suguri T. SuzukiS. Takagi H. Tokano H. Tsuruoka N. Yagi T. Yamada
Doctoral Degree Programs of Agriculture ScienceS. Kaburagi
Master’s Degree Programs of Science and EngineeringH. Arai I. Arano T. Handa H. Ishiguro M. IshizukaS. Kaminaga K. Kondo M. Kubo Y. Kuroki T. MatsuuraS. Miyasaka T. Muto T. Nomiyama S. Numazawa T. OokiC. Sakurai H. Sato Y. Takanashi K. Teranishi N. Yoshimaru
Master’s Degree Programs of EducationT. Tsukada
Master’s Degree Programs of Environmental ScienceT. Matsuhiro
- 108 -

Under GraduatesY. Goto S. Hamajima T. Himuma Y. Ishibashi T. KawagishiK. Kitazato H. Kobai N. Matsuda Y. Nagata T. ShimadaT. Shojo T. Suzuki A. Ueki T. Usui
- 109 -