Utme2015 analysis of applications
19
UTME 2015: ANALYSIS OF APPLICATION
-
Upload
statisense -
Category
Education
-
view
309 -
download
0
Transcript of Utme2015 analysis of applications

UTME 2015:ANALYSIS OF
APPLICATION
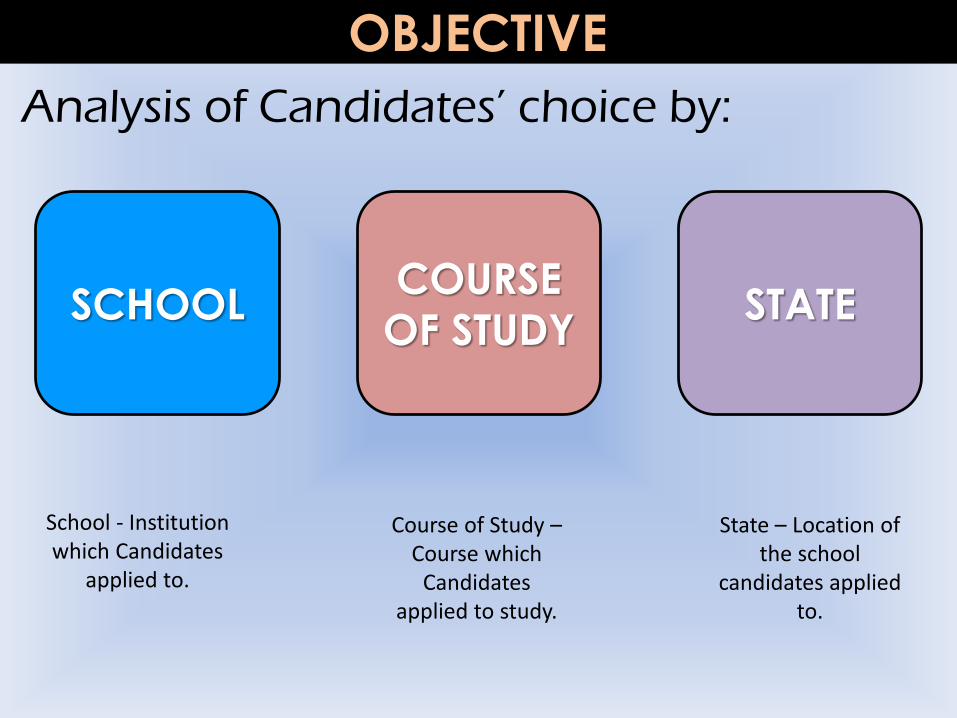
Analysis of Candidates’ choice by:
OBJECTIVE
SCHOOLCOURSE
OF STUDYSTATE
School - Institution which Candidates
applied to.
Course of Study –Course which
Candidates applied to study.
State – Location of the school
candidates applied to.

SCHOOL
OWNER TOTAL
Federal 40
Private 48
State 38
TOTAL 126
Schools in Nigeria are owned or
managed by Federal government,
State government or Private
organizations. In the 2015 Unified
Tertiary Matriculation Examination
(UTME), Candidates applied to a
total of 126 Universities.
1,475,513 (1.4755m) Candidates applied to study in
different Universities in Nigeria. However, it is on record
that the Nigerian university system has a carrying capacity
of a little above 530,000 Students. This implies that the
System can only accommodate just about 30% of all these
Candidates. It is however not established if this is why this
year records the lowest application in five years.
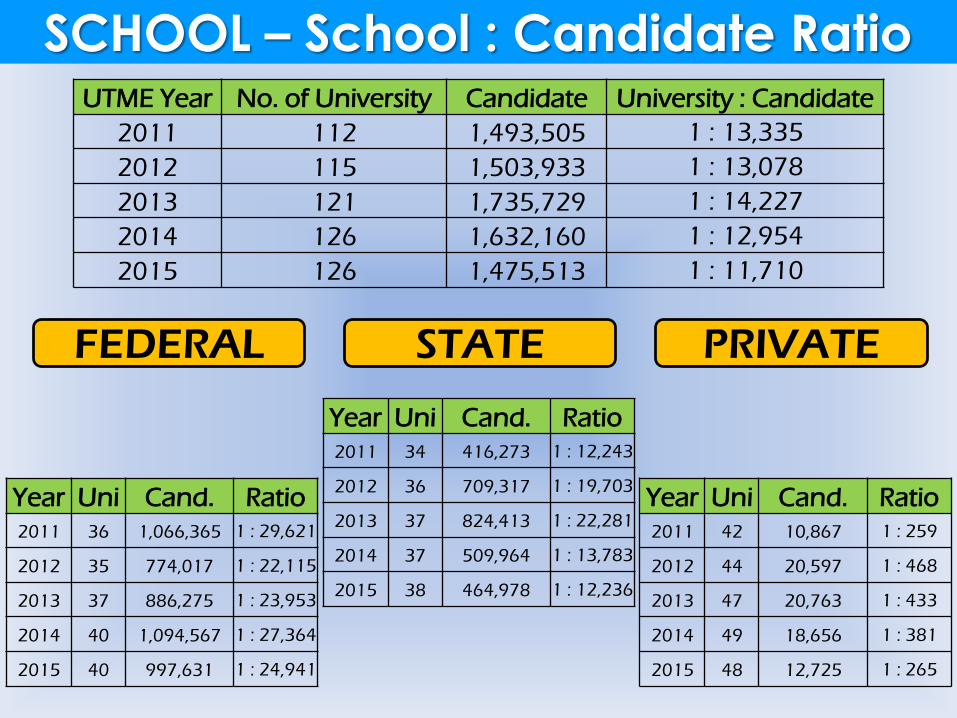
SCHOOL – School : Candidate RatioUTME Year No. of University Candidate University : Candidate
2011 112 1,493,505 1 : 13,335
2012 115 1,503,933 1 : 13,078
2013 121 1,735,729 1 : 14,227
2014 126 1,632,160 1 : 12,954
2015 126 1,475,513 1 : 11,710
FEDERAL STATE PRIVATE
Year Uni Cand. Ratio
2011 36 1,066,365 1 : 29,621
2012 35 774,017 1 : 22,115
2013 37 886,275 1 : 23,953
2014 40 1,094,567 1 : 27,364
2015 40 997,631 1 : 24,941
Year Uni Cand. Ratio
2011 34 416,273 1 : 12,243
2012 36 709,317 1 : 19,703
2013 37 824,413 1 : 22,281
2014 37 509,964 1 : 13,783
2015 38 464,978 1 : 12,236
Year Uni Cand. Ratio
2011 42 10,867 1 : 259
2012 44 20,597 1 : 468
2013 47 20,763 1 : 433
2014 49 18,656 1 : 381
2015 48 12,725 1 : 265

SCHOOL – Most Sought AfterNO.INSTITUTION TOTAL
1 UNILORIN 107,488
2 UNIBEN 71,496
3 UNIZIK 70,609
4 UNN 66,788
5 UNILAG 62,471
6 ABU 60,237
7 UI 47,497
8 BAYERO 46,801
9 OAU 43,965
10 UNIUYO 41,645
11 UNIJOS 41,286
12 IMSU 39,144
13 NASU 34,553
14 UNIPORT 34,011
15 DELSU 29,298
16 BENSU 29,050
17 UNICAL 28,106
18 KADSU 27,059
19 KOGSU 25,288
20 EKPOMA 25,194
According to UTME 2015 application records; the
University of Ilorin (UNILORIN) is the most sought
after University in Nigeria with 107,488.
In UTME 2014, UNILORIN also achieved this feat
with 109,484 applications.
This has made UNILORIN to be the only University in
Nigeria that has generated the most interest in
Candidates, crossing the 100,000 mark for the
second consecutive year.
UNILORIN – BETTER BY FAR!
INSTITUTION 2011 2012 2013 2014 2015
UNILORIN 64,261 78,265 94,869 109,484 107,488Total 1,493,505 1,503,933 1,735,729 1,632,160 1,475,513
UNILORIN % 4.30% 5.20% 5.47% 6.71% 7.28%
THE ABOVE REPRESENTS THE CONTRIBUTION OF UNILORINCANDIDATES TO NIGERIAN UNIVERSITIES;
UNILORIN MOVED FROM 4.3% IN 2011 TO 7.28% IN 2015.

SCHOOL – Most Sought AfterNO. INSTITUTION 2011 2012 2013 2014 2015 AVG
1 UNILORIN 64,261 78,265 94,869 109,484 107,488 90,8732 UNIBEN 74,269 80,216 98,975 76,928 71,496 80,3773 UNIZIK 80,275 82,384 88,087 77,626 70,609 79,7964 UNILAG 94,078 84,326 86,850 61,930 62,471 77,9315 UNN 82,043 79,842 80,785 69,838 66,788 75,8596 ABU 89,310 60,691 59,427 52,533 60,237 64,4407 OAU 69,498 65,653 69,856 60,402 43,965 61,8758 UNIPORT 64,160 48,850 43,115 38,001 34,011 45,6279 UI 46,102 40,547 50,274 42,340 47,497 45,352
10 UNIUYO 42,086 45,851 52,359 41,947 41,645 44,77811 BAYERO 43,054 37,890 50,037 40,195 46,801 43,59512 IMSU 14,029 43,503 53,368 45,761 39,144 39,16113 UNIJOS 27,616 33,776 38,000 44,845 41,286 37,10514 NASU 33,162 39,773 47,523 27,305 34,553 36,46315 DELSU 41,522 36,177 39,669 34,208 29,298 36,17516 UNICAL 39,000 34,191 40,050 33,931 28,106 35,05617 KOGSU 30,118 33,335 40,238 35,111 25,288 32,81818 BENSU 31,958 30,927 35,319 32,062 29,050 31,86319 EKPOMA 20,679 21,653 29,239 28,567 25,194 25,06620 KADSU 18,969 20,691 26,590 24,196 27,059 23,501

SCHOOL – Most Sought After
0
20,000
40,000
60,000
80,000
100,000
120,000
UNILORIN UNIBEN UNIZIK UNILAG UNN ABU OAU UNIPORT UI UNIUYO
UTME APPLICATION (2011 – 2015)
2011 2012 2013
2014 2015
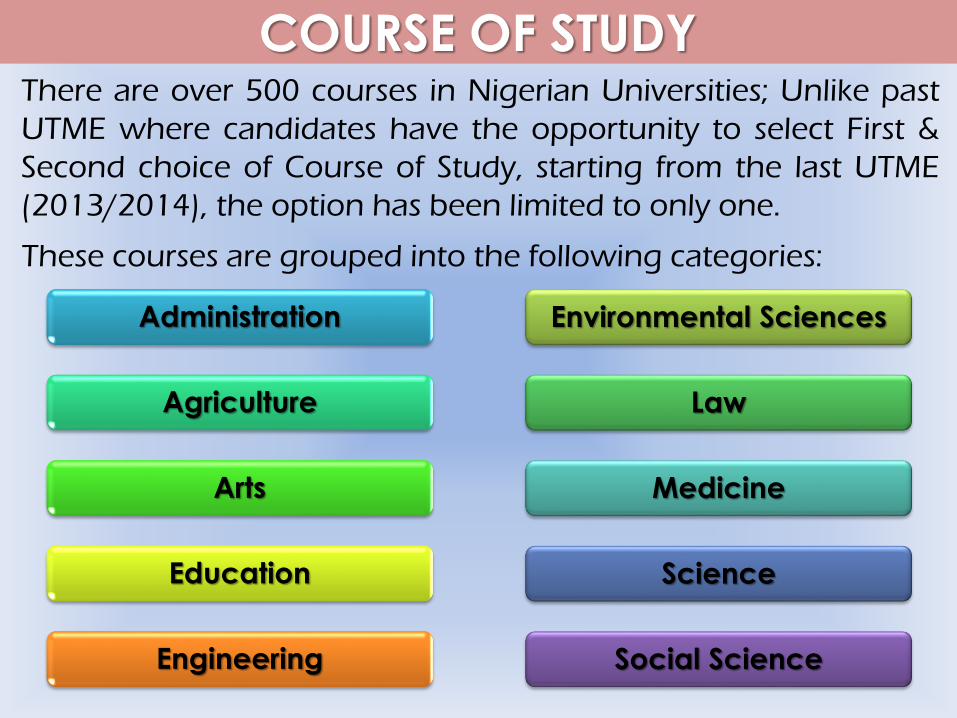
COURSE OF STUDY
These courses are grouped into the following categories:
There are over 500 courses in Nigerian Universities; Unlike past
UTME where candidates have the opportunity to select First &
Second choice of Course of Study, starting from the last UTME
(2013/2014), the option has been limited to only one.
Administration
Agriculture
Arts
Education
Engineering
Environmental Sciences
Law
Medicine
Science
Social Science

COURSE OF STUDY – By Faculty
Faculty 2011 2012 2013 2014 2015
Administration 326,387 289,300 225,225 187,082 206,267
Agriculture 23,255 28,726 38,056 36,037 28,372
Arts 72,736 64,649 124,653 114,098 86,151
Education 60,293 68,611 70,037 83,260 71,007
Engineering 172,921 173,942 192,377 182,124 171,767
Environmental Sciences
23,771 28,007 31,055 32,293 32,791
Law 81,396 87,800 98,545 93,222 91,385
Medicine 215,098 232,945 276,263 285,076 289,689
Science 214,419 211,956 243,325 237,783 204,462
Social Science 289,560 313,766 418,273 381,180 293,611
Affiliated institutions not considered in this calculation.

COURSE OF STUDY – Most Sought After
2011
1st – Medicine & Surgery
2nd – Accounting
3rd – Economics
4th – Business Administration
5th – Mass Communication
20152012
2013 2014
1st – Medicine And Surgery
2nd – Economics
3rd – Accounting
4th – Business Administration
5th – Mass Communication
1st – Medicine And Surgery
2nd – Accounting
3rd – Economics
4th – Nursing
5th – Mass Communication

COURSE OF STUDY – Most Sought AfterSummary –
Medicine & Surgery is the most sought after course in Nigeria.
Economics emerged in the second position on three occasions
in 2012, 2013, and 2014; and came third in 2011 and 2015.
Accounting came second in 2011 and 2015, but maintained
third place in 2012, 2013, and 2014.
Business Administration maintained the number 4th position
from 2011 to 2014, but was edged out in 2015.
Mass Communication is the 5th most sought after course,
maintaining same position from 2011 to 2015.
MEDICINE & SURGERY ECONOMICS
ACCOUNTING BUSINESS ADMINISTRATION MASS
COMMUNICATION
12
34
5

2012
COURSE OF STUDY – SchoolMedicine & Surgery
Accounting
Economics
Business Administration
Mass Communication
ABU
OAU
UNIZIK
UNILAG
UNILAG
Medicine & Surgery
Economics
Accounting
Business Administration
Mass Communication
UNN
UNIZIK
UNILORIN
UNILORIN
UNILORIN
Medicine & Surgery
Economics
Accounting
Business Administration
Mass Communication
UNILORIN
UNILORIN
UNILORIN
UNILORIN
UNILORIN
Medicine & Surgery
Accounting
Economics
Nursing
Mass Communication
UNILORIN
UNILORIN
UI
UNILORIN
UNILORIN
Medicine & Surgery
Economics
Accounting
Business Administration
Mass Communication
UNN
UI
UNILORIN
UNILORIN
UNILORIN
2011
2013
2014
2015
1STUNIVERSITY OF FIRST CHOICE UNILORINCHOICEUNILORIN IS NIGERIAN

STATE – Location of SchoolThe choice of where to study sometimes is as a result of
Location. For proper planning and administration of resources –
both human and infrastructures, it is important to know which
State of the Federation have the highest inflow of Candidates
the most.
Without much analysis, it is
expected that due to the
current state of security in the
North-East of the country,
Candidates may for the sake
of safety prefer schools in
other parts of the country.
This assumption we hope to
establish in the course of this
analysis.

REGION FEDERAL PRIVATE STATE TOTAL
NC 9 8 7 24
NE 6 2 5 13
NW 8 6 14
SE 5 8 5 18
SS 6 8 7 21
SW 6 22 8 36
TOTAL 40 48 38 126
STATE – Location of SchoolSTATE TOTALAbia 3Adamawa 3Akwa-Ibom 3Anambra 5Bauchi 2Bayelsa 1Benue 3Borno 1Cross-Rivers 2Delta 6Ebonyi 3Edo 5Ekiti 4Enugu 5FCT 4Gombe 2Imo 2Jigawa 2Kaduna 3
STATE TOTALKano 4Katsina 3Kebbi 2Kogi 3Kwara 4Lagos 5Nasarawa 3Niger 2Ogun 12Ondo 6Osun 6Oyo 3Plateau 2Rivers 4Sokoto 2Taraba 3Yobe 2Zamfara 1TOTAL 126
OWNER TOTAL
Federal 40
Private 48
State 38
TOTAL 126
REGION Total
North Central 24
North East 13
North West 14
South East 18
South South 21
South West 36
TOTAL 126
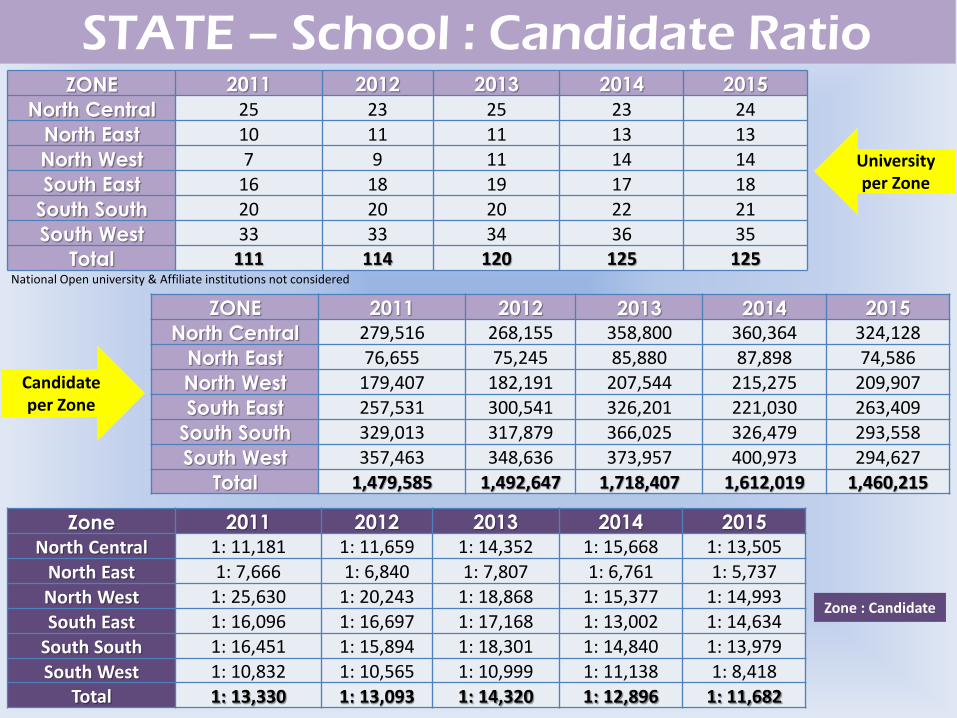
STATE – School : Candidate RatioZONE 2011 2012 2013 2014 2015
North Central 25 23 25 23 24
North East 10 11 11 13 13
North West 7 9 11 14 14
South East 16 18 19 17 18
South South 20 20 20 22 21
South West 33 33 34 36 35
Total 111 114 120 125 125
ZONE 2011 2012 2013 2014 2015
North Central 279,516 268,155 358,800 360,364 324,128
North East 76,655 75,245 85,880 87,898 74,586
North West 179,407 182,191 207,544 215,275 209,907
South East 257,531 300,541 326,201 221,030 263,409
South South 329,013 317,879 366,025 326,479 293,558
South West 357,463 348,636 373,957 400,973 294,627
Total 1,479,585 1,492,647 1,718,407 1,612,019 1,460,215
Zone 2011 2012 2013 2014 2015
North Central 1: 11,181 1: 11,659 1: 14,352 1: 15,668 1: 13,505
North East 1: 7,666 1: 6,840 1: 7,807 1: 6,761 1: 5,737
North West 1: 25,630 1: 20,243 1: 18,868 1: 15,377 1: 14,993
South East 1: 16,096 1: 16,697 1: 17,168 1: 13,002 1: 14,634
South South 1: 16,451 1: 15,894 1: 18,301 1: 14,840 1: 13,979
South West 1: 10,832 1: 10,565 1: 10,999 1: 11,138 1: 8,418Total 1: 13,330 1: 13,093 1: 14,320 1: 12,896 1: 11,682
University per Zone
Candidate per Zone
Zone : Candidate
National Open university & Affiliate institutions not considered

STATE – School : Candidate RatioZONE 2011 2012 2013 2014 2015
North Central 18.89% 17.97% 20.88% 22.35% 22.20%
North East 5.18% 5.04% 5.00% 5.45% 5.11%
North West 12.13% 12.21% 12.08% 13.35% 14.38%
South East 17.41% 20.13% 18.98% 13.71% 18.04%
South South 22.24% 21.30% 21.30% 20.25% 20.10%
South West 24.16% 23.36% 21.76% 24.87% 20.18%
Summary –
The Most Sought After Zone has shifted from South West to
the North Central (Courtesy UNILORIN).
The North West is also enjoying some patronage, this may be
due to the unrest in the North East, which has not been able
to attract more than 5% of total candidates since 2011.
South East achieved almost a 5% impressive increase between
2014 and 2015. The implication is that the infrastructures in
place in those schools will suffer as they may not be able to
cater for this growth.

STATE – Zone, Candidate, Ownership
Zone 2011 2012 2013 2014 2015
North Central 159,143 137,337 200,338 225,646 201,538
North East 53,413 49,327 57,158 56,866 46,938
North West 157,865 157,290 173,847 173,903 169,022
South East 208,072 213,158 232,111 128,420 186,924
South South 230,652 214,359 239,708 198,323 182,108
South West 243,659 243,168 274,692 301,046 196,551
Zone 2011 2012 2013 2014 2015
North Central 1,438 1,473 1,901 2,833 2,242
North East 396 400 315 3,365 203
North West
South East 1,243 1,407 1,206 1,543 1,040
South South 555 676 923 1,379 920
South West 7,235 7,496 6,631 9,536 8,320
Zone 2011 2012 2013 2014 2015
North Central 118,935 129,345 156,561 131,885 120,348
North East 22,846 25,518 28,407 27,667 27,445
North West 21,542 24,901 33,697 41,372 40,885
South East 48,216 85,976 92,884 91,067 75,445
South South 97,806 102,844 125,394 126,777 110,530
South West 106,569 97,972 92,634 90,391 89,756
FEDERAL UNIVERSITY2011 2012 2013 2014 2015
8 7 8 8 8
5 5 5 6 6
4 5 6 8 8
5 5 5 4 5
6 6 6 6 6
7 6 6 7 6
STATE UNIVERSITY
2011 2012 2013 2014 20157 6 7 7 7
4 5 5 4 5
3 4 5 6 6
5 5 5 5 5
6 7 7 7 7
9 9 8 8 8
PRIVATE UNIVERSITY
2011 2012 2013 2014 2015
10 10 10 8 9
1 1 1 3 2
6 8 9 8 8
8 7 7 9 8
17 18 20 21 21
CANDIDATE

STATE – Zone, Candidate, OwnershipSummary –
Federal Universities attracts the most candidates – from 67%
to 71%. Private attracts less than 1% of total candidates.
The State of choice for most candidates are 2011 (Kaduna,
Lagos, Osun), 2012 (Osun, Lagos, Anambra), 2013 (Kaduna,
Edo, Osun), 2014 (Ondo, Kwara, Kaduna), 2015 (Kwara,
Kaduna, Delta).
Though Ogun state has the most Universities (12), two are
State, 1 Federal and the remaining are Private. Despite the
number of universities, Ogun state is not a destination of
choice.
No Private University exist in the North West.

Are you having issues with making sense of your data?
Analysis by: Wale Micaiah
m: 08078001800
w: www.statisense.com
w: www.walemicaiah.com
Freely share, freely use and freely
acknowledge the source – © Wale Micaiah