Utilization of estimated rainfall as an early warning ...
10
Journal of Physics: Theories and Applications E-ISSN: 2549-7324 / P-ISSN: 2549-7316 J. Phys.: Theor. Appl. Vol. 2 No.02 (2018) 73-82 doi: 10.20961/jphystheor-appl.v2i2.30670 73 Utilization of estimated rainfall as an early warning system before flash flood event Fara Diva Claudia 1 , Cecylia Putri Mawarni 2 , Kadek Krisna Yulianti 3 , Paulus Agus Winarso 4 1,2,3,4 School of Meteorology, Climatology, and Geophysics (STMKG) Jl. Perhubungan 1 No 5 South Tangerang Banten 1 Email : [email protected] Received 10 August 2018, Revised 18 September 2018, Published 30 September 2018 Abstract: On October 10, 2018 there has been extreme weather in the form of heavy rain accompanied by lightning in Tanah Datar District, West Sumatra. This extreme weather caused flash floods and landslides that killed many people. Therefore, by using remote sensing data in the form of radar and satellite as well as WRF modeling (Weather Research and Forecasting) the authors conducted analysis of heavy rainfall events to determine the estimated rainfall and atmospheric dynamics during the occurrence of flash floods and landslides. WRF modeling is used to determine the condition of atmospheric lability. For the calculation of rainfall estimation, the method used is the Convective Stratiform Technique (CST) method that utilizes satellite data and the Z-R relation selection method that utilizes radar data. Then the calculation results from each method are verified using observation data. Relative bias shows the CST method and the selection of Z-R relations tend to be overestimate, but has a very high correlation value with observation data. Information on rainfall estimation and atmospheric dynamics is expected to be used to provide early warnings aimed at minimizing losses from the impact of disasters. Keyword : Flash flood, CST, rainfall estimation, relation of Z-R 1. Introduction On October 10, 2018, based on the BPBD (Badan Penanggulangan Bencana Daerah) of West Sumatra report there have been flash floods and landslides in Tanah Datar District. This report is equipped with information that the flash flood that occurred was caused by heavy rains that have occurred in the last few days. Flash floods and landslides are hydrometeorological hazard that can kill many people and property losses, so mitigation efforts are needed to minimize these disasters. One way to mitigate hydrometeorological disasters is by making early warnings. The accurate and real time rainfall information is needed in various fields such as floods, landslides and droughts in research related to the hydrological cycle (Suwarsono et al., 2009; Joyce et al., 2004; Hong et al., 2007). To produce accurate flood data, accurate rainfall is also needed. Accurate rainfall data can be obtained through direct observation using rain gauge. However, currently monitoring rainfall has not covered all areas on the surface of the earth. This is due to limited rainfall observation points. The
Transcript of Utilization of estimated rainfall as an early warning ...
Journal of Physics: Theories and Applications E-ISSN: 2549-7324 / P-ISSN: 2549-7316
J. Phys.: Theor. Appl. Vol. 2 No.02 (2018) 73-82 doi: 10.20961/jphystheor-appl.v2i2.30670
73
Utilization of estimated rainfall as an early warning
system before flash flood event
Fara Diva Claudia1, Cecylia Putri Mawarni
2, Kadek Krisna Yulianti
3, Paulus Agus
Winarso4
1,2,3,4School of Meteorology, Climatology, and Geophysics (STMKG)
Jl. Perhubungan 1 No 5 South Tangerang Banten
1Email : [email protected]
Received 10 August 2018, Revised 18 September 2018, Published 30 September 2018
Abstract: On October 10, 2018 there has been extreme weather in the form
of heavy rain accompanied by lightning in Tanah Datar District, West
Sumatra. This extreme weather caused flash floods and landslides that killed
many people. Therefore, by using remote sensing data in the form of radar
and satellite as well as WRF modeling (Weather Research and Forecasting)
the authors conducted analysis of heavy rainfall events to determine the
estimated rainfall and atmospheric dynamics during the occurrence of flash
floods and landslides. WRF modeling is used to determine the condition of
atmospheric lability. For the calculation of rainfall estimation, the method
used is the Convective Stratiform Technique (CST) method that utilizes
satellite data and the Z-R relation selection method that utilizes radar data.
Then the calculation results from each method are verified using observation
data. Relative bias shows the CST method and the selection of Z-R relations
tend to be overestimate, but has a very high correlation value with
observation data. Information on rainfall estimation and atmospheric
dynamics is expected to be used to provide early warnings aimed at
minimizing losses from the impact of disasters.
Keyword : Flash flood, CST, rainfall estimation, relation of Z-R
1. Introduction
On October 10, 2018, based on the BPBD (Badan Penanggulangan Bencana
Daerah) of West Sumatra report there have been flash floods and landslides in Tanah
Datar District. This report is equipped with information that the flash flood that
occurred was caused by heavy rains that have occurred in the last few days. Flash floods
and landslides are hydrometeorological hazard that can kill many people and property
losses, so mitigation efforts are needed to minimize these disasters. One way to mitigate
hydrometeorological disasters is by making early warnings.
The accurate and real time rainfall information is needed in various fields such as
floods, landslides and droughts in research related to the hydrological cycle (Suwarsono
et al., 2009; Joyce et al., 2004; Hong et al., 2007). To produce accurate flood data,
accurate rainfall is also needed. Accurate rainfall data can be obtained through direct
observation using rain gauge. However, currently monitoring rainfall has not covered all
areas on the surface of the earth. This is due to limited rainfall observation points. The

Journal of Physics: Theories and Applications E-ISSN: 2549-7324 / P-ISSN: 2549-7316
J. Phys.: Theor. Appl. Vol. 2 No. 2 (2018) 73-82 doi: 10.20961/jphystheor-appl.v2i2.30670
74 The Application of Scilab Software in Frequency Mode…
existence of these limits will certainly be a limitation for users in obtaining rainfall
information. Therefore, to make flood early warnings in an area used rainfall estimation
data from weather satellites.
Weather satellite data is one solution to overcome the problem of limited observation
data. In addition, weather satellite data has spatial and temporal resolution that is
suitable for making predictions as early warning information. This is because weather
satellites have a very wide range of observations with a high enough frequency of
observation and data that can be obtained up-to-date and are free of charge. One method
of estimating rainfall based on cloud temperatures using weather satellites is the
Convective Stratiform Technique (CST) method. CST is a method of precipitation
estimation with convective group and stratiform separation found by Adler and Negri
(1988). This study aims to determine the estimated rainfall that is useful for making
early warning of flood events. According to Andani and Endarwin (2017), CST method
can be applied for estimating rainfall in Pontianak. The correlation of CST and rainfall
of Hellman observation showed a good result. The result also shown a high correlation
in Surabaya (Putra and Andani, 2016). While, on using radar reflectivity in Surabaya,
correlation between reflectivity and rainfall estimation have a good result by using
CAPPI. Based on this, an early warning was made for the Tanah Datar District using
satellite data and gematronic weather radar based on October 10, 2018 events.
2. Data and Methods
2.1. Location and Time of Research
This research was conducted in Tanah Datar which is located at 0.52º LS and
100.81ºBT and Padang Pariaman at 0.53º LS and 100.25º BT. The time of research was
during the occurrence of flash floods and landslides by taking case studies on 8-12
October 2018.
Figure 1. Map of the Research Location
Journal of Physics: Theories and Applications E-ISSN: 2549-7324 / P-ISSN: 2549-7316
J. Phys.: Theor. Appl. Vol. 2 No. 2 (2018) 73-82 doi: 10.20961/jphystheor-appl.v2i2.30670
D. N. S. Handayani, Y. Pramudya, Suparwoto, Muchlas 75
2.2. Data
The data used in this study include:
1. Observation data of data accumulated daily rainfall obtained from the results of
measurement with rain gauge from the station
2. IR-1 channel data of Himawari satellite imagery in the PGM and DAT format
obtained from http://weather.is.kochi-u.ac.jp/sat/GAME and http:
//weather.is.kochiu.ac.jp/sat/CAL.
3. The radar data from weather radar in Minangkabau Meteorology station in
Padang.
4. FNL reanalysis data from rda.ucar.edu with spatial resolution 0.25o x 0.25
o and
temporal resolution 6 hours.
2.3. Methods
2.3.1. CST Methods
Satellite data IR-1 channel is processed with the image processor software.
Estimation by the CST method is done by calculating the parameter slope (S) with the
following equation (Andi, 2007; Endarwin, 2014):
(1)
Explanation:
S = slope parameter (K)
T = Cloud Brightness Temperature (TBB) (K)
i dan j = position of the pixel value where S is calculated
k = constant = 0,125
Slope values are used for classification of convective cloud types or not. Separation
of the convective core and stratiform in cloud components is carried out in this method.
Estimated rainfall every hour using the CST method is done by the following equation:
Curah Hujan (mm) = C (Acs/A) T Rc (2)
Explanation:
C = number of convective cell
Acs = Convective / statiform area (km2)
A = average area covered by each pixel (km2)
T = average estimation period (hour)
Rcs = convective / statiform rainfall intensity (mm/hour)
2.3.2. Z-R Relation
Radar estimates the rainfall by utilizing the reflectivity (Z) and rain rate (R) relation
or commonly known as the Z-R relation. The relation of Z-R is mathematically
expressed in equation (3)
Z = a Rb (3)
Value of ‘a’ indicates the average size of the drop diameter in sample volume and b
represents the change in drop size in the sample volume (SELEX, 2013). Raw radar data
)8( ,2,1,1,2,,2,1,1,2 jijijijijijijijiji TTTTTTTTTkS
Journal of Physics: Theories and Applications E-ISSN: 2549-7324 / P-ISSN: 2549-7316
J. Phys.: Theor. Appl. Vol. 2 No. 2 (2018) 73-82 doi: 10.20961/jphystheor-appl.v2i2.30670
76 The Application of Scilab Software in Frequency Mode…
from Minangkabau meteorology station is processed using the Rainbow application
precisely on the RainDART application. Raw radar data is processed into a product that
will be used to estimate rainfall. The step taken is to make a rainfall estimation input
product consisting of PPI, CAPPI, CMAX and SRI. Setting the relation of ZR as a
rainfall conversion equation is done on SRI products, while the ZR relation that will be
used in this study is the Marshall-Palmer ZR relationship (A = 200, b = 1.6), WSR-88D
Convective (A = 300, b = 1.4), Rosenfeld-Tropical (A = 250, b = 1.2), and Sekine (A =
286, b = 1.6).
2.3.3. Verification
Correlation coefficient is a number that states the size of a relation between variables
(Sudjana, 1996). A value of C that approaches 1 or -1 shows a very close relationship.
The correlation coefficient value in this study was obtained by comparing the estimated
rainfall data using the CST method and the Z-R relation to the observation data.
3. Result and Discussion
3.1. Weather Parameters of WRF Output
3.1.1. Surface Wind Streamline Analysis
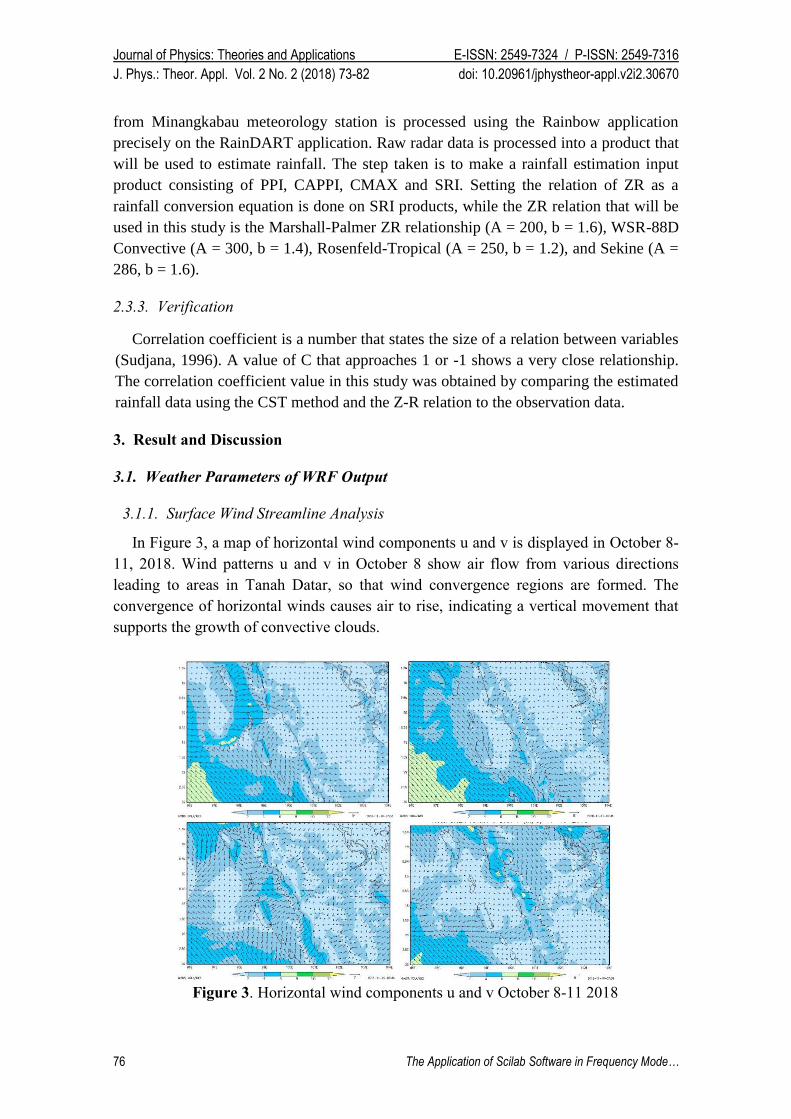
In Figure 3, a map of horizontal wind components u and v is displayed in October 8-
11, 2018. Wind patterns u and v in October 8 show air flow from various directions
leading to areas in Tanah Datar, so that wind convergence regions are formed. The
convergence of horizontal winds causes air to rise, indicating a vertical movement that
supports the growth of convective clouds.
Figure 3. Horizontal wind components u and v October 8-11 2018

Journal of Physics: Theories and Applications E-ISSN: 2549-7324 / P-ISSN: 2549-7316
J. Phys.: Theor. Appl. Vol. 2 No. 2 (2018) 73-82 doi: 10.20961/jphystheor-appl.v2i2.30670
D. N. S. Handayani, Y. Pramudya, Suparwoto, Muchlas 77
In October 9, 2018 the dominant horizontal wind direction pattern from the northeast
to Tanah Datar. In addition, there is air flow from the southwest so that there is an
extended convergence in the area of Tanah Datar. This convergence area that extends
indicates that there is a convective cloud whose horizontal extent. Whereas, horizontal
wind patterns u and v on October 10, there is outflow in Tanah Datar. The air flow
comes from the downdraft convective cloud which is in the dissipation phase.
Downdraft from convective clouds can form a cold pool that can form new convective
cloud cells when atmospheric conditions support. The horizontal wind pattern in 11
October 2018 show a pattern of convergence in Tanah Datar. The convergence area
forms an elongated pattern that shows the convective cloud. The formation of
convective clouds shows that the cold pool in October 10, 2018 has developed into a
new convective cloud cell. Convective cloud cells with elongated patterns can indicate
the phenomenon of squall lines that cause heavy rainfall.
3.1.2. Vertical Profile of Relative Humadity (RH)
From figure 4 it can be seen the vertical profile of Relative Humidity (RH). The
vertical RH profile is used to see the air humidity vertically. If the RH is more than
60%, then this can be implicated as the presence of cloud cover in the area. Based on
the RH profile on October 8, 2018 there is a high RH value (> 60%) up to 500 mb in
Tanah Datar. A high RH value of up to 500 mb indicates the potential for heavy rainfall.
On October 9, 2018 the RH value at the research location still shows above 60% to a
layer of 500 mb so that there is still convective cloud. This RH value is supported by a
pattern of wind convergence which causes vertical motion. Vertical movement brings
moisture to the top layer so that the air becomes moist.
Figure 4. Vertical profile of Relative Humadity (RH) on October 8-11, 2018
Journal of Physics: Theories and Applications E-ISSN: 2549-7324 / P-ISSN: 2549-7316
J. Phys.: Theor. Appl. Vol. 2 No. 2 (2018) 73-82 doi: 10.20961/jphystheor-appl.v2i2.30670
78 The Application of Scilab Software in Frequency Mode…
On October 10, 2018 the RH value is relatively high up to 500 mb until around at
17.00 UTC. Whereas at 17.30 UTC the RH value at 500 mb has decreased (<60%). This
decrease of RH value indicates a reduction in the amount of water vapor at the 500 mb
layer caused by a lack of water supply through an upward vertical motion or updraft.
This is in accordance with the wind pattern on October 10, 2018 which shows a
divergence pattern due to the downdraft so that the water vapor in the upper layer
decreases. On October 11, 2018 an increase the value of RH (> 60%) to a layer of 500
mb at 03.00 UTC. The RH value at the 500 mb layer continues to increase to> 90%
which indicates very humid air. This shows the presence of very high water vapor and
has the potential of heavy rainfall. The RH vertical profile at the scene is strongly
influenced by surface wind patterns. The divergence pattern of surface wind causes a
vertical or updraft motion that brings water vapor to the upper layer which will
condense to form convective clouds that can produce rain. The RH decline on October
10, 2018 shows that water vapor has dropped to heavy rain and cloud dissipation.
3.1.3. Vertical Profile of CAPE
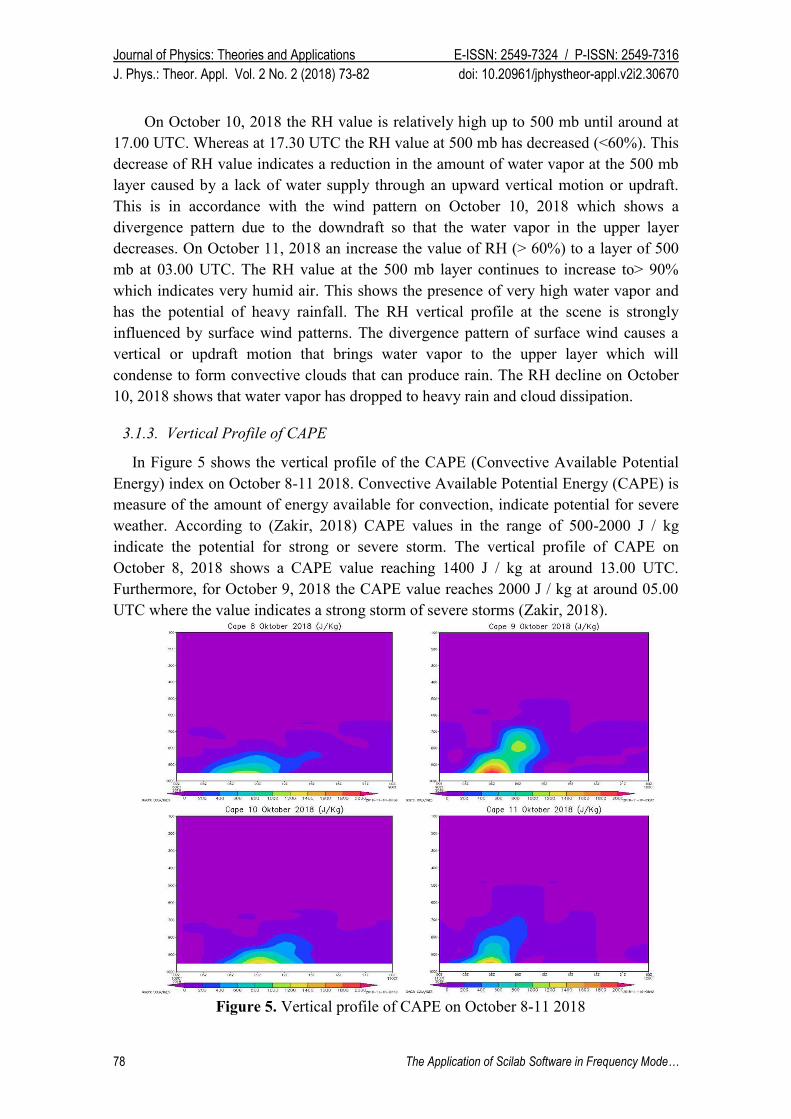
In Figure 5 shows the vertical profile of the CAPE (Convective Available Potential
Energy) index on October 8-11 2018. Convective Available Potential Energy (CAPE) is
measure of the amount of energy available for convection, indicate potential for severe
weather. According to (Zakir, 2018) CAPE values in the range of 500-2000 J / kg
indicate the potential for strong or severe storm. The vertical profile of CAPE on
October 8, 2018 shows a CAPE value reaching 1400 J / kg at around 13.00 UTC.
Furthermore, for October 9, 2018 the CAPE value reaches 2000 J / kg at around 05.00
UTC where the value indicates a strong storm of severe storms (Zakir, 2018).
Figure 5. Vertical profile of CAPE on October 8-11 2018

Journal of Physics: Theories and Applications E-ISSN: 2549-7324 / P-ISSN: 2549-7316
J. Phys.: Theor. Appl. Vol. 2 No. 2 (2018) 73-82 doi: 10.20961/jphystheor-appl.v2i2.30670
D. N. S. Handayani, Y. Pramudya, Suparwoto, Muchlas 79
On October 10, 2018 the highest CAPE value reaches 1400 J / kg and on October 11,
2018 the highest CAPE value also reaches 1400 J / kg. From the CAPE value, it can be
seen that the highest CAPE occurred on October 9, 2018 showing a strong storm cloud
that caused heavy rain causing flash floods and landslides on October 10, 2018.
3.2. Estimated Rainfall Using CST
This CST method will show rainfall estimates on October 8 and 9, 2018. The
selection is based on information on the occurrence of flash floods and landslides on
October 10, 2018, so that rainfall estimates used for early warning take time before the
event.
3.2.1. Estimated Rainfall October 8, 2018
Figure 6. Time series top cloud temperature and rainfall estimation (13.00 UTC)
October 8, 2018
On October 8, 2018, there was heavy rainfall. According to Himawari-8 satellite
data, it is seen that there is a cloud growth which is marked by an increase in the
temperature of the top cloud. Temperatures of cloud brightness that have the potential
causes high rainfall range from 195-235 equivalent to -78 ° C to -40 ° C (Parwati et al.,
2008). In the area around Tanah Datar there is an increase in high temperatures of top
cloud from at 08.00 UTC or 15:00 LT. The highest top cloud temperature is 60.5 oC at
12.00 UTC.
With the CST method, as shown above, a very large rainfall distribution covers
Agam, Tanah Datar, and Limapuluh Kota Districts. The highest estimated rainfall is
40.48 mm. Rainfall with this value is heavy rainfall. At other hours the intensity of
rainfall is also high. The rainfall intensity of 9, 10, 11, 13 and 14 UTC is 20.58 mm,
34.14 mm, 34.14 mm, 40.48 mm and 34.14 mm respectively.
Journal of Physics: Theories and Applications E-ISSN: 2549-7324 / P-ISSN: 2549-7316
J. Phys.: Theor. Appl. Vol. 2 No. 2 (2018) 73-82 doi: 10.20961/jphystheor-appl.v2i2.30670
80 The Application of Scilab Software in Frequency Mode…
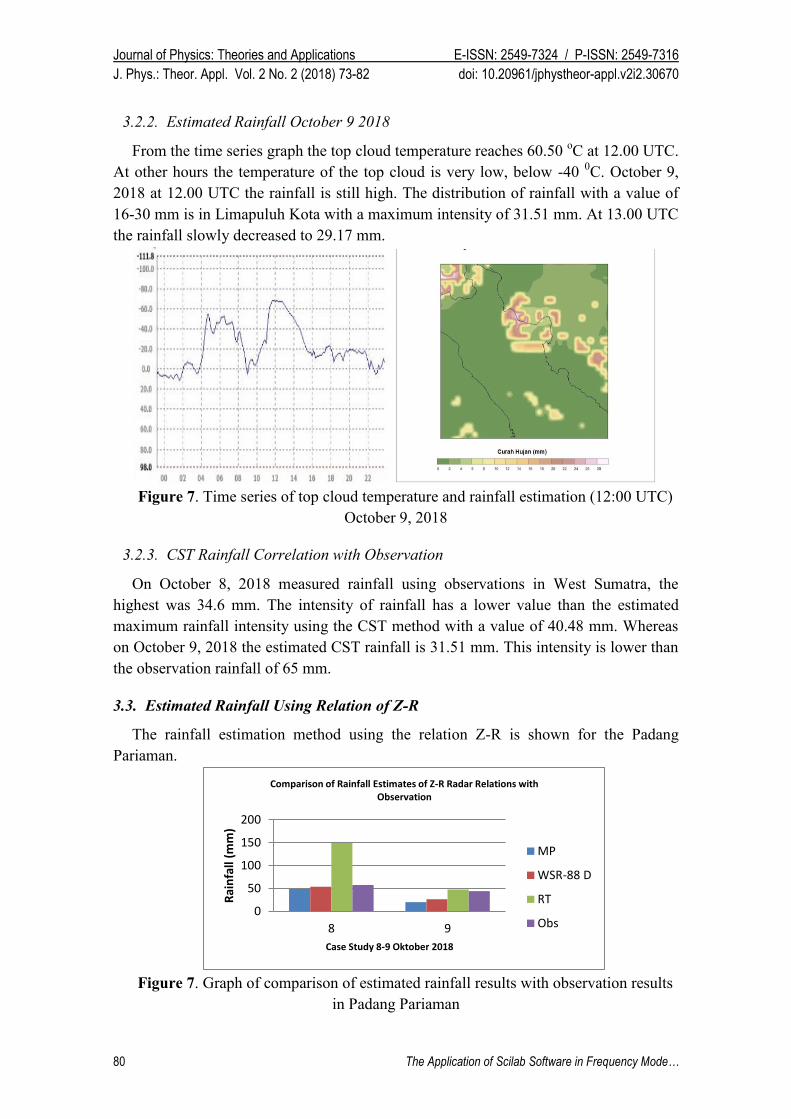
3.2.2. Estimated Rainfall October 9 2018
From the time series graph the top cloud temperature reaches 60.50 oC at 12.00 UTC.
At other hours the temperature of the top cloud is very low, below -40 0C. October 9,
2018 at 12.00 UTC the rainfall is still high. The distribution of rainfall with a value of
16-30 mm is in Limapuluh Kota with a maximum intensity of 31.51 mm. At 13.00 UTC
the rainfall slowly decreased to 29.17 mm.
Figure 7. Time series of top cloud temperature and rainfall estimation (12:00 UTC)
October 9, 2018
3.2.3. CST Rainfall Correlation with Observation
On October 8, 2018 measured rainfall using observations in West Sumatra, the
highest was 34.6 mm. The intensity of rainfall has a lower value than the estimated
maximum rainfall intensity using the CST method with a value of 40.48 mm. Whereas
on October 9, 2018 the estimated CST rainfall is 31.51 mm. This intensity is lower than
the observation rainfall of 65 mm.
3.3. Estimated Rainfall Using Relation of Z-R
The rainfall estimation method using the relation Z-R is shown for the Padang
Pariaman.
Figure 7. Graph of comparison of estimated rainfall results with observation results
in Padang Pariaman
0
50
100
150
200
8 9
Rai
nfa
ll (m
m)
Case Study 8-9 Oktober 2018
Comparison of Rainfall Estimates of Z-R Radar Relations with Observation
MP
WSR-88 D
RT
Obs

Journal of Physics: Theories and Applications E-ISSN: 2549-7324 / P-ISSN: 2549-7316
J. Phys.: Theor. Appl. Vol. 2 No. 2 (2018) 73-82 doi: 10.20961/jphystheor-appl.v2i2.30670
D. N. S. Handayani, Y. Pramudya, Suparwoto, Muchlas 81
Table 1. Value of rainfall correlation results from estimates with radar products at rain
gauge
Date MP WSR-88 D RT Observation
8 October 2018 48,71 mm 53,46 mm 96,2 mm 57,3 mm
9 October 2018 20,27 mm 26,44 mm 47,62 mm 44 mm
Correlation 1 1 1
The maximum rainfall observed in Padang Pariaman on October 8, 2018 reached
57.3 mm while the estimation results showed a maximum value of 96.2 mm from RT-
SRI products. For MP-SRI products shows a value of 48.71 mm, and for WSR-88D-SRI
products shows a value of 53.46 mm. The maximum rainfall observed in Padang
Pariaman on October 9, 2018 reached 44 mm while the estimation results showed a
maximum value of 47.62 mm from RT-SRI products. MP-SRI products show a value of
20.27 mm, and for the WSR-88D-SRI product, the value is 26.44 mm.
Overall, it can be seen that the estimated rainfall generated by the radar on October 8,
2018 to October 9, 2018 is an underestimate for the selection of MP-SRI ZR and
WSR88D-SRI, while the ZR RT-SRI selection is overestimate with the correlation
values is 1.
4. Conclusion
The atmospheric conditions on October 8, 2018 based on wind patterns u and v
indicate the existence of convergence in the area of Tanah Datar District which shows
the convective growth area. This is supported by high CAPE values reaching 1400 J/kg
and RH values > 80% to layers of 500 mb. From the three parameters, it can be
concluded that the atmospheric conditions before the flood are unstable.
Estimated rainfall using the CST method is not good for the West Sumatra area. On
October 8, 2018 estimates of overestimate rainfall compared to observations. Whereas
for October 9, 2018 the estimated rainfall is underestimated. This is the same as rainfall
estimation using the Z-R relation selection method using radar, ie on October 8, 2018
the estimates obtained are overestimate, while on October 9, 2018 the estimates
obtained are underestimated. However, rainfall estimation using the Z-R relation
selection method has a high correlation value, while rainfall estimation using the CST
method has a low correlation value.
Acknowledgements
This research was supported by School of Meteorology Climatology and Geophysics.
We thank our lecturer Dr. Paulus Agus Winarso who provide insight and expertise that
greatly assisted research.
References
Adler, H.F., and Negri, A. J. (1988), A Satellite Infrared Technique to Estimate to
Estimate Tropical Convective and Stratiform Rainfall. Journal of Applied
Meteorology, 27, 30-51.

Journal of Physics: Theories and Applications E-ISSN: 2549-7324 / P-ISSN: 2549-7316
J. Phys.: Theor. Appl. Vol. 2 No. 2 (2018) 73-82 doi: 10.20961/jphystheor-appl.v2i2.30670
82 The Application of Scilab Software in Frequency Mode…
Andani, A.J.P. (2016). Kajian Penerapan Estimasi Curah Hujan Per Jam Memanfaatkan
Metode Convection Stratiform Technique (CST) dan Modified Convective
Stratiform Technique (mCST) di Pontianak. Jurnal Meteorologi Klimatologi
dan Geofisika, 3(3), 9-20.
Andi, I. (2007). Estimasi Curah Hujan Beberapa Kota di Indonesia Menggunakan Data
MT-SAT Kanal Inframerah (IR1). Thesis, Fakultas Ilmu dan Tekonlogi
Kebumian: Institut Teknologi Bandung.
Endarwin. (2014). Modifikasi Convective Stratiform Technique dengan Kombinasi
Data Satelit Gelombang Mikro Pasif dan Inframerah untuk Estimasi Curah
Hujan di Indonesia. Disertation, Program Studi Sains Kebumian Institut
Teknologi Bandung Bandung.
Fatoni, A. R. (2016). Kajian Tingkat Akurasi Produk Radar Cuaca dalam Melakukan
Estimasi Curah Hujan di Surabaya. Jurnal Meteorologi Klimatologi dan
Geofisika, Tangerang Selatan.
Hong, Y., R.F. Adler, A. Negri, and Huffman, G.J. (2007). Flood and Landslide
Applications of Near Real-time Satellite Rainfall Estimation. Journal of
Natural Hazards, doi: 10.1007/s11069- 006-9106-x.
Joyce, R. J., J. E. Janowiak, P. A. Arkin, and P. Xie. (2004). CMORPH: A Method that
Produces Global Precipitation Estimates from Passive Microwave and Infrared
Data at High Spatial and Temporal resolution. J. Hydromet, 5, 487- 503.
Putra, R.M. and Andani, A.J.P. (2016). Estimasi Curah Hujan Di Surabaya (Studi Kasus
12 Desember 2013, 26 Januari 2014 dan 20 Februari 2014). Prosding Egsa
Fair.
Parwati, Suwarsono, Yulianto, F., Suprapto, T. (2008). Penentuan Nilai Ambang Batas
untuk Potensi Rawan Banjir dari Data MT-SAT dan QMORPH. Jurnal
Penginderaan Jauh, 5, 56-63.
SELEX. (2013). Software Manual Rainbow 5 Product & Algorithms, SELEX SIGmbH,
Germany.
Sudjana. (1996). Teknik Analisis Regresi Dan Korelasi, Tarsito: Bandung.
Suwarsono, P., Kusumaning, A.D.S., Kartasamita, M. (2009). Penentuan Hubungan
Antara Suhu Kecerahan dangan MTSAT dengan Curah Hujan Data QMORPH.
Jurnal Penginderaan Jauh, 6(1), 32-42.
Zakir, A. (2018). Analisa Cuaca. Jakarta: STMKG.