UTILIZATION OF ENERGY IN HIGH-FIBER DIETS...
235
UTILIZATION OF ENERGY IN HIGH-FIBER DIETS FED TO PIGS BY NEIL WILLIAM JAWORSKI DISSERTATION Submitted in partial fulfillment of the requirements for the degree of Doctor of Philosophy in Animal Sciences in the Graduate College of the University of Illinois at Urbana-Champaign, 2016 Urbana, Illinois Doctoral Committee: Professor Hans H. Stein, Chair Professor Emeritus George C. Fahey, Jr. Professor Kelly S. Swanson Assistant Professor Maria Regina Cattai de Godoy Professor Gerald C. Shurson, University of Minnesota
Transcript of UTILIZATION OF ENERGY IN HIGH-FIBER DIETS...
UTILIZATION OF ENERGY IN HIGH-FIBER DIETS FED TO PIGS
BY
NEIL WILLIAM JAWORSKI
DISSERTATION
Submitted in partial fulfillment of the requirements
for the degree of Doctor of Philosophy in Animal Sciences
in the Graduate College of the
University of Illinois at Urbana-Champaign, 2016
Urbana, Illinois
Doctoral Committee:
Professor Hans H. Stein, Chair
Professor Emeritus George C. Fahey, Jr.
Professor Kelly S. Swanson
Assistant Professor Maria Regina Cattai de Godoy
Professor Gerald C. Shurson, University of Minnesota

ii
ABSTRACT: Five experiments were conducted to investigate the utilization of energy in high-
fiber diets fed to pigs. Experiment 1 determined the DE, ME, and NE of diets with 0, 15, or 30%
wheat bran added to a corn-soybean meal-based diet fed to growing pigs. Indirect calorimetry
also was used to determine O2 consumption and CO2 and CH4 production to calculate heat
production by pigs. Results indicated that daily O2 consumption and CO2 and CH4 production by
pigs fed increasing concentrations of wheat bran linearly decreased (P ≤ 0.05) resulting in a
linear decrease (P ≤ 0.05) in heat production. The DE (3,454, 3,257, and 3,161 kcal/kg), ME
(3,400, 3,209, and 3,091 kcal/kg), and NE (1,808, 1,575, and 1,458 kcal/kg) of diets decreased (P
≤ 0.05) linearly as wheat bran inclusion increased. Experiments 2 and 3 were conducted to
determine effects of dietary fiber concentration and addition of a Bacillus-based direct-fed
microbial (DFM) on wean-to-finish pigs. Results indicated that nursery pigs fed high-fiber diets
had reduced (P ≤ 0.05) BW at the end of the nursery compared with nursery pigs fed low-fiber
diets. This was because nursery pigs fed high-fiber diets had depressed (P ≤ 0.05) ADFI
compared with nursery pigs fed low-fiber diets, indicating that diet bulk may be a hindrance to
nursery pig feed intake. However, once pigs entered the grow-finish phase of the experiment
(Exp. 3), high-fiber fed pigs experienced compensatory growth and, therefore, BW of high-fiber-
fed pigs was not different compared with low-fiber-fed pigs at the end of the finisher. The
addition of the Bacillus-based DFM to low- or high-fiber diets improved (P ≤ 0.05) G:F in
nursery pigs. We hypothesized DFM addition would increase dietary fiber fermentation, thereby
increasing VFA concentration and available energy; however, this was incorrect and we
observed no effect of DFM supplementation on VFA concentration in the cecum or feces of
nursery pigs. Results also indicated that pigs fed high-fiber diets had decreased (P ≤ 0.05)
dressing percentage because weight of the large intestine was increased (P ≤ 0.05) compared

iii
with pigs fed low-fiber diets. The objective of Exp. 4 was to determine the effects of dietary
fiber, a Bacillus-based DFM, and feeding duration on apparent ileal digestibility (AID) and
apparent total tract digestibility (ATTD) of nutrients and energy by growing pigs. Results
indicated that AID of starch increased (P ≤ 0.05) as period (i. e., feeding duration) increased,
regardless of diet type, which increased (P ≤ 0.05) ME as period increased. Contrary to our
hypothesis, the ATTD of ADF or NDF was not increased as period increased. Addition of DFM
to the low-fiber diet increased (P ≤ 0.05) the AID of ADF, NDF, Lys, Phe, and Glu. Experiment
5 was conducted to determine the disappearance of energy and dietary fiber fractions in the
stomach and small intestine, cecum, and colon of pigs fed a corn-soybean meal basal diet or the
basal plus distillers dried grains with solubles (DDGS), wheat middlings, or soybean hulls. The
apparent cecal digestibility (ACD) and ATTD of soluble dietary fiber was not different among
pigs fed experimental diets. Pigs fed the basal diet, or the basal diet plus wheat middlings, had
greater (P ≤ 0.05) ACD of insoluble dietary fiber compared with pigs fed the basal diet plus
DDGS or soybean hulls, whereas pigs fed the basal plus DDGS diet had greater (P ≤ 0.05) ACD
of insoluble dietary fiber compared with pigs fed the basal plus soybean hulls diet. Wheat
middlings had greater (P ≤ 0.05) disappearance of dietary fiber fractions compared with DDGS
and soybean hulls. Physical characteristics of dietary fiber in experimental diets were not
correlated with digestibility of nutrients and energy by pigs. In conclusion, utilization of energy
by pigs fed high-fiber diets, especially diets with a substantial concentration of insoluble dietary
fiber and a minimal concentration of soluble dietary fiber, was not improved because of
increased dietary fiber digestibility or fermentability, but was improved by increased
gastrointestinal tract weight that allowed for increased intake of a high-fiber diet.
Key Words: adaptation, dietary fiber, digestibility, direct-fed microbial, fermentation, pigs
iv
DEDICATION
This dissertation is dedicated in loving memory to my father, William Anthony Jaworski.
When this life I’m in is done,
And at the gates I stand,
My hope is that I answer all
His questions on command.
I doubt He’ll ask me of my fame,
Or all the things I knew,
Instead He’ll ask of rainbows sent
On rainy days I flew.
The hours logged, the status reached,
The ratings will not matter.
He’ll ask me if I saw the rays
And how He made them scatter
Or what about the droplets clear,
I spread across your screen?
And did you see the twinkling eyes,
Of student pilots keen?
How fast, how far, how much, how high?
He’ll ask me not of these things
But did I take the time to watch
The moonbeams wash my wings?
And did you see the patchwork fields
And mountains I did mold,
The mirrored lakes and velvet hills,
Of these did I behold?
And when the goals are reached at last,
When all the flying’s done,
I’ll answer with no regret –
Indeed, I had some fun.
So when these things are asked of me,
And I can reach no higher,
My prayer this day - His hand extends,
To welcome home a Flyer.
Patrick J. Phillips
v
ACKNOWLEDGMENTS
To Dr. Stein: with your guidance this process has been much more rewarding than I could
ever imagine. I thank you for teaching the scientific process, exemplifying great work ethic, and
demonstrating that success comes with hard work. I am a better scientist and person because of
the doors you opened exposing me to a global swine industry. Thank you for encouraging my
scientific creativity and always making sure opportunities for me were plenty. Your willingness
to go above and beyond made this PhD much less painful. But, don’t worry, this PhD was not
without pain. We really did explore new frontiers and climbed higher mountains. I will always
Dream. Explore. Discover.
To my committee members: finding answers to your questions has been one of the most
rewarding pieces of my PhD. Your challenges bring out the best in me. Your expertise and
enthusiasm for the study of dietary fiber is impressive and I hope that I can share my expertise as
enthusiastically as you have. Dr. Fahey – I thank you for all of your time spent on the countless
letters of recommendation you wrote for me. Please know that they were all very successful.
To Dr. Li and my colleagues at China Agricultural University: my experience in China
was fabulous because of your superb hospitality. I learned so much about Chinese culture and
indirect calorimetry and my career has tremendously benefited from these experiences. I look
forward to working together in the future.
To the Stein lab: unforgettable experiences created terrific friendships that I will always
cherish. This work is a representation of all the hard work we put in together and if you think I’ll
forget this, don’t worry, John will never let me live down the work I made you all do for Exp.
460. I could not have accomplished this work without any of you.

vi
To my Mom and sister: the sacrifices you made during my graduate career were
tremendous and this is a reflection of how supportive you are in all of my pursuits. I thank you
for this and all of the love that you have for me and my passions in life.
To my beautiful bride, Elizabeth: your enduring love for me is amazing and I could not
have accomplished all of this work without that. Thank you for tolerating all of the hard work
and sacrifices that went into this work – especially spending 5 weeks on a Chinese hog farm with
me. I could not have stayed there all summer without you. Thank you for acknowledging all of
my successes throughout my graduate career – you have made my work and life much more
rewarding.

vii
TABLE OF CONTENTS
CHAPTER 1: INTRODUCTION ................................................................................................ 1
LITERATURE CITED ............................................................................................................... 3
CHAPTER 2: APPROACHES TO INCREASE THE UTILIZATION OF ENERGY IN
HIGH-FIBER DIETS FED TO PIGS: REVIEW OF LITERATURE .................................... 4
INTRODUCTION ...................................................................................................................... 4 CHEMICAL CHARACTERISTICS OF DIETARY FIBER ..................................................... 5 PHYSICOCHEMICAL CHARACTERISTICS OF DIETARY FIBER .................................... 7 UTILIZATION OF DIETARY FIBER .................................................................................... 13 ENERGY SYSTEMS ............................................................................................................... 16
PREBIOTICS ............................................................................................................................ 28 DIRECT-FED MICROBIALS.................................................................................................. 30
ADAPTATION TO HIGH FIBER DIETS ............................................................................... 35
CONCLUSION ......................................................................................................................... 37
LITERATURE CITED ............................................................................................................. 37 TABLES ................................................................................................................................... 58
CHAPTER 3: DIGESTIBLE, METABOLIZABLE, AND NET ENERGY IN DIETS
CONTAINING 0, 15, OR 30% WHEAT BRAN FED TO GROWING PIGS ...................... 59
INTRODUCTION .................................................................................................................... 60 MATERIALS AND METHODS .............................................................................................. 61 RESULTS AND DISCUSSION ............................................................................................... 67
CONCLUSION ......................................................................................................................... 73 LITERATURE CITED ............................................................................................................. 75
TABLES ................................................................................................................................... 81
CHAPTER 4: EFFECT OF A 3-STRAIN BACILLUS-BASED DIRECT-FED
MICROBIAL ON GROWTH PERFORMANCE AND INTESTINAL
CONCENTRATIONS OF VOLATILE FATTY ACIDS IN NURSERY PIGS FED LOW-
OR HIGH-FIBER DIETS .......................................................................................................... 89
INTRODUCTION .................................................................................................................... 90
MATERIALS AND METHODS .............................................................................................. 91 RESULTS ................................................................................................................................. 97 DISCUSSION ........................................................................................................................... 99 CONCLUSION ....................................................................................................................... 105
LITERATURE CITED ........................................................................................................... 107 TABLES ................................................................................................................................. 114
CHAPTER 5: EFFECT OF A 3-STRAIN BACILLUS-BASED DIRECT-FED
MICROBIAL ON GROWTH PERFORMANCE, INTESTINAL CONCENTRATIONS OF
VOLATILE FATTY ACIDS, CARCASS CHARACTERISTICS, AND
GASTROINTESTINAL TRACT WEIGHTS IN GROWING-FINISHING PIGS FED
LOW- OR HIGH-FIBER DIETS ............................................................................................ 123
INTRODUCTION .................................................................................................................. 124 MATERIALS AND METHODS ............................................................................................ 125 RESULTS ............................................................................................................................... 132
viii
DISCUSSION ......................................................................................................................... 137
CONCLUSION ....................................................................................................................... 140 LITERATURE CITED ........................................................................................................... 142 TABLES ................................................................................................................................. 148
CHAPTER 6: EFFECT OF DIET ADAPTATION TIME ON APPARENT ILEAL AND
APPARENT TOTAL TRACT DIGESTIBILITY OF ENERGY AND NUTRIENTS BY
GROWING PIGS FED DIETS WITH DIFFERENT CONCENTRATIONS OF DIETARY
FIBER WITHOUT OR WITH A BACILLUS-BASED DIRECT-FED MICROBIAL ...... 161
INTRODUCTION .................................................................................................................. 162 MATERIALS AND METHODS ............................................................................................ 163
RESULTS AND DISCUSSION ............................................................................................. 166 CONCLUSION ....................................................................................................................... 170 LITERATURE CITED ........................................................................................................... 172
TABLES ................................................................................................................................. 177
CHAPTER 7: DISAPPEARANCE OF NUTRIENTS AND ENERGY IN THE STOMACH
AND SMALL INTESTINE, CECUM, AND COLON OF PIGS FED CORN-SOYBEAN
MEAL DIETS CONTAINING DISTILLERS DRIED GRAINS WITH SOLUBLES,
WHEAT MIDDLINGS, OR SOYBEAN HULLS .................................................................. 190
INTRODUCTION .................................................................................................................. 191 MATERIALS AND METHODS ............................................................................................ 192 RESULTS ............................................................................................................................... 196
DISCUSSION ......................................................................................................................... 201 CONCLUSION ....................................................................................................................... 204
LITERATURE CITED ........................................................................................................... 206 TABLES ................................................................................................................................. 209
CHAPTER 8: CONCLUDING REMARKS .......................................................................... 223

1
CHAPTER 1: INTRODUCTION
Swine production, and agriculture as a whole, must become more sustainable to continue
to be profitable and reach the goal of increasing food production by approximately 70% to feed
an estimated 9.1 billion people by 2050 (Alexandratos and Bruinsma, 2012). Sustainable swine
production effectively minimizes the use of resources, such as feed, to ensure that resources are
not depleted so that food production may continue. Today, sustainability of swine production is
threatened by the growing competition of feed for fuel and food for human consumption, but this
is no different than when Dr. D. E. Becker, a scientist at the University of Illinois at Urbana-
Champaign, began the implementation of the “gold standard” corn-soybean meal-based swine
diet (Becker et al., 1953). Soybean meal was a co-product of the soybean crushing industry that
was un-utilizable for human consumption, and Dr. Becker found a place for this co-product in
swine diets. Still today, new industries provide the swine industry with co-products that typically
are less expensive and un-utilizable for other purposes. Therefore, swine production must take
advantage of co-products to increase the sustainability of pork production.
Co-products are typically less expensive because they mostly contain dietary fiber, which
cannot be digested by the pig (Anquita et al., 2006; Jaworski et al., 2015). Pigs may obtain
energy from dietary fiber by microbial fermentation in the hindgut, which supplies the pig with
volatile fatty acids (VFA) used to synthesize energy or adipose tissue (Bach Knudsen, 2001).
However, the energy contribution from VFA is not as efficient as the energy contribution
obtained from enzymatic hydrolysis in the small intestine, because microbial fermentation of a
feedstuff is not complete, and will result in energetic losses through the production of methane
and carbon dioxide (Bach Knudsen, 2001). Also, the energy contribution from dietary fiber is not
equal among feed ingredients and may have interactions within a mixed diet. When diets contain

2
fibrous co-products and are formulated to contain similar concentrations of metabolizable energy
and standardized ileal digestible amino acids as in a standard corn-soybean meal diet, pig growth
performance and efficiency is reduced although, hypothetically, performance should be similar
(Gutierrez et al., 2013; Jaworski et al., 2014). Performance was not similar because pigs were
unable to consume enough high fiber feed, due to reduced diet bulk density, to meet daily energy
requirements. Therefore, the current research was carried out to help advance co-product
utilization in swine diets.
The overall goal of this work was to investigate the energy contribution and quantify
negative effects of dietary fiber from different co-products added to a corn-soybean meal-based
swine diet. A second objective was to test the hypothesis that addition of a direct-fed microbial
to high-fiber corn-soybean meal-co-product-based diets fed to pigs would increase dietary fiber
fermentation and, subsequently, pig performance would be improved. A third objective was to
test the hypothesis that fermentation of dietary fiber will increase with pig BW and age when
pigs are fed a high-fiber diet because the gastrointestinal tract of the pig will increase in size and
the microbial population in the hindgut will also increase. The fourth objective was to quantify
degradation of different dietary fiber fractions in the stomach and small intestine, cecum, and
colon of pigs and to determine if dietary fiber degradation is correlated with physicochemical
characteristics of dietary fiber present in mixed diets.

3
LITERATURE CITED
Alexandratos, N., and J. Bruinsma. 2012. World agriculture towards 2030/2050: the 2012
revision. ESA Working Paper. Rome, Food and Agriculture Organization.
Anguita, M., N. Canibe, J. F. Pérez, and B. B. Jensen. 2006. Influence of the amount of dietary
fiber on the available energy from hindgut fermentation in growing pigs: Use of
cannulated pigs and in vitro fermentation. J. Anim. Sci. 84:2766-2778.
Bach Knudsen, K. E. 2001. The nutritional significance of “dietary fibre” analysis. Anim. Feed
Sci. Technol. 90:3-20.
Becker, D. E., C. R. Adams, S. W. Terrill, and R. J. Meade. 1953. The influence of heat
treatment and solvent upon the nutritive value of soybean oil meal for swine. J. Anim.
Sci. 12:1:107-116.
Gutierrez, N. A., B. J. Kerr, and J. F. Patience. 2013. Effect of insoluble – low fermentable fiber
from corn – ethanol distillation origin on energy, fiber, and amino acid digestibility,
hindgut degradability of fiber, and growth performance of pigs. J. Anim. Sci. 91:5314-
5325.
Jaworski, N. W., H. N. Lærke, K. E. Bach Knudsen, and H. H. Stein. 2015. Carbohydrate
composition and in vitro digestibility of dry matter and nonstarch polysaccharides in
corn, sorghum, and wheat and coproducts from these grains. J. Anim. Sci. 93:1103-1113.
Jaworski, N. W., J. Shoulders, J. C. González-Vega, and H. H. Stein. 2014. Effects of using
copra meal, palm kernel expellers, or palm kernel meal in diets for weanling pigs. Prof.
Anim. Scientist. 30:243-251.

4
CHAPTER 2: APPROACHES TO INCREASE THE UTILIZATION OF ENERGY IN
HIGH-FIBER DIETS FED TO PIGS: REVIEW OF LITERATURE
INTRODUCTION
New agro-industrial industries provide the swine industry with co-products that typically
are less expensive because they are often not utilizable for other purposes. Therefore, swine
production must take advantage of co-products to increase the sustainability of pork production
from an economic and social perspective. However, the sustainability of pork production from an
environmental perspecitvie is not always increased when co-product inclusion is increased in
swine diets (Mackenzie et al., 2016). For the purposes of this dissertation, therefore,
sustainability of pork production from an economic and social perspective was utilized, but
environmental considerations warrant further investigation.
Most cereal grain co-products contain a larger proportion of dietary fiber compared to the
parent grain (Bach Knudsen, 1997; Jaworski et al., 2015). The pig lacks digestive enzymes to
digest dietary fiber and, therefore, dietary fiber must be fermented by the microbes in the
intestinal tract of the pig to obtain energy (Anguita et al., 2006). Microbial fermentation provides
the pig with VFA that the pig may convert to ATP, which provides the pig with energy.
However, fermentation of dietary fiber results in less energy than does starch hydrolysis, which
is typically supplied by feeding pigs diets containing a large amount of cereal grains and this is
one reason co-products are typically less expensive than cereal grains (Bach Knudsen, 2001).
Also, dietary fiber may reduce the digestibility of nutrients and energy supplied by other feed
5
ingredients included in the diet (Noblet and Le Goff, 2001; Cervantes-Pahm et al., 2014a). These
negative effects of dietary fiber reduce pig growth and efficiency (Bindelle et al., 2008). When
diets containing fibrous co-products are formulated to contain similar concentrations of ME and
standardized ileal digestible AA as a standard corn-soybean meal diet, pig growth performance
and efficiency are sometimes reduced although, hypothetically, performance should be similar
(Gutierrez et al., 2013; Jaworski et al., 2014). It is, therefore, necessary to further investigate
characteristics of dietary fiber that hinder efficient utilization of energy in dietary fiber and to
design strategies that may contribute to increased utilization of dietary fiber in pig diets.
CHEMICAL CHARACTERISTICS OF DIETARY FIBER
Dietary fiber is composed of non-starch polysaccharides (NSP) and lignin (Bach
Knudsen, 1997). Non-starch polysaccharides also are present in the cell wall of plants and the
main NSP in cereal grains and grain co-products commonly used in swine diets are
arabinoxylans and cellulose (Jaworski et al., 2015). Lignin is composed of polymers of
phenylpropanoids and is present in the cell wall of plants and increases in concentration as the
plant matures to provide rigidity to the plant (Liyama et al., 1994). Dietary fiber may be soluble
or insoluble and this distinction is important when considering the subsequent energy value of
fiber fed to pigs (Urriola et al., 2010).
Insoluble Dietary Fiber
Insoluble dietary fiber is composed of lignin, cellulose, and insoluble hemicelluloses. The
majority of dietary fiber in ingredients commonly used in swine diets is insoluble (Jaworski et
al., 2015). Insoluble dietary fiber increases passage rate, fecal bulk, frequency of laxation, and
renders softer feces (Dreher, 2001; Wenk, 2001). Insoluble dietary fiber is less fermentable

6
compared with soluble dietary fiber. The apparent total tract digestibility (ATTD) of insoluble
dietary fiber in corn distillers dried grains with solubles (DDGS), sorghum DDGS, and a corn-
sorghum DDGS blend was 40.3, 41.3, and 28.6%, respectively (Urriola et al., 2010). Therefore,
more than 50% of the insoluble dietary fiber in DDGS does not provide energy to the pig. The
amount of microbial activity in the large intestine is dependent upon body temperature, presence
of fermentable substrates, endogenous secretions, pH, and rate of passage of digesta (Wenk,
2001). A diet composed primarily of wheat bran produced a greater concentration of ATP in the
cecum and colon of pigs, whereas a wheat flour diet produced greater concentrations of ATP at
the terminal ileum, which is an indication of greater microbial activity in the hindgut of pigs
when fed a diet composed primarily of wheat bran (Jørgensen and Just, 1988). This is because
wheat flour will be mostly digested by the end of the ileum, leaving little substrate for microbial
degradation in the large intestine, whereas wheat bran will not be digested in the small intestine,
leaving a large amount of fermentable substrate for the microbial population in the large
intestine.
Soluble Dietary Fiber
Soluble dietary fiber is composed mostly of soluble hemicelluloses, pectins, and gums.
Most ingredients fed to pigs are low in soluble dietary fiber (Jaworski et al., 2015); however,
soybean hulls are a common co-product fed to pigs in the United States and contain
approximately 8% soluble dietary fiber (Burkhalter et al., 2001). Soluble dietary fiber results in
increased digesta viscosity, decreased gastric emptying, increased satiety, reduced rate of glucose
uptake, lower blood cholesterol concentrations, and promotes gut commensal bacterial growth
(de Godoy et al., 2013). Soluble dietary fiber negatively impacts small intestinal nutrient
absorption through the ability to rapidly hydrate and form a viscous gel (Blaxter et al., 1990).

7
Soluble dietary fiber also increases water binding capacity (WBC) and digesta retention time;
therefore, microbes have better access to ferment soluble dietary fiber and that is the major
reason the ATTD of soluble dietary fiber by pigs is 92.0% in corn DDGS (Urriola et al., 2010).
However, the amount of soluble dietary fiber in corn DDGS is approximately 1.1% and diets
containing DDGS contain 1.3%. Therefore, the relative energy contribution of soluble dietary
fiber in a typical U.S. pig diet is low, but because of the almost complete fermentation and VFA
yield from soluble dietary fiber, it is important to quantify the amount of soluble dietary fiber
that is included in the diet.
PHYSICOCHEMICAL CHARACTERISTICS OF DIETARY FIBER
Physicochemical characteristics of dietary fiber include WBC, swelling, viscosity, and
bulk density (Eastwood and Morris, 1992). These characteristics are associated with the chemical
composition of dietary fiber and, therefore, it may be possible to correlate the physicochemical
characteristics of dietary fiber with soluble or insoluble dietary fiber. If feed manufacturers and
pig producers are able to quickly analyze diets and ingredients for these physicochemical
characteristics and relate them to the amount of soluble and insoluble dietary fiber it may be
possible to obtain a better estimate of the amount of energy the diet will provide to the pig.
Water Binding Capacity
Water binding capacity is an estimate of the quantity of water retained in dietary fiber
that has been hydrated and after the application of an external force (Robertson et al., 2000). The
ability of dietary fiber to hold water is dictated by the composition of NSP, the intermolecular
organization of the NSP, and the degree of lignification (Serena and Bach Knudsen, 2007). The
method used to measure WBC is quick and easily reproducible and, therefore, may be

8
advantageous for use in the swine feed industry (Canibe and Bach Knudsen, 2002). Soluble
dietary fiber typically has a greater WBC than insoluble dietary fiber, and cellulose and lignin
have a low WBC (Auffret et al., 1994; Robertson et al., 2000; Shelton and Lee, 2000). In
contrast, arabinose and xylose concentrations are positively correlated with WBC (Holloway and
Greig, 1984). The concentration of soluble NSP in brewer’s spent grain, pea hull, rye grass,
potato pulp, sugar beet pulp, and pectin residue is positively correlated with WBC (Serena and
Bach Knudsen, 2007). However, the apparent ileal digestibility (AID) of starch may be
negatively affected by WBC of diets fed to growing pigs and sows, and dietary ME is reduced if
diets have greater WBC due to increased concentrations of dietary fiber (Canibe and Bach
Knudsen, 2002; Serena et al., 2008). Increasing WBC also may result in increases in endogenous
losses of N, and the AID of CP by pigs fed semi-purified diets is reduced if diets have increased
WBC (Leterme et al., 1998; Cervantes-Pahm et al., 2014a). The AID of GE and starch is less in
dehulled barley compared with corn, which may be a result of increased WBC in dehulled barley
(Cervantes-Pahm et al., 2014b). However, hindgut disappearance of GE is 62.8% greater in pigs
fed dehulled barley compared with pigs fed corn, which indicates that WBC is related to the
amount of soluble dietary fiber in a feed ingredient and, therefore, the degree of fermentation in
the hindgut (Cervantes-Pahm et al., 2014b). Water binding capacity of diets also increased when
5, 10, or 15% copra meal or palm kernel expellers were included in weanling pig diets, and this
corresponded with a linear reduction in pig ADG (Jaworski et al., 2014). Thus, it is possible that
WBC of ingredients can be used to assess the feeding value of diets and ingredients.
Swelling Capacity
Swelling capacity of dietary fiber is a measure that quantifies the volume occupied by
dietary fiber when hydrated (Auffret et al., 1994). The swelling capacity of dietary fiber is
9
affected by NSP composition and organization, and lignification, and as is the case for WBC, the
concentration of soluble NSP in brewer’s spent grain, pea hull, rye grass, potato pulp, sugar beet
pulp, and pectin residue is positively correlated with soluble NSP (Serena and Bach Knudsen,
2007). The close relationship between swelling and the concentration of soluble NSP is expected
because the first step in solubilization of NSP is swelling through the addition of water, which
spreads the NSP until they are extended and dispersed. This increases the surface area, which
results in greater access for microbial colonization and degradation of the substrate and,
therefore, ingredients and diets that have a high swelling capacity are expected to ferment to the
greatest extent (Noblet and Le Goff, 2001; Canibe and Bach Knudsen, 2002). Swelling capacity
of wheat bran, pea hulls, sugar beet fiber, and citrus fiber was decreased when the particle size of
the ingredients was reduced from 900 to 540 to 320 µm (Auffret et al., 1994). A similar effect of
grinding was reported by Serena and Bach Knudsen (2007) and it was concluded that after
freeze-drying and milling of ingredients, the plant cells within the ingredients are no longer
capable of binding water and swelling to the same extent as they are in the original ingredient.
As the swelling capacity of dietary fiber in a diet or ingredient increases, the swelling capacity of
stomach and small intestinal contents is increased, which may result in slower gastric emptying,
increased satiety, and increased bacterial fermentation in the cecum and colon of the pig (Canibe
and Bach Knudsen, 2002; Serena et al., 2009).
Viscosity
Viscosity of dietary fiber refers to the ability to thicken or form gels in solution (Dikeman
and Fahey, 2006). Water has low viscosity and is free flowing, whereas honey has high viscosity
and the flow is much more resistant. Viscosity was first defined by Sir Isaac Newton as the
proportional relationship between the flow of a fluid and the force directed on that fluid.
10
Viscous dietary fibers include most soluble NSP, but gums, pectins, and β-glucans are the
NSPs with the greatest viscosity (Dikeman and Fahey, 2006). Insoluble NSP typically are not
associated with viscosity; however, they may influence viscosity through the absorption of water
(Takahashi et al., 2009). The viscosity of brewer’s spent grain, pea hull, rye grass, potato pulp,
sugar beet pulp, and pectin residue was not much greater than the viscosity of water, despite a
concentration of soluble NSP ranging from 2.1 to 29.0% in these ingredients (Serena and Bach
Knudsen, 2007). However, when the ingredients were included in diets formulated for sows,
viscosity of diets was positively correlated with the concentration of soluble NSP in diets (Serena
et al., 2008). The difference between viscosity of ingredients and diets may imply that viscosity
may not only be affected by soluble NSP, but also starch, protein, and lipid that are present in
mixed diets.
The quantity of dietary fiber also affects the viscosity, but in a non-linear fashion
indicating that there is a critical concentration at which point physical entrapment occurs and
molecular movement is impaired (Oakenfull, 2001; Dikeman and Fahey, 2006). Viscosity also
displays positive correlation with the molecular weight of dietary fiber (Tosh et al., 2004; Lan-
Pidhainy et al., 2007; Le Gall et al., 2009).
Once NSP are ingested and mixed with gastrointestinal fluids, they may thicken and
become viscous by forming physical entanglements, overlapping and interpenetrating one
another within the fluid. Due to this physical entanglement, the digestion and absorption of
nutrients and energy in the small intestine may be negatively affected (Eastwood and Morris,
1992). Two mechanisms of action may explain how increased viscosity may reduce small
intestinal digestion and absorption of nutrients and energy. First, viscosity may reduce the ability
of digestive enzymes to reach their substrates, therefore reducing the digestion of nutrients and
11
energy. The second mechanism is that viscosity may impair peristalsis and mixing of digesta in
the lumen of the small intestine; therefore, diffusion and transport of nutrients across the
unstirred water layer may be restricted, reducing the absorption of nutrients and energy
(Eastwood and Morris, 1992). Pigs fed rye bread had an increased ileal digesta viscosity
compared with pigs fed wheat bread and the increased viscosity may have been the reason AID
of starch and fat by pigs fed rye bread was less than that of pigs fed wheat bread (Le Gall et al.,
2009). A diet containing 11.0 and 30.2% soluble and insoluble dietary fiber, respectively, had
increased diet viscosity compared with a diet containing 7.3 and 36.8% soluble and insoluble
dietary fiber, respectively, but small intestinal digesta viscosity in sows fed these diets was
unaffected (Serena et al., 2008). However, sows had greater nutrient digestibility and energy
utilization when fed the diet containing more soluble dietary fiber with greater viscosity. It was
concluded that viscosity of ileal digesta of sows may not impair nutrient and energy digestibility
and absorption (Serena et al., 2008). A semi-purified diet that was low in soluble dietary fiber
and contained synthetic cellulose had a much lower viscosity and produced a lower ileal digesta
viscosity than a semi-purified diet containing more soluble dietary fiber and carboxymethyl
cellulose (Hooda et al., 2011). When both diets were fed to growing pigs, the AID and ATTD of
nutrients and energy were reduced in pigs fed the low viscosity diet, which was due to decreased
digesta passage rate in pigs fed the high viscosity diet compared with the low viscosity diet
(Hooda et al., 2011). This observation is in agreement with data indicating that soluble dietary
fiber in guar gum increased ileal digesta viscosity, but had no effect on the AID of nutrients and
energy because passage rate to the ileum was reduced and total tract retention time was increased
(Owusu-Asiedu et al., 2006). In theory, high viscosity in diet and digesta should impair nutrient
digestibility, but it appears that increased viscosity in the small intestine slows gastrointestinal

12
transit time and, therefore, allows more time for enzymatic digestion and microbial fermentation,
which negates possible negative effects of increased viscosity. However, it is possible that
synthetic fiber sources have different effects on diet and digesta viscosity compared with fiber
sources that are typically included in swine diets. Compared with corn, Nutridense corn, dehulled
barley, dehulled oats, polished white rice, sorghum, and wheat, feeding of rye increased ileal
digesta viscosity in pigs and, therefore, AID and ATTD of nutrients and energy in rye were less
than for the other cereal grains (Cervantes-Pahm et al., 2014b).
Bulk Density
Bulk density is a measure of the weight of a feed ingredient or diet when placed in a
container with a known volume (Giger-Reverdin, 2000). Bulk density is measured by placing a
feed ingredient or diet in a graduated cylinder with a known volume and the weight is recorded
(Cromwell et al., 2000). Bulk density of 24 different feed ingredients with a wide range of
dietary fiber composition had a strong negative correlation with the NDF concentration in the
ingredients and, therefore, bulk density may give a good approximation of the quantity of
insoluble dietary fiber within a feed ingredient (Giger-Reverdin, 2000). Bulk density of diets also
decreased due to addition of wheat bran and dried grass meal, but bulk density of diets was
increased by dried citrus pulp, indicating bulk density decreased in diets due to increased
concentrations of insoluble dietary fiber, whereas bulk density is unaffected or may be increased
in diets due to increased concentrations of soluble dietary fiber (Kyriazakis and Emmans, 1995).
Addition of 5, 10, or 15% copra meal, palm kernel expellers, or palm kernel meal to diets also
reduced bulk density of diets, further indicating that increased NDF results in reduced bulk
density (Jaworski et al., 2014). Bulk density also may provide an indication of feed intake of pigs
because when a bulky, less digestible fibrous feed ingredient is added to a diet, the pig will
13
increase feed intake to maintain a constant intake of DE, which will maintain growth. However,
there is a point at which the pig is unable to consume enough of the bulky, fibrous feed
ingredient to maintain growth and this effect is referred to as gut fill (Kyriazakis and Emmans,
1995). Also, as bulk density of diets decreased, weight of the gastrointestinal tract of pigs was
increased, thereby increasing the energy required by the pig for maintenance (Kyriazakis and
Emmans, 1995). Therefore, bulk density of diets may provide an indication of feed intake and
gastrointestinal tract weight, both of which affect energy utilization of pigs.
UTILIZATION OF DIETARY FIBER
Dietary fiber must be fermented by microbes in the gastrointestinal tract of the pig to
obtain energy because the pig lacks digestive enzymes capable of dietary fiber digestion
(Anguita et al., 2006). Fermentation is defined as an enzymatically controlled anaerobic
breakdown of an energy containing compound which, in the case of the pig, is typically dietary
fiber because most other nutrients are digested and absorbed by the end of the small intestine.
Total viable counts of anaerobic bacteria increase from 107 viable counts in the pig stomach to
109 viable counts in the distal ileum to 1012 viable counts in pig feces (Jensen and Jørgensen,
1994). Microbial populations increase from the stomach to the large intestine in pigs because the
large intestine has a low oxygen concentration, a low flow rate, and a high moisture content,
which are all favorable conditions for microbial growth (Bach Knudsen et al., 2013).
Most fermentation occurs in the hindgut of the pig (i. e., cecum and large intestine);
however, the AID of NSP by pigs ranges from -7 to 40%, indicating that some fermentation can
occur prior to the hindgut of the pig (Bach Knudsen et al., 2013). Fermentation is a symbiotic

14
advantage for the pig and the microbial population in the gastrointestinal tract because the
microbes enzymatically break down dietary fiber into products that the microbes may use as an
energy source, but also the microbes break down dietary fiber into smaller energy-containing
end-products that can be further oxidized by the pig to obtain energy. Dietary fiber is fermented
into smaller polysaccharides, and monomers are absorbed by the microbes and metabolized to
ATP (White, 2000). Through this process, intermediates (i. e., by-products) such as ethanol,
lactate, and succinate are produced by the microbes and are excreted (Flint et al., 2008). Other
microbes then can use these intermediates as a substrate and excrete a second product (Urriola,
2010). The final end-products of microbial fermentation of dietary fiber are acetate, propionate,
butyrate, ammonia, hydrogen, methane, and carbon dioxide (Jensen and Jørgensen, 1994).
The gases produced are a loss of energy because the pig is unable to absorb and
metabolize the gases and approximately 25% of dietary energy is lost in these gases (Jørgensen,
2007; Bach Knudsen et al., 2013). The gases must be excreted through flatus, and most of the
ammonia and methane are excreted this way. However, only small amounts of hydrogen are
excreted as flatus by the pig and a number of different pathways have been suggested (Jensen
and Jørgensen, 1994). In ruminants, hydrogen is used by methanogens to produce methane that is
eructated, but the amount of methanogens in the hindgut of pigs is fairly low so the hydrogen
must be eliminated through other routes such as the saturation of unsaturated fatty acids,
reduction of nitrate to ammonia, reduction of sulfate to sulfide, reduction of carbon dioxide to
methane, and reduction of carbon dioxide to acetate (Jensen and Jørgensen, 1994).
The common ratio of short-chain fatty acids found in feces is 60:20:20 acetate,
propionate, and butyrate, respectively (Flint et al., 2012). However, different sources of dietary
fiber may affect this ratio producing ranges from 60-90, 10-30, and 1-20 for acetate, propionate,

15
and butyrate, respectively (Titgemeyer et al., 1991). The fermentation of insoluble dietary fiber
in the form of wheat bran yields a greater amount of propionate, whereas the fermentation of
soluble dietary fiber in the form of sugar beet fiber yields a greater amount of acetate (Michel
and Rerat, 1998). The fermentation of resistant starch yields greater acetate production, but also
the molar ratio of butyrate to acetate and propionate is increased (van der Meulen et al., 1997;
Topping and Clifton, 2001; Guiberti et al., 2015).
Short-chain fatty acids are absorbed through passive diffusion, carrier-mediated, or by
transporters. Passive diffusion requires the protonated form, and only 1% of total short-chain
fatty acids in the intestinal lumen is protonated, but hydrogens are exchanged at the apical
epithelium where the pH is lower compared with the center of the lumen and, therefore, almost
50% of short-chain fatty acids are protonated by the time they are present at the apical epithelium
(Cook and Sellin, 1998). It has been indicated that up to 60% of short-chain fatty acids are
absorbed this way.
The carrier-mediated mechanism exchanges bicarbonate for the short-chain fatty acid at
the intestinal epithelium (Cook and Sellin, 1998). More recent discoveries have indicated that
short-chain fatty acid transporters exist throughout the human body, but abundance of
transporters corresponds with short-chain fatty acid production (Gill et al., 2005). These
transporters are known as monocarboxylate transporters (MCT) and MCT1 is the transporter that
is present in the pig intestine (Welter and Claus, 2008). A second transporter in the colon of
humans is the sodium monocarboxylate transporters (SMCT), which is a sodium-coupled
electrogenic transporter with a high affinity for butyrate (Thangaraju et al., 2008). The SLC5A8
form of 1 SMCT was first identified due to its ability to aid in butyrate transport and caused
growth arrest and apoptosis in human colon cancer cells (Ganapathy et al., 2013). Little research
16
has been conducted on MCT in pigs because it has been assumed that absorption of short-chain
fatty acids occurs mainly through passive diffusion and maximum absorption is always reached.
This assumption is a result of infusion studies that indicate less than 1% of short-chain fatty acids
infused in the cecum are recovered in the feces of pigs (Jørgensen et al., 1997). However, many
experiments utilize the concentration of short-chain fatty acids in ileal and cecal digesta and
feces of pigs as an indication of the amount of fermentation that occurred (Urriola and Stein,
2010; Jaworski et al., 2014; Rojas, 2015). Short-chain fatty acids recovered in feces have not
been absorbed by the pig and, therefore, absorption of short-chain fatty acids is not maximized
by the pig and this is a loss of energy from the fermentation of dietary fiber. More research is
necessary on the absorption of short-chain fatty acids by pigs to increase the amount of energy
obtained from the fermentation of dietary fiber.
ENERGY SYSTEMS
Gross Energy
Gross energy, also known as the heat of combustion (ΔHc), is defined as the amount of
energy released as heat when a compound is oxidized completely. This energy value is typically
expressed as calories per gram or as Joules per gram. Joule is the international unit for
expressing energy (1 calorie = 4.184 J). Gross energy in animal nutrition experiments is
determined directly through the use of a bomb calorimeter. Classical bomb calorimetry, known
as adiabatic bomb calorimetry, was first proposed by Holman (1895). In adiabatic calorimetry,
there is no exchange of heat between the calorimeter and the surroundings, hence the term
adiabatic (McLean and Tobin, 1987). Today, most calorimeters are isoperibol, which allows for

17
heat exchange between the calorimeter and the environment and a microprocessor in the
calorimeter measures the effect of any heat leak (Zumdahl and DeCoste, 2010). Gross energy
also may be estimated from the chemical composition of a compound where carbohydrates
contain a range from 3.7 kcal / kg (glucose and simple sugars) to 4.2 kcal / kg (starch and
cellulose), protein contains 5.6 kcal / kg, lignin contains 6.9 kcal / kg, and fat contains 9.4 kcal /
kg (Atwater and Bryant, 1900; Jung et al., 1999). The GE in a molecule increases as the carbon
chain in that molecule increases (Pond et al., 2005). The amount of ether extract (EE), CP, and
ash that a feed ingredient or diet may contain also can be used to predict the GE in that
ingredient or diet using Eq. [1] (Ewan, 1989):
GE = 4,143 + (56 × % EE) + (15 × % CP) – (44 × % Ash). [1]
However, the GE of feed ingredients is a measurement of potential energy, which is not an
appropriate measure to determine which ingredients will provide the most energy to the pig
(NRC, 2012; Table 2.1).
Digestible Energy
The amount of energy that is digested throughout the entire gastrointestinal tract is
defined as DE. The DE of a feed ingredient or diet may be calculated by subtracting the amount
of GE in feces from the amount of GE in the ingredient or diet (NRC, 2012). However, this is an
apparent measurement because feces contains endogenous losses of cells, microbes, enzymes,
and by-products from microbial fermentation (Pond et al., 2005). This becomes more important
pertaining to fibrous ingredients and diets because endogenous losses of energy containing
components are expected to increase as dietary fiber concentration increases and, therefore, DE
of a fibrous ingredient or diet will be underestimated. On the other hand, endogenous losses of

18
energy containing components are a loss of energy to the pig and, therefore, DE values may be
appropriate because endogenous losses of energy are included in the maintenance energy
requirement of swine.
Metabolizable Energy
Metabolizable energy is equal to GE minus DE minus energy lost in urine and
fermentative gases (NRC, 2012). The energy lost as fermentative gases is relatively low in
growing pigs and has been reported to range from 0.008 to 0.10% of dietary DE in 120 to 150 kg
pigs (Noblet and Le Goff, 2001). Therefore, most ME values are calculated by subtracting GE in
urine from DE values. Urinary energy losses are mostly influenced by the AA balance in the diet.
However, if a greater amount of fibrous co-products are fed to growing swine, the potential for
increasing the production of fermentative gases is greater. Also, urinary N excretion is decreased
if the concentration of dietary fiber is increased in diets fed to growing pigs because of the
increased microbial mass in the large intestine. Microbes utilize N bound for urinary excretion as
a substrate for growth (Zervas and Zijlstra, 2002). Therefore, ME values may overestimate the
available energy in fibrous co-products due to the increased loss of fermentative gases and the
shift from urinary N excretion to fecal N excretion.
Net Energy
In the United States, the energy content of pig feed ingredients has generally been
evaluated using DE and ME systems. However, the energy value of high-fiber or high-protein
ingredients may be overestimated, whereas the energy value of high-fat or high-starch
ingredients may be underestimated using DE and ME systems (Noblet and Henry, 1993).
Therefore, a more accurate estimate of the energy content of pig feed ingredients may be

19
obtained using a NE system because NE accounts for the heat increment associated with the
metabolic utilization of ME and with the energy cost of ingestion, digestion, and physical
activity (Noblet and van Milgen, 2004). Also, the NE system expresses diet energy and the
energy requirement of the pig on the same basis, making it a more accurate system (Noblet and
van Milgen, 2004).
The heat increment is equal to the metabolic rate, which is the heat production (HP) per
unit of time and is expressed relative to body surface area. Based on research that determined the
surface areas of two bodies of similar shape and density, but of different size, it was determined
that surface area can be calculated as the two-third power of their weights (BW0.67; Kleiber,
1975; van Milgen and Noblet, 2003). Expressing energy values relative to metabolic BW ensures
that differences in BW are not the sole cause of changes in heat increment (van Milgen and
Noblet, 2003). By measuring the NE of feed ingredients, it may be possible to more accurately
predict the energy contribution of the feed ingredient to the diet, especially with regards to
ingredients containing high concentrations of dietary fiber. Therefore, it is hypothesized that
high-fiber co-products may be more efficiently utilized in pig diets through a more accurate
prediction and correlation of the NE contribution in a diet from the physicochemical
characteristics of the dietary fiber within feed ingredients.
Net energy is divided into energy used for maintenance (NEm) and energy used for
production (NEp). Maintenance energy is measured directly in a fasted state or estimated by
regressing energy retention of animals consuming graded levels of ME on energy intake (Noblet
and van Milgen, 2013). Energy used for maintenance corresponds to the energy needed for
resting heart rate, organ function, and thermogenesis.

20
Dietary fiber may affect the NEm in different ways. The most widely accepted cause is
that as growing pigs are fed increasing concentrations of dietary fiber, the gastrointestinal tract
increases in size and length (Kyriazakis and Emmans, 1995; Jørgensen et al., 1996). Baldwin
(1995) reported that the gastrointestinal tract and liver account for 30% of the maintenance
energy requirement; therefore, as the gastrointestinal tract becomes larger, the more energy is
required to maintain this metabolically expensive organ. The NEp corresponds to the energy
required for productive functions, which include body growth, reproduction, milk production in
lactating sows, and fetus growth in gestating sows. Dietary fiber affects the NEp mainly because
the digestibility of energy in dietary fiber is low, but dietary fiber also may limit the digestibility
of protein and lipids in the mixed diet, thereby decreasing the amount of energy available for
NEp (Noblet and Le Goff, 2001). The heat increment and NEp are difficult to separate from total
HP, and therefore, NE is usually calculated as the sum of NEm and retained energy (Noblet,
2007).
Retained energy can be determined using the comparative slaughter method, direct
calorimetry, or indirect calorimetry (Kil et al., 2013). The comparative slaughter method
involves slaughtering an initial subset of pigs at the beginning of the experiment and then
slaughtering all or a subset of animals at the end of the experiment. The total quantity of energy,
protein, and lipids in each animal then are calculated from the sum of the energy, protein, and
lipids in blood, viscera, and carcass and retained energy is calculated as the difference between
final quantity of energy, protein, and lipids, and the initial quantity of energy, protein, and lipids
(Kil et al., 2011; Ayoade et al., 2012). When the comparative slaughter method is used, the NEm
must be calculated by multiplying the BW0.6 by 197 kcal (NRC, 2012), which is the estimated
maintanence energy requirement of growing swine. The advantages of this method are that a
21
better estimate of body composition gain is obtained, the feeding, housing, and management
systems usually resemble those similar to commercially raised pigs, and this method is less
expensive because no respiration chambers are necessary (Kil et al., 2013). The disadvantages of
the comparative slaughter method are that the energy concentration of the initial group of
slaughtered pigs may not appropriately account for the large variation typically found in the
energy concentration of the pigs fed the experimental diets. Therefore, in order to account for
this error, large numbers of animals and long experimental periods must be utilized (Quiniou et
al., 1995; Boisen and Verstegen, 2000; Kil et al., 2013).
Calorimetry has come a long way since the first direct calorimeter was invented in 1782
by Lavoisier, which used a guinea pig inside a chamber surrounded with ice and the heat that the
guinea pig produced melted the ice, allowing for the quantification of HP (Lavoisier, 1789).
Direct calorimetry measures total heat loss from the animal, whereas indirect calorimetry
measures total energy production (Ferrannini, 1988). Temperature in the calorimeter must be
constant when using direct calorimetry and, therefore, effects of temperature and humidty on HP
may not be determined when using direct calorimetry. Armsby determined that HP
measurements determined using direct or indirect calorimetry are not different and, therefore,
direct calorimetry is no longer used because it cannot account for differences in temperature
(cited by Brody, 1945).
Calorimetry is founded on the first two laws of thermodynamics that state: 1) energy can
neither be created nor destroyed, and 2) any change in the total energy content of a system results
in a change in both the free energy and the entropy of the system (Kleiber, 1975). Animals
consume nutrients that must be oxidized to free chemical energy in order to produce a high-
energy compound that can be utilized by the animal (e. g., ATP); however, this process is not
22
100% efficient and heat is lost during the reaction (Ferrannini, 1988). Therefore, the theory of
indirect calorimetry rests on the assumption that all consumed oxygen is utilized to oxidize
nutrients to free chemical energy and through this process, carbon dioxide is produced. As a
consequence, it is possible to calculate the total amount of heat produced and the amount of
energy retained (Ferrannini, 1988). This is possible because HP in indirect calorimetery is
calculated from the amount of oxygen consumed and the quantities of carbon dioxide, methane,
and urinary N produced during metabolism (McLean and Tobin, 1987). This was developed by
Brouwer (1965) using a multiple regression equation based on constants derived from the
oxidation of mixed carbohydrates, lipids, and proteins according to Eq. [2] (Brouwer, 1965):
HP (kcal) = 3.866 × O2 (L) + 1.200 × CO2 (L) – 0.518 × CH4 (L) – 1.431 × urinary N (g) [2]
where O2 represents the amount of oxygen consumed by the animal and CO2, CH4, and urinary N
represent the amount of carbon dioxide, methane, and urinary N, respectively, excreted by the
animal. Therefore, an indirect calorimeter unit must be able to measure these parameters to
calculate HP. Most indirect calorimetry units place the test subject inside a sealed chamber with
a single air inlet and outlet. The chamber has fresh outside air being continually introduced and
this is called an open-circuit respiration chamber (Young et al., 1975). One type of open-circuit
respiration chamber uses a fan placed at the air outlet to pull fresh air into the chamber and,
hence, this system is termed a pull ventilation system and results in a negatively pressurized
chamber. A second type is called a push ventilation system that uses a fan to push air through the
opening inlet and is a positively pressurized chamber (Brown et al., 1984). A pull system relies
on the chamber being completely sealed, whereas a push system relies on the air exiting the
chamber through the outlet (Ramirez, 2014). Gas consumption and production then are
calculated by the difference in fresh incoming gas minus gas exiting the chamber. Chamber

23
volume, pressure, temperature, humidity, and the velocity of gas flow also must be measured to
complete the calculations (Young et al., 1975). Indirect calorimetry is a much more complex and
expensive system used to measure retained energy compared with the comparative slaughter
method. However, it is advantageous because the retained energy of pigs may be measured over
a short period of time, effects of temperature and humidity on metabolism can be determined,
and a more complete picture of metabolism is determined (Kil et al., 2013).
In conclusion, indirect calorimetry typically results in greater estimates of energy
retention compared with the comparative slaughter method and this directly effects NE values
(Quiniou et al., 1995; van Milgen and Noblet, 2003; Kil et al., 2013). However, Ayoade et al.
(2012) recently reported that the NE of diets containing 0, 15, or 30% wheat-corn DDGS was not
different when determined with the comparative slaughter or indirect calorimetry method, but
retained energy was greater if measured with the comparative slaughter method. Therefore,
further research is necessary to elucidate effects of methodology on retained energy and NE of
diets.
Factors Affecting Dietary Net Energy
(1) Fasting heat production. The NEm is equal to fasting heat production (FHP) plus
energy allocated for physical activity (van Milgen et al., 2001), whereas the NEm is equal to FHP
plus heat increment associated with maintenance (NRC, 2012). Therefore, it is understood that
FHP is the best estimate of NEm. The NEm for growing swine has been suggested to be 197
kcal/kg BW0.6 (Birkett and de Lange, 2001; NRC, 2012). This is typically measured by using
indirect calorimetry through fasting the pig and the value obtained is referred to as FHP. This
value can range from 191 to 216 kcal/kg BW0.6 in growing pigs, and is influenced by the length
of fasting period, feeding level, diet composition prior to fasting, physical activity of pigs,
24
genotype, and sex (Koong et al., 1982; van Milgen et al., 1998; de Lange et al., 2002; Labussière
et al., 2011; NRC, 2012). Fasting heat production also can be estimated using linear regression
by extrapolating HP measured at different feeding levels to 0 ME intake (FHPr; Noblet and van
Milgen, 2013). However, FHP determined directly by fasting the pig is greater compared with
FHPr (de Lange et al., 2006; Noblet and van Milgen, 2013; Liu et al., 2014) and is because
previous diet and feeding level affects FHP (Labussière et al., 2011; Zhang et al., 2014).
Therefore, it may be more accurate to estimate FHP directly by fasting the pig immediately after
a period of feeding (Noblet and van Milgen, 2013). However, when determing FHPr, Noblet et
al. (1994) and Labussière et al. (2011) assumed that the relationship between HP and ME intake
below maintenance in pigs was linear. This was because de Lange et al. (2006) determined the
relationship between HP and ME intake above maintenance in pigs was linear. However, Kleiber
(1975) reported that the partial efficiency of energy utilization for maintenance was greater than
it was for production and, therefore, the relationship between HP and ME intake below
maintenance in pigs may not be linear. Indeed, the relationship between HP and ME intake
below maintenance in pigs is not linear, but exponential (Zhang et al., 2014). Therefore, a more
accurate estimate of the NEm is attained from a wide range of ME intakes both below and above
the requirement and estimated using exponential regression between HP and ME intake (Zhang
et al., 2014). The NEm estimated from this approach is 181 and 175 kcal/kg BW0.6/d for growing
and finishing pigs, respectively (Zhang et al., 2014).
Dietary fiber fed to pigs influences the estimation of FHP due to an increased
gastrointestinal size and influences protein and lipid deposition of pigs, which will also affect
FHP. Depending on diet formulation and energy digestibility, addition of dietary fiber may limit
dietary ME or dietary ME intake. Therefore, lipid deposition will be limited and the subsequently
25
measured FHP will be less because it is energetically expensive to deposit fat over lean (Quiniou
and Noblet, 1995; van Milgen et al., 1998; van Milgen et al., 2001). Addition of dietary fiber to
swine diets may reduce HP due to reduced physical activity of pigs; therefore, pigs previously
fed high-fiber diets may have reduced physical activity when measuring FHP, which may affect
the accuracy of FHP estimates because approximately 8% of ME intake may be used for physical
activity in growing pigs (Schrama and Bakker, 1999; van Milgen and Noblet, 2000).
(2) Heat production. Heat production is represented as the amount of energy required by
the pig for conversion of feed energy to body energy and the energy cost of physical activity.
Heat production is a measure of the conversion of feed to body protein and lipid. Oxidation of
organic compounds in diets produces energy that is available to the pig, but through the
oxidation process, some energy is lost as heat and, hence, the term HP. Heat production is
estimated from gas exchanges and urinary losses of N according to Brouwer (1965) using Eq.
[2].
Dietary fiber has a 60% efficiency of ME utilization compared with 60, 82, and 90% for
CP, starch, and lipid, respectively (Schiemann et al., 1972; Just et al., 1983; Noblet et al., 1994;
van Milgen et al., 2001). Therefore, HP is expected to increase with increased inclusion of
dietary fiber in pig diets due to the low efficiency of ME utilization, but also because of
increased feed intake, increased size of the gastrointestinal tract in relation to BW, and increased
hindgut fermentation resulting in energetic losses of methane (Jørgensen et al., 1996). The HP of
gestating sows increased from 6,267 to 6,422 to 6,475 kcal/d when fed a control corn-wheat-
barley-soybean meal-based diet (8.6% NDF), the control diet plus 22.2% alfalfa (15.2% NDF),
or the control diet plus 22.2% straw (21.4% NDF), respectively (Noblet et al., 1989). Sows fed
the control diet and the straw-containing diet lost less than 1% of DE as methane, whereas sows
26
fed the alfalfa containing diet lost 2.8 to 3.0% of DE (Noblet et al., 1989). Pectin is present in
alfalfa and fermentation of pectin results in a greater production of methane, whereas pectin is
not present in straw, but straw does contain cellulose and fermentation of cellulose does not
result in a large production of methane because it is less fermentable (Müller and Kirchgessner,
1985; 1986). However, methane production is not always indicative of the amount of hindgut
fermentation (Noblet et al., 1989). Methane energy loss as a percentage of DE increased from
0.2% when pigs were fed a low-fiber diet to 1.2% when pigs were fed a high-soluble fiber diet
(Jørgensen et al., 1996). However, HP was not different between pigs fed the low-fiber (2,149
kcal ME/kg DM) versus the high-soluble fiber diet (2,087 kcal ME/kg DM; Jørgensen et al.,
1996). Methane production and HP of group-housed pigs were not different between pigs fed a
high-starch diet containing 13.34% tapioca meal compared with pigs fed a high-soluble dietary
fiber diet containing 16.66% sugar beet pulp silage formulated to have similar calculated NE
concentrations (Schrama et al., 1996). However, pigs fed the sugar beet pulp silage diet were less
active compared with pigs fed the high-starch diet; therefore, pigs fed the sugar beet pulp silage
diet had a greater amount of HP related to inactivity, which can be inferred to be from the
thermic effects of feeding (Schrama et al., 1996).
The thermic effects of feeding are HP related to feed intake and the two components are;
1) short-term due to the ingestion and digestion of feed, and 2) long-term due to the metabolism
associated with nutrient deposition (van Milgen and Noblet, 2000; Labussière et al., 2013). In a
follow up experiment, Schrama et al. (1998) fed group-housed growing pigs diets containing 0,
5, 10, or 15% sugar beet pulp silage and, again, HP was not different among the diets, but HP
related to activity was decreased as the concentration of sugar beet pulp silage increased in the
diets. Also, daily methane production increased from 1.17 to 2.29 kcal/kg as sugar beet pulp
27
silage increased from 0 to 15% in the diets, indicating that a greater amount of fermentation
occurs with increased sugar beet pulp silage (i. e., soluble dietary fiber) in the diet (Schrama et
al., 1998). Therefore, pigs become less active to compensate for their greater HP associated with
the thermic effects of feeding, which in this case is hypothesized to be associated with the
increased fermentation due to increased dietary fiber in the diet. Indeed, this is the case because
Schrama and Bakker (1999) determined that the HP related to activity of group-housed growing
pigs was decreased due to the substitution of gelatinized corn starch (almost completely digested
before the cecum in pigs) with raw potato starch (resistant to enzymatic digestion and is
fermented in the hindgut of pigs) in the diets. Results of a more recent experiment indicated that
the HP related to activity of group-housed growing pigs also was decreased due to the
substitution of pregelatinized potato starch with raw potato starch in the diets (Bolhuis et al.,
2008), confirming the results of Schrama and Bakker (1999).
Total HP increased in gestating sows fed high-fiber diets compared with sows fed low-
fiber diets, and this was mainly caused by the thermic effect of feeding, which was 11.7 and
8.2% of ME intake in gestating sows fed a high-fiber diet or a low-fiber diet, respectively
(Ramonet et al., 2000). Gestating sows fed the high-fiber diet also had less HP due to activity
because they compensated for the increased HP due to the thermic effect of feeding by being less
active (Ramonet et al., 2000). In contrast, HP of group-housed gestating sows was not different
when sows were fed diets containing 0, 10, 20, or 30% sugar beet pulp silage, although daily
methane production increased from 0.88 to 1.89 kcal/BW0.75 as sugar beet pulp silage inclusion
increased from 0 to 30% (Rijnen et al., 2001). The HP of sows was not different when fed a corn
bran, wheat bran, or sugar beet pulp supplemented diet compared with sows fed a wheat-based
control diet (Le Goff et al., 2002). However, the HP associated with the thermic effect of feeding

28
was greater in the sows fed the wheat bran-supplemented diet, which is in contrast to the
conclusion by Schrama and Bakker (1999) that HP and its association with the thermic effect of
feeding was due to fermentation of dietary fiber and not due to the bulkiness of fiber. Heat
production increased in group-housed growing pigs fed 10 diets with increasing concentrations
of copra meal or soybean hulls; however, HP related to activity and resting was not different
among diets (Rijnen et al., 2003). Also, HP of pigs fed soybean hulls was slightly greater
compared with pigs fed copra meal (Rijnen et al., 2003). Finally, the HP of growing pigs fed
diets with 0, 15, or 30% wheat-corn DDGS was not different (Ayoade et al., 2012).
In conclusion, the HP of pigs and sows is influenced by the amount and type of dietary
fiber that is fed. The HP contributed by the thermic effects of feeding is increased as dietary fiber
increases in the diets and the pig compensates for this energy loss by reducing energy spent on
activity. However, results are inconclusive because results of some experiments report increases
in HP due to increasing concentrations of dietary fiber, whereas other experiments report no
change in HP. It is, therefore, likely that specific properties of dietary fibers may result in
different activities of pigs and differences in HP. Therefore, further investigation into the effects
of dietary fiber on HP are warranted.
PREBIOTICS
“A non-digestible feed ingredient that alters the compositon, or metabolism, of the gut
microbiota in a beneficial matter” is a prebiotic (de Lange et al., 2010). Most prebiotics are
oligasschardes that are highly fermentable and include manna oligosaccharides (MOS),
fructooligosaccharides (FOS), galactooligosaccharides, and chitooligosaccharides (Cromwell,

29
2013). Also, several novel fibers and fermentable carbohydrates exist that elicit a prebiotic
response because they increase VFA production thus, reducing intestinal pH and, therefore,
positively manipulate microbial populations (Beloshapka, 2011).
Yeast cell walls contain large concentrations of MOS and may be supplemented to pig
diets to promote growth (Miguel et al., 2004). It has been indicated that the elicited growth
response may be due to the ability of MOS to inhibit attachment of pathogens with type I
fimbriae to the intestinal wall of pigs (Che et al., 2012). Price et al. (2010) reported that the
addition of MOS (Original XPC; Diamond V, Cedar Rapids, IA) to diets fed to weanling pigs
inoculated with Salmonella did not increase BW or ADG, but reduced fecal shedding of
Salmonella. Post-infection results indicated that weanling pigs fed diets supplemented with MOS
had greater compensatory BW gain compared with pigs fed diets without MOS and this was
attributed to an increase in the beneficial bacteria Bacteroidetes and Lactobacillus (Price et al.,
2000). Further research is necessary to determine the concentration of MOS in co-products,
especially with regard to DDGS. This is because corn is fermented by yeast to produce ethanol
and DDGS and, therefore, MOS may be present in DDGS.
Short and medium chains of fructose with a terminal glucose unit are FOS. Natural
sources of FOS are Jerusalem artichoke, chicory root, onion, asparagus, wheat, rye, and garlic
(Clevenger et al., 1988; Cromwell, 2013). Fructooligosaccharides are not digested in the stomach
and small intestine of pigs, but serve as a fermentative substrate for some bacteria in the large
intestine, which promotes select bacteria such as Bifidobacterium spp. and Lactobacilli spp. to
proliferate at the expense of others (Willard et al., 2000; Swanson et al., 2002). Nursery pigs fed
diets supplemented with FOS had increased villus height and villus-to-crypt ratio and this may
30
be attributed to an increased VFA production because FOS is highly fermentable (Spencer et al.,
1997).
In conclusion, most research pertaining to prebiotics has focused on improving health
status of weanling pigs. However, due to the high fermentability of prebiotics, a greater research
emphasis is necessary on VFA production and absorption and, subsequently, the energetic value
prebiotics may have when supplemented to pig diets.
DIRECT-FED MICROBIALS
Direct-fed microbials (DFM), which may be more commonly known as probiotics, are
defined as, “live microorganisms which, when administered in adequate amounts, confer a health
benefit on the host (FAO/WHO, 2001).” Since 1989, the FDA has required that the term
probiotic only be used when referring to human microbial products; therefore, the term “DFM”
is used in the U.S. feed industry, whereas “probiotic” is used interchangeably with human and
animal feed worldwide (Kremer, 2006). Direct-fed microbials are categorized into three main
groups: Bacillus, lactic acid-producing bacteria, and yeast (NRC, 2012). Bacillus-based DFM are
spore-forming, which makes them thermostable and able to survive at low pH. Also, Bacillus-
based DFM may secrete fiber-degrading enzymes (Schreier, 1993). Lactic-acid producing
bacteria are not spore-forming and survival during feed processing is of concern (de Lange et al.,
2010). Lactic-acid producing bacteria dominate the gastrointestinal tract of the nursing pig (Li et
al., 2003; Richards et al., 2005), which helps reduce the pH in the gut by producing lactic acid
through fermentation, inhibiting enteric pathogens (Vandenbergh, 1993), and improving host
immunity (Niers et al., 2005; de Lange et al., 2010). However, after weaning of pigs, populations
31
of lactic-acid bacteria diminish; therefore, supplementation of weaned pig diets with lactic-acid
producing DFM may be beneficial (Stein and Kil, 2006). Yeast cultures may produce enzymes
and vitamins along with other nutrients, which have been reported to produce a variety of
responses when fed to swine (Kornegay et al., 1995).
Addition of DFM to swine diets may improve gut health by modifying the microflora,
which may help control pathogens (Prescott et al., 2005), enhance immune regulation and
response (Galdeano and Perdigon, 2006), increase nutrient digestibility (Giang et al., 2011),
improve health status, and improve pig performance (Kenny et al., 2011; Cromwell, 2013). The
use of DFM in swine diets is expected to increase due to the recent restrictions on the use of
antibiotic growth promoters. Continued use of fibrous co-products also may increase the use of
DFM because it has been suggested that combining DFM and prebiotics (i.e., symbiotics) may
increase the efficacy of DFM (de Lange et al., 2010).
Mode of Action
As the name suggests, DFM are added to the diet where they must survive processing
technologies such as extrusion and pelleting. Once consumed by the pig, DFM enter the stomach
where they are subjected to a low pH and pepsin. Bacillus DFM are metabolically inactive spores
that are thermostable and survive at a low pH and, therefore, survive feed processing and
digestion in the stomach. The pH in the small intestine is 6 to 7, which is optimal for the spores
to germinate, grow, and produce enzymes. The DFM continue to survive due to their ability to
produce enzymes that degrade the feed and produce VFA as a by-product of fermentation. The
VFA produced are utilized by the pig as an energy source, and the increased VFA concentration
reduces the pH in the gastrointestinal tract, which may inhibit growth of pathogenic bacteria. The
DFM also may degrade NSP to reducing sugars that may serve as an energy source for the pig

32
(Nielsen et al., 2013). Direct-fed microbials are suggested to improve gastrointestinal health by
promoting the growth of beneficial bacteria such as lactobacilli and bifidobacteria, thereby
decreasing the growth of deleterious bacteria from the large family of Gram-negative
Enterobacteriaceae. The decrease in pathogenic bacteria and increase in gastrointestinal health
may correspond to an increase in the ability of the pig to digest and ferment nutrients, enhance
their utilization of feed and energy, decrease the maintenance energy requirement associated
with immune system stimulation, and thereby increase growth performance (Kenny et al., 2011).
Efficacy of Direct-Fed Microbials
Previous reviews have concluded that the efficacy of DFM added to swine diets is
inconclusive because variable results have been observed (Pollmann, 1986; 1992; Nosiainen and
Setala, 1993; Stavric and Kornegay, 1995). However, a recent review has stated that results of 30
out of 31 nursery pig trials indicated an increased ADG and G:F due to DFM supplementation
(Kremer, 2006). Therefore, reports prior to 2000 may not be appropriate today because the
development of DFM and the technology associated with DFM has improved, which may lead to
the increased efficacy.
Addition of 0, 5.0 × 10⁴, 6.7 × 10⁶, or 7.5 × 10⁸ cfu/d of Bifidobacterium globosum A
(lactic-acid producing DFM) to weanling pig corn-soybean meal-based diets quadratically
improved ADG and ADFI, but did not affect G:F, immune response, or pH of intestinal contents
(Apgar et al., 1993). This same feeding regimen was maintained through the growing-finishing
phase and pig performance and carcass characteristics were not affected by DFM addition
(Apgar et al., 1993). Kornegay et al. (1995) investigated the ability of a yeast culture containing
Saccharomyces cervisiae to increase nutrient digestibility by pigs because yeast culture
supplementation increased cellulolytic bacteria in the rumen of cows (Dawson et al., 1990) and
33
was suggested to enhance dietary fiber fermentation in the horse (Godbee, 1983). Addition of 0,
8, or 16% peanut hulls, added at the expense of corn, to diets fed to pigs linearly reduced the
ATTD of DM, ADF, and NDF, and DFM addition did not ameliorate the reduced digestibility
(Kornegay et al., 1995). Kornegay and Risley (1996) observed no difference in the ATTD of
DM, NDF, and ADF by 60 kg pigs fed either a corn-soybean meal diet without or with a DFM
containing Bacillus subtilis and Bacillus licheniformis, or with a DFM containing Bacillus
subtilis, Bacillus licheniformis, and Bacillus pumilus.
A more recent study utilizing 270 wean-to-finish pigs tested the dose of DFM (0, 0.64 ×
106, 1.28 × 10⁶, 1.92 × 10⁶ viable spores of BioPlus 2B, which contained Bacillus licheniformis
and Bacillus subtilis in a 1:1 ratio; Chr. Hansen, Hørsholm, Denmark) and duration of DFM
addition (weaning only or wean-to-finish) to diets, and results indicated that ADG, G:F, and
carcass quality were improved with increased dose and duration of DFM addition (Alexopoulos
et al., 2004). Lee et al. (2014) produced a Bacillus subtilis DFM grown on citrus-juice waste and
included this DFM at 0, 1.5, 3.0, or 4.5 g/kg in phase 1 and phase 2 corn-soybean meal based
nursery pig diets. Linear improvements were observed in pig growth performance, ATTD of
nutrients and energy, serum immunoglobulins, and small intestinal morphology (Lee et al.,
2014). Lee et al. (2014) concluded that the observed improvements were mostly caused by
producing the Bacillus subtilis DFM using solid substrate fermentation (Lee et al., 2014).
Improved ADG and G:F, and decreased time required to wash manure off of mats was
observed by addition of 0.05% DFM comprised of two strains of Bacillus lichenformis and one
strain of Bacillus subtilis (Davis et al., 2008). The authors hypothesized that performance and
pen cleaning were improved with DFM addition because of increased dietary fiber degradation
by enzymes secreted by the DFM. Therefore, further research is necessary to determine the effect
34
of Bacillus-based DFM on dietary fiber fermentation. The ATTD of N and energy by pigs fed a
corn-soybean meal-based diet were improved by addition of a DFM composed of Bacillus
subtilis and Clostridium butyricum and, subsequently, pig ADG and G:F were improved (Meng
et al., 2010). Pigs challenged with Salmonella enterica had reduced ADG and G:F and increased
bacterial shedding scores compared with non-challenged pigs, but addition of a Lactobacillus
plantarum DFM did not influence recovery from the challenge (Gebru et al., 2010). Weanling
pigs fed a Lactobacillus reuteri and Lactobacillus plantarum DFM for 28 d had improved overall
ADG and ATTD of N and GE compared with pigs fed no DFM. Results for pigs fed the DFM
were similar to results for pigs fed a diet containing 0.01% apramycin, indicating that the
Lactobacillus reuteri and Lactobacillus plantarum DFM may minimize antibiotic use in
weanling pig diets (Zhao and Kim, 2015). However, DFM cannot replace antibiotics in terms of
preventing or treating of sickness or disease, but seem to be a viable alternative to antibiotics
used as growth promoters.
A diet containing corn, soybean meal, and DDGS supplemented with 500 g/MT Bacillus
spp. DFM and fed to nursery pigs had a 100 kcal/kg increase in DE due to a 9.2% increase in the
ATTD of NDF compared with the control diet with no DFM (Owusu-Asiedu et al., 2014).
Growing-finishing pigs fed high-fiber diets based on corn, soybean meal, DDGS, wheat
middlings, corn germ, and soybean hulls supplemented with a Bacillus spp. DFM had increased
fecal VFA concentrations and, subsequently, greater available dietary energy, which
corresponded with improved ADG and G:F, and a greater loin eye area and fat-free lean
percentage compared with pigs fed no DFM (Jaworski et al., 2014).
In conclusion, DFM supplementation to swine diets has produced more beneficial results
in the past decade compared with earlier reports, indicating an improvement in the development

35
and use of DFM. Lactic acid-producing bacteria DFM appear to be more beneficial for weanling
pigs to help stabilize the gastrointestinal tract after weaning, whereas Bacillus-based DFM may
be more beneficial for growing-finishing pigs to increase the digestibility of energy and nutrients
in high-fiber diets and, subsequently, increase performance and carcass characteristics.
ADAPTATION TO HIGH FIBER DIETS
The fermentability and, subsequently the available energy from a high-fiber diet may be
influenced by the length of time the pig has been fed that diet. Adaptation to a high-fiber diet
may reflect long-term adaptations of the gastrointestinal tract by hypertrophy of the
gastrointestinal tract, slower digesta passage rate, and adaptations of the microbial population in
the gastrointestinal tract (Martinez-Puig et al., 2003). Feeding of high-fiber diets will result in
increased size of the large intestine and increased microbial population (Kyriazakis and Emmans,
1995; Jørgensen et al., 1996) This will allow the pig to increase fermentation of dietary fiber.
However, these changes take time to occur, and it is, therefore, possible that the pig, more
specifically the microbial population in the hindgut, may require a certain period of time to adapt
to a high-fiber diet to maximize fermentation.
The ATTD of GE and NSP in pigs fed wheat-soybean meal plus solka-floc or sugar beet
pulp diets were not different if pigs had been adapted to the diets for 2, 4, or 6 weeks (Longland
et al., 1993). Pigs do not need more than 7 d to adapt to fermentation of insoluble (solka-floc)
compared with soluble (sugar beet pulp) dietary fiber added to a wheat-soybean meal based diet
(Longland et al., 1993). The ATTD of OM and CP increased in pigs fed a barley-soybean meal-
based diet plus corn starch or raw potato starch from d 9 to d 38 of feeding (Martinez-Puig et al.,
36
2003). However, the ATTD of OM and CP stabilized after pigs were fed the barley-soybean
meal-based diet plus corn starch after 16 d of feeding, whereas the ATTD of OM and CP never
stabilized and increased from 77.8 to 84.1% and 71.3 to 78.4%, respectively, for pigs fed the
barley-soybean meal-based diet plus raw potato starch (Martinez-Puig et al., 2003). These
conflicting reports indicate that further research is necessary to elucidate the effect of adaptation
time on the ATTD of energy and nutrients in high-fiber diets fed to swine. However, the AID of
CP and AA by pigs fed a corn-soybean meal based diet was not different over 6 weeks,
indicating that a 5 d diet adaptation period is sufficient when determining the AID of CP and AA
in a low-fiber diet (Stewart et al., 2010).
The ATTD of GE is greater in sows compared with growing pigs and this is attributed to
the greater intestinal capacity in sows than in growing pigs (Noblet et al., 1994; Le Goff et al.,
2002; Lowell et al., 2015). The ATTD of GE increases by 0.003 to 0.0045% for every 10 kg BW
from 30 to 100 kg (Noblet, 2001). However, the ATTD of NDF was not different between
growing pigs and sows indicating that increased BW may not play a role in the fermentation
capacity of pigs (Lowell et al., 2015). Kim et al. (2007) demonstrated that the ATTD of DM was
not correlated with BW for weanling, growing, or finishing pigs, but longer retention times of
digesta improved the ATTD of DM regardless of the physiological stage of the pigs, but diets
greater in dietary fiber decreased retention time and the ATTD of DM was decreased (Ravindran
et al., 1984). These results indicate that BW may not play a role in energy digestibility; however,
dietary fiber influences passage rate, which is correlated with DM digestibility and this may be a
more likely reason for the difference between sows and pigs. However, most comparative data
with values for both sows and growing pigs are confounded by level of feed intake, and it is,

37
therefore, not possible to determine if nutrient and energy digestibility is greater in sows per se
or if the observed differences are a result of differences in feed intake.
CONCLUSION
Physicochemical characteristics of feed ingredients and diets may aid in accurate
predictions of energy supply from feed ingredients or diets fed to pigs because they are related to
the concentration of soluble and insoluble dietary fiber within feed ingredients and diets. Three
major factors are necessary to better understand the energy supply and utilization by pigs fed
high-fiber diets: 1) the quantity of soluble dietary in a feed ingredient or diet because soluble
dietary fiber is fermented to a greater extent compared with insoluble dietary fiber; 2)
quantification of VFA and methane production from dietary fiber fermentation and subsequent
VFA absorption and energy loss from methane; and 3) total HP, activity HP, and HP associated
with the thermic effects of feeding pigs diets containing commonly fed fibrous co-products. Two
promising strategies to increase energy supply by increased dietary fiber fermentation are DFM
supplementation and the adaptation of the gastrointestinal tract of the pig to diets containing
greater concentrations of dietary fiber.
LITERATURE CITED
Alexopoulos, C., I. E. Georgoulakis, A. Tzivara, C. S. Kyriakis, A. Govaris, and S. C. Kyriakis.
2004. Field evaluation of the effect of a probiotic-containing Bacillus licheniformis and
Bacillus subtilis spores on the health status, performance, and carcass quality of grower
and finishing pigs. J. Vet. Med. 51:306-312.

38
Anguita, M., N. Canibe, J. F. Pérez, and B. B. Jensen. 2006. Influence of the amount of dietary
fiber on the available energy from hindgut fermentation in growing pigs: Use of
cannulated pigs and in vitro fermentation. J. Anim. Sci. 84:2766-2778.
Apgar, G. A., E. T. Kornegay, M. D. Lindemann, and C. M. Wood. 1993. The effect of feeding
various levels of Bifidobacterium globosum A on the performance, gastrointestinal
measurements, and immunity of weanling pigs and on the performance and carcass
measurements of growing-finishing pigs. J. Anim. Sci. 71:2173-2179.
Atwater, W. O., and A. P. Bryant. 1900. The availability and fuel value of food materials. In:
12th Annual Report of the Storrs, Connecticut Agricultural Experiment Station. p. 73.
Auffret, A., M. C. Ralet, F. Guillon, J. L. Barry, and J. F. Thibault. 1994. Effect of grinding and
experimental conditions on the measurement of hydration properties of dietary fibers.
Lebensm.- Wiss. Technol. 27:166-172.
Ayoade, D. I., E. Kiarie, M. A. Trinidade Neto, and C. M. Nyachoti. 2012. Net energy of diets
containing wheat-corn distillers dried grains with solubles as determined by indirect
calorimetry, comparative slaughter, and chemical composition methods. J. Anim. Sci.
90:4373-4379.
Bach Knudsen, K. E. 1997. Carbohydrate and lignin contents of plant materials used in animal
feeding. Anim. Feed Sci. Technol. 67:319-338.
Bach Knudsen, K. E. 2001. The nutritional significance of “dietary fibre” analysis. Anim. Feed
Sci. Technol. 90:3-20.
Bach Knudsen, K. E., H. N. Lærke, and H. Jørgensen. 2013. Carbohydrates and carbohydrate
utilization in swine. In: L. I. Chiba, editor, Sustainable Swine Nutrition. John Wiley &
Sons, Inc., Ames, IA. p. 109-135.

39
Baldwin, R. L. 1995. Modeling Ruminant Digestion and Metabolism. Chapman & Hall, New
York, NY.
Beloshapka, A. N. 2011. Effects of inulin or yeast cell wall extract on nutrient digestibility and
fecal fermentative end-product concentrations of healthy adult dogs fed raw diets. M.S.
Thesis. University of Illinois, Urbana, IL.
Bindelle, J., P. Leterme, and A. Buldgen. 2008. Nutritional and environmental consequences of
dietary fibre in pig nutrition: a review. Biotechnol. Agron. Soc. Environ. 12:69-80.
Birkett, S., and K. de Lange. 2001. Limitations of conventional models and a conceptual
framework for a nutrient flow representation of energy utilization by animals. Br. J. Nutr.
86:647-659.
Blaxter, A. C., P. J. Cripps, and T. J. Gruffydd-Jones. 1990. Dietary fibre and post prandial
hyperglycaemia in normal and diabetic dogs. J. Small Anim. Pract. 31: 229-233.
Boisen, S., and M. W. A. Verstegen. 2000. Developments in the measurement of the energy
content of feeds and energy utilization in animals. In: P. J. Moughan, M. W. A.
Verstegen, and M. I. Visser-Reyneveld, editors., Feed Evaluation: Principle and Practice.
Wageningen Press, Wageningen, the Netherlands. p. 57-76.
Bolhuis, J. E., H. van den Brand, S. T. M. Staals, T. Zandstra, S. J. J. Alferink, M. J. W.
Heetkamp, and W. J. J. Gerrits. 2008. Effects of fermentable starch and straw-enriched
housing on energy partition of growing pigs. Animal. 2:1028-1036.
Brody, S. 1945. Bioenergetics and Growth. Reinhold, New York, NY.
Brouwer, E. 1965. Report of sub-committee on constants and factors. In: K. Blaxter, editor,
Energy Metabolism. Academic Press, London, p. 441-443.

40
Brown, D., T. J. Cole, M. J. Dauncey, R. W. Marrs, and P. R. Murgatroyd. 1984. Analysis of
gaseous exchange in open-circuit indirect calorimetry. Med. Biol. Eng. Comp. 22:333-
338.
Burkhalter, T. M., N. R. Merchen, L. L. Bauer, S. M. Murray, A. R. Patil, J. L. Brent Jr., and G.
C. Fahey Jr. 2001. The ratio of insoluble to soluble fiber components in soybean hulls
affects ileal and total-tract nutrient digestibility and fecal characteristics of dogs. J. Nutr.
131:1978-1985.
Canibe, N., and K. E. Bach Knudsen. 2002. Degradation and physicochemical changes of barley
and pea fibre along the gastrointestinal tract of pigs. J. Sci. Food Agric. 82:27-39.
Cervantes-Pahm, S. K., Y. Liu, A. Evans, and H. H. Stein. 2014a. Effect of novel fiber
ingredients on ileal and total tract digestibility of energy and nutrients in semi-purified
diets fed to growing pigs. J. Sci. Food Agric. 94:1284-1290.
Cervantes-Pahm, S., Y. Liu, and H. H. Stein. 2014b. Comparative digestibility of energy and
nutrients and fermentability of dietary fiber in eight cereal grains fed to pigs. J. Sci. Food
Agric. 94:841-849.
Che, T. M., R. W. Johnson, K. W. Kelley, K. A. Dawson, C. A. Moran, and J. E. Pettigrew.
2012. Effects of mannan oligosaccharide on cytokine secretions by porcine alveolar
macrophages and serum cytokine concentrations in nursery pigs. J. Anim. Sci. 90:657-
668.
Clevenger, M. A., D. Turnbull, H. Inoue, M. Enomoto, J. A. Allen, L. M. Henderson, and E.
Jones. 1988. Toxicological evaluation of Neosugar: Genotoxicity, carcinogenicity, and
chronic toxicity. Int. J. Toxicol. 7:643-662.

41
Cook, S. I., and J. H. Sellin. 1998. Review article: Short chain fatty acids in health and disease.
Aliment. Pharmacol. Ther. 12:499-507.
Cromwell, G. L., T. R. Cline, J. D. Crenshaw, T. D. Crenshaw, R. A. Easter, R. C. Ewan, C. R.
Hamilton, G. M. Hill, A. J. Lewis, D. C. Mahan, J. L. Nelseen, J. E. Pettigrew, T. L.
Veum, and J. T. Yen. 2000. Variability among sources and laboratories in analyses of
wheat middlings. NCR-42 Committee on Swine Nutrition. J. Anim. Sci. 78:2652-2658.
Cromwell, G. L. 2013. Feed additives in swine diets. In: L. I. Chiba, editor., Sustainable Swine
Nutrition. 1st ed. John Wiley & Sons, Inc., Ames, IA. p. 302-304.
Davis, M. E., T. Parrott, D. C. Brown, B. Z. de Rodas, Z. B. Johnson, C. V. Maxwell, and T.
Rehberger. 2008. Effect of a Bacillus-based direct-fed microbial feed supplement on
growth performance and pen cleaning characteristics of growing-finishing pigs. J. Anim.
Sci. 86:1459-1467.
Dawson, K. A., K. A. Newman, and J. A. Boling. 1990. Effects of microbial supplements
containing yeast and lactobacilli on roughage-fed ruminal microbial activities. J. Anim.
Sci. 68:3392-3398.
de Godoy, M. R. C., K. R. Kerr, and G. C. Fahey, Jr. 2013. Alternative dietary fiber sources in
companion animal nutrition. Nutrients 5:3099-3117.
de Lange, C. F. M., J. van Milgen, J. Noblet, S. Dubois, and S. H. Birkett. 2002. Previous
feeding level influences fasting heat production in growing pigs. J. Anim. Sci. 80(Suppl.
1):158 (Abstr.).
de Lange, C. F. M., J. van Milgen, J. Noblet, S. Dubois, and S. Birkett. 2006. Previous feeding
level influences plateau heat production following a 24 h fast in growing pigs. Br. J. Nutr.
95:1082-1087.
42
de Lange, C. F. M., J. Pluske, J. Gong, and C. M. Nyachoti. 2010. Strategic use of feed
ingredients and feed additives to stimulate gut health and development in young pigs.
Livest. Sci. 134:124-134.
Dikeman, C. L., and G. C. Fahey, Jr. 2006. Viscosity as related to dietary fiber: A review. Crit.
Rev. Food Sci. Nutr. 46:649-663.
Dreher, M. L. 2001. Dietary fiber overview. In: S. S. Cho and M. L. Dreher, editors. Handbook
of Dietary Fiber. Marcel Dekker, Inc. New York, NY. p. 2.
Eastwood, M. A., and E. R. Morris. 1992. Physical properties of dietary fiber that influence
physiological function: a model for polymers along the gastrointestinal tract. Am. Soc.
Clin. Nutr. 55:436-442.
Ewan, R. C. 1989. Predicting the energy utilization of diets and feed ingredients by pigs. In: Y.
van der Honig and W. H. Close, editors., Energy Metabolism. EAAP Bulletin No. 43,
Wageningen, the Netherlands.
FAO/WHO (Food and Agriculture Organization/World Health Organization). 2001. Health and
nutritional properties of probiotics in food including powder milk with live lactic acid
bacteria. Report of a joint FAO/WHO expert consultation on evaluation of health and
nutritional properties of probiotics in food including powder milk with live lactic acid
bacteria. Córdoba, Argentina. p. #1-33.
Ferrannini, E. 1988. The theoretical bases of indirect calorimetry: a review. Metabolism 37:287-
301.
Flint, H. J., E. A. Bayer, M. T. Rincon, R. Lamed, and B. A. White. 2008. Polysaccharide
utilization by gut bacteria: Potential for new insights from genomic analysis. Nat. Rev.
Microbiol. 6:121-131.

43
Flint, H. J., K. P. Scott, P. Louis, and S. H. Duncan. 2012. The role of the gut microbiota in
nutrition and health. Nat. Rev. Gastroenterol Hepatol. 9:577-589.
Galdeano, C. M., and G. Perdigon. 2006. The probiotic bacterium Lactobacillus casei induces
activation of the gut mucosal immune system through innate immunity. Clin. Vaccine
Immunol. 13:219–226.
Ganapathy, V., M. Thangaraju, P. D. Prasad, P. M. Martin, and N. Singh. 2013. Transporters and
receptors for short-chain fatty acids as the molecular link between colonic bacteria and
the host. Curr. Opin. Pharmacol. 13:869-874.
Gebru, E., J. S. Lee, J. C. Son, S. Y. Yang, S. A. Shin, B. Kim, M. K. Kim, and S. C. Park. 2010.
Effect of probiotic-, bacteriophage-, or organic acid-supplemented feeds or fermented
soybean meal on the growth performance, acute-phase response, and bacterial shedding
of grower pigs challenged with Salmonella enterica serotype Typhimurium. J. Anim. Sci.
88:3880-3886.
Giang, H. H., T. Q. Viet, B. Ogle, and J. E. Lindberg. 2011. Effects of supplementation of
probiotics on the performance, nutrient digestibility and faecal microflora in growing-
finishing pigs. Asian-Aust. J. Anim. Sci. 24:655-661.
Giger-Reverdin, S. 2000. Characterisation of feedstuffs for ruminants using some physical
parameters. Anim. Feed Sci. Technol. 86:53-69.
Gill, R. K., S. Saksena, W. A. Alrefai, Z. Sarwar, J. L. Goldstein, R. E. Carroll, K. Ramaswamy,
and P. K. Dudeja. 2005. Expression and membrane localization of MCT isoforms along
the length of the human intestine. Am. J. Physiol. Cell Physiol. 289:C846-C852.
Giuberti, G., A. Gallo, M. Moschini, and F. Masoero. 2015. New insight into the role of resistant
starch in pig nutrition. Anim. Feed Sci. Technol. 201:1-13.
44
Godbee, R. 1983. Effect of yeast culture on apparent digestibility and nitrogen balance in horses.
Res. Bull. Clemson Univ., Clemson, SC.
Gutierrez, N. A., B. J. Kerr, and J. F. Patience. 2013. Effect of insoluble – low fermentable fiber
from corn – ethanol distillation origin on energy, fiber, and amino acid digestibility,
hindgut degradability of fiber, and growth performance of pigs. J. Anim. Sci. 91:5314-
5325.
Hooda, S., B. U. Metzler-Zebeli, T. Vasanthan, and R. T. Zijlstra. 2011. Effects of viscosity and
fermentability of dietary fibre on nutrient digestibility and digesta characteristics in ileal-
cannulated grower pigs. Br. J. Nutr. 106:664-674.
Holloway, W. D., and R. I. Greig. 1984. Water holding capacity of hemicelluloses from fruits,
vegetables and wheat bran. J. Food Sci. 49:1632-1633.
Holman, S. W. 1895. Calorimetry: methods of cooling correction. Proc. Ameri. Acad. Arts Sci.
31:245-254.
Institute of Medicine. 2001. Dietary reference intakes: Proposed definitions of dietary fiber.
National Academy Press. Washington, D.C.
Jaworski, N. W., A. Owusu-Asiedu, A. A. Awati, and H. H. Stein. 2014. Effect of Bacillus spp.
direct-fed microbials on fecal VFA concentrations, growth performance, and carcass
characteristics of growing-finishing pigs. J. Anim. Sci. 92(Suppl. 2):56 (Abstr.).
Jaworski, N. W., H. N. Lærke, K. E. Bach Knudsen, and H. H. Stein. 2015. Carbohydrate
composition and in vitro digestibility of dry matter and nonstarch polysaccharides in
corn, sorghum, and wheat and coproducts from these grains. J. Anim. Sci. 93:1103-1113.
45
Jaworski, N. W., J. Shoulders, J. C. González-Vega, and H. H. Stein. 2014. Effects of using
copra meal, palm kernel expellers, or palm kernel meal in diets for weanling pigs. Prof.
Anim. Scientist. 30:243-251.
Jensen, B. B., and H. Jørgensen. 1994. Effect of dietary fiber on microbial activity and microbial
gas production in various regions of the gastrointestinal tract of pigs. Appl. Environ.
Microbiol. 60:1897-1904.
Jørgensen, H. 2007. Methane emission by growing pigs and adult sows as influenced by
fermentation. Livest. Sci. 109:216-219.
Jørgensen, H., and A. Just. 1988. Effect of different dietary components on the site of
absorption/site of disappearance of nutrients. In: Proc. 4th Int. Symp. Digestive Physiol.
Pigs, Jablonna, Poland. p. 230-239.
Jørgensen, H., X. – Q. Zhao, and B. O. Eggum. 1996. The influence of dietary fibre and
environmental temperature on the development of the gastrointestinal tract, digestibility,
degree of fermentation in the hind-gut and energy metabolism in pigs. Br. J. Nutr.
75:365-378.
Jørgensen, H., T. Larsen, X. Q. Zhao, and B. O. Eggum. 1997. The energy value of short-chain
fatty acids infused into the cecum of pigs. Br. J. Nutr. 77:745-756.
Jung, H-J. G., V. H. Varel, P. J. Weimer, and J. Ralph. 1999. Accuracy of Klason lignin and acid
detergent lignin methods as assessed by bomb calorimetry. J. Agric. Food Chem.
47:2005-2008.
Just, A., H. Jørgensen, and J. A. Fernandez. 1983. Maintenance requirement and the net energy
value of different diets for growth in pigs. Livest. Prod. Sci. 10:487-506.
46
Kenny, M., H. Smidt, E. Mengheri, and B. Miller. 2011. Probiotics – do they have a role in the
pig industry? Animal 5:462-470.
Kil, D. Y., F. Ji, L. L. Stewart, R. B. Hinson, A. D. Beaulieu, G. L. Allee, J. F. Patience, J. E.
Pettigrew, and H. H. Stein. 2011. Net energy of soybean oil and choice white grease in
diets fed to growing and finishing pigs. J. Anim. Sci. 89:448-459.
Kil, D. Y., B. G. Kim, and H. H. Stein. 2013. Invited review: feed energy evaluation for growing
pigs. Asian Australas. J. Anim. Sci. 26:1205-1217.
Kim, B. G., M. D. Lindemann, G. L. Cromwell, A. Balfagon, and J. H. Agudelo. 2007. The
correlation between passage rate of digesta and dry matter digestibility in various stages
of swine. Livest. Sci. 109:81-84.
Kleiber, M. 1975. The Fire of Life. An Introduction to Animal Energetics. 2nd ed. Robert E.
Krieger Publishing Co., New York, NY.
Koong, L. J., J. A. Nienaber, J. C. Pekas, and J. T. Yen. 1982. Effects of plane of nutrition on
organ size and fasting heat production in pigs. J. Nutr. 112:1638-1642.
Kornegay, E. T., D. Rhein-Welker, M. D. Lindemann, and C. M. Wood. 1995. Performance and
nutrient digestibility in weanling pigs as influenced by yeast culture additions to starter
diets containing dried whey or one of two fiber sources. J. Anim. Sci. 73:1381-1389.
Kornegay, E. T., and C. R. Risley. 1996. Nutrient digestibilities of a corn-soybean meal diet as
influenced by Bacillus products fed to finishing swine. J. Anim. Sci. 74:799-805.
Kremer, B. 2006. DFM products provide consistent outcomes: producers look for consistently
performing feed additives, and research has found that certain direct-fed microbial
products can fit this description. Feedstuffs. 24 Apr. 2006: 78: p. 14-15.
47
Kyriazakis, I., and G. C. Emmans. 1995. The voluntary feed intake of pigs given feeds based on
wheat bran, dried citrus pulp and grass meal, in relation to measurements of feed bulk.
Br. J. Nutr. 73:191-207.
Labussière E., J. van Milgen, C. F. M. de Lange, and J. Noblet. 2011. Maintenance energy
requirements of growing pigs and calves are influenced by feeding level. J. Nutr.
141:1855-1861.
Labussière E., S. Dubois, J. van Milgen, and J. Noblet. 2013. Partitioning of heat production in
growing pigs as a tool to improve the determination of efficiency of energy utilization.
Front. Physiol. 4:1-10.
Lan-Pidhainy, X., Y. Brummer, S. M. Tosh, T. M. Wolever, and P. J. Wood. 2007. Reducing
beta-glucan solubility in oat bran muffins by freeze-thaw treatment attenuates its
hypoglycemic effect. Cereal Chem. 84:512-517.
Lavoisier, A.-L. 1789. Traité élémentaire de Chimie, présénté dans un ordre nouveau et d’après
les découveries modernes. Paris, France.
Lee, S. H., S. L. Ingale, J. S. Kim, K. H. Kim, A. Lokhande, E. K. Kim, I. K. Kwon, Y. H. Kim,
B. J. Chae. 2014. Effects of dietary supplementation with Bacillus subtilis LS 1-2
fermentation biomass on growth performance, nutrient digestibility, cecal microbiota and
intestinal morphology of weanling pig. Anim. Feed Sci. Technol. 188:102-110.
Le Gall, M., A. Serena, H. Jørgensen, P. K. Theil, and K. E. Bach Knudsen. 2009. The role of
whole-wheat grain and wheat and rye ingredients on the digestion and fermentation
processes in the gut – a model experiment with pigs. Br. J. Nutr. 102:1590-1600.
48
Le Goff, G., J. van Milgen, and J. Noblet. 2002. Influence of dietary fibre on digestive utilization
and rate of passage in growing pigs, finishing pigs, and adult sows. Anim. Sci. 74:503-
515.
Le Goff, G., L. Le Groumellec, J. van Milgen, S. Dubois, and J. Noblet. 2002. Digestibility and
metabolic utilisation of dietary energy in adult sows: influence of addition and origin of
dietary fibre. Br. J. Nutr. 87:325-335.
Leterme, P., E. Froidmont, F. Rossi, and A. Théwis. 1998. The high water-holding capacity of
pea inner fibers affects the ileal flow of endogenous amino acids in pigs. J. Agric. Food
Chem. 46:1927-1934.
Li, M., J. Gong, M. Cotrill, H. Yu, C. F. M. de Lange, J. Burton, and E. Topp. 2003. Evaluation
of QIAamp® DNA Mini Stoll Kit for microbial ecological studies. J. Microbiol. Methods
54:13-20.
Liu, D. W., N. W. Jaworski, G. Zhang, Z. Li, D. F. Li, and F. Wang. 2014. Effect of
experimental methodology on fasting heat production and the net energy content of corn
and soybean meal fed to growing pigs. Arch. Anim. Nutr. 68:281-295.
Liyama, K., T. B-T. Lam, and B. A. Stone. 1994. Covalent cross-links in the cell wall. Plant
Physiol. 104:315-320.
Longland, A. C., A. G. Low, D. B. Quelch, and S. P. Bray. 1993. Adaptation to the digestion of
non-starch polysaccharide in growing pigs fed on cereal or semi-purified basal diets. Br.
J. Nutr.70:557-566.
Lowell, J. E., Y. Liu, and H. H. Stein. 2015. Comparative digestibility of energy and nutrients in
diets fed to sows and growing pigs. Arch. Anim. Nutr. 69:79-97.

49
Mackenzie, S. G., I. Leinonen, N. Ferguson, and I. Kyriazakis. 2016. Can the environmental
impact of pig systems be reduced by utilising co-products as feed? J. Cleaner Prod.
115:172-181.
Martinez-Puig, D. J. F. Pérez, M. Castillo, A. Andaluz, M. Anguita, J. Morales, and J. Gasa.
2003. Consumption of raw potato starch increases colon length and fecal excretion of
purine bases in growing pigs. J. Nutr. 133:134-139.
McLean, J. A., and G. Tobin. 1987. Bomb calorimetry in animal and human calorimetry.
University Press, Cambridge, UK.
Meng, Q. W., L. Yan, X. Ao, T. X. Zhou, J. P. Wang, J. H. Lee, and I. H. Kim. 2010. Influence
of probiotics in different energy and nutrient density diets on growth performance,
nutrient digestibility, meat quality, and blood characteristics in growing-finishing pigs. J.
Anim. Sci. 88:3320-3326.
Michel, P., and A. Rerat. 1998. Effect of adding sugar beet fibre and wheat bran to a starch diet
on the absorption kinetics of glucose, amino nitrogen and volatile fatty acids in the pig.
Reprod. Nutr. Dev. 38:49-68.
Miguel, J. C., S. L. Rodriguez-Zas, and J. E. Pettigrew. 2004. Efficacy of Biol.-Mos for
improving nursery pig performance. J. Swine Health Prod. 12:296-307.
Müller, H. L., and M. Kirchgessner. 1985. Energetische verwertung von pectin bei sauen. Z.
Tierphysiol. Tiereraehr. Futermittelkd. 54:14-20.
Müller, H. L., and M. Kirchgessner. 1986. The effect of alfalfa meal on energy metabolism in
sows. Anim. Res. Dev. 24:98-106.
Nielsen, B., B. Lantz, and J. N. Jørgensen. 2013. Interview: Chr. Hansen announces new results
for bacillus-based DFMs and glucose release in swine. http://www.chr-
50
hansen.com/products/product-areas/animal-health-nutrition/the-newsroom.html.
(Accessed 23 February 2015).
Niers, L. E., H. M. Timmerman, G. T. Rijkers, G. M. van Bleek, N. O. van Uden, E. F. Knol, M.
L. Kapsenberg, J. L. Kimpen, and M. O. Hoekstra. 2005. Identification of strong
interleukin-10 inducing lactic acid bacteria which down-regulate T helper type 2
cytokines. Clin. Exp. Allergy 35:1481-1489.
Noblet, J. 2001. Digestive and metabolic utilization of dietary energy in pig feeds: comparison of
energy systems. In: P. C. Garnsworth and J. Wiseman, editors. Recent Developments in
Pig Nutrition. Nottingham University Press, Nottingham, UK. p. 161-184.
Noblet, J. 2007. Recent developments in net energy research for swine. Adv. Pork Prod. 18:149-
156.
Noblet, J., J. Y. Dourmad, J. Le Dividich, and S. Dubois. 1989. Effect of ambient temperature
and addition of straw or alfalfa in the diet on energy metabolism in pregnant sows. Lives.
Prod. Sci. 21:309-324.
Noblet, J., and Y. Henry. 1993. Energy evaluation systems for pig diets: A review. Livest. Prod.
Sci. 36:121-141.
Noblet, J., X. S. Shi, and S. Dubois. 1994. Effect of body weight on net energy value of feeds for
growing pigs. J. Anim. Sci. 72:648-657.
Noblet, J., and G. Le Goff. 2001. Effect of dietary fibre on the energy value of feeds for pigs.
Anim. Feed Sci. Technol. 90:35-52.
Noblet, J., and J. van Milgen. 2004. Energy value of pig feeds: Effect of pig body weight and
energy evaluation system. J. Anim. Sci. 82(E. Suppl.):E229-E238.

51
Noblet, J., and J. van Milgen. 2013. Energy and energy metabolism in swine. In: L. I. Chiba,
editor, Sustainable Swine Nutrition. John Wiley & Sons, Inc., Ames, IA. p. 23-56.
Nousiainen, J., and J. Setala. 1993. Lactic acid bacteria as animal probiotics. In: S. Salminen and
A. von Wright, editors. Lactic Acid Bacteria. Marcel Dekker, New York, NY. p. 315-
356.
NRC. 2012. Nutrient Requirements of Swine. 11th rev. ed. Natl. Acad. Press, Washington, DC.
Oakenfull, D. 2001. Physical chemistry of dietary fiber. In: Dietary Fiber in Human Nutrition.
3rd ed. G. A. Spiller, editor. CRC Press, Boca Raton, FL. p. 33-47.
Owusu-Asiedu, A., J. F. Patience, B. Laarveld, A. G. Van Kessel, P. H. Simmins, and R. T.
Zijlstra. 2006. Effects of guar gum and cellulose on digesta passage rate, ileal microbial
populations, energy and protein digestibility, and performance of grower pigs. J. Anim.
Sci. 84:843-852.
Owusu-Asiedu, A., N. W. Jaworski, A. A. Awati, and H. H. Stein. 2014. Effect of Bacillus spp.
direct-fed microbial supplementation on the nutrient digestibility by weanling pigs. J.
Anim. Sci. 92(Suppl. 2):143 (Abstr.).
Pollmann, D. S. 1986. Probiotics in pig diets. In: W. Haresign and D. J. A. Cole, editors, Recent
Advances in Animal Nutrition. 1st ed. Butterworths, London, UK. p. 193-205.
Pollmann, D. S. 1992. Probiotics in swine diets. In: D. A. Leger and S. K. Ho, editors, Proc. Int.
Roundtable Anim. Feed Biotechnol. – Res. Sci. Reg. 1st ed. Agriculture Canada, Ottawa,
ON, Canada. p. 65-74.
Pond, W.G., D. C. Church, K. R. Pond, and P. A. Schoknecht. 2005. Basic Animal Nutrition and
Feeding. 5th ed. John Wiley & Sons, Inc., Hoboken, NJ.

52
Prescott, S. L., J. A. Dunstan, J. Hale, L. Breckler, H. Lehmann, S. Weston, and P. Richmond.
2005. Clinical effects of probiotics are associated with increased interferon-gamma
responses in very young children with atopic dermatitis. Clin. Exp. Allergy 35:1557-
1564.
Price, K. L., H. R. Totty, H. B. Lee, M. D. Utt, G. E. Fitzner, I. Yoon, M. A. Ponder, and J.
Escobar. 2010. Use of Saccharomyces cerevisiae fermentation product on growth
performance and microbiota of weaned pigs during Salmonella infection. J. Anim. Sci.
88:3896-3908.
Quiniou, N., and J. Noblet. 1995. Prediction of tissular body composition from protein and lipid
deposition in growing pigs. J. Anim. Sci. 73:1567-1575.
Quiniou, N., S. Dubois, and J. Noblet. 1995. Effect of dietary crude protein level on protein and
energy balances in growing pigs: comparison of two measurement methods. Livest. Prod.
Sci. 41:51-61.
Ramirez, B. C. 2014. Design and evaluation of open-circuit respiration chambers for beef cattle.
MS thesis. Univ. Illinois, Urbana, IL.
Ramonet, Y., J. van Milgen, J. Y. Dourmad, S. Dubois, M. C. Meunier-Salaün, and J. Noblet.
2000. The effect of dietary fibre on energy utilization and partitioning of heat production
over pregnancy in sows. Br. J. Nutr. 84:85-94.
Ravindran, V., E. T. Kornegay, and K. E. Webb Jr. 1984. Effects of fiber and virginiamycin on
nutrient absorption, nutrient retention and rate of passage in growing swine. J. Anim. Sci.
59:400-408.
Richards, J. D., J. Gong, and C. F. M. de Lange. 2005. The gastrointestinal microbiota and its
role in monogastric nutrition and health with an emphasis on pigs: current understanding,
53
possible modulations, and new technologies for ecological studies. Can. J. Anim. Sci.
85:421-435.
Rijnen, M. M. J. A., M. W. A. Verstegen, M. J. W. Heetkamp, J. Haaksma, and J. W. Schrama.
2001. Effects of dietary fermentable carbohydrates on energy metabolism in group-
housed sows. J. Anim. Sci. 79:148-154.
Rijnen, M. M. J. A., M. W. A. Verstegen, M. J. W. Heetkamp, and J. W. Schrama. 2003. Effects
of two different dietary fermentable carbohydrates on activity and heat production in
group-housed growing pigs. J. Anim. Sci. 81:1210-1219.
Robertson, J. A., F. D. de Monredon, P. Dysseler, F. Guillon, R. Amado, and J. F. Thibault.
2000. Hydration properties of dietary fibre and resistant starch: A European collaborative
study. Lebensmittel-Wissenschaft und –Technol. 33:72-79.
Rojas, O. J. 2015. Use of feed technology to improve the nutritional value of feed ingredients
and diets fed to pigs. PhD Diss. Univ. Illinois, Urbana, IL.
Schiemann, R., K. Nehring, L. Hoffmann, W. Jentsch, and A. Chudy. 1972. Energetische
Futterbevertung und Energienormen. VEB Deutscher Landwirtschatsverlag, Berlin,
Germany.
Schrama, J. W., M. W. A. Verstegen, P. H. J. Verboeket, J. B. Schutte, and J. Haaksma. 1996.
Energy metabolism in relation to physical activity in growing pigs as affected by type of
dietary carbohydrate. J. Anim. Sci. 74:2220-2225.
Schrama, J. W., M. W. Bosch, M. W. A. Verstegen, A. H. P. M. Vorselaars, J. Haaksma, and M.
J. W. Heetkamp. 1998. The energetic value of nonstarch polysaccharides in relation to
physical activity in group-housed, growing pigs. J. Anim. Sci. 76:3016-3023.
54
Schrama, J. W., and G. C. M. Bakker. 1999. Changes in energy metabolism in relation to
physical activity due to fermentable carbohydrates in group-housed growing pigs. J.
Anim. Sci. 77:3274-3280.
Schreier, H. J. 1993. Biosynthesis of glutamine and glutamate and the assimilation of ammonia.
In: Bacillus subtilis and Other Gram-Positive Bacteria. A. L. Sonenshein, J. A. Hoch, and
R. Losick, editors. Am. Soc. Microbiol., Washington, DC. p. 281-285.
Serena, A., and K. E. Bach Knudsen. 2007. Chemical and physicochemical characterization of
co-products from the vegetable food and agro industries. Anim. Feed Sci. Technol.
139:109-124.
Serena, A., H. Jørgensen, and K. E. Bach Knudsen. 2008. Digestion of carbohydrates and
utilization of energy in sows fed diets with contrasting levels and physicochemical
properties of dietary fiber. J. Anim. Sci. 86:2208-2216.
Serena, A., H. Jørgensen, and K. E. Bach Knudsen. 2009. Absorption of carbohydrate-derived
nutrients in sows as influenced by types and contents of dietary fiber. J. Anim. Sci.
87:136-147.
Shelton, D. R., and W. J. Lee. 2000. Cereal carbohydrates. In: Handbook of Cereal Science and
Technology. 2nd ed. K. Kulp and J. G. Ponte, editor. Marcel Dekker, NY. p. 385-416.
Spencer, J. D., K. J. Touchett, H. Liu, G. L. Allee, M. D. Newcomb, M. S. Keryley, and L. W.
Pace. 1997. Effect of spray-dried plasma and fructooligosaccharide on nursery
performance and small intestinal morphology of weaned pigs. J. Anim. Sci. 75(Suppl.
1):199. (Abstr.).

55
Stavric, S., and E. T. Kornegay. 1995. Microbial probiotics for pigs and poulty. In: R. J. Wallace
and A. Chesson, editors., Biotechnology in Animal Feeds and Feeding. 1st ed. VCH
Verlagsgesellscharft, Weinheim, Germany. p. 205-231.
Stein, H. H., and D. Y. Kil. 2006. Reduced use of antibiotic growth promoters in diets fed to
weaning pigs: dietary tools, Part 2. Anim. Biotech. 17:217-231.
Stewart, L. L., B. G. Kim, B. R. Gramm, R. D. Nimmo, and H. H. Stein. 2010. Effect of
virginiamycin on the apparent ileal digestibility of amino acids by growing pigs. J. Anim.
Sci. 88:1718-1724.
Swanson, K. S., C. M. Grieshop, E. A. Flickinger, L. L. Bauer, J. Chow, B. W. Wolf, K. A.
Garleb, and G. C. Fahey, Jr. 2002. Fructooligosaccharides and Lactobacillus acidophilus
modify gut microbial populations, total tract nutrient digestibilities and fecal protein
catabolite concentrations in healthy adult dogs. J. Nutr. 132:3721-3731.
Takahashi, T., Y. Furuichi, T. Mizuno, M. Kato, A. Tabara, Y. Kawada, Y. Hirano, K. Kubo, M.
Onozuka, and O. Kurita. 2009. Water-holding capacity of insoluble fibre decreases free
water and elevates digesta viscosity in the rat. J. Sci. Food Agric. 89:245-250.
Titgemeyer, E. C., L. D. Bourquin, G. C. Fahey Jr., and K. A. Garleb. 1991. Fermentability of
various fiber sources by human fecal bacteria in vitro. Am. J. Clin. Nutr. 6:1418-1424.
Thangaraju, M., G. Cresci, S. Itagaki, J. Mellinger, D. D. Browing, F. G. Berger, P. D. Prasad,
and V. Ganapathy. 2008. Sodium-coupled transport of the short chain fatty acid butyrate
by SLC5A8 and its relevance to colon cancer. J. Gastrointest. Surg. 12:1773-1782.
Topping, D. L., and P. M. Cliffton. 2001. Short-chain fatty acids and human colonic function:
Roles of resistant starch and non-starch polysaccharides. Physiol. Rev. 81:1031-1064.
56
Tosh, S. M., P. J. Wood, Q. Wang, and J. Weisz. 2004. Structural characteristics and rheological
properties of partially hydrolyzed oat β-glucan: the effects of molecular weight and
hydrolysis method. Carb. Polym. 55:425-436.
Urriola, P. E. 2010. Digestibility of dietary fiber by growing pigs. PhD Diss. Univ. Illinois,
Urbana, IL.
Urriola, P. E., and H. H. Stein. 2010. Effects of distillers dried grains with solubles on amino
acid, energy, and fiber digestibility and on hindgut fermentation of dietary fiber in a corn-
soybean meal diet fed to growing pigs. J. Anim. Sci. 88:1454-1462.
Urriola, P. E., G. C. Shurson, and H. H. Stein. 2010. Digestibility of dietary fiber in distillers
coproducts fed to growing pigs. J. Anim. Sci. 88:2373-2381.
Vandenbergh, P. A., 1993. Lactic acid bacteria, their metabolic products and interference with
microbial growth. FEMS Microbiol. Rev. 12:221-237.
van der Meulen, J., J. G. M. Bakker, B. Smits, and H. D. Visser. 1997. Effect of resistant starch
on net portal-drained viscera flux of glucose, volatile fatty acids, urea, and ammonia in
growing pigs. J. Anim. Sci. 75:2697-2704.
van Milgen, J., J. F. Bernier, Y. Lecozler, S. Dubois, and J. Noblet. 1998. Major determinants of
fasting heat production and energetic cost of activity in growing pigs of different body
weight and breed/castration combination. Br. J. Nutr. 79:509-517.
van Milgen, J., and J. Noblet. 2000. Modelling in energy expenditure in pigs. In: J. P.
McNamara, J. France, and D. E. Beever, editors. Modelling Nutrient Utilization in Farm
Animals. CAB International, Oxon, UK. p.103-114.
van Milgen, J., J. Noblet, and S. Dubois. 2001. Energetic efficiency of starch, protein and lipid
utilization in growing pigs. J. Nutr. 131:1309-1318.

57
van Milgen, J., and J. Noblet. 2003. Partitioning of energy intake to heat, protein, and fat in
growing pigs. J. Anim. Sci. 81(E. Suppl. 2):E86-E93.
Welter, H., and R. Claus. 2008. Expression of the monocarboxylate transporter 1 (MCT1) in
cells of the porcine intestine. Cell Biol. Int. 32:638-645.
Wenk, C. 2001. The role of dietary fibre in the digestive physiology of the pig. Anim. Feed Sci.
Technol. 90:21-33.
Willard, M. D., R. B. Simpson, N. D. Cohen, and J. S. Clancy. 2000. Effects of dietary
fructooligosaccharide on selected bacterial populations in feces of dogs. Amer. J. Vet.
Res. 61:820-825.
White, D. 2000. The Physiology and Biochemistry of Prokaryotes. 2nd ed Oxford University
Press. New York, NY.
Young, B. A., B. Kerrigan, and R. J. Christopherson. 1975. A versatile respiratory pattern
analyzer for studies of energy metabolism of livestock. Can. J. Anim. Sci. 55:17-22.
Zervas, S., and R. T. Zijlstra. 2002. Effects of dietary protein and fermentable fiber on nitrogen
excretion patterns and plasma urea in grower pigs. J. Anim. Sci. 80:3247-3256.
Zhang, G. F., D. W. Liu, F. L. Wang, and D. F. Li. 2014. Estimation of the net energy
requirements for maintenance in growing and finishing pigs. J. Anim. Sci. 92:2987-2995.
Zhao, P. Y., and I. H. Kim. 2015. Effect of direct-fed microbial on growth performance, nutrient
digestibility, fecal noxious gas emission, fecal microbial flora and diarrhea score in
weanling pigs. Anim. Feed Sci. Technol. 200:86-92.
Zumdahl, S. S., and D. J. DeCoste. 2010. Introductory Chemistry: A Foundation. 7th ed.
Brooks/Cole, Belmont, CA.

58
TABLES
Table 2.1. Gross energy, digestible energy, metabolizable energy, and net energy of 4
ingredients varying in chemical composition used in pig diets, as-fed basis1
Corn Soybean meal DDGS2 Wheat bran
Type of ingredient High-starch High-protein High-fat High-fiber
GE, kcal / kg 3,933 4,256 4,849 4,010
DE, kcal / kg 3,451 3,619 3,620 2,420
ME, kcal / kg 3,395 3,294 3,434 2,318
NE, kcal / kg 2,672 2,087 2,384 1,646
NE:GE 0.68 0.49 0.49 0.41
NE:DE 0.77 0.58 0.66 0.68
NE:ME 0.79 0.63 0.69 0.71
1Values obtained from NRC, 2012.
2DDGS = distillers dried grains with solubles, > 10% oil.
59
CHAPTER 3: DIGESTIBLE, METABOLIZABLE, AND NET ENERGY IN DIETS
CONTAINING 0, 15, OR 30% WHEAT BRAN FED TO GROWING PIGS
ABSTRACT: An experiment was conducted to determine the DE, ME, and NE in diets with 0,
15, or 30% wheat bran added to a corn-soybean meal-based diet fed to growing pigs. A second
objective was to test the hypothesis that the DE, ME, and NE in wheat bran can be determined
using the difference procedure with the same efficacy as with a regression method. Eighteen
barrows (initial BW: 54.4 ± 4.3 kg) were individually housed in metabolism cages. The
experiment had 3 periods and 6 replicate pigs per diet. The control diet contained corn, soybean
meal, and no wheat bran, and 2 additional diets were formulated by mixing 15 or 30% wheat
bran with 85 or 70% of the control diet, respectively. Each period lasted 15 d. During the initial 7
d, pigs were adapted to their experimental diets and housed in metabolism crates in an
environmentally controlled room and fed 573 kcal ME / kg BW0.6 per d. On d 8, metabolism
crates with pigs were moved into open-circuit respiration chambers for measurement of O2
consumption and CO2 and CH4 production. The feeding level was the same as in the adaptation
period and feces and urine also were collected during this period. On d 13 and 14, pigs were fed
225 kcal ME / kg BW0.6 per d, and pigs then were fasted for 24 h to obtain fasting heat
production. The apparent total tract digestibility of DM, GE, crude fiber, ADF, and NDF linearly
decreased (P ≤ 0.05) as wheat bran inclusion increased in the diets. The daily O2 consumption
and CO2 and CH4 production by pigs fed increasing concentrations of wheat bran linearly
decreased (P ≤ 0.05) resulting in a linear decrease (P ≤ 0.05) in heat production. The DE (3,454,
3,257, and 3,161 kcal/kg), ME (3,400, 3,209, and 3,091 kcal/kg), and NE (1,808, 1,575, and
1,458 kcal/kg) of diets linearly decreased (P ≤ 0.05) as wheat bran inclusion increased. The DE,
60
ME, and NE in wheat bran determined using the difference procedure was 2,168, 2,117, and 896
kcal/kg and these values were within the 95% confidence interval of the DE (2,285 kcal/kg), ME
(2,217 kcal/kg), and NE (961 kcal/kg) estimated by linear regression. In conclusion, increasing
inclusion of wheat bran decreased nutrient digestibility and heat production as well as DE, ME,
and NE in diets. Finally, in agreement with our hypothesis, the DE, ME, and NE values for
wheat bran determined using the difference procedure were similar compared to estimates using
linear regression.
Key words: dietary fiber, energy concentration, heat production, pig, wheat bran
INTRODUCTION
In the United States, the energy content of diets fed to pigs is most often evaluated using
DE and ME systems (Whitney, 2005). However, DE and ME systems overestimate the energy
value of protein and fibrous feedstuffs and underestimate the energy value of fat- and starch-
containing feedstuffs; therefore, it is possible that a more accurate estimate of the energy content
of pig diets may be obtained using a NE system (Noblet and van Milgen, 2013).
An increased use of dietary fiber in pig diets because of increased inclusion of co-
products, such as wheat bran, has been observed in pig production for the past decade and is
believed to continue in the future (Woyengo et al., 2014). Therefore, there is a need to determine
the energy contribution from dietary fiber in co-products, but the effect of dietary fiber on heat
production (HP) and NE of the diet remains unclear (Noblet and van Milgen, 2004).
Biologically, HP is expected to increase with the inclusion of dietary fiber in pig diets due to
increased feed intake, increased size of the gastrointestinal tract in relation to body weight, and

61
increased hindgut fermentation resulting in energetic losses of methane (Jørgensen et al., 1996).
However, the physical activity and overall metabolism may be modified by the addition of
dietary fiber causing a decrease or no change in HP (Schrama et al., 1998). Therefore, the first
objective of this experiment was to test the hypothesis that increased dietary fiber in the form of
wheat bran added to a corn-soybean meal diet will increase HP and reduce calculated values for
DE, ME, and NE when fed to growing pigs. Also, the difference procedure may not be
appropriate to measure NE in feed ingredients because the nutrient content of the test diet may
vary substantially compared with the basal diet and this will impact HP of pigs fed the diets, thus
making the difference method inappropriate for determining the NE of feed ingredients.
However, this theory has not been experimentally verified. Therefore, the second objective was
to test the hypothesis that NE in wheat bran can be determined using the difference procedure
with the same efficacy as with a regression method.
MATERIALS AND METHODS
The protocol for this experiment was approved by the Institutional Animal Care and Use
Committee at China Agricultural University and the experiment was conducted in the Open-
Circuit Respiration Laboratory at the Swine Nutrition Research Centre of the National Feed
Engineering Technology Research Center (Chengde, Hebei Province, China).
Indirect Calorimetry Equipment. Six open-circuit respiration chambers with a volume of
approximately 7.8 m3 were used based on a design similar to that of van Milgen et al. (1997).
Gas was extracted continuously from the respiration chamber by a vacuum pump. The
respiration chamber was maintained at a constant temperature and humidity using an air
62
conditioner and a heater. Temperature and atmospheric pressure in the chamber were measured
and used to calculate the standard temperature and pressure (STP; 0°C, 101 kPa) extraction rate.
Oxygen inside and outside the chamber was measured with a paramagnetic differential analyzer
(Oxymat 6E, Siemens, Munich, Germany), whereas CO2, CH4, and NH3 were measured with
infrared analyzers (Ultramat 6E, Siemens, Munich, Germany). The analyzers had a range of
measurement of 19.5 to 21.0% for O2, 0 to 1% for CO2, 0 to 0.1% for CH4, and 0 to 0.1% for
NH3 with a sensitivity of 0.2% within the measurement range. The gas extraction rate was
measured by a mass flow meter (Alicat, Tucson, USA). Two respiration chambers shared one
gas analyzer. Gas concentrations in each chamber were measured at 5-min intervals.
Animals, Housing, Experimental Design, and Diets. Eighteen Duroc × (Landrace ×
Large White) barrows with an initial BW of 54.4 ± 4.3 kg were used. Six open-circuit respiration
chambers were available and, therefore, the experiment had 3 diets, 3 periods, and a total of 6
replicate pigs per diet. All pigs were housed in metabolism cages for the duration of the
experiment (adaptation plus experimental period). The metabolism cages were equipped with a
feeder and a water trough that prevented contamination of feces and urine with feed and water.
Pigs stood on fully slatted floors with a screen underneath for fecal collection and a urine tray
underneath the fecal screen, which allowed for the total, but separate, collection of urine and
feces from each pig. Prior to each experimental period, pigs were adapted to their experimental
diet for 8 d. Each experimental period lasted a total of 8 d, which consisted of a 5 d energy
balance, a 2 d pre-fasting period, and a final 24 h fast. Pigs were weighed at the beginning of the
collection period and at the beginning and end of the fasting period. During the experimental
period, pigs were housed individually in metabolism cages that were placed inside open-circuit
respiration chambers. The chamber temperature was maintained at 22°C during the 5 d energy
63
balance, 23°C during the 2 d pre-fasting period, and 24°C during the final 24 h fast. The relative
humidity in the chambers was maintained at 70% and the air velocity was 0.1 m/s.
Three experimental diets were formulated (Table 3.1). The basal diet contained corn,
soybean meal, and no wheat bran. Two additional diets were formulated by mixing 15 or 30%
wheat bran with 85 or 70% of the basal diet, respectively. The basal diet was over-formulated
compared with the expected requirement (NRC, 2012) to ensure that the diet containing 30%
wheat bran had 0.85% standardized ileal digestible (SID) Lys and met current requirement
estimates for SID indispensable AA, standardized total tract digestible (STTD) P, vitamins, and
minerals (NRC, 2012). The quantity of feed provided per pig daily during the 5 d energy balance
was calculated as 573 kcal ME / kg BW0.6 and divided into two equal meals that were provided
at 0700 and 1600 h, at which time the respiration chamber doors were opened and gas
measurements during these times were disregarded from the final calculations. The quantity of
feed provided was based on previous research that determined the ad libitum ME intake to be
573 kcal ME / kg BW0.6 and the feeding level was based on each pigs’ individual BW (Zhang et
al., 2014). The quantity of feed provided per pig daily during the 2 d pre-fasting period was
calculated as 225 kcal ME / kg BW0.6 and only urine was collected during this time. Pigs were
fasted for the final 24 h in the respiration chambers and only urine was collected during this time.
Feces were not collected during the pre-fasting and the fasting period because only urine is
necessary for the calculation of fasting heat production (FHP). The pre-fasting period was
utilized to adapt pigs to a lower feed intake in preparation for the 24 h fast based on unpublished
data from our laboratory that determined the noise in gas measurements during the 24 h fast was
much less when a pre-fasting period is utilized, therefore, giving a better measurement of FHP.
Water was available on an ad libitum basis throughout the experiment.

64
During the 5 d energy balance, total, but separate, collection of feces and urine was
conducted. Feces were collected each day when the chamber doors were opened for
approximately 1 h to feed the pigs (i.e., at 0700 and 1600 h) and immediately stored at -20°C.
Urine was collected each morning at 0700 h over a preservative of 50 mL of 6N HCl. Each day,
the total urine volume produced by each pig was measured and a 5% aliquot was filtered through
cheesecloth, transferred into a plastic bottle, and stored at -20°C. At the end of the collection
period, urine samples were thawed, thoroughly mixed, and 50 mL of urine from each pig was
collected into screw-cap tubes and this sample was used for analysis. At the conclusion of the 5 d
energy balance period, feces were thawed, mixed, weighed, and duplicate subsamples of
approximately 350 g were dried for 72 h in a 65°C drying oven. The subsamples then were
weighed, ground through a 1-mm screen, and used for analysis.
Sample Analysis and Calculations. Diet, ingredient, and fecal samples were analyzed for
DM (Method 930.15; AOAC Int., 2007), ash (Method 942.05; AOAC Int., 2007), crude fiber
(Method 978.10; AOAC Int., 2007), ADF (Method 973.18; AOAC Int., 2007), and NDF (Holst,
1973). All diets, ingredients, and fecal samples were analyzed for CP using the combustion
procedure (Method 990.03; AOAC Int., 2007) on an Elementar Rapid N-cube protein/nitrogen
apparatus (Elementar Americas Inc., Mt. Laurel, NJ). Aspartic acid was used as a calibration
standard and CP was calculated as N × 6.25. Diets and ingredients were analyzed for AA on a
Hitachi AA Analyzer, Model No. L8800 (Hitachi High Technologies America, Inc, Pleasanton,
CA) using ninhydrin for postcolum derivatization and norleucine as the internal standard. Prior
to analysis, samples were hydrolyzed with 6N HCl for 24 h at 110°C [Method 982.30 E(a);
AOAC Int., 2007]. Urinary N was determined as Kjeldahl N (Thiex et al., 2002). Acid
hydrolyzed ether extract (AEE) was determined in all diet and ingredient samples by acid

65
hydrolysis using 3N HCl (Sanderson, 1986) followed by crude fat extraction using petroleum
ether (Method 2003.06, AOAC Int., 2007) on a Soxtec 2050 automated analyzer (FOSS North
America, Eden Prairie, MN). Diets and ingredients also were analyzed for total dietary fiber,
insoluble dietary fiber, and soluble dietary fiber according to Prosky et al. (1992).
Monosaccharides and oligosaccharides in the ingredients were analyzed as described by
Cervantes-Pahm and Stein (2010). Total starch was analyzed in all diets and ingredients by the
glucoamylase procedure (Method 979.10; AOAC Int., 2007). Diet, ingredient, fecal, and urine
samples were analyzed in duplicate for GE using bomb calorimetry (Model 6300; Parr
Instruments, Moline, IL), and the ATTD of GE in each diet was calculated (Adeola, 2001).
The energy lost in feces and urine was calculated and quantities of DE and ME in each of
the three diets were calculated (Adeola, 2001). Although CH4 production by pigs was measured,
it was not included in the calculation of ME because most ME values disregard energy losses of
CH4 even though energy losses of CH4 can range from 0.1 to 3.0% of DE (Shi and Noblet,
1993). The DE and ME in the basal diet then was multiplied by 85 or 70% to calculate the
contribution from the basal diet to the DE and ME in diets containing 15 or 30% wheat bran,
respectively. The DE and ME in wheat bran then was calculated by difference (Stewart et al.,
2013).
During each of the 8 d experimental periods, O2, CO2, and CH4 concentrations were
measured in each respiratory chamber and outside of each respiration chamber at 5 min intervals.
These concentrations then were used to calculate O2 consumption and CO2 and CH4 production
during each 5 min interval by pigs and these were summed over a 24 h period. Heat production
then was calculated from gas exchanges and urinary losses of N according to Brouwer (1965)
using Eq. [1]:

66
HP (kcal) = 3.866 × O2 (L) + 1.200 × CO2 (L) – 0.518 × CH4 (L) – 1.431 × urinary N (g). [1]
Fasting heat production was calculated using the same equation, but using gas exchanges and
urinary losses of N during the 24 h fasting period.
Retention of dietary energy (RE) was calculated according to Ayoade et al. (2012) using
Eq. [2]:
RE (kcal) = ME intake (kcal) – HP (kcal). [2]
Retention of energy as protein (REP) was calculated according to Ewan (2001) as N retention (g)
× 6.25 × 5.68 (kcal/g). Retention of energy as lipid (REL) was calculated as the difference
between RE and REP (Labussière et al., 2009).
Net energy of each diet was calculated according to Noblet et al. (1994) using Eq. [3]:
NE (kcal/kg DM) = [RE (kcal) + FHP (kcal)] / DMI (kg). [3]
After the NE of each diet was calculated, the NE of wheat bran also was calculated by
difference as described previously for the calculation of DE and ME in wheat bran (Stewart et
al., 2013). The respiration quotient (RQ) was calculated as the ratio between CO2 production and
O2 consumption (Noblet et al., 2001).
Statistical Analysis. Homogeneity of variances was confirmed using the UNIVERIATE
procedure (SAS Inst. Inc., Cary, NC). Outliers were determined as any value that deviated from
the treatment mean by ± 2 standard deviations and three were removed from the data set. A pig
fed the 30% wheat bran diet died on d 4 of the 5 d experimental period and was not included in
the calculations. Data were analyzed using the MIXED procedure. The model included diet as
the fixed effect and pig and period as random effects. Least squares means were calculated for

67
each independent variable. Orthogonal polynomials were used to determine linear and quadratic
effects of diet. Regression equations to estimate the DE, ME, and NE of wheat bran were
developed using the REG procedure in SAS following methods of Young et al. (1977) and
Noblet et al. (1993). The DE, ME, and NE of wheat bran then were estimated by solving the
prediction equations when wheat bran inclusion was equal to 100%. The CLB statement in SAS
was used to determine the 95% confidence levels for the regression coefficients used for
estimating DE, ME, and NE of wheat bran. The DE, ME, and NE of wheat bran obtained using
the difference procedure was considered not different than the DE, ME, and NE of wheat bran
estimated using linear regression if the values fell within the 95% confidence interval for the DE,
ME, and NE of wheat bran estimated using linear regression. The pig was the experimental unit
and a probability of P ≤ 0.05 was considered significant and 0.05 < P ≤ 0.10 was considered a
trend.
RESULTS AND DISCUSSION
The wheat bran used in this experiment contained 11.84, 13.77, and 44.76% crude fiber,
ADF, and NDF, respectively, compared with average values of 7.77, 11.00, and 32.28%,
respectively (NRC, 2012; Table 3.2). The concentration of soluble, insoluble, and total dietary
fiber in wheat bran used in this experiment was 2.9, 48.0, and 50.9%, respectively, whereas
Jaworski et al. (2015) reported the concentration of soluble, insoluble, and total dietary fiber in
wheat bran to be 3.5, 34.9, and 38.4%, respectively. Also, the concentration of starch in wheat
bran used in the current experiment was 11.26% whereas NRC (2012) and Jaworski et al. (2015)
reported the starch concentration of wheat bran to be 22.56 and 15.67%, respectively. These
differences indicate that the source of wheat bran used in this experiment was produced from a
68
flour mill that was more efficient in extracting the starch from the wheat compared with those
used to produce the wheat bran included in NRC (2012) and Jaworski et al. (2015). The soybean
meal used in this experiment contained 4.97% crude fiber, 8.86% ADF, 10.31% NDF, 5.92%
sucrose, 1.52% raffinose, and 4.16% stachyose, which is within the range of values previously
reported (Baker and Stein, 2009; Cervantes-Pahm and Stein, 2010; NRC, 2012). The
concentrations of CP and AA in the soybean meal used in this experiment were comparable with
NRC (2012). The nutrient composition of the corn used in this experiment also was in agreement
with previous values (NRC, 2012; Rojas et al., 2013). The analyzed nutrient and energy
concentrations in experimental diets were not different from calculated values (Table 3.1). The
concentration of GE and insoluble dietary fiber increased and the concentration of starch and
soluble dietary fiber decreased as wheat bran inclusion increased in the diets.
Final BW of pigs linearly decreased (P ≤ 0.05) as the concentration of wheat bran
increased in the diet (Table 3.3). These results are in agreement with data for growing pigs fed
diets containing 30% soybean hulls or wheat middlings compared with pigs fed a corn-soybean
meal-based diet (Stewart et al., 2013). Daily feed intake of pigs tended to linearly decrease (P <
0.10) as wheat bran inclusion increased in diets. Feeding level does not impact energy
digestibility and, therefore, feed intake did not influence energy digestibility in this experiment
(Moter and Stein, 2004). The ATTD of DM, GE, CP, crude fiber, ADF, and NDF decreased
linearly (P ≤ 0.05) as wheat bran inclusion increased in the diets (Table 3.4). There was also a
tendency for a quadratic decrease (P ≤ 0.10) in the ATTD of ADF by pigs as wheat bran
inclusion increased in the diets. There was a linear increase (P ≤ 0.05) in fecal output, GE in the
feces, and fecal GE output as wheat bran inclusion in the diets increased. Therefore, the DE in
the diets decreased linearly (P ≤ 0.05) from 3,454 to 3,257 and 3,161 kcal/kg as wheat bran
69
inclusion increased in the diets. Urine output by pigs tended to decrease linearly (P ≤ 0.10) as
wheat bran inclusion increased in the diets, but GE in the urine of pigs fed experimental diets
was not different and urine GE output was not different among diets. The ME in diets decreased
linearly (P ≤ 0.05) from 3,400 to 3,209 and 3,091 kcal/kg as wheat bran inclusion increased.
Total HP and daily HP by pigs decreased linearly (P ≤ 0.05) as wheat bran inclusion
increased in diets, and this observation contradicts our hypothesis. Previous research has
observed no differences in HP in 50 kg pigs fed a high-starch diet versus a high-fiber diet
(Schrama et al., 1996), in group-housed growing pigs fed diets with concentrations of 0, 5, 10, or
15% sugar beet pulp silage (Schrama et al., 1998), in group-housed growing pigs fed a corn-
based diet versus a diet containing corn plus 15% wheat straw (Schrama and Bakker, 1999), and
in 18.5 kg pigs fed diets with 0, 15, or 30% wheat-corn distillers dried grains with solubles
(Ayoade et al., 2012). It is possible that as dietary fiber concentrations increase in diets fed to
growing pigs, the HP related to physical activity decreases, resulting in no change or potentially
a decrease in HP (Schrama and Bakker, 1999). However, physical activity was not measured in
the current experiment and we are, therefore, not able to verify the hypothesis by Schrama and
Bakker (1999).
The concentration of N in the urine decreased linearly (P ≤ 0.05) by pigs fed diets
containing increasing concentrations of wheat bran, but urinary N output was not different. There
was a linear decrease (P ≤ 0.05) in O2 consumption from 663.71 to 659.82 and 636.38 L/d as
wheat bran inclusion in diets increased. Carbon dioxide and CH4 production by pigs also
decreased linearly (P ≤ 0.05) from 700.42 to 678.27 and 656.19 L/d and from 4.83 to 3.21 and
1.51 L/d, respectively, as wheat bran inclusion increased in the diets. The CH4 excretion of
growing pigs in the current experiment is in agreement with values previously reported for CH4

70
excretion by growing pigs (Christensen and Thorbek, 1987). The RQ of pigs fed experimental
diets decreased linearly (P ≤ 0.05) from 1.06 to 1.03 and 1.03 as wheat bran inclusion in the diets
increased, which may be indicative of the diets becoming limited in energy supply.
Chinese Latang gilts fed a corn-soybean meal-based diet with 21% wheat bran produced
3.9 L of CH4 per day (Cao et al., 2013), which is in agreement with the current study where pigs
fed 15% wheat bran produced 3.21 L of CH4 per day. Diets containing greater quantities of
insoluble dietary fiber promote gut fill, increase frequency of laxation, and decrease transit time
to increase feed intake to compensate for reduced dietary energy obtained from the consumption
of dietary fiber (Kyriazakis and Emmans, 1995). The decrease in transit time may have reduced
the amount of time the microbial population in the hindgut of the pig had access to ferment the
dietary fiber in wheat bran, which may be the reason for the reduction in the fermentation end-
product (i. e., CH4) that was observed in the current experiment as wheat bran inclusion
increased. In vitro total tract digestibility of DM and non-starch polysaccharides in wheat bran is
63.6 and 20.6%, respectively (Jaworski et al., 2015), indicating that the dietary fiber in wheat
bran has a low fermentability, which may have contributed to the reduction in CH4 excretion that
was observed in the current experiment as inclusion of wheat bran increased.
Pigs fed diets containing greater amounts of dietary fiber in the form of wheat bran have
an increased empty weight of the gastrointestinal tract compared with pigs fed a wheat-based diet
lower in dietary fiber (Kyriazakis and Emmans, 1995). The gastrointestinal tract of animals may
consume as much as 30% of FHP and when the size of the tract is increased, the energy required
to maintain the tract increases. Thus, the FHP or NE required for maintenance is increased
(Baldwin, 1995). However, the FHP and fasting RQ of pigs were not different among pigs that
were previously fed different experimental diets. The relatively short duration of feeding the

71
experimental diets limited the expansion of the gastrointestinal tract, which is the reason FHP
was not different among treatments. The FHP obtained in this experiment is within the range of
FHP values obtained in similar experiments conducted in the same facility (Liu et al., 2014;
Zhang et al., 2014), but the FHP obtained in this experiment was only slightly greater than the
FHP suggested by Noblet et al. (1994) and by NRC (2012). The fasting RQ of pigs previously
fed different experimental diets was not different and was close to the level for fasting
metabolism where the RQ becomes equivalent to the catabolism of fat (NRC, 1981).
Daily retained energy by pigs decreased linearly (P ≤ 0.05) from 266.87 to 223.85 and
216.28 kcal/kg BW0.6 as pigs were fed diets containing increasing amounts of wheat bran. The
daily retained energy by pigs fed the basal diet or the 30% wheat bran diet were greater
compared with previous work (Stewart et al., 2013). However, the results obtained by Stewart et
al. (2013) were determined using the comparative slaughter method, and it has been suggested
that the comparative slaughter method may underestimate the energy retention of pigs compared
with indirect calorimetry (Quiniou et al., 1995; van Milgen and Noblet, 2003; Kil et al., 2011,
2013a, 2013b). Retained protein did not differ among pigs fed the experimental diets, which was
most likely due to the fact that all diets were formulated to meet or exceed NRC (2012)
requirements for standardized ileal digestible indispensable AA. Therefore, protein synthesis was
not limited in this experiment. However, retained lipid decreased linearly (P ≤ 0.05) when pigs
were fed increasing amounts of wheat bran and this was due to the decreased ATTD of nutrients
and energy and the reduced DE, ME, and NE in the diets as wheat bran inclusion increased.
The NE in the experimental diets decreased linearly (P ≤ 0.05) from 1,808 to 1,575 and
1,458 kcal/kg as wheat bran inclusion increased in the diets. A diet containing 30% wheat
middlings and fed to growing pigs was determined to contain 1,759 kcal/kg (Stewart et al.,
72
2013), which is slightly greater than the NE in the 30% wheat bran diet in the current
experiment, but wheat bran also contains less DE, ME, and NE than wheat middlings. The NE in
the corn-soybean meal basal diet used in this experiment (1,808 kcal/kg) is in agreement with a
recent estimate (1,870 kcal/kg) for a similar diet (Kil et al., 2013a). Net energy of the diets with
0, 15, and 30% added wheat bran was calculated according to Noblet et al. (1994) and was 2,927,
2,750, and 2,647 kcal/kg DM, respectively, and these values are greater than the experimentally
determined NE of the diets. In the development of the NE prediction equations, Noblet et al.
(1994) had a maximum inclusion level of 28% corn, whereas the inclusion of corn ranged from
55.6 to 79.5% in the current experiment. Also, Noblet et al. (1994) had a maximum pig BW of
46.7 kg, whereas the initial pig BW used in the current experiment was 54.4 kg. These
differences may be the cause of the discrepancy between values obtained experimentally in the
current experiment versus calculated values according to Noblet et al. (1994).
Linear regression analyses were used to examine the relationship between energy and
dietary wheat bran according to Young et al. (1977) and Noblet et al. (1993). The dependent
variable in the three prediction equations was dietary DE, ME, and NE in kcal/kg (as-fed basis),
respectively, and the independent variable was dietary wheat bran inclusion in percent (as-fed
basis; Table 3.5). The prediction equation for dietary DE had an intercept equal to 3,457.7 (P ≤
0.05) and a slope estimate of -11.725 (P ≤ 0.05) with 90% of the variation in dietary DE
explained by the model. The prediction equation for dietary ME had an intercept equal to 3,389.6
(P ≤ 0.05) and a slope estimate of -11.725 (P ≤ 0.05) with 92% of the variation in dietary ME
explained by the model. The prediction equation for dietary NE had an intercept equal to 1,788.1
(P ≤ 0.05) and a slope estimate of -8.273 (P ≤ 0.05) with 35% of the variation in dietary NE
explained by the model. The poor prediction of NE was because only three diets were utilized in
73
the regression model and a large SEM was attributed to the NE of the diets. The y-intercept of
the three prediction equations is equal to the DE, ME, and NE in the basal diet (kcal/kg as-fed
basis). The slope of the prediction equations for DE and ME were the same, which indicates that
the percent change in wheat bran inclusion produces the same decrease in DE as ME. The DE,
ME, and NE of wheat bran estimated using the prediction equations were 2,285, 2,217, and 961
kcal/kg as-fed basis, respectively (Table 3.6). The DE, ME, and NE of wheat bran determined
using the difference method were 2,168, 2,117, and 896 kcal/kg as-fed basis, respectively. In
agreement with our hypothesis and Bolarinwa and Adeola (2012), the DE, ME, and NE of wheat
bran obtained using the difference procedure were within the 95% confidence intervals obtained
for the DE, ME, and NE of wheat bran estimated using linear regression indicating that both
procedures may be used to estimate values for DE, ME, and NE. The NE of wheat middlings was
recently reported at 987 kcal/kg (Stewart et al., 2013) and is slightly greater than the NE of
wheat bran obtained using either method in the current experiment, which was expected because
wheat bran has a greater amount of dietary fiber compared with wheat middlings. Values for DE,
ME, and NE of wheat bran obtained in this experiment using either method are less than the
values reported by NRC (2012; 3,151, 2,902, and 1,847 kcal/kg, respectively) and the NE value
obtained when calculated according to Noblet et al. (1994; 1,338 kcal/kg DM), which is likely a
result of the greater concentration of dietary fiber, in particular insoluble dietary fiber, in the
wheat bran used in this experiment compared with previously reported values.
CONCLUSION
Inclusion of 0, 15, or 30% wheat bran in diets fed to growing pigs resulted in a decreased
ATTD of nutrients and energy as wheat bran inclusion increased, which led to a decrease in
dietary DE, ME, and NE as dietary wheat bran inclusion increased. The HP of pigs decreased

74
linearly as dietary wheat bran inclusion increased which was in contrast to our hypothesis.
However, the FHP of pigs was unaffected by inclusion of wheat bran in the diets. The excretion
of CH4 decreased as wheat bran inclusion increased in the experimental diets, indicating that the
fermentation of wheat bran is low due to the large concentrations of insoluble dietary fiber. The
DE, ME, and NE in wheat bran determined using the difference procedure were in good
agreement with the DE, ME, and NE estimated using linear regression indicating that both
procedures may be used to estimate energy values in feed ingredients. However, caution must be
used when applying this research to other ingredients because wheat bran was the sole ingredient
tested and, in addition, prediction equations were developed using linear regression with only
three different inclusion levels of wheat bran. Therefore, further research is necessary to validate
the conclusions drawn using different ingredients and more diets for the development of
prediction equations.

75
LITERATURE CITED
Adeola, O. 2001. Digestion and balance techniques in pigs. In: A. J. Lewis and L. L. Southern,
editors, Swine Nutrition. 2nd ed. CRC Press, Washington, DC. p. 903-916.
AOAC International. 2007. Official Methods of Analysis of AOAC Int. 18th ed. Rev. 2. W.
Hortwitz and G. W. Latimer Jr., ed. AOAC Int., Gaithersburg, MD.
Ayoade, D. I., E. Kiarie, M. A. Trinidade Neto, and C. M. Nyachoti. 2012. Net energy of diets
containing wheat-corn distillers dried grains with solubles as determined by indirect
calorimetry, comparative slaughter, and chemical composition methods. J. Anim. Sci.
90:12:4373-4379.
Baldwin, R. L. 1995. Energy requirements for maintenance and production. In: R. L. Baldwin,
ed. Modeling Ruminant Digestion and Metabolism. Chapman and Hall, London, UK. p.
148-188.
Baker, K. M., and H. H. Stein. 2009. Amino acid digestibility and concentration of digestible and
metabolizable energy in soybean meal produced from conventional, high-protein, or low-
oligosaccharide varieties of soybeans and fed to growing pigs. J. Anim. Sci. 87:2282-
2290.
Bolarinwa, O. A., and O. Adeola. 2012. Direct and regression methods do not give different
estimates of digestible and metabolizable energy of wheat for pigs. J. Anim. Sci. 90:390-
392.
Brouwer, E. 1965. Report of sub-committee on constants and factors. In: K. Blaxter, ed., Energy
Metabolism. Academic Press, London, p. 441-443.

76
Cao, Z., Y. L. Gong, X. D. Liao, J. B. Liang, B. Yu, and Y. B. Wu. 2013. Effect of dietary fiber
on methane production in Chinese Latang gilts. Livest. Sci. 157:191-199.
Cervantes-Pahm, S. K., and H. H. Stein. 2010. Ileal digestibility of amino acids in conventional,
fermented, and enzyme-treated soybean meal and in soy protein isolate, fish meal, and
casein fed to weanling pigs. J. Anim. Sci. 88:2674-2683.
Christensen, K., and G. Thorbek. 1987. Methane excretion in the growing pig. Br. J. Nutr.
57:355-361.
Ewan, R. C. 2001. Energy utilization in swine nutrition. In: A. J. Lewis and L. L. Southern, eds.
Swine Nutrition. 2nd edition. CRC Press, Washington, DC. p. 85-94.
Holst, D. O. 1973. Holst filtration apparatus for Van Soest detergent fiber analysis. J. AOAC.
56:1352-1356.
Jaworski, N. W., H. N. Lærke, K. E. Bach Knudsen, and H. H. Stein. 2015. Carbohydrate
composition and in vitro digestibility of dry matter and nonstarch polysaccharides in
corn, sorghum, and wheat and coproducts from these grains. J. Anim. Sci. 93:1103-1113.
Jørgensen, H., X. Q. Zhao, and B. O. Eggum. 1996. The influence of dietary fibre and
environmental temperature on the development of the gastrointestinal tract, digestibility,
degree of fermentation in the hind-gut and energy metabolism in pigs. Br. J. Nutr.
75:365-378.
Kil, D. Y., F. Ji, L. L. Stewart, R. B. Hinson, A. D. Beaulieu, G. L. Allee, J. F. Patience, J. E.
Pettigrew, and H. H. Stein. 2011. Net energy of soybean oil and choice white grease in
diets fed to growing and finishing pigs. J. Anim. Sci. 89:448-459.
77
Kil, D. Y., F. Ji, L. L. Stewart, R. B. Hinson, A. D. Beaulieu, G. L. Allee, J. F. Patience, J. E.
Pettigrew, and H. H. Stein. 2013a. Effects of dietary soybean oil on pig growth
performance, retention of proteins, lipids, and energy, and on the net energy of corn in
diets fed to growing or finishing pigs. J. Anim. Sci. 91:3283-3290.
Kil, D. Y., B. G. Kim, and H. H. Stein. 2013b. Invited review: Feed energy evaluation for
growing pigs. Asian-Aust. J. Anim. Sci. 26:1205-1217.
Kyriazakis, I., and G. C. Emmans. 1995. The voluntary feed intake of pigs given feeds based on
wheat bran, dried citrus pulp and grass meal, in relation to measurements of feed bulk.
Br. J. Nutr. 73:191-207.
Labussière, E., G. Maxin, S. Dubois, J. van Milgen, G. Bertrand, and J. Noblet. 2009. Effect of
feed intake on heat production and protein and fat deposition in milk-fed veal calves.
Animal 3:557-567.
Liu, D., N. W. Jaworski, G. Zhang, Z. Li, D. F. Li, and F. Wang. 2014. Effect of experimental
methodology on fasting heat production and the net energy content of corn and soybean
meal fed to growing pigs. Arch. Anim. Nutr. 68:281-295.
Moter, V., and H. H. Stein. 2004. Effect of feed intake on endogenous losses and amino acid and
energy digestibility by growing pigs. J. Anim. Sci. 82:3518-3525.
Noblet, J., H. Fortune, C. Dupire, and S. Dubois. 1993. Digestible, metabolizable and net energy
values of 13 feedstuffs for growing pigs: effect of energy system. Anim. Feed Sci.
Technol. 42:131-149.
78
Noblet, J., H. Fortune, X. S. Shi, and S. Dubois. 1994. Prediction of net energy value of feeds for
growing pigs. J. Anim. Sci. 72:344-354.
Noblet, J., L. Le Bellego, J. van Milgen, and S. Dubois. 2001. Effects of reduced dietary protein
level and fat addition on heat production and nitrogen and energy balance in growing
pigs. Anim. Res. 50:227-238.
Noblet, J., and J. van Milgen. 2004. Energy value of pig feeds: effect of pig body weight and
energy evaluation system. J. Anim. Sci. 82(E. Suppl.):E229-E238.
Noblet, J., and J. van Milgen. 2013. Energy and energy metabolism in swine. In: L. I. Chiba, ed.,
Sustainable Swine Nutrition. 1st ed. John Wiley & Sons, Inc., Ames, IA. p. 23-57.
NRC. 1981. Nutritional Energetics of Domestic Animals & Glossary of Energy Terms. 2nd rev.
ed. Natl. Acad. Press, Washington, DC.
NRC. 2012. Nutrient Requirements of Swine. 11th rev. ed. Natl. Acad. Press, Washington, DC.
Prosky, L., N. G. Asp, T. F. Schweizer, J. W. De Vries, and I. Furda. 1992. Determination of
insoluble, soluble and total dietary fiber in foods and food products: Collaborative study.
J. AOAC. 75:360-367.
Quiniou, N., S. Dubois, and J. Noblet. 1995. Effect of dietary crude protein level on protein and
energy balances in growing pigs: comparison of two measurement methods. Livest. Prod.
Sci. 41:51-61.
Rojas, O. J., Y. Liu, and H. H. Stein. 2013. Phosphorus digestibility and concentration of
digestible and metabolizable energy in corn, corn coproducts, and bakery meal fed to
growing pigs. J. Anim. Sci. 91:5326-5335.
79
Sanderson, P. 1986. A new method of analysis of feeding stuffs for the determination of crude
oils and fats. In: W. Haresign and D. J. A. Cole, editors, Recent Advances in Animal
Nutrition. Butterworths, London, UK. p. 77-81.
Schrama, J. W., M. W. A., Verstegen, P. H. J. Verboeket, J. B. Schutte, and J. Haaksma. 1996.
Energy metabolism in relation to physical activity in growing pigs as affected by type of
dietary carbohydrate. J. Anim. Sci. 74:2220-2225.
Schrama, J. W., M. W. Bosch, M. W. A. Verstegen, A. H. P. M. Vorselaars, J. Haaksma, and M.
J. W. Heetkamp. 1998. The energetic value of nonstarch polysaccharides in relation to
physical activity in group-housed, growing pigs. J. Anim. Sci. 76:3016-3023.
Schrama, J. W., and G. C. M. Bakker. 1999. Changes in energy metabolism in relation to
physical activity due to fermentable carbohydrates in group-housed growing pigs. J.
Anim. Sci. 77:3274-3280.
Shi, X. S., and J. Noblet. 1993. Contribution of the hindgut to digestion of diets in growing pigs
and adult sows: effect of diet composition. Livest. Prod. Sci. 34:237-252.
Stewart, L. L., D. Y. Kil, F. Ji, R. B. Hinson, A. D. Beaulieu, G. L. Allee, J. F. Patience, J. E.
Pettigrew, and H. H. Stein. 2013. Effects of dietary soybean hulls and wheat middlings
on body composition, nutrient and energy retention, and the net energy of diets and
ingredients fed to growing and finishing pigs. J. Anim. Sci. 91:2756-2765.
Thiex, N. J., H. Manson, S. Anderson, and J. A. Persson. 2002. Determination of crude protein in
animal feed, forage, grain, and oilseeds by using block digestion with copper catalyst and
steam distillation into boric acid: Collaborative study. J. AOAC. 85:309-317.
80
van Milgen, J., J. Noblet, S. Dubois, and J. F. Bernier. 1997. Dynamic aspects of oxygen
consumption and carbon dioxide production in swine. Br. J. Nutr. 78:397-410.
van Milgen, J., and J. Noblet. 2003. Partitioning of energy intake to heat, protein, and fat in
growing pigs. J. Anim. Sci. 81(E. Supppl. 2):E86-E93.
Whitney, M. 2005. Pros and cons of the net energy system.
http://www.extension.umn.edu/agriculture/swine/components/pubs/prosconsnetenergysys
temswine.pdf (Accessed 7 March, 2014.)
Woyengo, T. A., E. Beltranena, and R. T. Zijlstra. 2014. Non-ruminant nutrition symposium:
Controlling feed cost by including alternative ingredients into pig diets: A review. J.
Anim. Sci. 92:1293-1305.
Young, L. G., G. C. Ashton, and G. C. Smith. 1977. Estimating the energy value of some feeds
for pigs using regression equations. J. Anim. Sci. 44:765-771.
Zhang, G. F., D. W. Liu, F. L. Wang, and D. F. Li. 2014. Estimation of the net energy
requirements for maintenance in growing and finishing pigs. J. Anim. Sci. 92:7:2987-
2995.

81
TABLES
Table 3.1. Ingredient, calculated, and analyzed composition of experimental diets (as-fed basis)
Diet
Item Basal 15% Wheat bran 30% Wheat bran
Ingredients, %
Corn 79.47 67.55 55.63
Soybean meal (48% CP) 16.00 13.60 11.20
Wheat bran 0.00 15.00 30.00
Limestone 1.40 1.19 0.98
Dicalcium phosphate 1.00 0.85 0.70
L-Lys HCl 0.62 0.53 0.43
DL-Met 0.06 0.05 0.04
L-Thr 0.15 0.13 0.11
L-Trp 0.03 0.03 0.02
Salt 0.57 0.48 0.40
Vitamin-mineral premix1 0.70 0.60 0.50
Total 100.00 100.00 100.00
Calculated composition2
ME, kcal/kg 3,225 3,089 2,953
NE3, kcal/kg DM 2,927 2,750 2,647
CP, % 13.68 13.89 14.10
SID4 Lys, % 1.05 0.95 0.85
STTD5 P, % 0.28 0.32 0.36
Analyzed composition
GE, kcal/kg 3,775 3,797 3,846
DM, % 87.10 86.95 86.87
CP (N × 6.25), % 15.05 15.30 15.43
AEE6, % 2.59 2.85 2.95
Ash, % 5.10 4.72 4.87
Crude fiber, % 3.12 4.17 5.17
ADF, % 5.07 5.83 6.96
NDF, % 9.24 14.96 20.55
Insoluble dietary fiber, % 15.02 20.45 25.51
Soluble dietary fiber, % 3.95 3.61 2.11
Total dietary fiber, % 18.97 24.06 27.62
Starch, % 56.42 53.23 50.11
Indispensable AA, %
Arg 0.88 0.92 0.94
His 0.39 0.40 0.40
Ile 0.60 0.58 0.55
Leu 1.40 1.34 1.25
Lys 1.03 1.02 0.97
Met 0.27 0.29 0.27
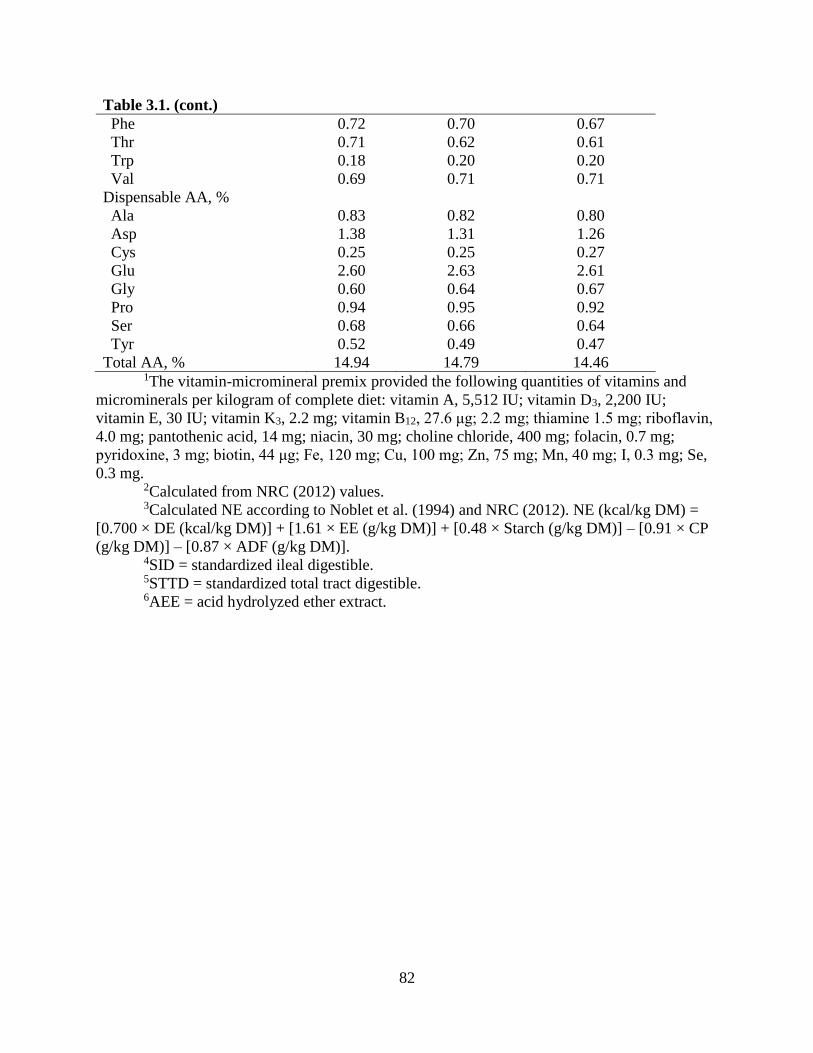
82
Table 3.1. (cont.)
Phe 0.72 0.70 0.67
Thr 0.71 0.62 0.61
Trp 0.18 0.20 0.20
Val 0.69 0.71 0.71
Dispensable AA, %
Ala 0.83 0.82 0.80
Asp 1.38 1.31 1.26
Cys 0.25 0.25 0.27
Glu 2.60 2.63 2.61
Gly 0.60 0.64 0.67
Pro 0.94 0.95 0.92
Ser 0.68 0.66 0.64
Tyr 0.52 0.49 0.47
Total AA, % 14.94 14.79 14.46 1The vitamin-micromineral premix provided the following quantities of vitamins and
microminerals per kilogram of complete diet: vitamin A, 5,512 IU; vitamin D3, 2,200 IU;
vitamin E, 30 IU; vitamin K3, 2.2 mg; vitamin B12, 27.6 μg; 2.2 mg; thiamine 1.5 mg; riboflavin,
4.0 mg; pantothenic acid, 14 mg; niacin, 30 mg; choline chloride, 400 mg; folacin, 0.7 mg;
pyridoxine, 3 mg; biotin, 44 μg; Fe, 120 mg; Cu, 100 mg; Zn, 75 mg; Mn, 40 mg; I, 0.3 mg; Se,
0.3 mg.
2Calculated from NRC (2012) values.
3Calculated NE according to Noblet et al. (1994) and NRC (2012). NE (kcal/kg DM) =
[0.700 × DE (kcal/kg DM)] + [1.61 × EE (g/kg DM)] + [0.48 × Starch (g/kg DM)] – [0.91 × CP
(g/kg DM)] – [0.87 × ADF (g/kg DM)]. 4SID = standardized ileal digestible.
5STTD = standardized total tract digestible.
6AEE = acid hydrolyzed ether extract.

83
Table 3.2. Analyzed nutrient composition of ingredients (as-fed basis)
Ingredient
Item Corn Soybean meal Wheat bran
GE, kcal/kg 3,867 4,192 3,969
DM, % 86.87 86.37 87.50
Ash, % 1.21 6.63 5.15
AEE1, % 3.78 1.76 4.09
CP (N × 6.25), % 8.05 46.89 17.28
Crude fiber, % 2.15 4.97 11.84
ADF, % 3.76 8.86 13.77
NDF, % 8.41 10.31 44.76
Insoluble dietary fiber, % 10.78 17.67 48.00
Soluble dietary fiber, % 1.71 0.91 2.90
Total dietary fiber, % 12.49 18.58 50.90
Starch, % 67.28 2.31 11.26
Fructose, % 0.22 1.12 0.75
Glucose, % 1.13 3.55 1.61
Sucrose, % 0.63 5.92 0.65
Maltose, % 0.16 0.11 0.10
Raffinose, % 0.13 1.52 1.12
Stachyose, % ND2 4.16 0.09
Verbascose, % ND 0.37 ND
Indispensable AA, %
Arg 0.35 3.46 1.16
His 0.23 1.22 0.46
Ile 0.28 2.21 0.52
Leu 0.98 3.73 1.01
Lys 0.25 2.97 0.68
Met 0.18 0.64 0.23
Phe 0.38 2.45 0.63
Thr 0.29 1.86 0.53
Trp 0.06 0.73 0.19
Val 0.38 2.28 0.78
Dispensable AA, %
Ala 0.59 2.09 0.80
Asp 0.54 5.48 1.20
Cys 0.18 0.64 0.33
Glu 1.45 8.42 2.84
Gly 0.30 2.03 0.90
Pro 0.69 2.34 0.95
Ser 0.38 2.28 0.65
Tyr 0.25 1.77 0.40
Total AA, % 7.94 46.94 14.45 1AEE = acid hydrolyzed ether extract.
2ND = not detectable.

84
Table 3.3. Energy balance and gas consumption and production by growing pigs fed
experimental diets
Diet Pooled P-value
Item Basal 15% Wheat
bran
30% Wheat
bran
SEM Linear Quadratic
Initial BW, kg 54.37 54.33 54.53 2.63 0.77 0.81
Final BW, kg 59.07 58.57 57.87 2.66 0.02 0.82
Daily feed intake, kg 1.89 1.84 1.78 0.05 0.07 0.87
Total feed intake, kg 9.43 9.19 8.90 0.28 0.20 0.93
GE intake, kcal 35,578 34,898 32,974 1,539 0.25 0.75
N intake, g 226.91 224.90 227.19 8.09 0.97 0.75
Dry feces output, kg 0.76 1.19 1.56 0.05 < 0.01 0.58
GE in feces,
kcal/kg
3,999 4,183 4,225 28.41 < 0.01 0.06
Fecal GE output,
kcal
3,035 4,957 6,599 163.12 < 0.01 0.43
N in feces, % 2.78 2.32 2.32 0.07 < 0.01 0.01
Fecal N output, g 20.92 27.55 36.17 1.20 < 0.01 0.47
DE in diet, kcal/kg 3,454 3,257 3,161 33.10 < 0.01 0.18
DE in diet, kcal/kg
DM
3,966 3,746 3,639 38.10 < 0.01 0.20
DE in diet, kcal/kg
BW0.6
306.20 290.96 282.32 8.33 < 0.01 0.53
Urine output, kg 16.63 13.22 11.53 2.23 0.05 0.66
Daily urine output,
kg
3.13 2.45 2.04 0.29 < 0.01 0.42
GE in urine,
kcal/kg
43.80 50.93 61.67 11.59 0.16 0.86
Urinary GE output,
kcal/d
128.83 116.65 135.35 22.62 0.51 0.08
ME in diet, kcal/kg 3,400 3,209 3,091 31.63 < 0.01 0.34
ME in diet, kcal/kg
DM
3,904 3,690 3,558 36.40 < 0.01 0.36
ME in diet, kcal/kg
BW0.6
302.22 285.18 276.10 8.59 < 0.01 0.52
Efficiency of ME
ME/DE 0.98 0.98 0.98 < 0.01 0.30 0.54
5 d total HP1, kcal 16,997 16,832 15,085 614.43 0.04 0.31
5 d total HP,
kcal/kg BW0.6
1,509 1,457 1,349 54.67 0.03 0.64
Daily HP, kcal 3,391 3,347 3,229 111.45 0.02 0.50
Daily HP, kcal/kg
BW0.6
300.79 297.11 287.54 5.93 0.02 0.55
HP, kcal/kg FI 1,797 1,826 1,756 40.89 0.32 0.16
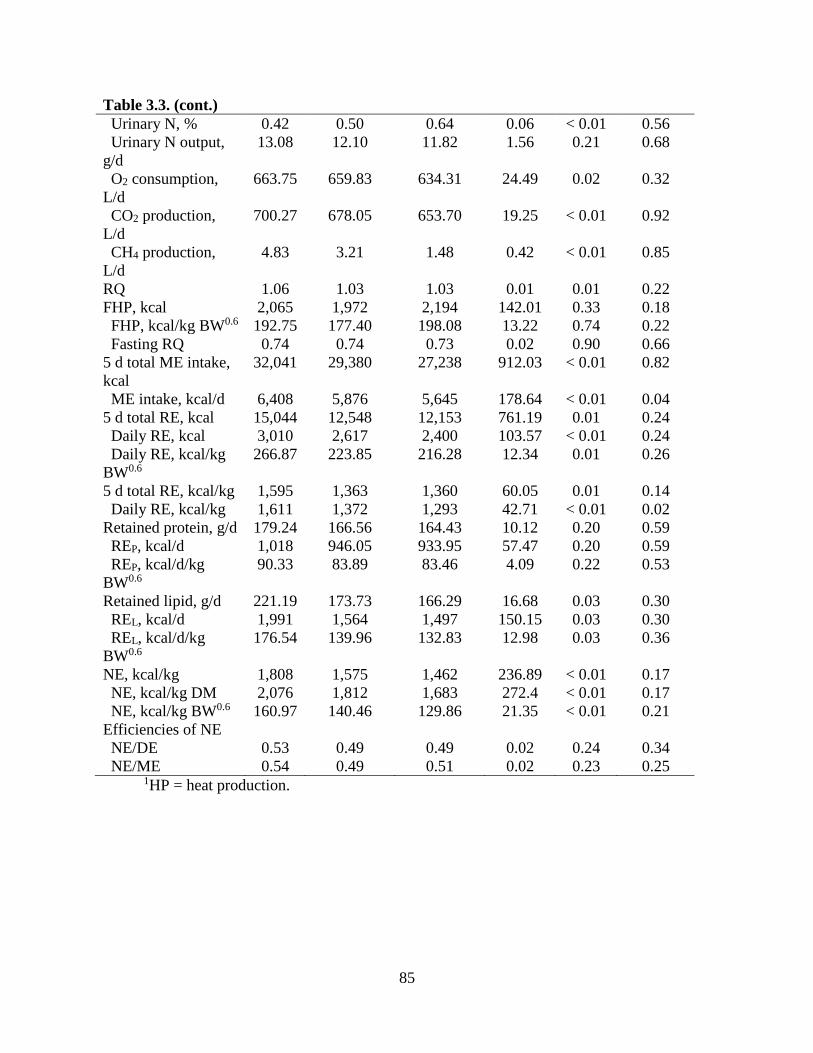
85
Table 3.3. (cont.)
Urinary N, % 0.42 0.50 0.64 0.06 < 0.01 0.56
Urinary N output,
g/d
13.08 12.10 11.82 1.56 0.21 0.68
O2 consumption,
L/d
663.75 659.83 634.31 24.49 0.02 0.32
CO2 production,
L/d
700.27 678.05 653.70 19.25 < 0.01 0.92
CH4 production,
L/d
4.83 3.21 1.48 0.42 < 0.01 0.85
RQ 1.06 1.03 1.03 0.01 0.01 0.22
FHP, kcal 2,065 1,972 2,194 142.01 0.33 0.18
FHP, kcal/kg BW0.6 192.75 177.40 198.08 13.22 0.74 0.22
Fasting RQ 0.74 0.74 0.73 0.02 0.90 0.66
5 d total ME intake,
kcal
32,041 29,380 27,238 912.03 < 0.01 0.82
ME intake, kcal/d 6,408 5,876 5,645 178.64 < 0.01 0.04
5 d total RE, kcal 15,044 12,548 12,153 761.19 0.01 0.24
Daily RE, kcal 3,010 2,617 2,400 103.57 < 0.01 0.24
Daily RE, kcal/kg
BW0.6
266.87 223.85 216.28 12.34 0.01 0.26
5 d total RE, kcal/kg 1,595 1,363 1,360 60.05 0.01 0.14
Daily RE, kcal/kg 1,611 1,372 1,293 42.71 < 0.01 0.02
Retained protein, g/d 179.24 166.56 164.43 10.12 0.20 0.59
REP, kcal/d 1,018 946.05 933.95 57.47 0.20 0.59
REP, kcal/d/kg
BW0.6
90.33 83.89 83.46 4.09 0.22 0.53
Retained lipid, g/d 221.19 173.73 166.29 16.68 0.03 0.30
REL, kcal/d 1,991 1,564 1,497 150.15 0.03 0.30
REL, kcal/d/kg
BW0.6
176.54 139.96 132.83 12.98 0.03 0.36
NE, kcal/kg 1,808 1,575 1,462 236.89 < 0.01 0.17
NE, kcal/kg DM 2,076 1,812 1,683 272.4 < 0.01 0.17
NE, kcal/kg BW0.6 160.97 140.46 129.86 21.35 < 0.01 0.21
Efficiencies of NE
NE/DE 0.53 0.49 0.49 0.02 0.24 0.34
NE/ME 0.54 0.49 0.51 0.02 0.23 0.25 1HP = heat production.

86
Table 3.4. Apparent total tract digestibility (ATTD) of nutrients and energy by growing pigs fed
experimental diets (as-fed basis)
Diet Pooled P-value
ATTD, % Basal 15% Wheat
bran
30% Wheat
bran SEM
Linear Quadratic
DM 91.74 86.09 81.62 0.60 < 0.01 0.40
CP 91.20 87.73 83.87 0.65 < 0.01 0.80
GE 91.92 85.78 81.13 0.55 < 0.01 0.25
Crude fiber 69.54 54.93 39.32 6.43 < 0.01 0.93
ADF 79.60 61.30 52.22 2.55 < 0.01 0.05
NDF 74.17 65.42 64.71 2.29 < 0.01 0.10

87
Table 3.5. Regression coefficients used for estimating DE, ME, and NE in wheat bran (as-fed basis)1
Dependent variable Prediction equation SE P-value R2 RMSE
Intercept Estimate Intercept Estimate
Dietary DE, kcal/kg 3457.7-11.725 × (wheat bran inclusion, %) 18.27 0.98 < 0.001 < 0.001 0.90 48.87
Dietary ME, kcal/kg 3389.6-11.725 × (wheat bran inclusion, %) 17.09 0.92 < 0.001 < 0.001 0.92 45.70
Dietary NE, kcal/kg 1788.1-8.273 × (wheat bran inclusion, %) 54.55 2.94 < 0.001 0.013 0.35 145.89 1Data were subjected to linear regression analysis with the percent inclusion of wheat bran as the independent variable and the
kcal/kg DE, ME, or NE of the diet as the dependent variable. The regression coefficients indicate the change in the DE, ME, or NE of
the diets for each percentage point change of wheat bran included in the diet: thus, the coefficient multiplied by 100 is equal to the DE,
ME, or NE of wheat bran.

88
Table 3.6. Energy concentration of wheat bran determined using the difference procedure or
estimated from prediction equations
Method
Item Difference
procedure1
Prediction
equations
95% Confidence
interval
As-fed basis
DE, kcal/kg 2,168 2,285 2,036 – 2,534
ME, kcal/kg 2,117 2,217 1,984 – 2,450
NE, kcal/kg 896 961 218 – 1,704
DM basis
DE, kcal/kg 2,478 2,611 2,327 – 2,896
ME, kcal/kg 2,419 2,534 2,267 – 2,800
NE, kcal/kg 1,024 1,098 249 – 1,947
1The values presented are the mean DE, ME, and NE of wheat bran calculated using the
difference procedure for the two diets containing 15 or 30% wheat bran.

89
CHAPTER 4: EFFECT OF A 3-STRAIN BACILLUS-BASED DIRECT-FED
MICROBIAL ON GROWTH PERFORMANCE AND INTESTINAL
CONCENTRATIONS OF VOLATILE FATTY ACIDS IN NURSERY PIGS FED LOW-
OR HIGH-FIBER DIETS
ABSTRACT: The effect of a Bacillus-based direct-fed microbial (DFM) on growth
performance, plasma tumor necrosis factor alpha (TNF-α), relative gene expression, and
intestinal VFA concentrations in weanling pigs fed low- or high-fiber diets was evaluated. Two
hundred pigs (initial BW: 6.31 ± 0.73 kg) were allotted to 1 of 4 dietary treatments (5 pigs per
pen and 10 pens per treatment). Treatments were arranged in a 2 × 2 factorial arrangement with 2
diet types [low-fiber (LF) or high-fiber (HF)] and 2 concentrations of DFM (0 or 60 g DFM / t of
feed). The DFM contained 1.5 × 10⁵ cfu / g and was obtained from Danisco Animal Nutrition-
DuPont Industrial Biosciences (Marlborough, UK). Phase 1 diets were fed for 2 weeks post-
weaning and phase 2 diets for the following 29 d. The LF diets contained corn and soybean meal
as main ingredients and HF diets contained corn, soybean meal, corn distillers dried grains with
solubles (7.5 and 15.0% in phase 1 and 2, respectively), and wheat middlings (10.0%). The NE
in phase 1 LF and HF diets was 2,525 and 2,463 kcal / kg, respectively, and the NE in phase 2
LF and HF diets was 2,483 and 2,414 kcal / kg, respectively. Pigs and feed were weighed at the
start and at the end of each phase, and ADG, ADFI, and G:F calculated. At the conclusion of
phase 2, blood was collected from 1 pig per pen and 1 pig per pen was sacrificed. Cecum and
rectum contents were analyzed for VFA, while tissue samples were collected from the ileum,
cecum, rectum, and liver to determine gene expression. Results indicated that feeding HF diets
resulted in a reduction (P ≤ 0.05) in ADFI and ADG of pigs compared with feeding LF diets.

90
Pigs fed DFM diets had improved (P ≤ 0.05) G:F compared with pigs fed non-DFM diets. Pigs
fed LF diets had a greater (P ≤ 0.05) BW at the end of phase 2 compared with pigs fed HF diets.
The concentration of VFA in rectum contents was greater (P ≤ 0.05) in pigs fed LF diets than
pigs fed HF diets. The expression of a VFA transporter in the rectum of pigs fed HF diets was
increased (P ≤ 0.05), while pigs fed DFM-containing diets had an increased (P ≤ 0.05)
expression of glucagon-like peptide-2 receptor in the liver. Pigs fed HF had greater (P ≤ 0.05)
PUN compared with LF fed pigs. Dietary fiber and DFM had no effect on the plasma
concentration of TNF-α. In conclusion, the Bacillus–based DFM improved overall G:F, but
contrary to our hypothesis, this was not caused by increased fermentation and subsequent VFA
yield.
Key words: dietary fiber, direct-fed microbial, growth performance, swine, volatile fatty
acids
INTRODUCTION
Direct-fed microbials (DFM), which may be more commonly known as probiotics, are
defined as “live microorganisms which, when administered in adequate amounts, confer a health
benefit on the host (FAO/WHO, 2001).” The addition of DFM to swine diets may improve gut
health by modifying the microbiota, which may enhance immune regulation, health status, and
improve pig performance (Kenny et al., 2011; Cromwell, 2013). Addition of DFM to nursery
diets may reduce diarrhea (Eigel, 1989), but improved growth performance has not been
consistently observed (Stavric and Kornegay, 1995).
Bacillus-based DFM are spore-forming bacteria, which allows them to survive high
temperatures and low pH, but when Bacillus-based DFM germinate in the intestine of the pig,
they also produce a large amount and a wide variety of fiber-degrading enzymes (Schreier, 1993;
91
Kenny et al., 2011). Therefore, the addition of a Bacillus-based DFM may enhance the
fermentation of dietary fiber in swine diets and, subsequently, increase the available dietary
energy in the form of VFA (Davis et al., 2008). A high-fiber concentration in the diet reduced
ADFI and G:F, as well as the digestibility of nutrients and energy by nursery pigs (Bindelle et
al., 2008). However, dietary fiber in nursery pig diets may act as a prebiotic and stimulate
beneficial gut microbiota and, therefore, reduce post-weaning diarrhea (Smith and Halls, 1968).
Combining DFM and dietary fiber may increase the efficacy of DFM, but data to confirm this
hypothesis has not been reported (de Lange et al., 2010). Therefore, it may be beneficial to
supplement diets containing high-fiber ingredients such as distillers dried grains with solubles
(DDGS) and wheat middlings with a Bacillus-based DFM that has the ability to secrete fiber-
degrading enzymes. The objective of this experiment, therefore, was to test the hypothesis that
addition of a Bacillus-based DFM would increase fermentation and maintain growth
performance of nursery pigs fed high-fiber diets relative to pigs fed low-fiber diets.
MATERIALS AND METHODS
The Institutional Animal Care and Use Committee at the University of Illinois reviewed
and approved the protocol for these experiments.
Animals, Diets, and Experimental Design. A total of 200 weanling pigs (initial BW:
6.31 ± 0.73 kg) that were the offspring of G-Performer boars mated to F-25 females (Genetiporc,
Alexandria, MN) were used in this experiment in 2 separate blocks of 100 pigs each. Pigs were
randomly allotted in a completely randomized design to 4 dietary treatments. There were 5 pigs
per pen and 10 replicate pens per treatment. Pigs were housed in environmentally controlled
nursery barns in 1.4 × 1.4 m pens with fully slatted floors. A feeder and a nipple drinker were
92
provided in each pen and feed and water were provided on an ad libitum basis throughout the
experiment.
Treatments were arranged in a 2 × 2 factorial arrangement with 2 diet types [low-fiber
(LF) or high-fiber (HF)] and 2 concentrations of DFM (0 or 60 g DFM / t of feed; Tables 4.1
and 4.2). The Bacillus-based DFM contained 1.5 × 10⁵ cfu / g and was obtained from Danisco
Animal Nutrition-DuPont Industrial Biosciences (Marlborough, UK). Phase 1 diets were fed for
2 weeks post-weaning and phase 2 diets for the following 29 d. The LF diets contained corn and
soybean meal as main ingredients and HF diets contained corn, soybean meal, corn DDGS (7.5
and 15.0% in phase 1 and 2, respectively) and wheat middlings (10.0%). Phase 1 diets contained
no microbial phytase, whereas phase 2 diets contained 500 units of microbial phytase (Axtra®
PHY; Danisco Animal Nutrition-DuPont Industrial Biosciences, Waukesha, WI) per kg of
complete diet. No diets contained antibiotic growth promoters. Diets were not formulated to be
isocaloric or isonitrogenous and, therefore, the HF diets contained less NE and more CP than the
LF diets. However, all diets were formulated to meet or exceed requirements for standardized
ileal digestible AA, standardized total tract digestible P, and vitamins and minerals according to
NRC (2012).
Individual pig weights were recorded at weaning and at the conclusion of each phase.
Daily allotments of feed were recorded and feed remaining in the feeder at the end of each phase
was recorded and feed intake calculated. Data were summarized and ADG, ADFI, and G:F were
calculated. The G:F also was calculated as kg gain/Mcal NE intake because LF and HF diets
were not formulated to be isocaloric.
Sample Collection. Blood samples (10 mL; 1 pig per pen) were collected from the same
pig per pen at weaning and at the conclusion of phase 1 and phase 2. Blood samples were

93
analyzed for plasma urea nitrogen (PUN) and plasma concentrations of tumor necrosis factor
alpha (TNF-α) in duplicate using a porcine sandwich ELISA kit according to the manufacturer’s
instructions (R&D Systems, Minneapolis, MN). Intra-assay CV was 5.5% for TNF-α.
At the conclusion of phase 2, 1 pig per pen was sacrificed using captive bolt penetration.
These pigs were selected as the pig that was closest to the average BW of pigs in the pen and 5
gilts and 5 barrows were sacrificed from each treatment. Ileal and cecal digesta and rectal
contents were collected. The pH of each of the samples was measured immediately after
collection using a pH meter (Accumet Basic, Fisher Scientific, Pittsburgh, PA). After the pH was
measured, cecal and rectal samples were mixed with 2N HCl in a 1:1 ratio and stored at -20°C
until analyzed for concentrations of VFA. The remaining cecal digesta and rectal contents were
stored at -20°C for further analysis.
A 5-cm tissue sample was collected from the ileum 10 cm cranial to the ileo-cecal
sphincter, from the tail of the cecum, from the rectum 10 cm cranial to the internal anal
sphincter, and from the left lateral lobe of the liver. After collection, tissue samples, with the
exception of liver tissue, were opened at the mesentery, rinsed with ice-cold PBS, snap-frozen in
liquid nitrogen, and stored at -80°C.
RNA Extraction and Quantitative Reverse Transcription-PCR. Total RNA was isolated
from 100 mg of frozen tissue samples according to the PureLink® RNA Mini Kit (Life
Technologies, Grand Island, NY) manufacturer’s instructions. Total RNA was quantified by
measuring the absorbance at 260 nm using a NanoDrop ND-1000 spectrophotometer (NanoDrop
Technologies, Wilmington, DE), and purity was assessed by determining the ratio of the
absorbance at 260 and 280 nm. All RNA samples had 260/280 nm ratios greater than 1.9 and less
than 2.1. The RNA quality was checked using a 2100 Bioanalyzer (Agilent Technologies, Santa
94
Clara, CA) and all RNA samples used for reverse transcription had an RNA integrity number
greater than 8.
Total RNA (100 ng/µl) was reverse transcribed by means of a SuperScript® III First-
Strand Synthesis SuperMix kit (Life Technologies, Grand Island, NY) to synthesize the double-
stranded cDNA. Double-stranded cDNA was diluted and used for quantitative reverse
transcription (qRT-PCR). Each 10 µL reaction consisted of 5 µL SYBR Green (Applied
Biosystems, Foster City, CA), 4 µL diluted cDNA sample, 0.4 μL of 10 μM forward and reverse
primer, and 0.2 μL DNase/RNase free water. The reactions were performed in an ABI Prism
7900 HT (Applied Biosystems, Foster City, CA) using the following conditions: 2 min at 50°C,
10 min at 95°C, 40 cycles of 15 s at 95°C, and 1 min at 60°C. An additional dissociation stage
was added to verify the presence of a single PCR product. All reactions were run in triplicate.
Data were analyzed using the 7900 HT Sequence Detection Systems Software (version 2.2.1,
Applied Biosystems, Foster City, CA).
Two internal control genes, glyceraldehyde 3-phosphate dehydrogenase (GAPDH) and
hydroxymethylbilane synthase (HMBS), were used to normalize the expression of tested genes
(Vigors et al., 2014). The tested genes included mucin 2 (MUC2), monocarboxylate transporter 1
(MCT1), basigin (CD147), phosphoenolpyruvate carboxykinase 1 (PCK1), and glucagon-like
peptide – 2 receptor (GLP-2R). Mucin 2 is responsible for the production of mucin and was
selected because previous research has indicated that high-fiber diets may increase mucin
production (de Lange et al., 1989). Monocarboxylate transporter 1 is a proton-coupled
transporter of VFA and CD147 is responsible for translocation and function of MCT1 (König et
al., 2010) and, therefore, these 2 genes were selected to aid in the explanation of intestinal
concentrations of VFA. Phosphoenolpyruvate carboxykinase 1 is the rate-controlling enzyme of
95
gluconeogenesis (Shulman and Petersen, 2012) and was selected because we hypothesized that
HF fed pigs would have less dietary glucose and, therefore, have increased gluconeogenesis.
Glucagon-like peptide - 2 receptor is a G-protein-coupled, transmembrane receptor for the
peptide glucagon-like peptide - 2, which has been indicated to control gastrointestinal growth
and function (Guan et al., 2006). Ileum, cecum, and rectum tissue were tested for mRNA
expression of MUC2, MCT1, CD147, and GLP-2R, whereas liver tissue was tested for MCT1,
CD147, GLP-2R, and PCK1. Primers used for amplification of target genes are provided in
Table 4.3. To obtain the relative gene expression, the average quantity of triplicate samples was
calculated and divided by the geometric mean of the 2 internal control genes.
Chemical Analyses. Prior to analysis, ileal and cecal digesta and rectal contents were
freeze-dried and ground through a 1-mm screen in a Wiley Mill (Model 4; Thomas Scientific,
Swedesboro, NJ). All main ingredients used in the diets and all diets, cecal, and rectal samples
were analyzed for DM (Method 930.15; AOAC Int., 2007; Table 4.4). All diets and main
ingredients were analyzed for ADF and NDF using Ankom Technology method 12 and 13,
respectively (Ankom2000 Fiber Analyzer, Ankom Technology, Macedon, NY), while insoluble
and soluble dietary fiber was analyzed according to method 991.43 (AOAC Int., 2007) using the
AnkomTDF Dietary Fiber Analyzer (Ankom Technology, Macedon, NY). Total dietary fiber was
then calculated as the sum of insoluble and soluble dietary fiber. All diets and main ingredients
also were analyzed for ash (Method 942.05; AOAC Int., 2007) and GE using bomb calorimetry
(Model 6300; Parr Instruments, Moline, IL). All cecal digesta samples and rectal samples that
were stabilized in 2N HCl were analyzed for concentrations of VFA by gas chromatography
according to Erwin et al. (1961) using a gas chromatograph (Hewlett-Packard 5890A Series II,
Palo Alto, CA) and a glass column (180 cm × 4 mm i.d.) packed with 10% SP-1200/1% H3PO4

96
on 80/100 + mesh Chomosorb WAW (Supelco Inc., Bellefonte, PA). Nitrogen was the carrier
gas with a flow rate of 75 mL/min. Oven, detector, and injector temperatures were 125, 175, and
180°C, respectively. The physicochemical characteristics of the main ingredients and diets were
determined by measuring the water binding capacity (Robertson et al., 2000; Cervantes-Pahm et
al., 2014) and bulk density (Cromwell et al., 2000; Table 4.5).
Statistical Analysis. Normality of residuals were determined by the UNIVARIATE
procedure of SAS (SAS Inst. Inc., Cary, NC). Outliers were determined using the BOXPLOT
procedure of SAS (SAS Inst. Inc., Cary, NC) and any value that deviated from the treatment
mean by 1.5 times the interquartile range was removed; 6 outliers were identified and removed.
Gene expression data were log-10 transformed to align measures to a normal distribution.
Growth performance, intestinal concentrations of VFA, and log-scale relative gene expression
data were analyzed as a 2 × 2 factorial arrangement of treatments with dietary fiber concentration
and DFM as the 2 factors and block as the random effect using the MIXED procedure of SAS
(SAS Inst. Inc., Cary, NC). An interaction between dietary fiber concentration and DFM was
observed for initial BW of pigs and, therefore, initial BW was used as a covariate for growth
performance. Relative gene expression data presented were back-transformed using antilog. The
pen was the experimental unit for the growth performance data, but the pig was the experimental
unit for the VFA and gene expression data.
A repeated measures analysis was conducted for TNF-α and PUN data and each
individual pig was considered an experimental unit (Littell et al., 1998). Appropriate covariance
structures were chosen based on the Akaike information criterion. Data were subjected to a 3-
way ANOVA that included dietary fiber concentration, DFM, and d, as well as the interactions
among these factors using PROC MIXED. Block was considered the random effect. The SLICE

97
option of PROC MIXED was used to evaluate the main effects and interaction of dietary fiber
concentration and DFM at each d. For all outcomes, a P-value ≤ 0.05 was used to determine
significance among dietary treatments and a P-value > 0.05, but < 0.10 was considered a
tendency.
RESULTS
Ingredient and Diet Analysis
Phase 1 LF diets contained 1.3 and 10.1% soluble and insoluble dietary fiber,
respectively, and phase 1 HF diets contained 0.4 and 15.1% soluble and insoluble dietary fiber,
respectively. Phase 2 LF diets contained 0.5 and 13.5% soluble and insoluble dietary fiber,
respectively, and phase 2 HF diets contained 3.0 and 17.0% soluble and insoluble dietary fiber,
respectively. Corn, soybean meal, DDGS, and wheat middlings contained 0.6, 1.4, 1.9, and 6.3%
soluble dietary fiber, respectively, and 12.1, 15.0, 29.0, and 37.1% insoluble dietary fiber,
respectively (Table 4.4). The water binding capacity was 0.97, 2.69, 1.74, and 3.11 g/g for corn,
soybean meal, DDGS, and wheat middlings, respectively, and the bulk density was 683.0, 807.3,
601.0, and 363.7 g/L, respectively (Table 4.5). The water binding capacity was 0.99 and 1.23 g/g
and the bulk density was 757.5 and 689.4 g/L in phase 1 LF and HF diets, respectively. The
water binding capacity was 1.20 and 1.34 g/g and the bulk density was 759.3 and 681.9 g/L in
phase 2 LF and HF diets, respectively.
Growth Response
Initial BW was greater (P ≤ 0.05) for pigs fed diets without DFM and an interaction (P ≤
0.05) was observed between dietary fiber and DFM (Table 4.6). Phase 1 ADG and BW at the
conclusion of phase 1 were not affected by dietary fiber concentration or DFM. Phase 1 ADFI
98
was greater (P ≤ 0.05) for pigs fed LF diets compared with pigs fed HF diets. Pigs fed diets
containing DFM had a greater (P ≤ 0.05) G:F in phase 1 compared with pigs fed diets without
DFM. During phase 2, ADFI and G:F of pigs were unaffected by dietary fiber concentration or
DFM, but ADG and BW of pigs fed LF diets was greater (P ≤ 0.05) compared with pigs fed HF
diets. Overall, pigs fed LF diets had a greater (P ≤ 0.05) ADG, ADFI, and final BW compared
with pigs fed HF diets and pigs fed diets containing DFM had a greater (P ≤ 0.05) G:F than pigs
fed no DFM.
Intestinal Concentrations of VFA and pH
The pH of ileal digesta was not affected by dietary fiber concentration or DFM, but cecal
digesta pH tended to be greater (P < 0.10) in pigs fed LF diets compared with pigs fed HF diets
(Table 4.7). Rectal content pH tended to be greater (P < 0.10) in pigs fed HF diets compared
with pigs fed LF diets. The concentrations of all VFA in cecal digesta were not affected by
dietary fiber concentration or DFM. The concentrations of acetate, propionate, and isovalerate
were greater (P ≤ 0.05) and the concentration of isobutyrate tended to be greater (P < 0.10) in
rectal contents of pigs fed LF diets compared with pigs fed HF diets. Total short-chain fatty acid
concentration in rectal contents of pigs fed LF diets was greater (P ≤ 0.05) compared with pigs
fed HF diets and the concentration of total branched-chain fatty acids tended to be greater (P <
0.10) in the rectal contents of pigs fed LF diets.
TNF-α and PUN
No effects of dietary fiber concentration or DFM addition on plasma concentrations of
TNF-α were observed (Table 4.8). However, the effect of d impacted the concentration of TNF-α
in that on d 0, the concentration of TNF-α was the lowest (P ≤ 0.05) and on d 14 greatest (P ≤
0.05), while the concentration of TNF-α on d 43 was between d 0 and d 14 concentrations of

99
TNF-α. The PUN of pigs fed DFM-containing diets was less (P ≤ 0.05) on d 0 compared with
pigs fed diets without DFM. Also on d 0, a tendency for an interaction between dietary fiber
concentration and DFM was observed (P < 0.10) because HF-fed pigs tended to have a reduced
(P < 0.10) PUN compared with LF-fed pigs. On d 14, the PUN was not different among pigs fed
experimental diets. The HF diets increased (P ≤ 0.05) PUN of pigs on d 43, but an interaction (P
≤ 0.05) between dietary fiber concentration and DFM also was observed on d 43 because DFM
addition to LF diets increased PUN of pigs, whereas DFM addition to HF diets decreased PUN.
Finally, as the experiment progressed from d 0, 14, and d 43, the PUN of pigs increased over
time (P ≤ 0.05).
Gene Expression
The expression of internal control genes were confirmed to be unaffected by dietary
treatment. The expression of MCT1 was decreased (P ≤ 0.05) in the ileum of pigs due to DFM
addition to the diets (Table 4.9). The expression of tested genes from cecum tissue was not
affected by dietary fiber concentration or DFM addition. Pigs fed HF diets had increased (P ≤
0.05) MCT1 expression in the rectum. Pigs fed DFM-containing diets had increased (P ≤ 0.05)
CD147 and GLP-2R expression and tended to have increased (P < 0.10) MCT1 expression in the
liver.
DISCUSSION
Results of previous research indicated that nursery pig growth performance is not reduced
if 7.5 and 15% DDGS is included in phase 1 and 2 diets, respectively (Spencer et al., 2007).
Likewise, inclusion of 20% DDGS in diets of nursery pigs may not impact pig growth
performance, but wheat middlings included at 0, 5, 10, 15, or 20% in a corn-soybean meal

100
nursery diet linearly reduced ADFI and ADG (De Jong et al., 2014). It is, therefore, likely that
the inclusion of wheat middlings in the diets used in this experiment resulted in the reduction in
ADG observed for the pigs fed the HF diets.
Jaworski et al. (2014b) reported increased water binding capacity and decreased bulk
density as inclusion of 0, 5, 10, or 15% copra meal, palm kernel meal, or palm kernel expellers
was included in nursery pig diets, and similar results were observed in the current experiment
when DDGS and wheat middlings were added to diets. A decrease in nursery pig ADFI and
ADG was observed as water binding capacity increased and bulk density decreased in diets, and
this is in agreement with Jaworski et al. (2014b). Together, these results indicate that nursery
pigs may not be able to overcome the gut fill effect attributed to HF diets, particularly those that
result in a greater water binding capacity and decreased bulk density.
Addition of a Bacillus-based DFM to a corn-soybean meal diet fed to growing-finishing
pigs may improve ADG (Davis et al., 2008). It has also been reported that addition of 8%
soybean hulls or 8% peanut hulls to a corn-soybean meal diet fed to weanling pigs reduced G:F,
but when a yeast culture DFM was added to those diets, G:F was maintained compared with a
corn-soybean meal control diet (Kornegay et al., 1995). The observation that addition of a
Bacillus-based DFM to LF and HF diets in this experiment improved overall G:F of nursery pigs
is in agreement with data of Kornegay et al. (1995) and Davis et al. (2008). However, in a review
of the literature, Pollmann (1986) reported that addition of Bacillus-based DFM to nursery pig
diets did not consistently improve growth performance, whereas a more recent review indicated
that DFM addition to swine diets was beneficial in 30 of 31 research trials (Kremer, 2006). The
inconsistencies reported in the literature regarding Bacillus-based DFM added to nursery pig
diets may be a result of differences in ingredient composition of diets or health status of pigs, but
101
it is also possible that improvements have been made in the development and implementation of
DFM. Finally, inconsistency in a DFM response also may arise from differences in the
functionality of the strains being assessed and whether single strains are being compared to a
combination of strains. Therefore, it is possible that the Bacillus-based DFM used in this
experiment may have been more efficient in terms of stimulating microbial enzyme synthesis
compared with the DFM used in previous experiments.
Bacillus-based DFM may secrete enzymes capable of degrading DM in swine manure
(Schreier, 1993; Davis et al., 2008). Swine manure DM is mostly composed of dietary fiber due
to the indigestible nature of dietary fiber fed to pigs. Therefore, we hypothesized that a Bacillus-
based DFM added to swine diets may be capable of fermenting dietary fiber, which may increase
the amount of energy available to the pig in the form of VFA. It was expected that DFM would
increase dietary fiber fermentation, resulting in a lower pH and greater VFA concentration in
cecal and rectal contents of pigs fed diets containing DFM. Supplementation of diets of feedlot
cattle and horses with DFM has been unsuccessful in increasing dietary fiber fermentation
(Beauchemin et al., 2003; Swyers et al., 2008), but shifted fermentation and microbial
populations in the rumen of feedlot steers from lactate to acetate production, aiding in the
prevention of acidosis (Ghorbani et al., 2002). Addition of a Bacillus-based DFM to growing pig
diets containing multiple sources of dietary fiber increased the concentration of VFA in the feces
and, therefore, enhanced fermentation and available ME, which resulted in increased ADG and
G:F (Jaworski et al., 2014a). However, in the current experiment, DFM had no effect on pH or
VFA concentrations in ileal, cecal, or rectal contents.
Also, contradictory to our hypothesis, the concentrations of acetate, propionate,
isovalerate, total short-chain fatty acids, and total branched-chain fatty acids in rectal contents of
102
pigs fed LF diets were greater compared with HF diets. Three reasons may explain this
difference, but none of them have been experimentally verified: 1) increased dietary fiber results
in increased rate of digesta passage, which decreased the amount of time the microbes have to
ferment dietary fiber (Chesson, 2006); 2) absorption of VFA was decreased in LF fed pigs
compared with HF fed pigs because of a lack of VFA transporters; and 3) dietary fiber present in
corn and soybean meal are more fermentable compared with dietary fiber present in DDGS and
wheat middlings. Along these lines, the substrate concentration after the terminal ileum in LF fed
pigs is expected to be much less, enabling microbes greater access to a comparatively lesser
amount of dietary fiber than HF fed pigs. This is due to the lower apparent ileal digestibility of
DM in diets containing a greater concentration of dietary fiber.
Jørgensen et al. (1997) infused VFA into the cecum of growing pigs and less than 1% of
the infused VFA were excreted in the feces and this observation contrasts the second reason
listed above. Therefore, it appears that VFA absorption is quite efficient (Barcroft et al., 1944).
Also, the expression of the VFA transporter MCT1 in the rectum of HF-fed pigs was greater
compared with LF-fed pigs, which is in contrast with the concentrations of VFA in the rectum of
pigs. These results indicate that the increased VFA concentration in rectal contents of LF-fed
pigs did not correspond with an increase in MCT1 expression. Metzler-Zebeli et al. (2012)
determined that MCT1 expression in the cecum and colon of weaned pigs was positively
correlated with butyrate concentration (R = 0.99; P < 0.001) and propionate concentration (R =
0.84; P < 0.001), respectively. Butyrate concentration in cecal digesta of pigs was not different
due to dietary treatments; therefore, MCT1 expression in the cecum was not affected by dietary
treatments in the current study.

103
On the other hand, lower VFA concentrations in rectum contents of HF-fed pigs may be
due to greater VFA absorption because HF fed pigs had increased relative gene expression of
MCT1 in rectum tissue. However, it has been indicated that CD147 is required for MCT1
translocation to the plasma membrane as well as for MCT1 transporter function and, in the
current experiment, CD147 expression in the rectum was unaffected by dietary fiber
concentration (Kirk et al., 2000; Wilson et al., 2005). Taking all of this information into account,
further research is warranted on VFA production, absorption, and utilization by pigs. The VFA
molar proportions in cecal and rectal contents observed in this experiment are in agreement with
the VFA molar proportion (i. e., 65:25:10, acetate:propionate:butyrate) usually observed in pigs
(Robertson, 2007).
The third reason listed above is in agreement with previous research that indicates the in
vitro total tract digestibility of non-starch polysaccharides in corn is greater than in DDGS and
wheat middlings (Jaworski et al., 2015). On the other hand, Urriola et al. (2010) determined the
apparent total tract digestibility (ATTD) of total dietary fiber by growing pigs to be 23.1% in
corn, but 44.5% in corn DDGS. Yet, Lowell et al. (2015) reported that the ATTD of NDF by
growing pigs was 72.94% in a corn-soybean meal diet, 50.58% in a corn-corn DDGS diet, and
62.51% in a corn-wheat middlings diet. The difference between Urriola et al. (2010) and Lowell
et al. (2015) is not only that Urriola et al. (2010) determined the ATTD of total dietary fiber, but
also the test ingredient was the sole source of total dietary fiber in the diet, whereas Lowell et al.
(2015) determined the ATTD of NDF by growing pigs fed a mixture of corn and soybean meal.
This digestibility was much greater than the other mixtures of corn and co-product, indicating
that the dietary fiber present in a corn and soybean meal diet, such as the LF diet fed in the
current study, may be more fermentable, which would lead to greater VFA concentrations in the
104
rectal contents of pigs, which was observed in the current experiment. Therefore, it is concluded
that a LF corn-soybean meal diet is more fermentable on a µmol/g basis compared with a HF
diet.
The fact that nursery pig G:F, expressed as kg/Mcal NE, was not different between pigs
fed LF or HF diets is quite remarkable, indicating that nursery pigs are just as efficient
converting dietary NE from LF or HF diets to BW gain, but cannot overcome the gut fill effect
associated with HF diets and, therefore, nursery pig ADFI is reduced, thus, ADG is reduced.
Interestingly, nursery pig overall G:F, expressed as kg/Mcal NE, was improved 1.45 and 5.07%
in LF and HF diets, respectively, due to DFM addition. Therefore, the addition of the 3-strain
Bacillus-based DFM to LF and HF diets fed to nursery pigs increased the amount of energy the
pigs received from the diets or decreased the pigs’ maintenance energy requirement.
Unfortunately, the increased available energy from the diet was not attributed to increased
hindgut fermentation associated with an increased VFA concentration in cecal digesta or rectal
contents of pigs fed DFM-containing diets and, therefore, our hypothesis was incorrect and we
are unable to experimentally verify if the DFM increased the amount of energy the pigs received
from the diets.
The addition of DFM to diets fed to nursery pigs may reduce the maintenance energy
requirement of the pig by multiple modes of action such as reduced immune stress, reduced
endogenous secretions, and improved gastrointestinal integrity. The plasma concentration of
TNF-α was not different in nursery pigs fed experimental diets; therefore, it is concluded that pig
pro-inflammatory immune cell regulation at the systemic level was not affected by DFM
addition and was not the cause for the reduced maintenance energy requirement (Elsasser et al.,
2008). However, changes in pro-inflammatory immune response are possible at the mucosal

105
level, but this was not experimentally verified in the current experiment and, therefore, it cannot
be ruled out that pig pro-inflammatory immune cell regulation was not affected by DFM
addition.
The expression of GLP-2R in the liver of nursery pigs fed DFM-containing diets was
increased, indicating that the presence of GLP-2 was increased in the liver as well (Connor et al.,
2015). Glucagon-like peptide-2 increased expression of maltase-glucoamylase and sucrose-
isomaltase digestive enzymes (Petersen et al., 2001, 2002), decreased gastric emptying, gastric
acid secretion, and gut motility (Wøjdemann et al., 1999; Guan et al., 2012), and increased
intestinal cell proliferation and reduced apoptosis in weanling pigs (Burrin et al., 2005, 2007). It
may, therefore, be speculated that the greater GLP-2R expression in the liver was a result of
increased GLP-2 being synthesized, and therefore, the improved G:F of pigs fed the DFM diets
could partly be a result of a reduced maintenance energy requirement due to reduced gastric
emptying, reduced gastric acid secretions, and less gut motility. However, this hypothesis needs
to be experimentally verified.
CONCLUSION
Inclusion of 7.5 and 15% DDGS in phase 1 and 2 nursery diets, respectively, and 10%
wheat middlings decreased phase 1 ADFI and overall ADG and ADFI, resulting in a decreased
BW at the conclusion of phase 2. However, G:F was unaffected by dietary fiber concentration,
indicating that nursery pigs are just as efficient converting dietary NE from LF or HF diets to
BW gain. However, they cannot overcome the gut fill effect associated with HF diets and,
therefore, nursery pig ADFI was reduced and, thus, ADG was reduced. Addition of a 3-strain
Bacillus-based DFM to LF or HF diets improved overall G:F but had no effect on VFA
106
concentration in cecum or rectal contents. Pigs fed LF diets had greater concentrations of VFA in
rectal contents of pigs compared with pigs fed HF diets. Therefore, it is concluded that a
Bacillus-based DFM may be added to LF or HF nursery diets to increase G:F; however, G:F
appears not to have been increased due to increased fermentation and more available energy in
the form of VFA. However, it is concluded that the Bacillus-based DFM used in this experiment
was effective in increasing energy utilization of diets, which may have been a result of increased
synthesis of GLP-2 because the relative expression of GLP-2R in the liver increased in pigs fed
diets fortified with DFM. Further research is necessary to relate fermentation of dietary fiber to
cecal and large bowel VFA production, absorption, and utilization by pigs, and to quantify the
role DFM may play in stimulating GLP-2 secretion aiding in enhanced gastrointestinal health,
thereby decreasing the maintenance energy requirement.

107
LITERATURE CITED
AOAC International. 2007. Official Methods of Analysis of AOAC Int. 18th ed. Rev. 2. W.
Hortwitz and G. W. Latimer Jr., ed. AOAC Int., Gaithersburg, MD.
Barcroft, J., R. A. McAnally, and A. T. Phillipson. 1944. Absorption of VFA from the
alimentary tract of the sheep and other animals. J. Exp. Biol. 20:120-132.
Beauchemin, K. A., W. Z. Yang, D. P. Morgavi, G. R. Ghorbani, W. Kautz, and J. A. Z. Leedle.
2003. Effects of bacterial direct-fed microbials and yeast on site and extent of digestion,
blood chemistry, and subclinical ruminal acidosis in feedlot cattle. J. Anim. Sci. 81:1628-
1640.
Bindelle, J., P. Leterme, and, A. Buldgen. 2008. Nutritional and environmental consequences of
dietary fibre in pig nutrition: a review. Biotechnol. Agron. Soc. Environ. 12:69-80.
Burrin, D. G., B. Stoll, X. Guan, L. Cui, X. Chang, and D. Hadsell. 2007. GLP-2 rapidly
activates divergent intracellular signaling pathways involved in intestinal cell survival
and proliferation in neonatal piglets. Am. J. Physiol. Endocrinol. Metab. 292:E28-E291.
Burrin, D. G., B. Stoll, X. Guan, L. Cui, X. Chang, and J. J. Holst. 2005. Glucagon-like peptide 2
dose-dependently activates intestinal cell survival and proliferation in neonatal piglets.
Endocrinology 146:22-32.
Connor, E. E., C. M. Evock-Clover, M. P. Walker, T. H. Elsasser, and S. Kahl. 2015.
Comparative Gut Physiology Symposium: Comparative physiology of glucagon-like
peptide-2: Implications and applications for production and health of ruminants. J. Anim.
Sci. 93:492-502.

108
Cromwell, G. L., T. R. Cline, J. D. Crenshaw, T. D. Crenshaw, R. A. Easter, R. C. Ewan, C. R.
Hamilton, G. M. Hill, A. J. Lewis, D. C. Mahan, J. L. Nelssen, J. E. Pettigrew, T. L.
Veum, and J. T. Yen. 2000. Variability among sources and laboratories in analyses of
wheat middlings. J. Anim. Sci. 78:2652-2658.
Cromwell, G. L. 2013. Feed additives in swine diets. In: L. I. Chiba, ed., Sustainable Swine
Nutrition. 1st ed. John Wiley & Sons, Inc., Ames, IA. p. 302-304.
Davis, M. E., T. Parrott, D. C. Brown, B. Z. de Rodas, Z. B. Johnson, C. V. Maxwell, and T.
Rehberger. 2008. Effect of a Bacillus-based direct-fed microbial feed supplement on
growth performance and pen cleaning characteristics of growing-finishing pigs. J. Anim.
Sci. 86:1459-1467.
De Jong, J. A., J. M. DeRouchey, M. D. Tokach, S. S. Dritz, and R. D. Goodband. 2014. Effects
of dietary wheat middlings, corn dried distillers grains with solubles, and net energy
formulation on nursery pig performance. J. Anim. Sci. 92:3471-3481.
de Lange, C. F. M., J. Pluske, J. Gong, and C. M. Nyachoti. 2010. Strategic use of feed
ingredients and feed additives to stimulate gut health and development in young pigs.
Livestock Sci. 134:124-134.
de Lange, C. F. M., W. C. Sauer, R. Mosenthin and W. B. Souffrant. 1989. The effect of feeding
different protein-free diets on the recovery and amino acid composition of endogenous
protein collected from the distal ileum and feces in pigs. J. Anim. Sci. 67:746-754.
Eigel, W. N. 1989. Ability of probiotics to protect weanling pigs against challenge with
enterotoxigenic E. coli. In: Proc. Chr. Hansen Biosystems Tech. Conf. San Antonio, TX.
p.10-19.

109
Elsasser, T. H., T. J. Caperna, C-J. Li, S. Kahl, and J. L. Sartin. 2008. Critical control points in
the impact of the proinflammatory immune response on growth and metabolism. J. Anim.
Sci. 86(E. Suppl.):E105-E125.
Erwin, E. A., G. J. Marco, and E. M. Emery. 1961. Volatile fatty acid analyses of blood and
rumen fluid by gas chromatography. J. Dairy Sci. 44:1768-1771.
FAO/WHO (Food and Agriculture Organization/World Health Organization). 2001. Health and
nutritional properties of probiotics in food including powder milk with live lactic acid
bacteria. Report of a Joint FAO/WHO Expert Consultation on Evaluation of Health and
Nutritional Properties of Probiotics in Food Including Powder Milk with Live Lactic
Acid Bacteria. Córdoba, Argentina. p.1-33.
Ghorbani, G. R., D. P. Morgavi, K. A. Beauchemin, and J. A. Z. Leedle. 2002. Effects of
bacterial direct-fed microbials on ruminal fermentation, blood variables, and the
microbial populations of feedlot cattle. J. Anim. Sci. 80:1977-1986.
Guan, X., H. E. Karpen, J. Stephens, J. T. Bukowski, S. Niu, G. Zhang, B. Stoll, M. J. Finegold,
J. J. Holst, D. L. Hadsell, B. L. Nichols, and D. G. Burrin. 2006. GLP-2 receptor localizes
to enteric neurons and endocrine cells expressing vasoactive peptides and mediates
increased blood flow. Gastroenterol. 130:150-164.
Guan, X., X. Shi, X. Li, B. Chang, Y. Wang, D. Li, and L. Chan. 2012. GLP-2 receptor in
POMC neurons suppresses feeding behavior and gastric motility. Am. J. Physiol.
Endocrinol. Metab. 303:E853-E864.

110
Jaworski, N. W., A. Owusu-Asiedu, A. A. Awati, and H. H. Stein. 2014a. Effect of Bacillus spp.
direct-fed microbials on fecal VFA concentrations, growth performance, and carcass
characteristics of growing-finishing pigs. J. Anim. Sci. 92(Suppl. 2):56 (Abstr.).
Jaworski, N. W., J. Shoulders, J. C. González-Vega, and H. H. Stein. 2014b. Effects of using
copra meal, palm kernel expellers, or palm kernel meal in diets for weanling pigs. Prof.
Anim. Sci. 30:243-251.
Jaworski, N. W., H. N. Lærke, K. E. Bach Knudsen, and H. H. Stein. 2015. Carbohydrate
composition and in vitro digestibility of dry matter and nonstarch polysaccharides in
corn, sorghum, and wheat and coproducts from these grains. J. Anim. Sci. 93:1103-1113.
Jørgensen, H., T. Larsen, X. Q. Zhao, and B. O. Eggum. 1997. The energy value of short-chain
fatty acids infused into the cecum of pigs. Br. J. Nutr. 77:745-756.
Kenny, M., H. Smidt, E. Mengheri, and B. Miller. 2011. Probiotics – do they have a role in the
pig industry? Animal 5:462-470.
Kirk, P., M. C. Wilson, C. Heddle, M. H. Brown, A. N. Barclay, and A. P. Halestrap. 2000.
CD147 is tightly associated with lactate transporters MCT1 and MCT4 and facilitates
their cell surface expression. Embo J. 19:3896-3904.
König, B., S. Fischer, S. Schlotte, G. Wen, K. Eder, and G. I. Stangl. 2010. Monocarboxylate
transporter 1 and CD147 are up-regulated by natural and synthetic peroxisome
proliferator-activated receptor α agonists in livers of rodents and pigs. Mol. Nutr. Food
Res. 54:1248-1256.

111
Leonard, S. G., T. Sweeney, B. Bahar, B. P. Lynch, and J. V. O’Doherty. 2011. Effects of dietary
seaweed extract supplementation in sows and post-weaned pigs on performance,
intestinal morphology, intestinal microflora and immune status. Br. J. Nutr. 106:688-699.
Lowell, J. E., Y. Liu, and H. H. Stein. 2015. Comparative digestibility of energy and nutrients in
diets fed to sows and growing pigs. Arch. Anim. Nutr. 69:79-97.
Metzler-Zebeli, B. U., M. G. Gänzle, R. Mosenthin, and R. T. Zijlstra. 2012. Oat β-glucan and
dietary calcium and phosphorus differentially modify intestinal expression of
proinflammatory cytokines and monocarboxylate transporter 1 and cecal morphology in
weaned pigs. J. Nutr. 142:668-674.
NRC. 2012. Nutrient requirements of swine. 11th rev. ed. Natl. Acad. Press, Washington, DC.
Petersen, Y. M., D. G. Burrin, and P. T. Sangild. 2001. GLP-2 has differential effects on small
intestine growth and function in fetal and neonatal pigs. Am. J. Physiol. Regul. Integr.
Comp. Physiol. 281:R1986-R1993.
Petersen, Y. M., J. Elnif, M. Schmidt, and P. T. Sangild. 2002. Glucagon-like peptide 2 enhances
maltase-glucoamylase and sucrase-isomaltase gene expression and activity in parenterally
fed premature neonatal piglets. Pediatr. Res. 52:498-503.
Qu, H., S. S. Donkin, and K. M. Ajuwon. 2015. Heat stress enhances adipogenic differentiation
of subcutaneous fat depot-derived porcine stromovascular cells. J. Anim. Sci. 93:3832-
3842.
Robertson, M. D. 2007. Metabolic cross talk between the colon and the periphery: Implications
for insulin sensitivity. Proc. Nutr. Soc. 66:351-361.

112
Robertson, J. A., F. D. de Monredon, P. Dysseler, F. Guillon, R. Amado, and J. Thibault. 2000.
Hydration properties of dietary fibre and resistant starch: a European collaborative study.
Lebensm.-Wiss. u.-Technol. 33:72-79.
Schreier, H. J. 1993. Biosynthesis of glutamine and glutamate and the assimilation of ammonia.
In: A. L. Sonenshein, J. A. Hoch, and R. Losick, eds. Bacillus subtilis and Other Gram-
Positive Bacteria. Am. Soc. Microbiol., Washington, DC. p. 281-285.
Shulman, G. I., and K. F. Petersen. 2012. Metabolism. Updated 2nd edition. In: W. F. Boron and
E. L. Boulpaep, editors, Medical Physiology: A Cellular and Molecular Approach.
Saunders Elsevier Inc., Philadelphia, PA. p. 1218-1220.
Smith, H. W., and S. Halls. 1968. The production of oedema disease and diarrhoea in weaned
pigs by the oral administration of Escherichia coli: factors that influence the course of the
experimental disease. Med. Microb. 1:45-59.
Spencer, J. D., G. I. Petersen, A. M. Gaines, and N. R. Augsburger. 2007. Evaluation of different
strategies for supplementing distillers dried grains with solubles (DDGS) to nursery pig
diets. J. Anim. Sci. 85(Suppl. 2):96-97. (Abstr.).
Swyers, K. L., A. O. Burk, T. G. Hartsock, E. M. Ungerfeld, and J. L. Shelton. 2008. Effects of
direct-fed microbial supplementation on digestibility and fermentation end products in
horses fed low- and high-starch concentrates. J. Anim. Sci. 86:2596-2608.
Urriola, P. E., G. C. Shurson, and H. H. Stein. 2010. Digestibility of dietary fiber in distillers
coproducts fed to growing pigs. J. Anim. Sci. 88:2373-2381.
Vigors, S., T. Sweeney, C. J. O’Shea, J. A. Browne, and J. V. O’Doherty. 2014. Improvements
in growth performance, bone mineral status and nutrient digestibility in pigs following

113
the dietary inclusion of phytase are accompanied by modifications in intestinal nutrient
transporter gene expression. Br. J. Nutr. 112:688-697.
Wilson, M. C., D. Meredith, J. E. Fox, C. Manoharan, A. J. Davies, and A. P. Halestrap. 2005.
Basigin (CD147) is the target for organomercurial inhibition of monocarboxylate
transporter isoforms 1 and 4: the ancillary protein for the insensitive MCT2 is EMBIGIN
(gp70). J. Biol. Chem. 280:27213-27221.
Wøjdemann, M., A. Wettergren, B. Hartmann, L. Hilsted, and J. J. Holst. 1999. Inhibition of
sham feeding-stimulated human gastric acid secretion by glucagon-like peptide-2. J. Clin.
Endocrinol. Metab. 84:2513-2517.

114
TABLES
Table 4.1. Ingredient, calculated, and analyzed composition of phase 1 diets (as-fed basis)
Dietary fiber concentration Low High
Direct-fed microbial - + - +
Ingredient, %
Corn 51.44 51.38 37.09 37.03
Soybean meal, 48% CP 20.00 20.00 17.00 17.00
Whey, dried 15.00 15.00 15.00 15.00
DDGS1 - - 7.50 7.50
Wheat middlings - - 10.00 10.00
Fish meal 5.00 5.00 5.00 5.00
Blood plasma 4.00 4.00 4.00 4.00
Soybean oil 2.00 2.00 2.00 2.00
Limestone 1.00 1.00 1.25 1.25
Dicalcium phosphate 0.40 0.40 - -
L-Lys HCl 0.30 0.30 0.33 0.33
DL-Met 0.10 0.10 0.08 0.08
L-Thr 0.06 0.06 0.05 0.05
Salt 0.40 0.40 0.40 0.40
Vitamin-mineral premix2 0.30 0.30 0.30 0.30
DFM mixture3 - 0.06 - 0.06
Calculated composition4
NE, kcal/kg 2,525 2,525 2,463 2,463
CP, % 21.80 21.80 22.81 22.81
SID5 Lys, % 1.43 1.43 1.43 1.43
Ca, % 0.85 0.85 0.85 0.85
STTD6 P, % 0.46 0.46 0.46 0.46
Analyzed composition
GE, kcal/kg 3,986 3,947 4,067 4,103
DM, % 87.1 87.1 86.7 86.2
Ash, % 6.3 5.6 6.0 6.0
ADF, % 4.3 4.5 5.5 4.5
NDF, % 7.1 8.7 12.6 12.3
Insoluble dietary fiber, % 9.5 10.7 15.4 14.7
Soluble dietary fiber, % 1.1 1.4 0.2 0.6
Total dietary fiber, % 10.6 12.1 15.6 15.3 1DDGS = distillers dried grains with solubles. 2Provided the following quantities of vitamins and micro-minerals per kilogram of complete diet: vitamin A as retinyl acetate, 11,136
IU; vitamin D3 as cholecalciferol, 2,208 IU; vitamin E as DL-alpha tocopheryl acetate, 66 IU; vitamin K as menadione dimethylprimidinol bisulfite, 1.42 mg; thiamin as thiamine mononitrate, 0.24 mg; riboflavin, 6.59 mg; pyridoxine as pyridoxine hydrochloride,0.24 mg; vitamin B12,
0.03 mg; D-pantothenic acid as D-calcium pantothenate, 23.5 mg; niacin, 44.1 mg; folic acid, 1.59 mg; biotin, 0.44 mg; Cu, 20 mg as copper
sulfate and copper chloride; Fe, 126 mg as ferrous sulfate; I, 1.26 mg as ethylenediamine dihydriodide; Mn, 60.2 mg as manganese sulfate; Se, 0.3 mg as sodium selenite and selenium yeast; and Zn, 125.1 mg as zinc sulfate.
3DFM = direct-fed microbial mixture consists of 30 g of DFM mixed with 270 g of corn. 4Calculated from NRC (2012) values. 5SID = standardized ileal digestible. 6STTD = standardized total tract digestible.
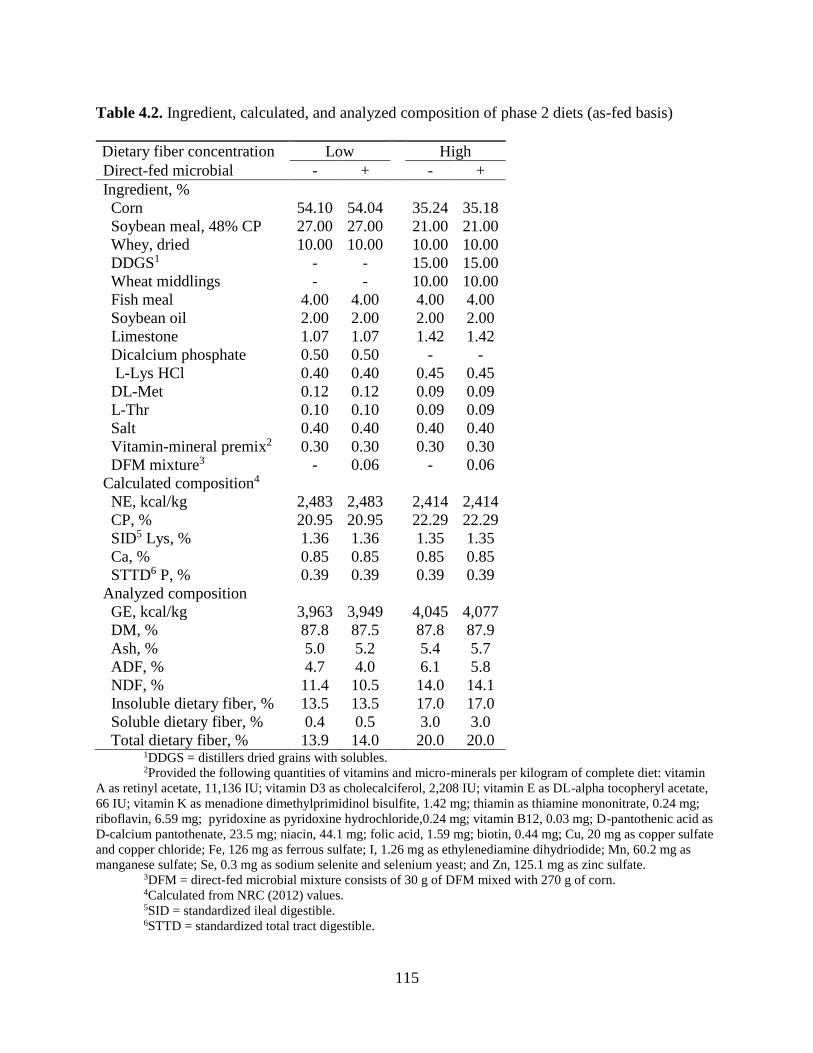
115
Table 4.2. Ingredient, calculated, and analyzed composition of phase 2 diets (as-fed basis)
Dietary fiber concentration Low High
Direct-fed microbial - + - +
Ingredient, %
Corn 54.10 54.04 35.24 35.18
Soybean meal, 48% CP 27.00 27.00 21.00 21.00
Whey, dried 10.00 10.00 10.00 10.00
DDGS1 - - 15.00 15.00
Wheat middlings - - 10.00 10.00
Fish meal 4.00 4.00 4.00 4.00
Soybean oil 2.00 2.00 2.00 2.00
Limestone 1.07 1.07 1.42 1.42
Dicalcium phosphate 0.50 0.50 - -
L-Lys HCl 0.40 0.40 0.45 0.45
DL-Met 0.12 0.12 0.09 0.09
L-Thr 0.10 0.10 0.09 0.09
Salt 0.40 0.40 0.40 0.40
Vitamin-mineral premix2 0.30 0.30 0.30 0.30
DFM mixture3 - 0.06 - 0.06
Calculated composition4
NE, kcal/kg 2,483 2,483 2,414 2,414
CP, % 20.95 20.95 22.29 22.29
SID5 Lys, % 1.36 1.36 1.35 1.35
Ca, % 0.85 0.85 0.85 0.85
STTD6 P, % 0.39 0.39 0.39 0.39
Analyzed composition
GE, kcal/kg 3,963 3,949 4,045 4,077
DM, % 87.8 87.5 87.8 87.9
Ash, % 5.0 5.2 5.4 5.7
ADF, % 4.7 4.0 6.1 5.8
NDF, % 11.4 10.5 14.0 14.1
Insoluble dietary fiber, % 13.5 13.5 17.0 17.0
Soluble dietary fiber, % 0.4 0.5 3.0 3.0
Total dietary fiber, % 13.9 14.0 20.0 20.0 1DDGS = distillers dried grains with solubles. 2Provided the following quantities of vitamins and micro-minerals per kilogram of complete diet: vitamin
A as retinyl acetate, 11,136 IU; vitamin D3 as cholecalciferol, 2,208 IU; vitamin E as DL-alpha tocopheryl acetate,
66 IU; vitamin K as menadione dimethylprimidinol bisulfite, 1.42 mg; thiamin as thiamine mononitrate, 0.24 mg;
riboflavin, 6.59 mg; pyridoxine as pyridoxine hydrochloride,0.24 mg; vitamin B12, 0.03 mg; D-pantothenic acid as
D-calcium pantothenate, 23.5 mg; niacin, 44.1 mg; folic acid, 1.59 mg; biotin, 0.44 mg; Cu, 20 mg as copper sulfate
and copper chloride; Fe, 126 mg as ferrous sulfate; I, 1.26 mg as ethylenediamine dihydriodide; Mn, 60.2 mg as
manganese sulfate; Se, 0.3 mg as sodium selenite and selenium yeast; and Zn, 125.1 mg as zinc sulfate. 3DFM = direct-fed microbial mixture consists of 30 g of DFM mixed with 270 g of corn. 4Calculated from NRC (2012) values. 5SID = standardized ileal digestible. 6STTD = standardized total tract digestible.

116
Table 4.3. Gene-specific primer sequences
Gene Acc. No Forward primer (5’-3’) Reverse primer (5’-3’) Reference
MUC21 AK231524 CAACGGCCTCTCCTTCTCTGT GCCACACTGGCCCTTTGT Leonard et al.
(2011)
MCT12 AM286425 GGTGGAGGTCCTATCAGCAG TGAAGGCAAGCCCAAGAC Metzler-Zebeli et
al. (2012)
CD1473 NM_001123086 CCTCGGAGACCAAGACAGAG TCATTCACGTGGTGTCCACT König et al. (2010)
PCK14 NM_001123158.1 CCCTGCCTTTGAAAAAGCCC GGAGATGATTTCTCGGCGGT Qu et al. (2015)
GLP-2R5 NM_001246266.1 TGTCCTACGTGTCGGAGATGTC TAATTGGCGCCCACGAA Guan et al. (2006)
1MUC2 = mucin 2. 2MCT1 = monocarboxylate transporter 1.
3CD147 = basigin.
4PCK1 = phosphoenolpyruvate carboxykinase 1.
5GLP-2R = glucagon-like peptide-2 receptor.

117
Table 4.4. Analyzed energy and nutrient composition of main ingredients (as-fed basis)
Ingredient
Item Corn Soybean meal DDGS1 Wheat middlings
GE, kcal/kg 3,773 4,175 4,421 4,027
DM, % 84.5 88.4 86.9 86.7
Ash, % 1.1 6.1 4.5 4.8
ADF, % 3.8 6.1 11.6 10.8
NDF, % 12.2 7.0 24.1 38.4
Insoluble dietary fiber, % 12.1 15.0 29.0 37.1
Soluble dietary fiber, % 0.6 1.4 1.9 6.3
Total dietary fiber, % 12.7 16.4 30.9 43.4
1DDGS = distillers dried grains with solubles.
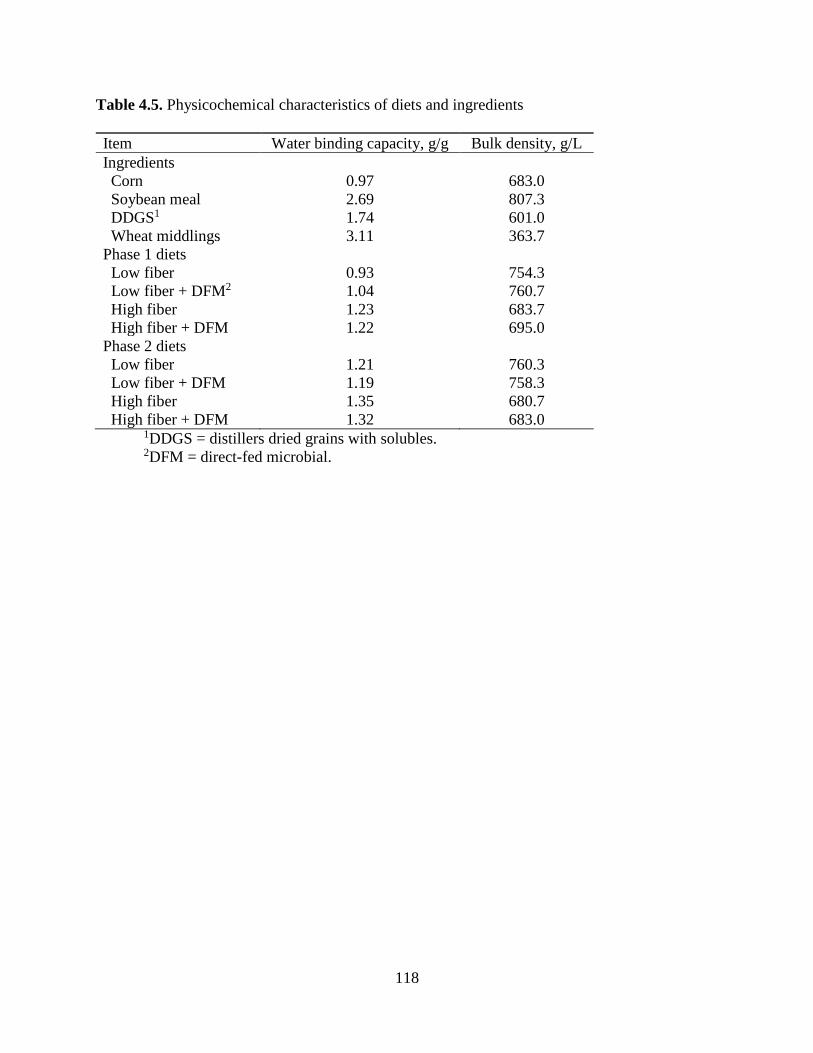
118
Table 4.5. Physicochemical characteristics of diets and ingredients
Item Water binding capacity, g/g Bulk density, g/L
Ingredients
Corn 0.97 683.0
Soybean meal 2.69 807.3
DDGS1 1.74 601.0
Wheat middlings 3.11 363.7
Phase 1 diets
Low fiber 0.93 754.3
Low fiber + DFM2 1.04 760.7
High fiber 1.23 683.7
High fiber + DFM 1.22 695.0
Phase 2 diets
Low fiber 1.21 760.3
Low fiber + DFM 1.19 758.3
High fiber 1.35 680.7
High fiber + DFM 1.32 683.0 1DDGS = distillers dried grains with solubles. 2DFM = direct-fed microbial.
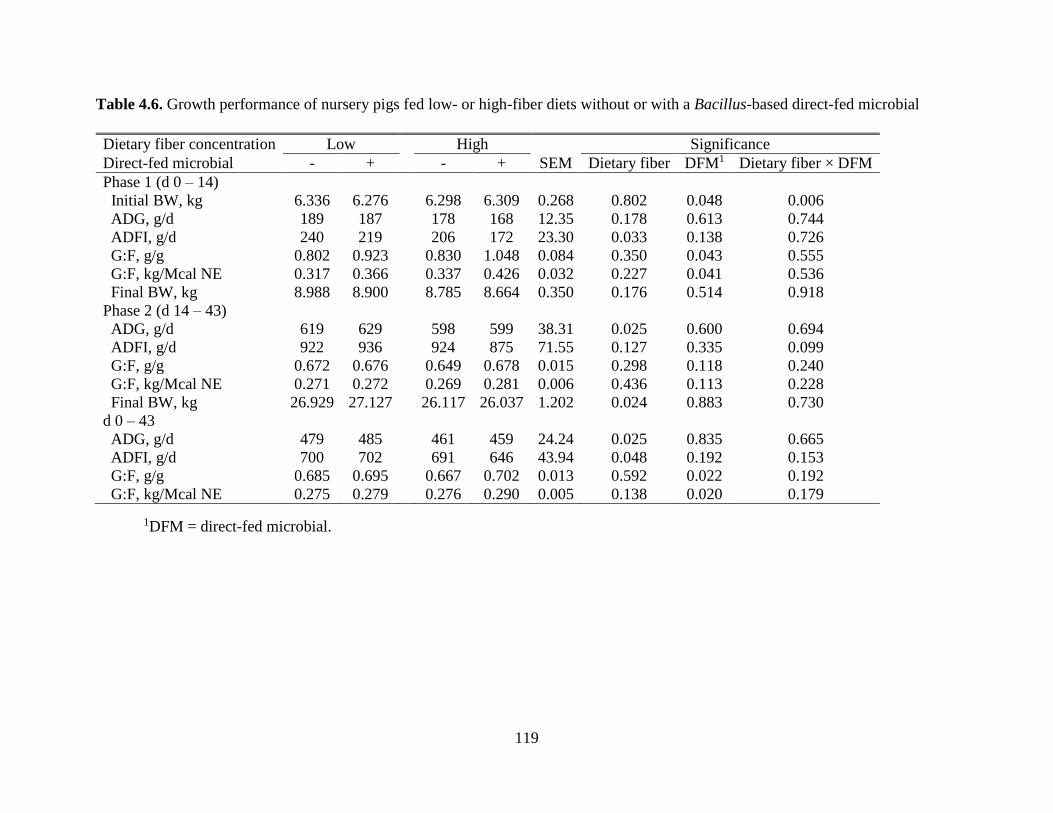
119
Table 4.6. Growth performance of nursery pigs fed low- or high-fiber diets without or with a Bacillus-based direct-fed microbial
1DFM = direct-fed microbial.
Dietary fiber concentration Low High Significance
Direct-fed microbial - + - + SEM Dietary fiber DFM1 Dietary fiber × DFM
Phase 1 (d 0 – 14)
Initial BW, kg 6.336 6.276 6.298 6.309 0.268 0.802 0.048 0.006
ADG, g/d 189 187 178 168 12.35 0.178 0.613 0.744
ADFI, g/d 240 219 206 172 23.30 0.033 0.138 0.726
G:F, g/g 0.802 0.923 0.830 1.048 0.084 0.350 0.043 0.555
G:F, kg/Mcal NE 0.317 0.366 0.337 0.426 0.032 0.227 0.041 0.536
Final BW, kg 8.988 8.900 8.785 8.664 0.350 0.176 0.514 0.918
Phase 2 (d 14 – 43)
ADG, g/d 619 629 598 599 38.31 0.025 0.600 0.694
ADFI, g/d 922 936 924 875 71.55 0.127 0.335 0.099
G:F, g/g 0.672 0.676 0.649 0.678 0.015 0.298 0.118 0.240
G:F, kg/Mcal NE 0.271 0.272 0.269 0.281 0.006 0.436 0.113 0.228
Final BW, kg 26.929 27.127 26.117 26.037 1.202 0.024 0.883 0.730
d 0 – 43
ADG, g/d 479 485 461 459 24.24 0.025 0.835 0.665
ADFI, g/d 700 702 691 646 43.94 0.048 0.192 0.153
G:F, g/g 0.685 0.695 0.667 0.702 0.013 0.592 0.022 0.192
G:F, kg/Mcal NE 0.275 0.279 0.276 0.290 0.005 0.138 0.020 0.179

120
Table 4.7. pH and VFA concentrations, expressed as µmol/g DM basis, in cecal and rectal contents of pigs fed either a low- or high-
fiber diet without or with a Bacillus-based direct-fed microbial
1DFM = direct-fed microbial. 2SCFA = short chair fatty acids. 3BCFA = branched-chain fatty acids.
Dietary fiber concentration Low High Significance
Direct-fed microbial - + - + SEM Dietary fiber DFM1 Dietary fiber × DFM
Ileal digesta pH 6.78 6.77 6.83 7.04 0.18 0.216 0.444 0.413
Cecal digesta
pH 6.01 6.01 5.84 5.89 0.10 0.053 0.696 0.767
Acetate 100.73 100.17 102.38 102.67 4.59 0.470 0.962 0.883
Propionate 27.02 28.24 29.59 29.75 1.99 0.156 0.629 0.709
Butyrate 14.30 12.88 16.64 13.37 1.66 0.343 0.121 0.536
Total SCFA2 142.06 141.29 149.51 145.79 7.85 0.233 0.650 0.765
Valerate 2.08 1.76 2.15 1.93 0.36 0.715 0.397 0.878
Isovalerate 0.48 0.50 0.35 0.61 0.09 0.913 0.101 0.180
Isobutyrate 0.52 0.60 0.58 0.71 0.08 0.322 0.206 0.747
Total BCFA3 3.08 2.87 3.07 3.25 0.39 0.618 0.961 0.612
SCFA:BCFA 53.58 55.47 48.98 49.84 5.21 0.312 0.785 0.919
Rectal contents
pH 6.56 6.53 6.77 6.63 0.09 0.093 0.373 0.561
Acetate 112.99 111.44 100.78 93.95 5.59 0.006 0.416 0.608
Propionate 25.94 24.43 21.21 19.43 2.00 0.021 0.418 0.949
Butyrate 12.94 11.54 10.95 11.56 1.08 0.367 0.716 0.355
Total SCFA 151.71 147.41 141.19 129.79 7.20 0.027 0.204 0.563
Valerate 2.10 2.35 2.03 2.01 0.20 0.321 0.582 0.507
Isovalerate 2.79 2.71 2.18 2.21 0.39 0.043 0.920 0.825
Isobutyrate 2.29 2.06 1.81 1.71 0.23 0.059 0.445 0.749
Total BCFA 6.86 6.89 5.62 5.90 0.60 0.065 0.787 0.834
SCFA:BCFA 21.68 21.91 23.91 21.84 3.13 0.616 0.669 0.590
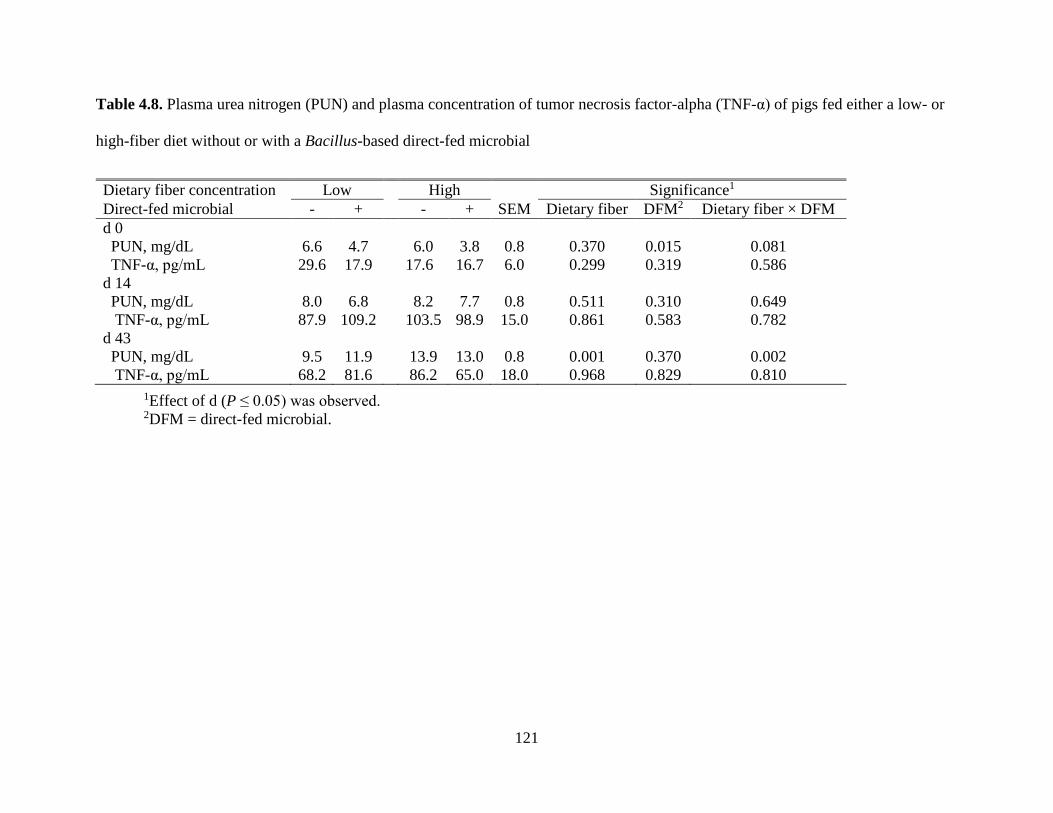
121
Table 4.8. Plasma urea nitrogen (PUN) and plasma concentration of tumor necrosis factor-alpha (TNF-α) of pigs fed either a low- or
high-fiber diet without or with a Bacillus-based direct-fed microbial
1Effect of d (P ≤ 0.05) was observed. 2DFM = direct-fed microbial.
Dietary fiber concentration Low High Significance1
Direct-fed microbial - + - + SEM Dietary fiber DFM2 Dietary fiber × DFM
d 0
PUN, mg/dL 6.6 4.7 6.0 3.8 0.8 0.370 0.015 0.081
TNF-α, pg/mL 29.6 17.9 17.6 16.7 6.0 0.299 0.319 0.586
d 14
PUN, mg/dL 8.0 6.8 8.2 7.7 0.8 0.511 0.310 0.649
TNF-α, pg/mL 87.9 109.2 103.5 98.9 15.0 0.861 0.583 0.782
d 43
PUN, mg/dL 9.5 11.9 13.9 13.0 0.8 0.001 0.370 0.002
TNF-α, pg/mL 68.2 81.6 86.2 65.0 18.0 0.968 0.829 0.810
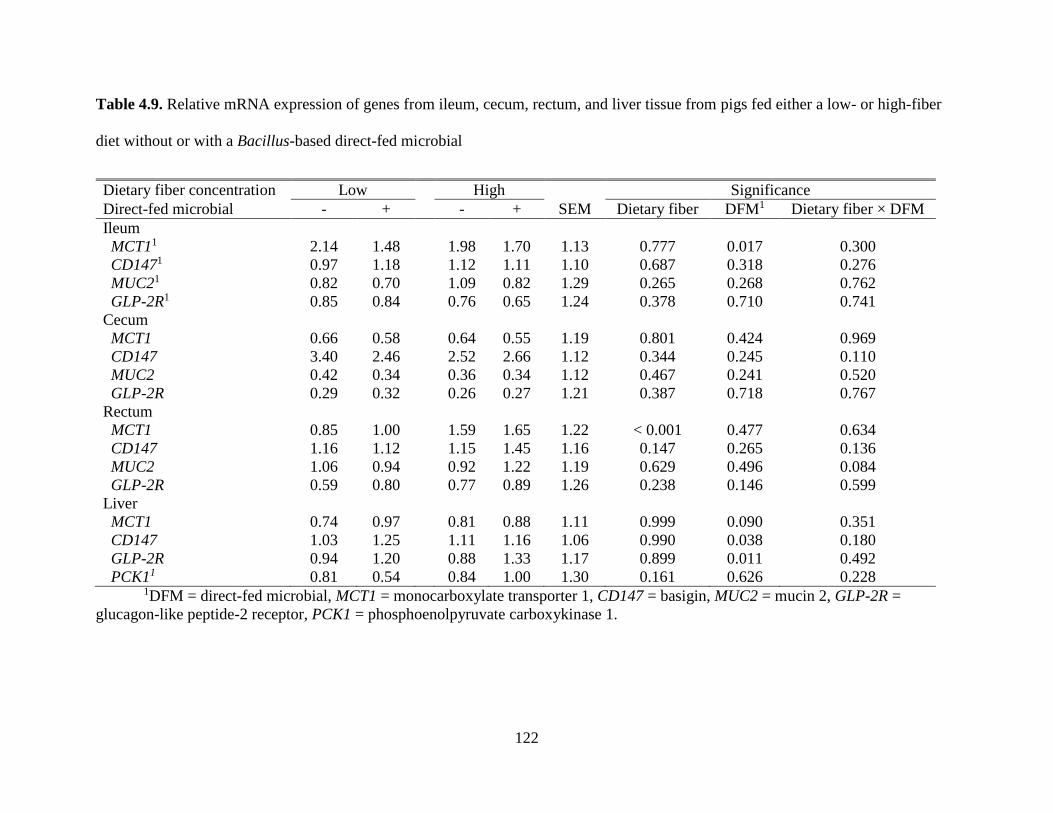
122
Table 4.9. Relative mRNA expression of genes from ileum, cecum, rectum, and liver tissue from pigs fed either a low- or high-fiber
diet without or with a Bacillus-based direct-fed microbial
1DFM = direct-fed microbial, MCT1 = monocarboxylate transporter 1, CD147 = basigin, MUC2 = mucin 2, GLP-2R =
glucagon-like peptide-2 receptor, PCK1 = phosphoenolpyruvate carboxykinase 1.
Dietary fiber concentration Low High Significance
Direct-fed microbial - + - + SEM Dietary fiber DFM1 Dietary fiber × DFM
Ileum
MCT11 2.14 1.48 1.98 1.70 1.13 0.777 0.017 0.300
CD1471 0.97 1.18 1.12 1.11 1.10 0.687 0.318 0.276
MUC21 0.82 0.70 1.09 0.82 1.29 0.265 0.268 0.762
GLP-2R1 0.85 0.84 0.76 0.65 1.24 0.378 0.710 0.741
Cecum
MCT1 0.66 0.58 0.64 0.55 1.19 0.801 0.424 0.969
CD147 3.40 2.46 2.52 2.66 1.12 0.344 0.245 0.110
MUC2 0.42 0.34 0.36 0.34 1.12 0.467 0.241 0.520
GLP-2R 0.29 0.32 0.26 0.27 1.21 0.387 0.718 0.767
Rectum
MCT1 0.85 1.00 1.59 1.65 1.22 < 0.001 0.477 0.634
CD147 1.16 1.12 1.15 1.45 1.16 0.147 0.265 0.136
MUC2 1.06 0.94 0.92 1.22 1.19 0.629 0.496 0.084
GLP-2R 0.59 0.80 0.77 0.89 1.26 0.238 0.146 0.599
Liver
MCT1 0.74 0.97 0.81 0.88 1.11 0.999 0.090 0.351
CD147 1.03 1.25 1.11 1.16 1.06 0.990 0.038 0.180
GLP-2R 0.94 1.20 0.88 1.33 1.17 0.899 0.011 0.492
PCK11 0.81 0.54 0.84 1.00 1.30 0.161 0.626 0.228

123
CHAPTER 5: EFFECT OF A 3-STRAIN BACILLUS-BASED DIRECT-FED
MICROBIAL ON GROWTH PERFORMANCE, INTESTINAL CONCENTRATIONS OF
VOLATILE FATTY ACIDS, CARCASS CHARACTERISTICS, AND
GASTROINTESTINAL TRACT WEIGHTS IN GROWING-FINISHING PIGS FED
LOW- OR HIGH-FIBER DIETS
ABSTRACT: The effect of a Bacillus-based direct-fed microbial (DFM) on growth
performance, intestinal VFA concentration, carcass characteristics, and gastrointestinal tract
weights in growing-finishing pigs was evaluated. A total of 160 pigs (initial BW: 26.61 ± 2.17
kg) were randomly allotted to a 2 × 2 factorial arrangement with 2 diet types [low-fiber (LF) or
high-fiber (HF)] and 2 concentrations of DFM [0 or 60 g DFM (1.5 × 10⁵ cfu / g) / t of feed] and
4 pigs per pen and 10 pens per treatment. Grower, early-finisher, and late-finisher diets were fed
for 35, 35, and 24 d, respectively. Pigs were previously fed their respective treatment diets since
weaning at d 21 of age. The LF diets contained corn and soybean meal as main ingredients and
HF diets contained corn, soybean meal, corn distillers dried grains with solubles (30%), and
wheat middlings (10%). Pig weights were recorded at the beginning of the experiment and
conclusion of each phase. Daily feed allotments also were recorded and feed left in the feeders
was recorded on the same days as pig weights were obtained. One pig per pen was harvested at
the conclusion of the experiment. Cecum and rectum contents were analyzed for VFA. Carcass
characteristics and gastrointestinal tract weights were measured. Results indicated that for the
overall growing-finishing period, there was no difference in ADG or G:F, expressed as kg
gain/Mcal NE, between pigs fed LF and HF diets, but pigs fed HF diets had greater (P ≤ 0.05)
ADFI, reduced (P ≤ 0.05) backfat thickness, reduced (P ≤ 0.05) dressing percentage, and

124
increased (P ≤ 0.05) weight of the large intestine as a percent of BW compared with pigs fed LF
diets. Pigs fed LF diets had greater (P ≤ 0.05) concentrations of acetate and propionate in cecum
contents and greater (P ≤ 0.05) concentrations of all VFA in rectal contents compared with pigs
fed HF diets. Pigs fed DFM-containing diets had decreased (P ≤ 0.05) concentrations of total
VFA in cecal contents, but increased (P ≤ 0.05) concentrations of total VFA in rectal contents.
Pigs fed diets supplemented with DFM had greater (P ≤ 0.05) HCW and backfat thickness, but
fat-free lean percentage was reduced (P < 0.05) compared with pigs fed diets with no DFM. In
conclusion, pigs fed HF diets had similar ADG and G:F and a lower dressing percentage than
pigs fed LF diets. The addition of this DFM to LF or HF diets had no effect on growth
performance, but increased backfat thickness and reduced fat-free lean percentage.
Key words: carcass, dietary fiber, direct-fed microbials, growth performance, pigs
INTRODUCTION
Addition of direct-fed microbials (DFM) to swine diets may improve gut health by
modifying the microbiota, which may enhance immune regulation and health status of the pigs
(Kenny et al., 2011; Cromwell, 2013). Addition of DFM to growing-finishing pig diets also may
increase ADG, G:F, and carcass quality (Alexopoulos et al., 2004; Davis et al., 2008).
Bacillus-based DFM are thermo-stable spore-forming bacteria and they produce a large
amount and a wide variety of manure-degrading enzymes (Schreier, 1993; Kenny et al., 2011).
Pig manure is mostly composed of dietary fiber and, therefore, the addition of a Bacillus-based
DFM may enhance the fermentation of dietary fiber in swine diets (Davis et al., 2008). High-
fiber diets based on fibrous co-products fed to growing-finishing pigs may reduce growth
performance and carcass characteristics compared with pigs fed low-fiber diets based on corn

125
and soybean meal (Bindelle et al., 2008). However, when growing-finishing pigs were fed high-
fiber diets based on corn, soybean meal, DDGS, wheat middlings, corn germ, and soybean hulls
supplemented with a Bacillus spp. DFM, it was observed that pigs had increased fecal VFA
concentrations, improved ADG and G:F, and a greater loin eye area and fat-free lean percentage
compared with pigs fed no DFM (Jaworski et al., 2014). Therefore, it may be beneficial to
supplement high-fiber diets containing distillers dried grains with solubles (DDGS) and wheat
middlings with a Bacillus-based DFM that has been selected on the basis of the ability to secrete
fiber-degrading enzymes. The objective of this experiment, therefore, was to test the hypothesis
that addition of a 3-strain Bacillus-based DFM will increase dietary fiber fermentation, which
will increase growth performance and carcass characteristics of growing-finishing pigs fed high-
fiber diets compared with pigs fed low-fiber diets.
MATERIALS AND METHODS
The Institutional Animal Care and Use Committee at the University of Illinois reviewed
and approved the protocol for these experiments.
Animals, Diets, and Experimental Design. A total of 160 pigs (initial BW: 26.61 ± 2.17
kg) that were the offspring of G-Performer boars mated to F-25 females (Genetiporc, Alexandria,
MN) were used in this experiment in 2 separate blocks of 80 pigs each. Pigs were randomly
allotted in a completely randomized block design to 4 dietary treatments. There were 4 pigs per
pen and 10 replicate pens per treatment. Pigs were housed in pens equipped with a feeder, a
nipple drinker, and partly slatted concrete floors in an environmentally controlled building. Ad
libitum access to feed and water was allowed throughout the experiment.
126
Treatments were arranged in a 2 × 2 factorial arrangement with 2 diet types [low-fiber
(LF) or high-fiber (HF)] and 2 concentrations of DFM (0 or 60 g DFM / t of feed; Tables 5.1,
5.2, and 5.3). The 3-strain Bacillus-based DFM contained 1.5 × 10⁵ CFU / g and was obtained
from Danisco Animal Nutrition-DuPont Industrial Biosciences (Marlborough, UK). Pigs were
previously fed similar diets so that treatment contrasts (i. e., dietary fiber concentration and DFM
addition) had been fed since weaning. Grower diets were fed for 5 weeks. Pigs then were fed
early-finisher diets for 5 weeks and late-finisher diets were fed during the final 24 d. The LF
diets contained corn and soybean meal as main ingredients and HF diets contained corn, soybean
meal, DDGS (30.0%) and wheat middlings (10.0%). All diets contained 500 units of microbial
phytase (Axtra® PHY; Danisco Animal Nutrition-DuPont Industrial Biosciences, Waukesha,
WI) per kg of complete diet. Diets were not formulated to be isocaloric or isonitrogenous and,
therefore, the HF diets contained less NE and more CP than the LF diets. However, all diets were
formulated to meet or exceed requirements for standardized ileal digestible (SID) AA,
standardized total tract digestible (STTD) P, and vitamins and minerals according to NRC
(2012).
Individual pig weights were recorded at the beginning of the experiment and at the
conclusion of each phase. Daily allotments of feed were recorded and feed left in the feeder at
the end of each phase was recorded and feed intake calculated. Data were summarized and ADG,
ADFI, and G:F calculated. The G:F also was calculated as kg gain / Mcal NE because LF and HF
diets were not formulated to be isocaloric.
Sample Collection. Blood samples (10 mL; 1 pig per pen) were collected from 1 pig per
pen at the start of the experiment and blood was collected from the same pig per pen at the
conclusion of the experiment. Blood samples were analyzed for plasma urea nitrogen (PUN) and
127
plasma concentrations of tumor necrosis factor alpha (TNF-α) in duplicate using a porcine
sandwich ELISA kit according to the manufacturer’s instructions (R&D Systems, Minneapolis,
MN). Intra-assay CV was 6.2% for TNF-α.
At the conclusion of the late-finisher phase, 1 pig per pen was harvested and 5 gilts and 5
barrows were harvested from each treatment. The weight of the full intestinal tract was recorded
and ileal and cecal digesta and rectal contents collected. The pH of each of the samples was
measured immediately after collection using a pH meter (Accumet Basic, Fisher Scientific,
Pittsburgh, PA). After the pH was measured, cecal and rectal samples were mixed with 2N HCl
in a 1:1 ratio and stored at -20°C until analyzed for concentrations of VFA. The remaining cecal
digesta and rectal contents were stored at -20°C for further analysis.
A 5-cm tissue sample was collected from the ileum 10 cm cranial to the ileo-cecal
sphincter, from the tail of the cecum, from the rectum 10 cm cranial to the internal anal
sphincter, and from the left lateral lobe of the liver. After collection, tissue samples, with the
exception of liver tissue, were opened at the mesentery, rinsed with ice-cold PBS, snap-frozen in
liquid nitrogen, and stored at -80°C.
RNA Extraction and Quantitative Reverse Transcription-PCR. Total RNA was isolated
from 100 mg of frozen tissue samples according to the PureLink® RNA Mini Kit (Life
Technologies, Grand Island, NY) manufacturer’s instructions. Total RNA was quantified by
measuring the absorbance at 260 nm using a NanoDrop ND-1000 spectrophotometer (NanoDrop
Technologies, Wilmington, DE), and purity was assessed by determining the ratio of the
absorbance at 260 and 280 nm. All RNA samples had 260/280 nm ratios greater than 1.9 and less
than 2.1. The RNA quality was checked using a 2100 Bioanalyzer (Agilent Technologies, Santa

128
Clara, CA) and all RNA samples used for reverse transcription had an RNA integrity number
greater than 8.
Total RNA (100 ng/µl) was reverse transcribed by means of a SuperScript® III First-
Strand Synthesis SuperMix kit (Life Technologies, Grand Island, NY) to synthesize the double-
stranded cDNA. Double-stranded cDNA was diluted and used for quantitative reverse
transcription (qRT-PCR). Each 10 µL reaction consisted of 5 µL SYBR Green (Applied
Biosystems, Foster City, CA), 4 µL diluted cDNA sample, 0.4 μL of 10 μM forward and reverse
primer, and 0.2 μL DNase/RNase free water. The reactions were performed in an ABI Prism
7900 HT (Applied Biosystems, Foster City, CA) using the following conditions: 2 min at 50°C,
10 min at 95°C, 40 cycles of 15 s at 95°C, and 1 min at 60°C. An additional dissociation stage
was added to verify the presence of a single PCR product. All reactions were run in triplicate.
Data were analyzed using the 7900 HT Sequence Detection Systems Software (version 2.2.1,
Applied Biosystems, Foster City, CA).
Two internal control genes, glyceraldehyde 3-phosphate dehydrogenase (GAPDH) and
hydroxymethylbilane synthase (HMBS) were used to normalize the expression of tested genes
(Vigors et al., 2014). The tested genes included mucin 2 (MUC2), monocarboxylate transporter 1
(MCT1), basigin (CD147), phosphoenolpyruvate carboxykinase 1 (PCK1), and glucagon-like
peptide - 2 receptor (GLP-2R). Mucin 2 is responsible for the production of mucin and was
selected because previous research has indicated that high-fiber diets may increase mucin
production (de Lange et al., 1989). Monocarboxylate transporter 1 is a proton-coupled
transporter of VFA and CD147 is responsible for translocation and function of MCT1 (König et
al., 2010) and, therefore, these two genes were selected to aid in the explanation of intestinal
concentrations of VFA. Phosphoenolpyruvate carboxykinase 1 is the rate-controlling enzyme of

129
gluconeogenesis (Shulman and Petersen, 2012) and was selected because we hypothesized that
HF fed pigs would have less dietary glucose and, therefore, have increased gluconeogenesis.
Glucagon-like peptide - 2 receptor is a G-protein-coupled, transmembrane receptor for the
peptide glucagon-like peptide - 2, which has been indicated to control gastrointestinal growth
and function (Guan et al., 2006). Ileum, cecum, and rectum tissue were tested for MUC2, MCT1,
CD147, and GLP-2R, whereas liver tissue was tested for MCT1, CD147, GLP-2R, and PCK1.
Primers used for amplification of target genes are provided in Table 5.4. To obtain the relative
gene expression, the average quantity of triplicate samples was calculated and divided by the
geometric mean of the two internal control genes.
Ultrasound Measurements and Carcass Characteristics. At the conclusion of the late-
finishing phase, all pigs were ultrasonically scanned at the time of pig weighing using an Aloka
Model 500V B-mode ultrasound scanner fitted with an Aloka 5011 probe (Corometrics Medical
Systems, Wallingford, CT). A transverse image was taken over the middle of the Longissimus
muscle (LM) at the 10th rib, and backfat thickness, Longissimus muscle depth (LD), and
Longissimus muscle area (LMA) were measured on the image. One pig per pen then was
selected based on sex, keeping the sex selection the same within a replicate, and then BW. Next,
pigs were tattooed and transported to the Meat Science Laboratory at the University of Illinois
(Urbana, IL) and held overnight in lairage. Pigs were provided ad libitum access to water during
this time, but had no access to feed. Pigs were weighed immediately prior to slaughter to
determine ending live weight. Pigs were slaughtered under the supervision of the Food Safety
and Inspection Service branch of the United States Department of Agriculture using head-to-
heart electrical immobilization and exsanguination. Intestinal weights were collected as
described by Boler et al. (2014). Initially, the full intact intestinal tract was weighed. The large

130
intestine was separated from the small intestine at the ileocecal junction. The small intestine was
separated from the stomach between the pylorus of the stomach and the duodenum of the small
intestine. The stomach was removed from the esophagus where the esophagus empties into the
cardia of the stomach. Each section of the intestinal tract was rinsed with water to remove all
digesta and fecal material. Mesenteric tissue that surrounds the intestinal tract was removed and
weighed separately. Gut fill was calculated as the difference in the weight of the full intestinal
tract and the sum of the empty sections.
Carcasses were weighed approximately 45 min postmortem to determine HCW. Carcass
dressing percentage was calculated by dividing HCW by ending live weight. Carcasses then were
allowed to chill at 4oC for approximately 24 h. Fresh meat quality was determined on the left
side of the carcass at approximately 24 h postmortem. The left side of each chilled carcass was
cut between the 10th and 11th rib interface to expose the LM. The surfaces of the LM were
allowed to bloom for at least 20 min before quality evaluations were conducted. Ultimate pH was
determined using a MPI hand-held pH meter (MPI pH-Meter, Topeka, KS; 2 point calibration:
pH 4 and 7). Subjective color, marbling, and firmness scores were conducted by a single
individual according to standards established by the National Pork Producers Council (NPPC,
1991; 1999). Objective L*, a*, and b* values were collected with a Minolta CR-400 utilizing a
D65 light source, a 0o observer, and an aperture size of 8 mm. Tenth rib backfat was measured at
¾ the distance of the LM from the dorsal process of the vertebral column. The LMA was
measured by tracing the surface of the LM on double matted acetate paper. Longissimus muscle
tracings were measured in duplicate using a digitizer tablet (Wacom, Vancouver, WA) and
Adobe Photoshop CS6 and the average of the two measurements were reported. A section of the
131
LM, posterior to the 10th rib, was excised and cut into one 1.25 cm chop and three 2.54 cm thick
chops to determine 48 h drip loss.
Chemical Analyses. Prior to analysis, cecal digesta and rectal contents were freeze-dried
and ground through a 1-mm screen in a Wiley mill (Model 4; Thomas Scientific, Swedesboro,
NJ). All main ingredients used in the diets and all diets, cecal, and rectal samples were analyzed
for DM (Method 930.15; AOAC Int., 2007). All diets and main ingredients were analyzed for
ADF and NDF using Ankom Technology method 12 and 13, respectively (Ankom2000 Fiber
Analyzer, Ankom Technology, Macedon, NY), while insoluble and soluble dietary fiber were
analyzed according to method 991.43 (AOAC Int., 2007) using the AnkomTDF Dietary Fiber
Analyzer (Ankom Technology, Macedon, NY). All diets and main ingredients were analyzed in
duplicate for GE using bomb calorimetry (Model 6300; Parr Instruments, Moline, IL). All cecal
digesta samples and rectal samples that were stabilized in 2N HCl were analyzed for
concentrations of VFA by gas chromatography according to Erwin et al. (1961), using a gas
chromatograph (Hewlett-Packard 5890A Series II, Palo Alto, CA) and a glass column (180 cm ×
4 mm i.d.) packed with 10% SP-1200/1% H3PO4 on 80/100 + mesh Chomosorb WAW (Supelco
Inc., Bellefonte, PA). Nitrogen was the carrier gas with a flow rate of 75 mL/min. Oven,
detector, and injector temperatures were 125, 175, and 180°C, respectively. The physicochemical
characteristics of the main ingredients and diets were determined by measuring the water binding
capacity (Urriola and Stein, 2010) and bulk density (Cromwell et al., 2000).
Statistical Analysis. Normality of residuals were determined by the UNIVARIATE
procedure of SAS (SAS Inst. Inc., Cary, NC). Outliers were determined using the BOXPLOT
procedure of SAS (SAS Inst. Inc., Cary, NC) and any value that deviated the treatment mean by
1.5 times the interquartile range was removed. Four outliers were identified and removed. Gene

132
expression data were log-10 transformed to align measures to a normal distribution. All data,
except for PUN and TNF-α, were analyzed as a 2 × 2 factorial arrangement of treatments with
dietary fiber concentration and DFM as the two factors and block as the random effect using the
MIXED procedure of SAS (SAS Inst. Inc., Cary, NC). Relative gene expression data presented
were back-transformed using antilog.
A repeated measures analysis was conducted for PUN and TNF-α data and each
individual pig was considered an experimental unit (Littell et al., 1998). Appropriate covariance
structures were chosen based on the Akaike information criterion. Data were subjected to a 3-
way ANOVA that included dietary fiber, DFM, and d, as well as the interactions among these
factors using PROC MIXED. The SLICE option was used to evaluate the main effects and
interaction of dietary fiber and DFM at each d. The pen was the experimental unit for growth
performance and carcass characteristics determined using ultrasound portions of the study,
whereas the pig was the experimental unit for sample pH, PUN, TNF-α, cecal and rectal content
VFA concentrations, carcass characteristics, gastrointestinal tract weights, and gene expression
data. For all outcomes, a P-value ≤ 0.05 was used to determine significance among dietary
treatments and a P-value > 0.05, but < 0.10 was considered a tendency.
RESULTS
Ingredient and Diet Analysis
Grower LF diets contained 1.0 and 17.2% soluble and insoluble dietary fiber,
respectively, and grower HF diets contained 1.5 and 23.0% soluble and insoluble dietary fiber,
respectively. Early-finisher LF diets contained 1.0 and 14.4% soluble and insoluble dietary fiber,
respectively, and early-finisher HF diets contained 1.0 and 22.3% soluble and insoluble dietary

133
fiber, respectively. Late-finisher LF diets contained 2.0 and 16.9% soluble and insoluble dietary
fiber, respectively, and late-finisher HF diets contained 2.0 and 20.8% soluble and insoluble
dietary fiber, respectively. Corn, soybean meal, DDGS, and wheat middlings contained 0.6, 1.4,
1.9, and 6.3% soluble dietary fiber, respectively, and 12.1, 15.0, 29.0, and 37.1% insoluble
dietary fiber, respectively (Table 5.5). The water binding capacity was 0.97, 2.69, 1.74, and 3.11
g/g in corn, soybean meal, DDGS, and wheat middlings, respectively, while the bulk density was
683.0, 807.3, 601.0, and 363.7 g/L, respectively (Table 5.6). The water binding capacity was
1.28 and 1.56 g/g and the bulk density was 728.5 and 646.7 g/ L in grower LF and HF diets,
respectively. The water binding capacity was 1.28 and 1.54 g/g and the bulk density was 692.0
and 579.0 g/L in early-finisher LF and HF diets, respectively. The water binding capacity was
1.18 and 1.44 g/g and the bulk density was 727.8 and 645.5 g/L in late-finisher diets,
respectively.
Growth Response
Initial BW, grower G:F, and d 35 BW were not affected by dietary fiber concentration or
DFM addition, but ADG and ADFI were increased (P ≤ 0.05) in grower pigs fed HF diets
compared with pigs fed LF diets (Table 5.7). Also, G:F, expressed as kg/Mcal NE, was greater
(P ≤ 0.05) in HF-fed pigs compared with LF-fed pigs. During the early-finisher phase, pigs fed
HF diets had increased (P ≤ 0.05) ADFI compared with pigs fed LF diets, but dietary fiber
concentration and DFM addition did not affect early-finisher pig ADG, G:F, or d 70 BW. Late-
finisher pigs fed HF diets had decreased (P ≤ 0.05) G:F compared with pigs fed LF diets. Dietary
fiber concentration and DFM addition did not affect late-finisher pig ADG, ADFI, or d 94 BW.
Overall, pigs fed HF diets had increased (P ≤ 0.05) ADFI and decreased (P ≤ 0.05) G:F
compared with pigs fed LF diets. However, G:F, expressed as kg/Mcal NE, was not different

134
between pigs fed HF diets and pigs fed LF diets. The addition of DFM to LF or HF diets did not
affect ADG, ADFI, or G:F.
Carcass Characteristics and Gastrointestinal Tract Weights
Backfat thickness, measured using ultrasound on all pigs, was greater (P ≤ 0.05) for pigs
fed LF diets compared with pigs fed HF diets (Table 5.8). Dietary fiber concentration and DFM
addition did not affect ultrasonically measured pig LD, LMA, or predicted carcass lean weight.
Calculated fat-free lean percentage from ultrasound measurements tended to be decreased (P <
0.10) in pigs fed diets containing DFM. The slaughter weight tended to be greater (P < 0.10) and
HCW of pigs fed diets containing DFM was greater (P ≤ 0.05) compared with pigs fed diets
without DFM. The dressing percentage of pigs fed LF diets was greater (P ≤ 0.05) compared
with pigs fed HF diets. Backfat at the 10th rib was greater (P ≤ 0.05) for pigs fed diets
supplemented with DFM compared with pigs fed diets without DFM. The LMA and calculated
fat-free lean (kg) was unaffected by dietary fiber concentration or DFM addition. However, the
calculated fat-free lean percentage of pigs fed diets containing DFM was reduced (P ≤ 0.05)
compared with pigs fed diets with no DFM. The LM marbling was greater (P ≤ 0.05) for pigs fed
LF diets compared with HF diets. An interaction (P ≤ 0.05) between dietary fiber concentration
and DFM addition was observed for LM firmness because HF fed pigs tended to have a reduced
(P < 0.10) LM firmness compared with LF-fed pigs, while DFM addition to the HF diet
increased LM firmness. Pigs fed HF diets had a greater (P ≤ 0.05) LM 24-h pH compared with
pigs fed LF diets. Pigs fed LF diets and diets supplemented with DFM had a greater (P ≤ 0.05)
LM L* compared with pigs fed HF diets or diets without DFM, respectively. Pigs fed LF diets
had greater (P ≤ 0.05) LM a* and b* compared with pigs fed HF diets, but an interaction (P ≤
0.05) between dietary fiber and DFM was observed for both LM a* and b*. The L* of backfat

135
from pigs fed LF diets was greater (P ≤ 0.05) compared with pigs fed HF diets, and there was a
tendency for pigs fed HF diets to have greater (P < 0.10) backfat a* compared with pigs fed LF
diets.
Dietary fiber concentration or DFM did not affect the weights of the full intestinal tract,
esophagus, stomach, or small intestine, but the weight of the large intestine tended to be greater
(P < 0.10) for pigs fed HF diets (Table 5.9). Pigs fed LF diets had a greater (P ≤ 0.05) weight of
mesenteric fat compared with pigs fed HF diets. Pigs fed HF diets had a greater (P ≤ 0.05) gut
fill compared with pigs fed LF diets. When gastrointestinal tract weight was expressed as a
percentage of pig BW, the weight of the large intestine and gut fill were greater (P ≤ 0.05) for
pigs fed HF diets compared with pigs fed LF diets. The empty weight of the intestinal tract was
not affected by dietary fiber concentration or DFM
Intestinal Concentrations of VFA and pH
An interaction between dietary fiber concentration and DFM was observed (P ≤ 0.05) for
pH of ileal digesta because DFM addition to the HF diet increased pH, but decreased ileal
digesta pH when added to the LF diet (Table 5.10). An interaction also was observed (P ≤ 0.05)
for pH of cecal digesta because pigs fed LF diets had reduced cecal digesta pH compared with
HF fed pigs, but DFM addition increased (P ≤ 0.05) cecal digesta pH. The concentration of
acetate and propionate in cecal digesta was greater (P ≤ 0.05) and total short-chain fatty
concentration tended to be greater (P < 0.10) in pigs fed LF diets, while DFM addition to diets
decreased (P ≤ 0.05) acetate, propionate, and total short-chain fatty acid concentrations in cecal
digesta. The ratio of short- to branched-chain fatty acids was greater (P ≤ 0.05) in pigs fed LF
diets compared with pigs fed HF diets.

136
The pH of rectal contents was not affected by dietary fiber concentration or DFM. The
concentration of all short- and branched-chain fatty acids in rectal contents of pigs fed LF diets
were greater (P ≤ 0.05) compared with pigs fed HF diets. Pigs fed diets containing DFM had
increased (P ≤ 0.05) concentration of acetate and total short-chain fatty acids in rectal contents.
TNF-α and PUN
No effect of dietary fiber concentration or DFM addition was observed on plasma
concentrations of TNF-α on d 0, but an interaction tended to be observed (P < 0.10) between
dietary fiber concentration and DFM on d 94 (Table 5.11). The interaction was because DFM
addition to the LF diet substantially increased TNF-α, but reduced TNF-α in pigs fed HF diets.
The plasma concentration of TNF-α in pigs was greater (P ≤ 0.05) at d 0 compared with the
plasma concentration of TNF-α in pigs at d 94. The d 0 and d 94 PUN of pigs fed HF diets was
greater (P ≤ 0.05) compared with pigs fed LF diets; however, an interaction (P ≤ 0.05) between
dietary fiber and DFM was observed because addition of DFM to LF diets increased d 0 and d 94
PUN, but DFM addition to HF diets decreased d 0 and d 94 PUN.
Gene Expression
The expression of internal control genes was confirmed to be unaffected by dietary
treatment. No effect of dietary fiber concentration or DFM was observed for expression of
selected genes in ileal tissue of pigs (Table 5.12). Pigs fed HF diets had increased (P ≤ 0.05)
expression of MCT1 and CD147 in cecum tissue. Pigs fed diets containing DFM had increased
(P ≤ 0.05) cecum MUC2 expression and tended to have increased (P < 0.10) rectum MUC2
expression. An interaction (P ≤ 0.05) between dietary fiber and DFM was observed for
expression of MCT1 in the liver of pigs. This interaction was due to greater MCT1 expression in
pigs fed DFM over those fed no DFM in the HF diet group, with a decreased MCT1 expression

137
in the liver of pigs fed LF diets containing DFM. Expression of GLP-2R in liver of pigs fed HF
diets was increased (P ≤ 0.05) compared with pigs fed LF diets.
DISCUSSION
Pigs fed HF diets had increased ADG, ADFI, and G:F (expressed as kg/Mcal NE)
compared with pigs fed LF diets during the grower phase. This may be attributed to a
compensatory gain effect because pigs were fed similar diets since weaning, and HF-fed pigs had
reduced ADFI and ADG compared with LF-fed pigs as they finished the nursery phase. Also in
this experiment, HF-fed pigs increased ADFI to maintain ADG and final BW equal to their LF-
fed counterparts, and this was because the HF diets contained less NE. Although ADFI was
increased, HF-fed pigs were able to maintain G:F (expressed as kg/Mcal NE) during the grower,
early-finisher, and overall experiment, but not during the late-finisher phase, equal to LF-fed
pigs. Taken together, the results indicate that growing-finishing pigs are capable of handling the
gut fill effect of HF diets and, therefore, can consume enough feed to maintain growth, albeit the
feed is not as digestible as the LF diet. A review on DDGS inclusion in swine diets is also in
agreement with the results of this experiment and, again, it was confirmed that up to 30% DDGS
may be included in growing-finishing swine diets with no negative impact on growth
performance (Stein and Shurson, 2009).
The addition of DFM to LF or HF diets fed to pigs did not affect growth performance in
this experiment. This response is consistent with results of previous experiments that indicated
addition of DFM to growing-finishing pig diets did not affect growth performance (Apgar et al.,
1993; Stavric and Kornegay, 1995). A reason for a lack of a consistent response in growing-
finishing pigs fed diets containing DFM may be that the growing-finishing pig has a better health
status and development of the gastrointestinal tract at this age compared with a nursery pig.

138
The slaughter weight and, therefore, HCW tended to be greater for pigs fed diets with
DFM compared with pigs fed diets without DFM. However, this is an artifact of the experiment
because ending BW was not different among pigs fed experimental diets. The artifact was caused
by our criteria used to select the pigs to slaughter at the end of the experiment. The first selection
criteria was based on sex within replicate in order to account for any effect of sex, and the
second selection criteria was the pig per pen with the closest BW to the pen mean. Due to
mortality, which was 3.75%, some pens within a replicate had only one pig of the correct sex to
select; therefore, BW was not always as close to the pen mean, which influenced slaughter
weight and HCW. However, dressing percentage of pigs fed diets with DFM was not affected
and, therefore, suggest the tendency for increased slaughter weight and HCW were an artifact of
the slaughter selection criteria.
The dressing percentage of pigs fed HF diets was decreased compared with pigs fed LF
diets because pigs fed HF diets had a greater weight of the large intestine and a greater gut fill.
Previous research also indicated that pigs fed diets higher in concentration of dietary fiber have
increased gastrointestinal tract weights and greater gut fill (Kyriazakis and Emmans, 1995;
Jørgensen et al., 1996). It was expected that the increased weight of the large intestine would
correspond with a greater amount of GLP-2R in rectum tissue, but this was not observed.
Glucago-like peptide – 2 receptor is increased in the presence of increased GLP-2, which is a
pleiotropic peptide that has been shown to increase secretion with increased carbohydrate intake
and restore growth of intestinal mucosa by increasing cell proliferation and decreasing apoptosis
(Burrin et al., 2003; Barrett, 2012). Relative expression of GLP-2R was increased in liver tissue
of pigs fed HF diets, and we speculate that portal blood may contain GLP-2, which the liver may

139
use to signal the gastrointestinal tract to increase in size, but further research is necessary to
determine the role between HF diets, gastrointestinal tract weight, and GLP-2.
The backfat thickness and LM marbling of pigs fed LF diets was greater compared with
pigs fed HF diets, indicating an increased amount of available energy that was deposited as lipid.
The increased energy may be attributed to the greater amount of NE in LF diets compared with
HF diets. However, fat-free lean, expressed as both kg and as a percentage of BW, was not
affected by dietary fiber concentration, indicating that protein deposition was not limited in HF
diets. The diets were not isonitrogenous; however, they were formulated to meet or exceed the
requirements at each phase of pig growth performance for SID indispensable AA. Taken
together, the results indicate that the NRC (2012) values used to formulate the diets based on NE
and SID indispensable AA of ingredients were adequate.
The addition of DFM to both LF and HF diets fed to pigs did not affect fat-free lean,
expressed in kg, but decreased the fat-free lean, expressed as a percentage of BW. This is an
indication that DFM addition did not reduce protein deposition, but increased lipid deposition.
Therefore, the addition of DFM made more energy available to the pig to be deposited as lipid.
We hypothesized that the addition of the 3-strain Bacillus-based DFM to diets, especially
HF diets, would increase hindgut fermentation, thereby increasing the quantity of VFA and
energy available to the pig. Total short-chain fatty acid concentration was decreased in cecal
digesta of pigs fed diets containing DFM; however, the concentration of total short-chain fatty
acids was increased in rectal contents of pigs fed diets containing DFM, indicating that the DFM
may have a more beneficial effect in the colon of the pig rather than the cecum. Therefore, this
may be the reason for the decreased fat-free lean percentage of DFM-fed pigs.

140
Another interesting finding was that LF-fed pigs had increased concentrations of VFA in
both cecal digesta and rectal contents compared with HF fed pigs, indicating that the corn-
soybean meal-based diet is more fermentable compared with the corn-soybean meal-DDGS-
wheat middlings based HF diet. However, the data could also suggest that absorption of VFA
was greater in the cecum of pigs fed HF diets compared with LF diets. In corroboration of the
previous statement, the expression of MCT1 and CD147 in cecal tissue of HF-fed pigs was
increased compared with LF-fed pigs. Previous research indicated that the abundance of MCT1
and CD147 correspond with increased concentrations of VFA in order to increase the absorption
of VFA (Metzler-Zebeli et al., 2012). These results indicate that LF-fed pigs had more available
NE, not only because the corn-soybean meal-based diet was more digestible, but also because it
was more fermentable and VFA was deposited as lipid, yielding a greater backfat thickness and
marbling.
CONCLUSION
In conclusion, pigs fed HF diets were able to maintain overall ADG, G:F (expressed as
kg/Mcal NE), and final BW compared with their LF-fed counterparts due to their ability to
increase ADFI and were not affected by gut fill. Pigs fed LF diets had a greater amount of energy
available, both from a more digestible and fermentable diet and, therefore, had increased lipid
deposition as indicated by increased backfat thickness and marbling. Pigs fed HF diets had a
reduced dressing percentage compared with LF-fed pigs due to their increased weight of the
large intestine and increased gut fill. The addition of DFM to both LF and HF diets tended to
increase total VFA concentration in rectal contents, which increased available energy to the pig
leading to a decreased fat-free lean percentage. Therefore, it is recommended that a 3-strain

141
Bacillus-based DFM be added to growing-finishing pig diets in order to decrease fat-free lean
percentage.

142
LITERATURE CITED
AOAC International. 2007. Official Methods of Analysis of AOAC Int. 18th ed. Rev. 2. W.
Hortwitz and G. W. Latimer Jr., ed. AOAC Int., Gaithersburg, MD.
Apgar, G. A., E. T. Kornegay, M. D. Lindemann, and C. M. Wood. 1993. The effect of feeding
various levels of Bifidobacterium globosum A on the performance, gastrointestinal
measurements, and immunity of weanling pigs and on the performance and carcass
measurements of growing-finishing pigs. J. Anim. Sci. 71:2173-2179.
Barcroft, J., R. A. McAnally, and A. T. Phillipson. 1944. Absorption of VFA from the
alimentary tract of the sheep and other animals. J. Exp. Biol. 20:120-132.
Barrett, E. J. 2012. The endocrine pancreas. Updated 2nd edition. In: W. F. Boron and E. L.
Boulpaep, editors, Medical Physiology: A Cellular and Molecular Approach. Saunders
Elsevier Inc., Philadelphia, PA. p. 1089-1092.
Burrin, D. G., B. Stoll, and X. Guan. 2003. Glucagon-like peptide-2 functions in domestic
animals. Domest. Anim. Endocrinol. 24:103-122.
Beauchemin, K. A., W. Z. Yang, D. P. Morgavi, G. R. Ghorbani, W. Kautz, and J. A. Z. Leedle.
2003. Effects of bacterial direct-fed microbials and yeast on site and extent of digestion,
blood chemistry, and subclinical ruminal acidosis in feedlot cattle. J. Anim. Sci. 81:1628-
1640.
Bindelle, J., P. Leterme, and A. Buldgen. 2008. Nutritional and environmental consequences of
dietary fibre in pig nutrition: a review. Biotechnol. Agron. Soc. Environ. 12:69-80.
Boler, D. D., C. L. Puls, D. L. Clark, M. Ellis, A. L. Schroeder, P. D. Matzat, J. Killefer, F. K.
McKeith, and A. C. Dilger. 2014. Effects of immunological castration (Improvest) on

143
changes in dressing percentage and carcass characteristics of finishing pigs. J. Anim. Sci.
92:359-368.
Cheeson, A. 2006. Dietary fiber. 2nd edition. In: A. M. Alistair, G. O. Philips, and P. A.
Williams, editors, Food Polysaccharides and Their Applications. CRC Press, Boca Raton,
FL. p. 629-663.
Cromwell, G. L., T. R. Cline, J. D. Crenshaw, T. D. Crenshaw, R. A. Easter, R. C. Ewan, C. R.
Hamilton, G. M. Hill, A. J. Lewis, D. C. Mahan, J. L. Nelssen, J. E. Pettigrew, T. L.
Veum, and J. T. Yen. 2000. Variability among sources and laboratories in analyses of
wheat middlings. J. Anim. Sci. 78:2652-2658.
Cromwell, G. L. 2013. Feed additives in swine diets. In: L. I. Chiba, ed., Sustainable Swine
Nutrition. 1st ed. John Wiley & Sons, Inc., Ames, IA. p. 302-304.
Davis, M. E., T. Parrott, D. C. Brown, B. Z. de Rodas, Z. B. Johnson, C. V. Maxwell, and T.
Rehberger. 2008. Effect of a Bacillus-based direct-fed microbial feed supplement on
growth performance and pen cleaning characteristics of growing-finishing pigs. J. Anim.
Sci. 86:1459-1467.
De Jong, J. A., J. M. DeRouchey, M. D. Tokach, S. S. Dritz, and R. D. Goodband. 2014. Effects
of dietary wheat middlings, corn dried distillers grains with solubles, and net energy
formulation on nursery pig performance. J. Anim. Sci. 92:3471-3481.
de Lange, C. F. M., J. Pluske, J. Gong, and C. M. Nyachoti. 2010. Strategic use of feed
ingredients and feed additives to stimulate gut health and development in young pigs.
Livestock Sci. 134:124-134.

144
de Lange, C. F. M., W. C. Sauer, R. Mosenthin and W. B. Souffrant. 1989. The effect of feeding
different protein-free diets on the recovery and amino acid composition of endogenous
protein collected from the distal ileum and feces in pigs. J. Anim. Sci. 67:746-754.
Dikeman, C. L., and G. C. Fahey, Jr. 2006. Viscosity as related to dietary fiber: a review. Crit.
Rev. food Sci. Nutr. 46:649-663.
Eigel, W. N. 1989. Ability of probiotics to protect weanling pigs against challenge with
enterotoxigenic E. coli. p.10-19 in Proc. Chr. Hansen Biosystems Tech. Conf., San
Antonio, TX.
Erwin, E. A., G. J. Marco, and E. M. Emery. 1961. Volatile fatty acid analyses of blood and
rumen fluid by gas chromatography. J. Dairy Sci. 44:1768-1771.
FAO/WHO (Food and Agriculture Organization/World Health Organization). 2001. Health and
nutritional properties of probiotics in food including powder milk with live lactic acid
bacteria. Report of a Joint FAO/WHO Expert Consultation on Evaluation of Health and
Nutritional Properties of Probiotics in Food Including Powder Milk with Live Lactic
Acid Bacteria. Córdoba, Argentina. p. 1-33.
Ghorbani, G. R., D. P. Morgavi, K. A. Beauchemin, and J. A. Z. Leedle. 2002. Effects of
bacterial direct-fed microbials on ruminal fermentation, blood variables, and the
microbial populations of feedlot cattle. J. Anim. Sci. 80:1977-1986.
Guan, X., H. E. Karpen, J. Stephens, J. T. Bukowski, S. Niu, G. Zhang, B. Stoll, M. J. Finegold,
J. J. Holst, D. L. Hadsell, B. L. Nichols, and D. G. Burrin. 2006. GLP-2 receptor localizes
to enteric neurons and endocrine cells expressing vasoactive peptides and mediates
increased blood flow. Gastroenterol. 130:150-164.
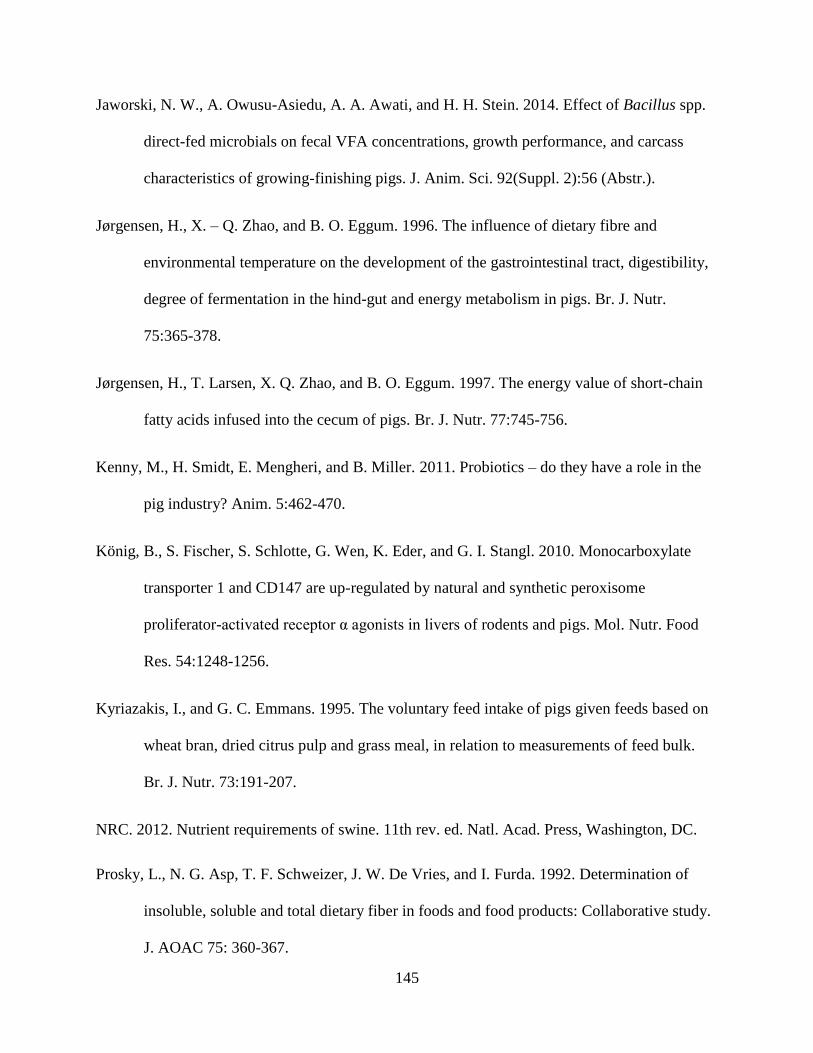
145
Jaworski, N. W., A. Owusu-Asiedu, A. A. Awati, and H. H. Stein. 2014. Effect of Bacillus spp.
direct-fed microbials on fecal VFA concentrations, growth performance, and carcass
characteristics of growing-finishing pigs. J. Anim. Sci. 92(Suppl. 2):56 (Abstr.).
Jørgensen, H., X. – Q. Zhao, and B. O. Eggum. 1996. The influence of dietary fibre and
environmental temperature on the development of the gastrointestinal tract, digestibility,
degree of fermentation in the hind-gut and energy metabolism in pigs. Br. J. Nutr.
75:365-378.
Jørgensen, H., T. Larsen, X. Q. Zhao, and B. O. Eggum. 1997. The energy value of short-chain
fatty acids infused into the cecum of pigs. Br. J. Nutr. 77:745-756.
Kenny, M., H. Smidt, E. Mengheri, and B. Miller. 2011. Probiotics – do they have a role in the
pig industry? Anim. 5:462-470.
König, B., S. Fischer, S. Schlotte, G. Wen, K. Eder, and G. I. Stangl. 2010. Monocarboxylate
transporter 1 and CD147 are up-regulated by natural and synthetic peroxisome
proliferator-activated receptor α agonists in livers of rodents and pigs. Mol. Nutr. Food
Res. 54:1248-1256.
Kyriazakis, I., and G. C. Emmans. 1995. The voluntary feed intake of pigs given feeds based on
wheat bran, dried citrus pulp and grass meal, in relation to measurements of feed bulk.
Br. J. Nutr. 73:191-207.
NRC. 2012. Nutrient requirements of swine. 11th rev. ed. Natl. Acad. Press, Washington, DC.
Prosky, L., N. G. Asp, T. F. Schweizer, J. W. De Vries, and I. Furda. 1992. Determination of
insoluble, soluble and total dietary fiber in foods and food products: Collaborative study.
J. AOAC 75: 360-367.

146
Robertson, M. D. 2007. Metabolic cross talk between the colon and the periphery: Implications
for insulin sensitivity. Proc. Nutr. Soc. 66:351-361.
Robertson, J. A., F. D. de Monredon, P. Dysseler, F. Guillon, R. Amado, and J. Thibault. 2000.
Hydration properties of dietary fibre and resistant starch: a European collaborative study.
Lebensm.-Wiss. u.-Technol. 33:72-79.
Serena, A., and K. E. Bach Knudsen. 2007. Chemical and physicochemical characterization of
co-products from the vegetable food and agro industries. Anim. Feed Sci. Technol.
139:109-124.
Schreier, H. J. 1993. Biosynthesis of glutamine and glutamate and the assimilation of ammonia.
p. 281-285 in Bacillus Subtilis and Other Gram-Positive Bacteria. A. L. Sonenshein, J. A.
Hoch, and R. Losick, ed. Am. Soc. Microbiol., Washington, DC.
Shulman, G. I., and K. F. Petersen. 2012. Metabolism. Updated 2nd edition. In: W. F. Boron and
E. L. Boulpaep, editors, Medical Physiology: A Cellular and Molecular Approach.
Saunders Elsevier Inc., Philadelphia, PA. p. 1218-1220.
Smith, H. W., and S. Halls. 1968. The production of oedema disease and diarrhoea in weaned
pigs by the oral administration of Escherichia coli: factors that influence the course of the
experimental disease. Med. Microb. 1:45-59.
Spencer, J. D., G. I. Petersen, A. M. Gaines, and N. R. Augsburger. 2007. Evaluation of different
strategies for supplementing distillers dried grains with solubles (DDGS) to nursery pig
diets. J. Anim. Sci. 85(Suppl. 2):96-97. (Abstr.).

147
Stavric, S., and E. T. Kornegay. 1995. Microbial probiotics for pigs and poulty. In: R. J. Wallace
and A. Chesson, editors., Biotechnology in Animal Feeds and Feeding. 1st ed. VCH
Verlagsgesellscharft, Weinheim, Germany. p. 205-231.
Stein, H. H., and G. C. Shurson. 2009. Board-Invited Review: The use and application of
distillers dried grains with solubles (DDGS) in swine diets. J. Anim. Sci. 87:1292-1303.
Swyers, K. L., A. O. Burk, T. G. Hartsock, E. M. Ungerfeld, and J. L. Shelton. 2008. Effects of
direct-fed microbial supplementation on digestibility and fermentation end products in
horses fed low- and high-starch concentrates. J. Anim. Sci. 86:2596-2608.
Vigors, S., T. Sweeney, C. J. O’Shea, J. A. Browne, and J. V. O’Doherty. 2014. Improvements
in growth performance, bone mineral status and nutrient digestibility in pigs following
the dietary inclusion of phytase are accompanied by modifications in intestinal nutrient
transporter gene expression. Br. J. Nutr. 112:688-697.

148
TABLES
Table 5.1. Ingredient, calculated, and analyzed composition of grower diets (as-fed basis)
Dietary fiber concentration Low High
Direct-fed microbial - + - +
Ingredient, %
Corn 74.08 74.02 40.40 40.34
Soybean meal, 48% CP 22.00 22.00 16.00 16.00
DDGS1 - - 30.00 30.00
Wheat middlings - - 10.00 10.00
Choice white grease 1.00 1.00 1.00 1.00
Limestone 1.15 1.15 1.55 1.55
Dicalcium P 0.60 0.60 - -
Lys HCl 0.34 0.34 0.34 0.34
DL-Met 0.04 0.04 - -
Thr 0.08 0.08 - -
Salt 0.40 0.40 0.40 0.40
Vitamin-mineral premix2 0.30 0.30 0.30 0.30
Phytase 0.01 0.01 0.01 0.01
DFM mixture3 - 0.06 - 0.06
Calculated composition4
NE, kcal/kg 2,492 2,491 2,381 2,380
CP, % 16.6 16.6 20.7 20.7
SID5 Lys, % 0.98 0.98 0.98 0.98
Ca, % 0.65 0.65 0.66 0.66
STTD6 P, % 0.23 0.23 0.26 0.26
Analyzed composition
GE, kcal/kg 3,817 3,882 4,096 4,089
DM, % 87.8 87.6 87.6 87.5
Ash, % 5.3 5.2 5.0 5.5
ADF, % 5.0 6.0 6.4 8.0
NDF, % 14.4 14.2 17.8 17.5
Insoluble dietary fiber, % 16.8 17.5 24.4 21.6
Soluble dietary fiber, % 1.0 1.0 1.5 1.5
Total dietary fiber, % 17.8 18.5 25.9 23.1 1DDGS = distillers dried grains with solubles. 2Provided the following quantities of vitamins and micro-minerals per kilogram of complete diet: vitamin
A as retinyl acetate, 11,136 IU; vitamin D3 as cholecalciferol, 2,208 IU; vitamin E as DL-alpha tocopheryl acetate,
66 IU; vitamin K as menadione dimethylprimidinol bisulfite, 1.42 mg; thiamin as thiamine mononitrate, 0.24 mg;
riboflavin, 6.59 mg; pyridoxine as pyridoxine hydrochloride,0.24 mg; vitamin B12, 0.03 mg; D-pantothenic acid as
D-calcium pantothenate, 23.5 mg; niacin, 44.1 mg; folic acid, 1.59 mg; biotin, 0.44 mg; Cu, 20 mg as copper sulfate
and copper chloride; Fe, 126 mg as ferrous sulfate; I, 1.26 mg as ethylenediamine dihydriodide; Mn, 60.2 mg as
manganese sulfate; Se, 0.3 mg as sodium selenite and selenium yeast; and Zn, 125.1 mg as zinc sulfate. 3DFM = direct-fed microbial mixture consists of 30 g of DFM mixed with 270 g of corn. 4Calculated from NRC (2012) values. 5SID = standardized ileal digestible. 6STTD = standardized total tract digestible.

149
Table 5.2. Ingredient, calculated, and analyzed composition of early-finisher diets (as-fed basis)
Dietary fiber concentration Low High
Direct-fed microbial - + - +
Ingredient, %
Corn 80.00 79.94 46.70 46.64
Soybean meal, 48% CP 16.50 16.50 10.00 10.00
DDGS1 - - 30.00 30.00
Wheat middlings - - 10.00 10.00
Choice white grease 1.00 1.00 1.00 1.00
Limestone 1.10 1.10 1.30 1.30
Dicalcium P 0.35 0.35 - -
Lys HCl 0.27 0.27 0.29 0.29
DL-Met 0.01 0.01 - -
Thr 0.06 0.06 - -
Salt 0.40 0.40 0.40 0.40
Vitamin-mineral premix2 0.30 0.30 0.30 0.30
Phyase 0.01 0.01 0.01 0.01
DFM mixture3 - 0.06 - 0.06
Calculated composition4
NE, kcal/kg 2,536 2,534 2,424 2,423
CP, % 14.5 14.5 18.4 18.4
SID5 Lys, % 0.79 0.79 0.79 0.79
Ca, % 0.56 0.56 0.55 0.55
STTD6 P, % 0.18 0.18 0.25 0.25
Analyzed composition
GE, kcal/kg 3,990 3,906 3,844 3,920
DM, % 87.4 87.3 86.3 86.3
Ash, % 3.6 3.8 4.7 4.7
ADF, % 5.3 5.3 9.5 8.7
NDF, % 11.7 10.6 20.7 20.3
Insoluble dietary fiber, % 13.9 14.9 22.2 22.3
Soluble dietary fiber, % 1.0 1.0 1.0 1.0
Total dietary fiber, % 14.9 15.9 23.2 23.3 1DDGS = distillers dried grains with solubles. 2Provided the following quantities of vitamins and micro-minerals per kilogram of complete diet:
vitamin A as retinyl acetate, 11,136 IU; vitamin D3 as cholecalciferol, 2,208 IU; vitamin E as DL-alpha
tocopheryl acetate, 66 IU; vitamin K as menadione dimethylprimidinol bisulfite, 1.42 mg; thiamin as
thiamine mononitrate, 0.24 mg; riboflavin, 6.59 mg; pyridoxine as pyridoxine hydrochloride,0.24 mg;
vitamin B12, 0.03 mg; D-pantothenic acid as D-calcium pantothenate, 23.5 mg; niacin, 44.1 mg; folic
acid, 1.59 mg; biotin, 0.44 mg; Cu, 20 mg as copper sulfate and copper chloride; Fe, 126 mg as ferrous
sulfate; I, 1.26 mg as ethylenediamine dihydriodide; Mn, 60.2 mg as manganese sulfate; Se, 0.3 mg as
sodium selenite and selenium yeast; and Zn, 125.1 mg as zinc sulfate. 3DFM = direct-fed microbial mixture consists of 30 g of DFM mixed with 270 g of corn. 4Calculated from NRC (2012) values. 5SID = standardized ileal digestible. 6STTD = standardized total tract digestible.

150
Table 5.3. Ingredient, calculated, and analyzed composition of late-finisher diets (as-fed basis)
Dietary fiber concentration Low High
Direct-fed microbial - + - +
Ingredient, %
Corn 82.81 82.75 50.83 50.77
Soybean meal, 48% CP 14.00 14.00 6.00 6.00
DDGS1 - - 30.00 30.00
Wheat middlings - - 10.00 10.00
Choice white grease 1.00 1.00 1.00 1.00
Limestone 1.00 1.00 1.20 1.20
Dicalcium P 0.25 0.25 - -
Lys HCl 0.20 0.20 0.26 0.26
Thr 0.03 0.03 - -
Salt 0.40 0.40 0.40 0.40
Vitamin-mineral premix2 0.30 0.30 0.30 0.30
Phytase 0.01 0.01 0.01 0.01
DFM mixture3 - 0.06 - 0.06
Calculated composition4
NE, kcal/kg 2,558 2,557 2,451 2,450
CP, % 13.5 13.5 16.8 16.8
SID5 Lys, % 0.68 0.68 0.67 0.67
Ca, % 0.49 0.49 0.50 0.50
STTD6 P, % 0.16 0.16 0.24 0.24
Analyzed composition
GE, kcal/kg 3,848 3,988 4,141 4,107
DM, % 86.5 87.2 87.5 88.8
Ash, % 3.4 3.6 4.5 5.0
ADF, % 3.8 4.0 6.5 6.6
NDF, % 12.0 10.7 17.3 16.1
Insoluble dietary fiber, % 16.6 17.2 20.9 20.7
Soluble dietary fiber, % 1.0 2.9 1.6 2.3
Total dietary fiber, % 17.6 20.1 22.5 23.1 1DDGS = distillers dried grains with solubles. 2Provided the following quantities of vitamins and micro-minerals per kilogram of complete diet:
vitamin A as retinyl acetate, 11,136 IU; vitamin D3 as cholecalciferol, 2,208 IU; vitamin E as DL-alpha
tocopheryl acetate, 66 IU; vitamin K as menadione dimethylprimidinol bisulfite, 1.42 mg; thiamin as
thiamine mononitrate, 0.24 mg; riboflavin, 6.59 mg; pyridoxine as pyridoxine hydrochloride,0.24 mg;
vitamin B12, 0.03 mg; D-pantothenic acid as D-calcium pantothenate, 23.5 mg; niacin, 44.1 mg; folic
acid, 1.59 mg; biotin, 0.44 mg; Cu, 20 mg as copper sulfate and copper chloride; Fe, 126 mg as ferrous
sulfate; I, 1.26 mg as ethylenediamine dihydriodide; Mn, 60.2 mg as manganese sulfate; Se, 0.3 mg as
sodium selenite and selenium yeast; and Zn, 125.1 mg as zinc sulfate. 3DFM = direct-fed microbial mixture consists of 30 g of DFM mixed with 270 g of corn. 4Calculated from NRC (2012) values. 5SID = standardized ileal digestible. 6STTD = standardized total tract digestible.

151
Table 5.4. Gene-specific primer sequences
Gene Acc. No Forward primer (5’-3’) Reverse primer (5’-3’) Reference
MUC21 AK231524 CAACGGCCTCTCCTTCTCTGT GCCACACTGGCCCTTTGT Leonard et al.
(2011)
MCT12 AM286425 GGTGGAGGTCCTATCAGCAG TGAAGGCAAGCCCAAGAC Metzler-Zebeli et
al. (2012)
CD1473 NM_001123086 CCTCGGAGACCAAGACAGAG TCATTCACGTGGTGTCCACT König et al. (2010)
PCK14 NM_001123158.1 CCCTGCCTTTGAAAAAGCCC GGAGATGATTTCTCGGCGGT Qu et al. (2015)
GLP-2R5 NM_001246266.1 TGTCCTACGTGTCGGAGATGTC TAATTGGCGCCCACGAA Guan et al. (2006) 1MUC2 = mucin 2. 2MCT1 = monocarboxylate transporter 1.
3CD147 = basigin.
4PCK1 = phosphoenolpyruvate carboxykinase 1.
5GLP-2R = glucagon-like peptide-2 receptor.

152
Table 5.5. Analyzed energy and nutrient composition of main ingredients (as-fed basis)
Ingredient
Item Corn Soybean meal DDGS1 Wheat middlings
GE, kcal/kg 3,773 4,175 4,421 4,027
DM, % 84.5 88.4 86.9 86.7
Ash, % 1.1 6.1 4.5 4.8
ADF, % 3.8 6.1 11.6 10.8
NDF, % 12.2 7.0 24.1 38.4
Insoluble dietary fiber, % 12.1 15.0 29.0 37.1
Soluble dietary fiber, % 0.6 1.4 1.9 6.3
Total dietary fiber, % 12.7 17.1 30.9 43.4 1DDGS = distillers dried grains with solubles.

153
Table 5.6. Physicochemical characteristics of diets and ingredients
Item Water binding capacity, g/g Bulk density, g/L
Ingredients
Corn 0.97 683.0
Soybean meal 2.69 807.3
DDGS1 1.74 601.0
Wheat middlings 3.11 363.7
Grower diets
Low fiber 1.26 729.3
Low fiber + DFM2 1.29 727.7
High fiber 1.58 639.3
High fiber + DFM 1.54 654.0
Early-finisher diets
Low fiber 1.30 687.7
Low fiber + DFM 1.27 696.3
High fiber 1.55 578.7
High fiber + DFM 1.53 580.0
Late-finisher diets
Low fiber 1.16 738.3
Low fiber + DFM 1.20 717.3
High fiber 1.46 638.7
High fiber + DFM 1.41 652.3 1DDGS = distillers dried grains with solubles. 2DFM = direct-fed microbial.
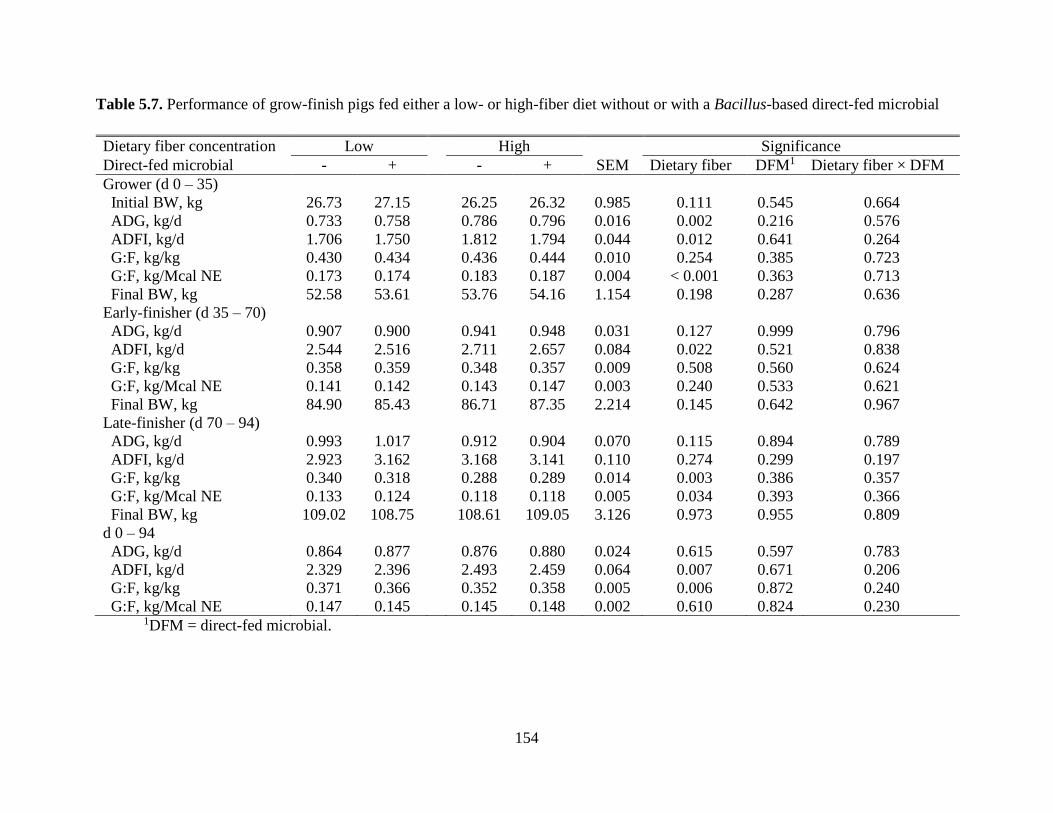
154
Table 5.7. Performance of grow-finish pigs fed either a low- or high-fiber diet without or with a Bacillus-based direct-fed microbial
1DFM = direct-fed microbial.
Dietary fiber concentration Low High Significance
Direct-fed microbial - + - + SEM Dietary fiber DFM1 Dietary fiber × DFM
Grower (d 0 – 35)
Initial BW, kg 26.73 27.15 26.25 26.32 0.985 0.111 0.545 0.664
ADG, kg/d 0.733 0.758 0.786 0.796 0.016 0.002 0.216 0.576
ADFI, kg/d 1.706 1.750 1.812 1.794 0.044 0.012 0.641 0.264
G:F, kg/kg 0.430 0.434 0.436 0.444 0.010 0.254 0.385 0.723
G:F, kg/Mcal NE 0.173 0.174 0.183 0.187 0.004 < 0.001 0.363 0.713
Final BW, kg 52.58 53.61 53.76 54.16 1.154 0.198 0.287 0.636
Early-finisher (d 35 – 70)
ADG, kg/d 0.907 0.900 0.941 0.948 0.031 0.127 0.999 0.796
ADFI, kg/d 2.544 2.516 2.711 2.657 0.084 0.022 0.521 0.838
G:F, kg/kg 0.358 0.359 0.348 0.357 0.009 0.508 0.560 0.624
G:F, kg/Mcal NE 0.141 0.142 0.143 0.147 0.003 0.240 0.533 0.621
Final BW, kg 84.90 85.43 86.71 87.35 2.214 0.145 0.642 0.967
Late-finisher (d 70 – 94)
ADG, kg/d 0.993 1.017 0.912 0.904 0.070 0.115 0.894 0.789
ADFI, kg/d 2.923 3.162 3.168 3.141 0.110 0.274 0.299 0.197
G:F, kg/kg 0.340 0.318 0.288 0.289 0.014 0.003 0.386 0.357
G:F, kg/Mcal NE 0.133 0.124 0.118 0.118 0.005 0.034 0.393 0.366
Final BW, kg 109.02 108.75 108.61 109.05 3.126 0.973 0.955 0.809
d 0 – 94
ADG, kg/d 0.864 0.877 0.876 0.880 0.024 0.615 0.597 0.783
ADFI, kg/d 2.329 2.396 2.493 2.459 0.064 0.007 0.671 0.206
G:F, kg/kg 0.371 0.366 0.352 0.358 0.005 0.006 0.872 0.240
G:F, kg/Mcal NE 0.147 0.145 0.145 0.148 0.002 0.610 0.824 0.230

155
Table 5.8. Carcass characteristics of finishing pigs fed either a low- or high-fiber diet without or with a Bacillus-based direct-fed
microbial
Dietary fiber concentration Low High Significance
Direct-fed microbial - + - + SEM Dietary fiber DFM1 Dietary fiber × DFM
Ultrasound2
Backfat thickness, cm 1.56 1.58 1.43 1.46 0.08 0.022 0.611 0.985
Longissimus muscle depth, cm 4.87 5.03 5.05 5.05 0.09 0.296 0.420 0.408
Longissimus muscle area, sq. cm 40.69 41.49 40.66 41.08 1.46 0.779 0.434 0.812
Predicted carcass lean weight3, kg 45.58 46.09 45.93 46.17 1.26 0.746 0.561 0.831
Fat-free lean4, % 54.20 52.30 54.65 52.16 1.10 0.891 0.055 0.793
Meat science laboratory5
Slaughter wt, kg 108.48 112.58 108.30 114.69 3.64 0.713 0.053 0.662
Carcass composition
HCW, kg 84.57 88.36 84.12 88.70 2.87 0.978 0.046 0.844
Dressing, % 77.99 78.49 77.68 77.36 0.27 0.005 0.693 0.095
10th rib backfat, cm 1.60 1.93 1.45 1.87 0.16 0.480 0.018 0.771
Longissimus muscle area, sq. cm 48.29 49.72 48.85 48.02 2.08 0.712 0.846 0.466
Fat-free lean, kg 47.17 47.94 47.67 47.99 1.28 0.761 0.548 0.801
Fat-free lean6, % 56.02 54.40 56.67 54.18 0.89 0.810 0.028 0.631
Muscle quality
Subjective color7 2.5 2.4 2.6 2.5 0.17 0.501 0.501 1.00
Marbling8 1.4 1.4 1.1 1.0 0.13 0.008 0.692 0.692
Firmness9 2.5 2.2 1.5 2.4 0.23 0.090 0.200 0.013
24-h pH, Longissimus muscle 5.54 5.55 5.57 5.65 0.05 0.023 0.125 0.222
48-h drip loss, % 5.45 6.76 5.42 5.18 1.00 0.233 0.426 0.250
Longissimus muscle color, L*10 50.07 52.33 48.92 49.51 1.41 0.007 0.046 0.230
Longissimus muscle color, a*10 7.71 8.50 8.02 6.49 0.32 0.010 0.242 0.001
Longissimus muscle color, b*10 3.00 4.50 3.12 2.61 0.29 0.004 0.100 0.002
Backfat color
Fat color, L*10 74.91 75.16 73.59 74.38 0.57 0.032 0.269 0.565
Fat color, a*10 3.86 4.01 5.10 4.10 0.36 0.067 0.239 0.112
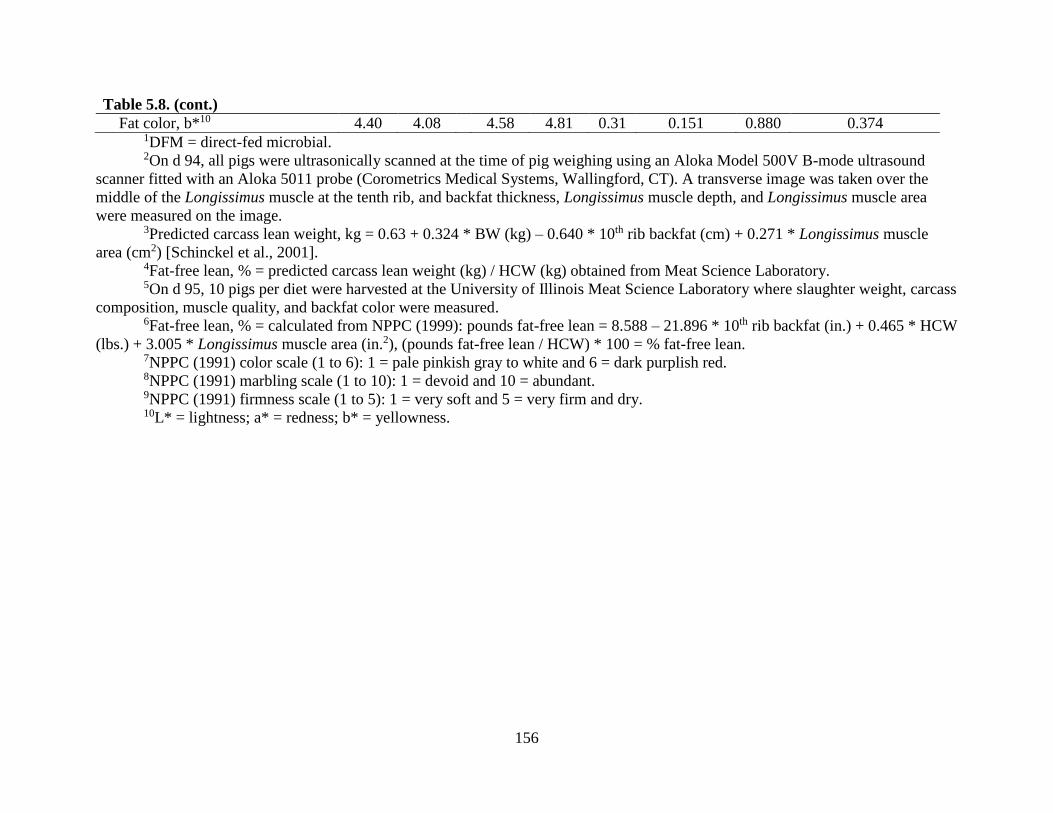
156
Table 5.8. (cont.)
Fat color, b*10 4.40 4.08 4.58 4.81 0.31 0.151 0.880 0.374 1DFM = direct-fed microbial. 2On d 94, all pigs were ultrasonically scanned at the time of pig weighing using an Aloka Model 500V B-mode ultrasound
scanner fitted with an Aloka 5011 probe (Corometrics Medical Systems, Wallingford, CT). A transverse image was taken over the
middle of the Longissimus muscle at the tenth rib, and backfat thickness, Longissimus muscle depth, and Longissimus muscle area
were measured on the image.
3Predicted carcass lean weight, kg = 0.63 + 0.324 * BW (kg) – 0.640 * 10th rib backfat (cm) + 0.271 * Longissimus muscle
area (cm2) [Schinckel et al., 2001].
4Fat-free lean, % = predicted carcass lean weight (kg) / HCW (kg) obtained from Meat Science Laboratory.
5On d 95, 10 pigs per diet were harvested at the University of Illinois Meat Science Laboratory where slaughter weight, carcass
composition, muscle quality, and backfat color were measured.
6Fat-free lean, % = calculated from NPPC (1999): pounds fat-free lean = 8.588 – 21.896 * 10th rib backfat (in.) + 0.465 * HCW
(lbs.) + 3.005 * Longissimus muscle area (in.2), (pounds fat-free lean / HCW) * 100 = % fat-free lean.
7NPPC (1991) color scale (1 to 6): 1 = pale pinkish gray to white and 6 = dark purplish red.
8NPPC (1991) marbling scale (1 to 10): 1 = devoid and 10 = abundant.
9NPPC (1991) firmness scale (1 to 5): 1 = very soft and 5 = very firm and dry.
10L* = lightness; a* = redness; b* = yellowness.
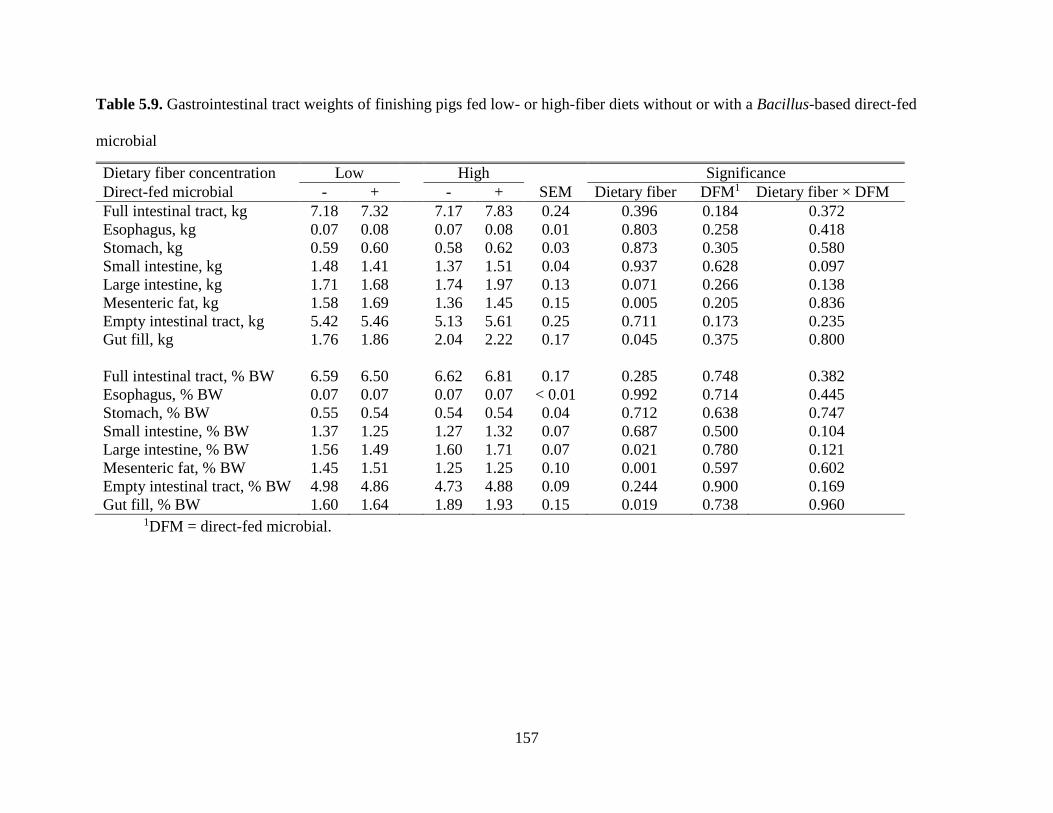
157
Table 5.9. Gastrointestinal tract weights of finishing pigs fed low- or high-fiber diets without or with a Bacillus-based direct-fed
microbial
1DFM = direct-fed microbial.
Dietary fiber concentration Low High Significance
Direct-fed microbial - + - + SEM Dietary fiber DFM1 Dietary fiber × DFM
Full intestinal tract, kg 7.18 7.32 7.17 7.83 0.24 0.396 0.184 0.372
Esophagus, kg 0.07 0.08 0.07 0.08 0.01 0.803 0.258 0.418
Stomach, kg 0.59 0.60 0.58 0.62 0.03 0.873 0.305 0.580
Small intestine, kg 1.48 1.41 1.37 1.51 0.04 0.937 0.628 0.097
Large intestine, kg 1.71 1.68 1.74 1.97 0.13 0.071 0.266 0.138
Mesenteric fat, kg 1.58 1.69 1.36 1.45 0.15 0.005 0.205 0.836
Empty intestinal tract, kg 5.42 5.46 5.13 5.61 0.25 0.711 0.173 0.235
Gut fill, kg 1.76 1.86 2.04 2.22 0.17 0.045 0.375 0.800
Full intestinal tract, % BW 6.59 6.50 6.62 6.81 0.17 0.285 0.748 0.382
Esophagus, % BW 0.07 0.07 0.07 0.07 < 0.01 0.992 0.714 0.445
Stomach, % BW 0.55 0.54 0.54 0.54 0.04 0.712 0.638 0.747
Small intestine, % BW 1.37 1.25 1.27 1.32 0.07 0.687 0.500 0.104
Large intestine, % BW 1.56 1.49 1.60 1.71 0.07 0.021 0.780 0.121
Mesenteric fat, % BW 1.45 1.51 1.25 1.25 0.10 0.001 0.597 0.602
Empty intestinal tract, % BW 4.98 4.86 4.73 4.88 0.09 0.244 0.900 0.169
Gut fill, % BW 1.60 1.64 1.89 1.93 0.15 0.019 0.738 0.960

158
Table 5.10. pH and short- and branched-chain fatty acid concentrations, expressed as µmol/g DM basis, in cecal and rectal contents of
pigs fed either a low- or high-fiber diet without or with a Bacillus-based direct-fed microbial
1DFM = direct-fed microbial. 2SCFA = short-chain fatty acids. 3BCFA = branched-chain fatty acids.
Dietary fiber concentration Low High Significance
Direct-fed microbial - + - + SEM Dietary fiber DFM1 Dietary fiber × DFM
Ileal digesta pH 7.56 7.32 7.25 7.48 0.45 0.296 0.964 0.006
Cecal digesta
pH 5.93 6.72 6.46 6.52 0.12 0.167 0.001 0.004
Acetate 88.81 74.37 74.78 71.47 4.56 0.046 0.037 0.183
Propionate 25.99 20.35 21.14 19.39 1.19 0.006 0.001 0.056
Butyrate 14.80 10.54 12.62 11.70 1.66 0.761 0.128 0.322
Total SCFA2 129.59 103.53 108.55 102.56 7.63 0.087 0.016 0.118
Valerate 2.32 2.10 2.48 2.26 0.16 0.323 0.197 0.987
Isovalerate 2.46 1.95 2.33 2.52 0.23 0.336 0.496 0.140
Isobutyrate 1.73 1.38 1.67 1.89 0.18 0.218 0.708 0.115
Total BCFA3 6.27 5.30 6.48 6.68 0.50 0.128 0.451 0.255
SCFA:BCFA 22.56 20.44 18.10 14.92 1.93 0.014 0.183 0.792
Rectal contents
pH 6.25 6.23 6.36 6.28 0.18 0.349 0.538 0.725
Acetate 75.06 91.08 62.78 67.52 7.02 0.001 0.035 0.241
Propionate 20.67 24.44 16.83 17.45 1.83 0.005 0.237 0.394
Butyrate 14.78 19.46 12.16 10.75 1.96 0.007 0.411 0.130
Total SCFA 104.45 134.98 91.77 95.25 8.36 0.003 0.047 0.110
Valerate 2.65 3.26 2.14 1.91 0.32 0.007 0.561 0.201
Isovalerate 3.37 4.16 2.64 2.72 0.30 0.001 0.156 0.248
Isobutyrate 2.25 2.80 1.87 1.94 0.22 0.007 0.158 0.262
Total BCFA 8.13 10.22 6.65 6.57 0.80 0.003 0.218 0.184
SCFA:BCFA 14.30 13.54 14.18 14.79 1.01 0.511 0.930 0.427

159
Table 5.11. Plasma urea nitrogen (PUN) and plasma concentration of tumor necrosis factor-alpha (TNF-α) of pigs fed either a low- or
high-fiber diet without or with a Bacillus-based direct-fed microbial
1Effect of d (P ≤ 0.05) was observed. 2DFM = direct-fed microbial.
Dietary fiber concentration Low High Significance1
Direct-fed microbial - + - + SEM Dietary fiber DFM2 Dietary fiber × DFM
d 0
PUN, mg/dL 9.5 11.9 13.9 13.0 0.8 0.001 0.370 0.002
TNF-α, pg/mL 68.2 81.6 86.2 65.0 18.0 0.968 0.829 0.810
d 94
PUN, mg/dL 10.0 9.4 13.2 12.2 1.1 0.007 0.479 0.042
TNF-α, pg/mL 8.9 23.5 27.2 12.4 5.3 0.511 0.983 0.098
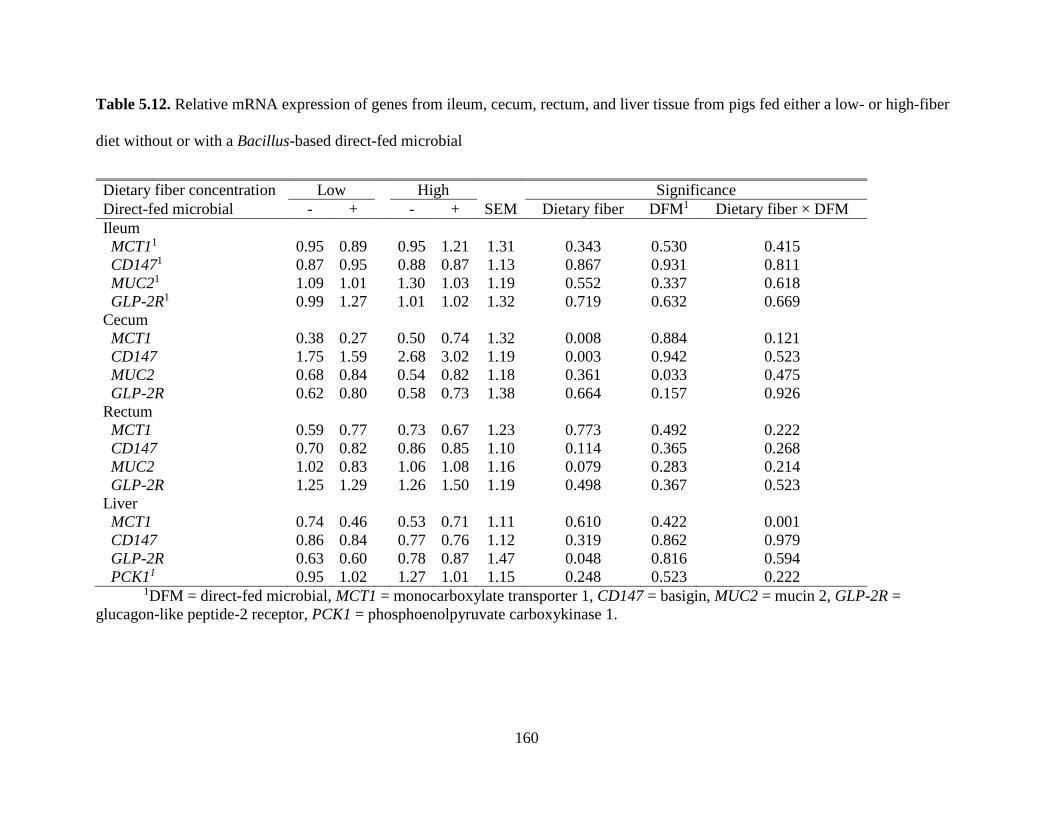
160
Table 5.12. Relative mRNA expression of genes from ileum, cecum, rectum, and liver tissue from pigs fed either a low- or high-fiber
diet without or with a Bacillus-based direct-fed microbial
1DFM = direct-fed microbial, MCT1 = monocarboxylate transporter 1, CD147 = basigin, MUC2 = mucin 2, GLP-2R =
glucagon-like peptide-2 receptor, PCK1 = phosphoenolpyruvate carboxykinase 1.
Dietary fiber concentration Low High Significance
Direct-fed microbial - + - + SEM Dietary fiber DFM1 Dietary fiber × DFM
Ileum
MCT11 0.95 0.89 0.95 1.21 1.31 0.343 0.530 0.415
CD1471 0.87 0.95 0.88 0.87 1.13 0.867 0.931 0.811
MUC21 1.09 1.01 1.30 1.03 1.19 0.552 0.337 0.618
GLP-2R1 0.99 1.27 1.01 1.02 1.32 0.719 0.632 0.669
Cecum
MCT1 0.38 0.27 0.50 0.74 1.32 0.008 0.884 0.121
CD147 1.75 1.59 2.68 3.02 1.19 0.003 0.942 0.523
MUC2 0.68 0.84 0.54 0.82 1.18 0.361 0.033 0.475
GLP-2R 0.62 0.80 0.58 0.73 1.38 0.664 0.157 0.926
Rectum
MCT1 0.59 0.77 0.73 0.67 1.23 0.773 0.492 0.222
CD147 0.70 0.82 0.86 0.85 1.10 0.114 0.365 0.268
MUC2 1.02 0.83 1.06 1.08 1.16 0.079 0.283 0.214
GLP-2R 1.25 1.29 1.26 1.50 1.19 0.498 0.367 0.523
Liver
MCT1 0.74 0.46 0.53 0.71 1.11 0.610 0.422 0.001
CD147 0.86 0.84 0.77 0.76 1.12 0.319 0.862 0.979
GLP-2R 0.63 0.60 0.78 0.87 1.47 0.048 0.816 0.594
PCK11 0.95 1.02 1.27 1.01 1.15 0.248 0.523 0.222
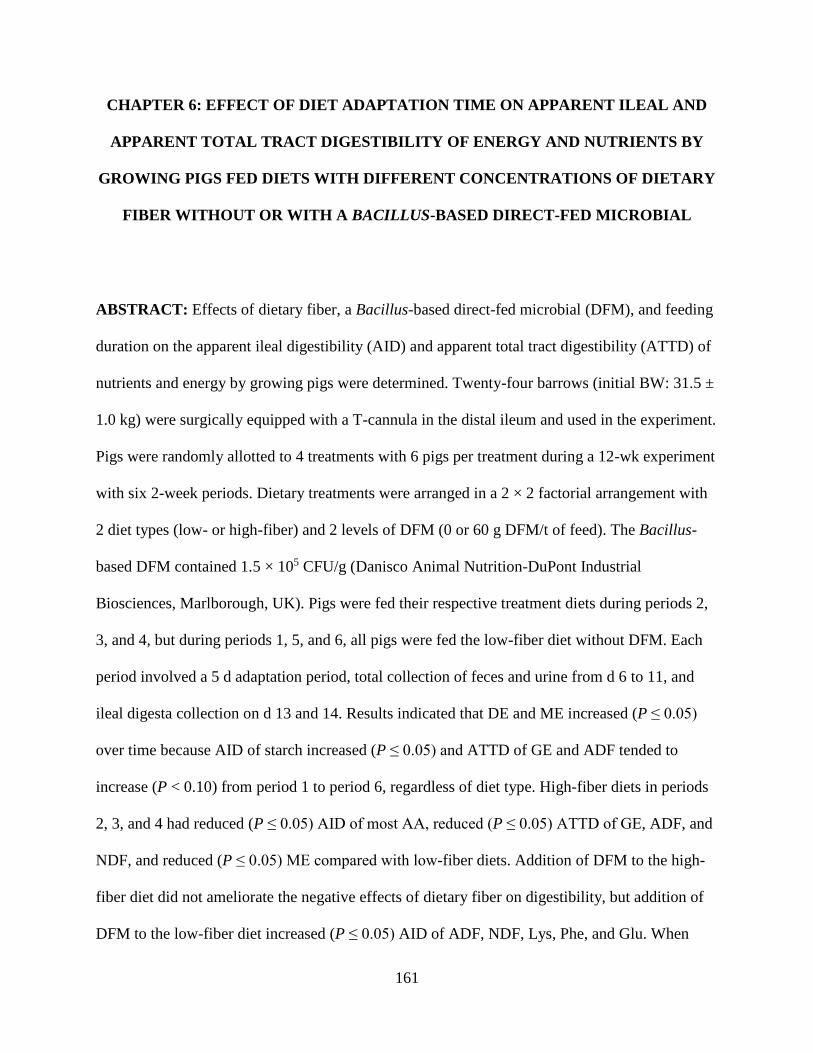
161
CHAPTER 6: EFFECT OF DIET ADAPTATION TIME ON APPARENT ILEAL AND
APPARENT TOTAL TRACT DIGESTIBILITY OF ENERGY AND NUTRIENTS BY
GROWING PIGS FED DIETS WITH DIFFERENT CONCENTRATIONS OF DIETARY
FIBER WITHOUT OR WITH A BACILLUS-BASED DIRECT-FED MICROBIAL
ABSTRACT: Effects of dietary fiber, a Bacillus-based direct-fed microbial (DFM), and feeding
duration on the apparent ileal digestibility (AID) and apparent total tract digestibility (ATTD) of
nutrients and energy by growing pigs were determined. Twenty-four barrows (initial BW: 31.5 ±
1.0 kg) were surgically equipped with a T-cannula in the distal ileum and used in the experiment.
Pigs were randomly allotted to 4 treatments with 6 pigs per treatment during a 12-wk experiment
with six 2-week periods. Dietary treatments were arranged in a 2 × 2 factorial arrangement with
2 diet types (low- or high-fiber) and 2 levels of DFM (0 or 60 g DFM/t of feed). The Bacillus-
based DFM contained 1.5 × 10⁵ CFU/g (Danisco Animal Nutrition-DuPont Industrial
Biosciences, Marlborough, UK). Pigs were fed their respective treatment diets during periods 2,
3, and 4, but during periods 1, 5, and 6, all pigs were fed the low-fiber diet without DFM. Each
period involved a 5 d adaptation period, total collection of feces and urine from d 6 to 11, and
ileal digesta collection on d 13 and 14. Results indicated that DE and ME increased (P ≤ 0.05)
over time because AID of starch increased (P ≤ 0.05) and ATTD of GE and ADF tended to
increase (P < 0.10) from period 1 to period 6, regardless of diet type. High-fiber diets in periods
2, 3, and 4 had reduced (P ≤ 0.05) AID of most AA, reduced (P ≤ 0.05) ATTD of GE, ADF, and
NDF, and reduced (P ≤ 0.05) ME compared with low-fiber diets. Addition of DFM to the high-
fiber diet did not ameliorate the negative effects of dietary fiber on digestibility, but addition of
DFM to the low-fiber diet increased (P ≤ 0.05) AID of ADF, NDF, Lys, Phe, and Glu. When
162
DFM was withdrawn from the low-fiber diet, digestibility values were reduced, indicating that
the Bacillus-based DFM must be fed continuously to exert beneficial effects and that no carry-
over effects can be expected. In conclusion, the AID of starch and the ATTD of GE and ADF
increased as pig BW increased, but digestibility values of energy and nutrients were reduced by
increased dietary fiber although the AID of some nutrients were improved by DFM.
Key words: adaptation, dietary fiber, digestibility, direct-fed microbials, pigs
INTRODUCTION
Addition of direct-fed microbials (DFM) to swine diets has recently gained more
attention due to mandated reduced use of antibiotics in the United States. Direct-fed microbials
included in swine diets may improve immune regulation (Weese et al., 2008), enhance beneficial
gastrointestinal microbiota (Baker et al., 2013), increase nutrient digestibility (Lee et al., 2014),
and increase pig performance and carcass characteristics (Alexopoulos et al., 2004). Bacillus-
based DFM may increase dietary fiber fermentation in swine diets due to their ability to secrete
fiber-degrading enzymes (Schreier, 1993) and, in turn, increase the production of VFA, which
may be utilized as an energy source by the pig (Jaworski et al., 2014).
The concentration of fiber in swine diets often is increased when diets are formulated to
contain grain co-products, and this typically is done to reduce diet cost (Jaworski et al., 2015).
However, increased dietary fiber may reduce apparent ileal digestibility (AID) and apparent total
tract digestibility (ATTD) of energy and nutrients (Bindelle et al., 2008), but it is possible that
negative effects of dietary fiber may be ameliorated by addition of a Bacillus-based DFM to the
diet. Feeding of high-fiber diets also result in increased size of the large intestine and increased
163
microbial population (Kyriazakis and Emmans, 1995; Jørgensen et al., 1996), which may allow
the pig to increase fermentation of dietary fiber. However, these changes take time to occur, and
it is, therefore, possible that a certain period of time is required for the microbiota to adapt to a
diet high in fiber to maximize fermentation. Thus, the objective of this experiment was to test the
hypothesis that addition of a Bacillus-based DFM to low- or high-fiber diets results in an
increase in AID and ATTD of nutrients and energy. A second objective was to determine if the
AID and ATTD of nutrients and energy change over time by growing pigs fed a low- or high-
fiber diet without or with DFM.
MATERIALS AND METHODS
The protocol for this experiment was approved by the Institutional Animal Care and Use
Committee at the University of Illinois at Urbana-Champaign. Pigs were the offspring of G-
Performer boars mated to F-25 females (Genetiporc, Alexandria, MN).
Animals, Housing, Diets, and Experimental Design. Twenty-four barrows (initial BW:
31.5 ± 1.0 kg) were surgically fitted with a T-cannula in the distal ileum (Stein et al., 1998).
After surgery, pigs were housed individually in metabolism crates that were equipped with a
feeder and a nipple drinker, a fully slatted floor, a fecal collection screen, and a urine tray that
allowed for total, but separate, collection of urine and feces from each pig. Water was available
at all times. Pigs were allowed to recover from surgery for 7 d before experimental diets were
fed.
Dietary treatments were arranged in a 2 × 2 factorial arrangement with 2 diet types (low-
or high-fiber) and 2 levels of DFM (0 or 60 g DFM/t of feed; Table 6.1). The Bacillus-based
DFM contained 1.5 × 10⁵ CFU/g and was obtained from Danisco Animal Nutrition-DuPont
164
Industrial Biosciences (Marlborough, UK). All diets also contained 500 units of microbial
phytase (Axtra® PHY; Danisco Animal Nutrition-DuPont Industrial Biosciences, Waukesha,
WI) per kg of complete diet and titanium dioxide (0.4%) was included in all diets as an
indigestible marker.
Pigs were randomly allotted to 4 treatment groups with 6 pigs per treatment in a
completely randomized design. The experiment was conducted during six 14-d periods. All pigs
were fed the low-fiber diet without DFM during the first 14 d period (period 1). During the
following three 14-d periods (periods 2, 3, and 4), pigs were fed 1 of the 4 experimental diets,
but all pigs were fed the low-fiber diet without DFM during the last two 14-d periods (periods 5
and 6). The experimental design is illustrated in Table 6.2. Feed was provided to each pig in
quantities equivalent to 3 times the estimated requirement for maintenance energy (i.e., 197 kcal
ME/kg0.6; NRC, 2012). Daily feed allotments were divided into two equal meals and fed at 0800
and 1600 h, respectively. The BW of each pig was recorded at the beginning of the experiment
and at the end of each period. The initial 5 d of each period was considered an adaptation to the
experimental diets. Feces and urine were quantitatively collected for 5 d from day 6 to day 11
using the marker to marker approach (Adeola, 2001). Feces were collected twice daily and stored
at -20°C immediately after collection. Urine was collected once daily in a preservative of 50 mL
of 6N HCl and 20% of daily urine collected was stored at -20°C immediately after collection.
Ileal digesta were collected for 8 h on d 13 and 14 by attaching a 225-mL plastic bag to the
cannula barrel using a cable tie (Stein et al., 1999). Bags were removed every 30 min or
whenever full and replaced with a new bag. Digesta were stored at -20°C immediately after
collection.
165
Physicochemical Characteristics, Chemical Analysis, and Calculations. The
physicochemical characteristics of all diets were determined by measuring the water binding
capacity (Robertson et al., 2000; Cervantes-Pahm et al., 2014) and bulk density (Cromwell et al.,
2000). All diets, freeze-dried ileal digesta, and oven-dried fecal samples were ground through a
1-mm screen in a Wiley mill (model 4; Thomas Scientific, Swedesboro, NJ) prior to chemical
analysis. All diets were analyzed for ash (Method 942.05; AOAC Int., 2007). All diets, freeze-
dried ileal digesta, and fecal samples were analyzed for DM (Method 930.15; AOAC Int., 2007),
and ADF and NDF using Ankom Technology method 12 and 13, respectively (Ankom2000 Fiber
Analyzer, Ankom Technology, Macedon, NY). All diets were analyzed for insoluble and soluble
dietary fiber according to method 991.43 (AOAC Int., 2007) using the AnkomTDF Dietary Fiber
Analyzer (Ankom Technology, Macedon, NY). Diets and freeze-dried ileal digesta samples were
analyzed for AA on a Hitachi AA Analyzer, Model No. L8800 (Hitachi High Technologies
America, Inc., Pleasanton, CA) using ninhydrin for postcolumn derivatization and norleucine as
the internal standard. Prior to analysis, samples were hydrolyzed with 6N HCl for 24 h at 110°C
[Method 982.30 E(a); AOAC Int., 2007]. Total starch was analyzed in all diets and freeze-dried
ileal samples by the glucoamylase procedure (Method 979.10; AOAC Int., 2007). The
concentration of titanium in diets and freeze-dried ileal digesta was measured following the
procedure of Myers et al. (2004). Diets, fecal samples, and urine samples were analyzed in
duplicate for GE using bomb calorimetry (Model 6300; Parr Instruments, Moline, IL) and the
ATTD of GE in each diet was calculated (Adeola, 2001). The energy lost in feces and urine was
calculated and the quantities of DE and ME in each of the diets was calculated (Adeola, 2001).
The AID of AA, ADF, NDF, and total starch as well as ATTD of ADF and NDF was calculated
for each diet according to Stein et al. (2007).

166
Statistical Analysis. Data for each treatment group were analyzed using the MIXED
procedure (SAS Inst. Inc., Cary, NC). The model included period as the independent variable
and AID, ATTD, DE, and ME values as response variables within dietary treatment groups.
Single degree of freedom contrasts were used to compare effects of dietary fiber concentration
and DFM inclusion within each treatment group (e.g., period 1 vs. periods 2, 3, and 4; periods 2,
3, and 4 vs. periods 5 and 6; and period 1 vs. periods 5 and 6; Stewart et al., 2010). Results for all
treatment groups for periods 2, 3, and 4 were analyzed as repeated measures using the MIXED
procedure (Littell et al., 1998; Stewart et al., 2010). Fixed effects included period, dietary fiber
concentration, DFM addition, and the interaction between period, dietary fiber concentration,
and DFM addition. Appropriate covariance structures were chosen based on the Akaike
information criterion. The pig was the experimental unit for all analyses. For all outcomes, a P-
value ≤ 0.05 was used to determine significance among treatments and a P-value > 0.05 but <
0.10 was considered a tendency.
RESULTS AND DISCUSSION
One pig allotted to treatment 2 died at the end of period 2 and another pig allotted to
treatment 4 was euthanized at the conclusion of period 4 due to a broken hip; therefore, treatment
2 had only 5 observations in periods 3 through 6 and treatment 4 had only 5 observations in
periods 5 and 6. The ADG of the pigs during the experiment was 0.84 kg/d and the final BW was
102.2 ± 5.8 kg.
The experimental design allowed for the investigation of the AID and ATTD of energy
and nutrients by growing pigs over six 14-d periods (84 d in total). Period represents both age
and BW of pigs. The AID of starch (Table 6.3) and the ATTD of DM, GE, ADF, NDF, and DE

167
and ME (Table 6.4) were greater (P ≤ 0.05) during periods 5 and 6 compared with period 1 if
pigs were fed the low-fiber diet without DFM for the entire experiment. These results are in
agreement with results that demonstrated the digestibility of energy is greater in heavier or more
mature pigs than in lighter or less mature pigs (Graham et al., 1986; Noblet et al., 1994). Also,
Noblet et al. (2001) indicated that the ATTD of GE increased by 0.003 to 0.0045% for every 10
kg BW from 30 to 100 kg and, in agreement, results from this experiment indicate that the
ATTD of GE increased by approximately 0.38% for every 10 kg BW from 31.1 to 102.2 kg.
Along with increased energy digestibility, the AID of His and Pro by pigs fed the low-fiber diet
without DFM was greater (P ≤ 0.05) during periods 2, 3, and 4 and periods 5 and 6 compared
with period 1. This observation is in contrast with data that indicated the AID of AA by growing
pigs fed a corn-soybean meal diet was not influenced by the BW of growing pigs from 35 to 67
kg over a period of 6 wks (Stewart et al., 2010). The differences may be attributed to longer
experimental periods and a greater BW range used in the current experiment whereas the diets
used, experimental design, and location were similar.
The AID of Lys, Phe, and Glu was increased (P ≤ 0.05) when the Bacillus-based DFM
was added to the low-fiber diet in periods 2, 3, and 4 compared with the low-fiber diet without
DFM fed in period 1 and periods 5 and 6 (Table 6.5). To our knowledge, this is the first reported
instance of increased AID of AA by swine fed a DFM-containing diet. The Bacillus-based DFM
added to the low-fiber diet also increased (P ≤ 0.05) AID of ADF and NDF, which may indicate
that as the DFM degrades ADF and NDF, a greater amount of Lys, Phe, and Glu are made
available for digestion and absorption. The AID of starch was greater (P ≤ 0.05) in periods 2, 3,
and 4 and periods 5 and 6 compared with period 1, but was not different during periods 2, 3, and
4 compared with periods 5 and 6. The AID of starch in the low-fiber diet without DFM was

168
increased as pig BW increased and this data is in agreement, but also indicates that the DFM is
not responsible for increased AID of starch. The observation that ATTD of NDF was decreased
(P ≤ 0.05) when the Bacillus-based DFM was added to the low-fiber diet indicates that the DFM
may have a more beneficial effect on dietary fiber fermentation in the upper-tract rather than the
lower-tract (Table 6.6). The ATTD of GE and the concentration of DE and ME in the low-fiber
diet without DFM fed to pigs in periods 5 and 6 were greater (P ≤ 0.05) compared with the low-
fiber diet fed in period 1 and the low-fiber diet plus DFM fed in periods 2, 3, and 4. This
indicates that the DFM does not increase DE or ME in low-fiber diets, rather, DE and ME
increases in low-fiber diets as pig BW and age advances. When the DFM was removed from the
low-fiber diet, AID of Lys, Phe, Glu, ADF, and NDF decreased to a level similar to the diet
without DFM, indicating that the Bacillus-based DFM fed over a period of 6 consecutive weeks
did not colonize the pigs’ gastrointestinal tract. As a consequence, it appears that DFM must be
continuously fed to pigs to achieve improvements in nutrient digestibility.
For pigs fed the high-fiber diet without DFM during periods 2, 3, and 4 and the low-fiber
diet without DFM during periods 1, 5, and 6, AID of starch was greater (P ≤ 0.05) in periods 2,
3, and 4 compared with period 1 (Table 6.7). The AID of starch was not reduced when the high-
fiber diet was fed because the contribution of starch from DDGS and wheat middlings was low
and, therefore, the majority of starch digestion reflected digestion of starch in corn. However, the
AID of most AA was reduced (P ≤ 0.05) in periods 2, 3, and 4 compared with period 1 and
periods 5 and 6. This was expected and is in agreement with previous research because DDGS
and wheat middlings contribute a significant proportion of AA to the high-fiber diet and the
digestibility of AA in DDGS and wheat middlings are less than in corn and soybean meal (Lin et
al., 1987; Urriola and Stein, 2010).
169
The ATTD of DM, GE, ADF, NDF, and concentrations of DE and ME of diets were
reduced (P ≤ 0.05) in periods 2, 3, and 4 when pigs were fed the high-fiber diet without DFM
compared with period 1 and periods 5 and 6 when pigs were fed low-fiber diet without DFM
(Table 6.8). This was expected because the digestibility of DM, GE, ADF, and NDF are less in
DDGS and wheat middlings compared with corn and soybean meal (Lin et al., 1987; Urriola and
Stein, 2010).
For pigs fed the high-fiber diet with DFM during periods 2, 3, and 4 and the low-fiber
diet without DFM during periods 1, 5, and 6, AID of starch was greater (P ≤ 0.05) in periods 2,
3, and 4 compared with period 1 (Table 6.9). However, the AID of starch also was greater (P ≤
0.05) in periods 5 and 6 compared with period 1, which is an indication that the AID of starch by
pigs increased as pig BW and age advanced, regardless of diet type or DFM addition. The AID
of most AA was greater in period 1 and periods 5 and 6 when pigs were fed the low-fiber diet
without DFM compared with periods 2, 3, and 4 when pigs were fed the high-fiber diet plus
DFM, indicating that DFM addition to the high-fiber diet did not ameliorate the negative effect
of the high-fiber diet on AA digestibility. The ATTD of DM, GE, ADF, NDF, and
concentrations of DE and ME were reduced (P ≤ 0.05) in periods 2, 3, and 4 when pigs were fed
the high-fiber diet with DFM compared with period 1 and periods 5 and 6 when pigs were fed
low-fiber diet without DFM (Table 6.10). Again, this is an indication that the addition of the
Bacillus-based DFM did not ameliorate the negative effect that the high-fiber diet had on ATTD
of energy and nutrients.
When data for periods 2, 3, and 4 were pooled within each treatment group and effects of
period, fiber level, and DFM addition were determined, the AID of starch increased (P ≤ 0.05)
from 93.4% in period 2 to 96.8% in period 3 to 97.7% in period 4 (Table 6.11). High-fiber diets
170
reduced (P ≤ 0.05) the AID of NDF and most AA compared with low-fiber diets and this is in
agreement with previous research (Schulze et al., 1994; Urriola and Stein, 2010). The AID of Ser
was increased (P ≤ 0.05) due to DFM addition to diets, but this was the only effect DFM addition
had on the AID of nutrients by pigs.
The DE and ME of experimental diets increased (P ≤ 0.05) as period advanced (Table
6.12). It was hypothesized that the DE and ME of experimental diets would increase as period
advanced because the digestibility of fiber would increase. It was also speculated that fiber
digestibility would increase over time because the size of the gastrointestinal tract of pigs would
increase as well as the size of the microbial population (Kyriazakis and Emmans, 1995;
Jørgensen et al., 1996). However, period had no effect on ATTD of ADF or NDF and, therefore,
a 5 d adaptation period to low- or high-fiber diets is sufficient to determine the ATTD of ADF
and NDF. High-fiber diets reduced (P ≤ 0.05) ATTD of GE, DM, ADF, NDF and concentrations
of DE and ME compared with low-fiber diets. This observation was expected because the high-
fiber diets were formulated to contain less DE and ME compared with low-fiber diets. The
addition of DFM to diets increased (P ≤ 0.05) GE in dry feces compared with diets without
DFM, but this was the only effect DFM addition had on the ATTD of energy and nutrients by
pigs. The increase in GE in dry feces may be attributed to a greater amount of microbial energy
excreted by pigs fed DFM-containing diets, but this hypothesis was not experimentally verified.
CONCLUSION
As age and BW of pigs advanced, concentrations of DE and ME increased independent
of diet type. In contrast to our hypothesis, the increased DE and ME was not due to increased
ATTD of ADF or NDF, rather it was because the AID of starch increased as period advanced.

171
Pigs fed high-fiber diets had reduced AID of most AA, ATTD of GE, ADF, and NDF, and DE
and ME compared with pigs fed low-fiber diets. The addition of a Bacillus-based DFM to high-
fiber diets fed for 6 consecutive weeks did not ameliorate the negative effects of high-fiber diets
on digestibility. However, addition of the Bacillus-based DFM to low-fiber diets fed for 6
consecutive wks improved AID of ADF and NDF, which may be the reason for improved AID
of Lys, Phe, and Glu by pigs fed the low-fiber diet with DFM. Also, when the DFM was
withdrawn from the low-fiber diet, digestibility values were reduced to the levels they had in
diets without DFM, indicating that the Bacillus-based DFM must be fed continuously to exert
beneficial effects. The ATTD of ADF and NDF was not different in pigs adapted to the diet for 5
d compared with pigs adapted for 19 or 33 d indicating that a 5 d adaptation period to
experimental diets is sufficient when determining the ATTD of ADF and NDF by growing pigs.

172
LITERATURE CITED
Adeola, O. 2001. Digestion and balance techniques in pigs. Pages 903-916 in Swine Nutrition.
2nd ed. A. J. Lewis and L. L. Southern, ed. CRC Press, New York, NY.
Alexopoulos, C., I. E. Georgoulakis, A. Tzivara, C. S. Kyriakis, A. Govaris, and S. C. Kyriakis.
2004. Field evaluation of the effect of a probiotic-containing Bacillus licheniformis and
Bacillus subtilis spores on the health status, performance, and carcass quality of grower
and finishing pigs. J. Vet. Med. 51:306-312.
AOAC Int. 2007 AOAC International. 2007. Official Methods of Analysis of AOAC Int. 18th
ed. Rev. 2. W. Hortwitz and G. W. Latimer, Jr., eds. AOAC Int., Gaithersburg, MD.
Baker, A. A., E. Davis, J. D. Spencer, R. Moser, and T. Rehberger. 2013. The effect of a
Bacillus-based direct-fed microbial supplemented to sows on the gastrointestinal
microbiota of their neonatal piglets. J. Anim. Sci. 91:3390-3399.
Bindelle, J., P. Leterme, and A. Buldgen. 2008. Nutritional and environmental consequences of
dietary fibre in pig nutrition: a review. Biotechnol. Agron. Soc. Environ. 12:69-80.
Cervantes-Pahm, S. K., Y. Liu, and H. H. Stein. 2014. Comparative digestibility of energy and
nutrients and fermentability of dietary fiber in eight cereal grains fed to pigs. J. Sci. Food
Agric. 94:841-849.
Cromwell, G. L., T. R. Cline, J. D. Crenshaw, T. D. Crenshaw, R. A. Easter, R. C. Ewan, C. R.
Hamilton, G. M. Hill, A. J. Lewis, D. C. Mahan, J. L. Nelssen, J. E. Pettigrew, T. L.
Veum, and J. T. Yen. 2000. Variability among sources and laboratories in analyses of
wheat middlings. J. Anim. Sci. 78:2652-2658.

173
Graham, H., K. Hesselman, E. Jonsson, and P. Aman. 1986. Influence of beta-glucanase
supplementation on digestion of a barley-based diet in the pig gastrointestinal tract. Nutr.
Rep. Int. 34:1089-1096.
Jaworski, N. W., A. Owusu-Asiedu, A. A. Awati, and H. H. Stein. 2014. Effect of Bacillus spp.
direct-fed microbials on fecal VFA concentrations, growth performance, and carcass
characteristics of growing-finishing pigs. J. Anim. Sci. 92(Suppl. 2):56 (Abstr.).
Jaworski, N. W., H. N. Lærke, K. E. Bach Knudsen, and H. H. Stein. 2015. Carbohydrate
composition and in vitro digestibility of dry matter and nonstarch polysaccharides in
corn, sorghum, and wheat and coproducts from these grains. J. Anim. Sci. 93:1103-1113.
Jørgensen, H., X. Q. Zhao, and B. O. Eggum. 1996. The influence of dietary fibre and
environmental temperature on the development of the gastrointestinal tract, digestibility,
degree of fermentation in the hind-gut and energy metabolism in pigs. Br. J. Nutr.
75:365-378.
Kyriazakis, I., and G. C. Emmans. 1995. The voluntary feed intake of pigs given feeds based on
wheat bran, dried citrus pulp and grass meal, in relation to measurements of feed bulk.
Br. J. Nutr. 73:191-207.
Lee, S. H., S. L. Ingale, J. S. Kim, K. H. Kim, A. Lokhande, E. K. Kim, I. K. Kwon, Y. H. Kim,
B. J. Chae. 2014. Effects of dietary supplementation with Bacillus subtilis LS 1-2
fermentation biomass on growth performance, nutrient digestibility, cecal microbiota and
intestinal morphology of weanling pig. Anim. Feed Sci. Technol. 188:102-110.
Lin, F. D., D. A. Knabe, and T. D. Tanksley, Jr. 1987. Apparent digestibility of amino acids,
gross energy and starch in corn, sorghum, wheat, barley, oat groats and wheat middlings
for growing pigs. J. Anim. Sci. 64:1655-1663.

174
Littell, R. C., P. R. Henry, and C. B. Ammerman. 1998. Statistical analysis of repeated measures
data using SAS procedures. J. Anim. Sci. 76:1216-1231.
Myers, W. D., P. A. Ludden, V. Nayigihugu, and B. W. Hess. 2004. Technical note: A procedure
for the preparation and quantitative analysis of samples for titanium dioxide. J. Anim.
Sci. 82:179-183.
Noblet, J. 2001. Digestive and metabolic utilization of dietary energy in pig feeds: comparison of
energy systems. In: P. C. Garnsworth and J. Wiseman, editors. Recent Developments in
Pig Nutrition. Nottingham University Press, Nottingham, UK. p. 161-184.
Noblet, J., X. S. Shi, and S. Dubois. 1994. Effect of body weight on net energy value of feeds for
growing pigs. J. Anim. Sci. 72:648-657.
NRC. 2012. Nutrient Requirements of Swine. 11th rev. ed. Natl. Acad. Press, Washington, DC.
Prosky, L., N. G. Asp, T. F. Schweizer, J. W. De Vries, and I. Furda. 1992. Determination of
insoluble, soluble and total dietary fiber in foods and food products: Collaborative study.
J. AOAC. 75:360-367.
Robertson, J. A., F. D. de Monredon, P. Dysseler, F. Guillon, R. Amado, and J. Thibault. 2000.
Hydration properties of dietary fibre and resistant starch: a European collaborative study.
Lebensm.-Wiss. u.-Technol. 33:72-79.
Sanderson, P. 1986. A new method of analysis of feedingstuffs for the determination of crude
oils and fats. Pages 77-81 in Recent Advances in Animal Nutrition. W. Haresign and D.
J. A. Cole, eds. Butterworths, London, U.K.

175
Schreier, H. J. 1993. Biosynthesis of glutamine and glutamate and the assimilation of ammonia.
In: Bacillus subtilis and Other Gram-Positive Bacteria. A. L. Sonenshein, J. A. Hoch, and
R. Losick, editors. Am. Soc. Microbiol., Washington, DC. p. 281-285.
Schulze, H., P. van Leeuwen, M. W. A. Verstegen, J. Huisman, W. B. Souffrant, and F. Ahrens.
1994. Effect of level of dietary neutral detergent fiber on ileal apparent digestibility and
ileal nitrogen losses in pigs. J. Anim. Sci. 72:2362-2368.
Serena, A. and K. E. Bach Knudsen. 2007. Chemical and physicochemical characterization of
co-products from the vegetable food and agro industries. Anim. Feed Sci. Technol.
139:109-124.
Stein, H. H., C. F. Shipley, and R. A. Easter. 1998. Technical note: A technique for inserting a T-
cannula into the distal ileum of pregnant sows. J. Anim. Sci. 76:1433-1436.
Stein, H. H., S. Aref, and R. A. Easter. 1999. Comparative protein and amino acid digestibilities
in growing pigs and sows. J. Anim. Sci. 77:1169-1179.
Stein, H. H., B. Sève, M. F. Fuller, P. J. Moughan, and C. F. M. de Lange. 2007. Invited review:
Amino acid bioavailability and digestibility in pig feed ingredients: Terminology and
application. J. Anim. Sci. 85:172-180.
Stewart, L. L., B. G. Kim, B. R. Gramm, R. D. Nimmo, and H. H. Stein. 2010. Effect of
virginiamycin on the apparent ileal digestibility of amino acids by growing pigs. J. Anim.
Sci. 88:1718-1724.
Urriola, P. E., and H. H. Stein. 2010. Effects of distillers dried grains with solubles on amino
acid, energy, and fiber digestibility and on hindgut fermentation of dietary fiber in a corn-
soybean meal diet fed to growing pigs. J. Anim. Sci. 88:1454-1462.

176
Weese, J. S., S. Sharif, and A. Rodiguez-Palacios. 2008. Probiotics in veterinary medicine. In: J.
Versalovic and M. Wilson, editors, Therapeutic Microbiology: Probiotics and Related
Strategies. ASM Press, Washington, DC. p. 341-356.

177
TABLES
Table 6.1. Ingredient composition and, calculated, and analyzed composition of experimental
diets (as-fed basis)
Low fiber High fiber
Item - DFM1 + DFM - DFM + DFM
Ingredient
Corn 73.68 73.62 40.00 39.94
Soybean meal, 48% CP 22.00 22.00 16.00 16.00
DDGS1 - - 30.00 30.00
Wheat middlings - - 10.00 10.00
Choice white grease 1.00 1.00 1.00 1.00
Limestone 1.15 1.15 1.55 1.55
Dicalcium P 0.60 0.60 - -
L-Lys HCl 0.34 0.34 0.34 0.34
DL-Met 0.04 0.04 - -
L-Thr 0.08 0.08 - -
Salt 0.40 0.40 0.40 0.40
Vitamin-mineral premix2 0.30 0.30 0.30 0.30
Titanium dioxide 0.40 0.40 0.40 0.40
DFM3 - 0.06 - 0.06
Phytase 0.01 0.01 0.01 0.01
Calculated values
DE, kcal/kg 3,426 3,424 3,429 3,427
ME, kcal/kg 3,310 3,308 3,285 3,283
NE, kcal/kg 2,481 2,480 2,371 2,369
CP, % 16.57 16.57 20.72 20.71
Ca, % 0.65 0.65 0.66 0.66
P4, % 0.31 0.31 0.33 0.33
Amino acids5, %
Arg 0.95 0.95 1.05 1.05
His 0.40 0.40 0.47 0.47
Ile 0.59 0.59 0.68 0.68
Leu 1.32 1.32 1.74 1.74

178
Table 6.1. (cont.)
Lys 0.98 0.98 0.98 0.98
Met 0.28 0.28 0.32 0.32
Met + Cys 0.56 0.56 0.61 0.61
Phe 0.71 0.71 0.86 0.86
Thr 0.59 0.59 0.59 0.59
Trp 0.17 0.17 0.17 0.17
Val 0.66 0.66 0.81 0.81
Analyzed values
GE, kcal/kg 3,858 3,869 4,134 4,128
DM, % 86.2 86.3 86.7 86.5
Ash, % 5.0 4.4 5.3 4.6
Starch, % 50.9 50.5 32.2 33.0
ADF, % 5.0 4.7 8.8 8.8
NDF% 11.6 11.1 19.8 21.6
Insoluble dietary fiber, % 14.5 13.0 20.9 22.6
Soluble dietary fiber, % 1.0 0.8 3.3 1.3
Total dietary fiber, % 15.5 13.9 24.2 24.0
Water binding capacity, g/g 1.3 1.3 1.7 1.8
Bulk density, g/L 736 732 621 626 1DDGS = distillers dried grains with solubles; DFM = direct-fed microbial. 2The vitamin-micromineral premix provided the following quantities of vitamins and micro
minerals per kilogram of complete diet: Vitamin A as retinyl acetate, 11,136 IU; vitamin D3 as
cholecalciferol, 2,208 IU; vitamin E as DL-alpha tocopheryl acetate, 66 IU; vitamin K as
menadione dimethylprimidinol bisulfite, 1.42 mg; thiamin as thiamine mononitrate, 0.24 mg;
riboflavin, 6.59 mg; pyridoxine as pyridoxine hydrochloride, 0.24 mg; vitamin B12, 0.03 mg; D-
pantothenic acid as D-calcium pantothenate, 23.5 mg; niacin, 44.1 mg; folic acid, 1.59 mg; biotin,
0.44 mg; Cu, 20 mg as copper sulfate and copper chloride; Fe, 126 mg as ferrous sulfate; I, 1.26
mg as ethylenediamine dihydriodide; Mn, 60.2 mg as manganese sulfate; Se, 0.3 mg as sodium
selenite and selenium yeast; and Zn, 125.1 mg as zinc sulfate. 3DFM = direct-fed microbial (60 g/t, Danisco Animal Nutrition-DuPont Industrial
Biosciences, Marlborough, UK). 4Standardized total tract digestible P. 5Amino acids are indicated as standardized ileal digestible AA.

179
Table 6.2. Dietary treatments during the 84 d experimental period
Period
Item 1 2 3 4 5 6
Treatment 1 Low-fiber Low-fiber Low-fiber Low-fiber Low-fiber Low-fiber
Treatment 2 Low-fiber Low-fiber + DFM1 Low-fiber + DFM Low-fiber + DFM Low-fiber Low-fiber
Treatment 3 Low-fiber High-fiber High-fiber High-fiber Low-fiber Low-fiber
Treatment 4 Low-fiber High-fiber + DFM High-fiber + DFM High-fiber + DFM Low-fiber Low-fiber 1DFM = direct-fed microbial (60 g/MT, Danisco Animal Nutrition-DuPont Industrial Biosciences, Marlborough, UK).

180
Table 6.3. Effect of feeding period on AID1 of ADF, NDF, starch, and AA in the low-fiber diet without DFM1 fed to pigs for 6
periods (as-fed basis)2
Period Contrast P-value
Item 1 2 3 4 5 6 SEM
Period 1
vs. period
2, 3, 4
Period 2, 3,
4 vs. period
5, 6
Period 1
vs. period
5, 6
ADF, % 39.5 44.6 48.0 37.5 40.1 32.4 3.9 0.41 0.03 0.50
NDF, % 44.3 45.3 53.0 45.6 43.1 32.7 4.0 0.48 0.01 0.23
Starch, % 93.4 92.0 97.0 97.0 95.6 97.2 0.9 0.07 0.13 0.01
Indispensable AA, %
Arg 89.4 89.1 91.2 90.3 89.8 90.4 0.5 0.14 0.81 0.21
His 83.9 84.8 87.1 86.7 87.5 85.5 0.8 0.03 0.67 0.02
Ile 81.9 81.8 83.6 80.4 81.5 79.9 1.1 0.94 0.16 0.39
Leu 83.2 84.1 85.9 83.4 84.8 82.3 1.0 0.27 0.26 0.74
Lys 86.0 86.0 88.0 86.2 86.5 84.6 0.9 0.52 0.11 0.66
Met 85.4 87.3 88.5 86.5 87.5 85.3 1.0 0.08 0.17 0.39
Phe 82.1 82.6 84.5 81.9 82.8 80.6 1.0 0.41 0.08 0.72
Thr 76.4 76.0 78.2 75.6 77.7 75.0 1.4 0.88 0.82 0.99
Trp 82.5 83.4 82.6 81.6 85.3 82.2 1.4 0.97 0.29 0.47
Val 78.2 78.6 80.1 77.0 78.9 76.3 1.4 0.81 0.36 0.71
Dispensable AA, %
Ala 77.7 78.8 76.9 72.4 75.6 73.3 1.9 0.43 0.26 0.15
Asp 80.5 80.4 82.4 79.7 80.9 79.9 0.9 0.77 0.55 0.91
Cys 73.2 72.2 74.5 73.3 76.7 72.9 1.7 0.92 0.20 0.36
Glu 86.2 86.5 87.1 85.3 86.3 85.5 0.8 0.94 0.53 0.74
Gly 67.9 68.9 72.6 70.2 72.7 69.0 1.7 0.12 0.81 0.10
Pro 74.4 76.2 81.9 79.5 80.0 79.2 2.0 < 0.01 0.68 < 0.01
Ser 81.0 80.6 81.7 79.7 81.6 81.4 0.9 0.81 0.29 0.64
Tyr 82.9 82.4 84.2 82.4 83.7 82.7 1.0 0.94 0.77 0.79 1DFM = direct-fed microbial; AID = apparent ileal digestibility. 2Date are means of 6 observations per period.
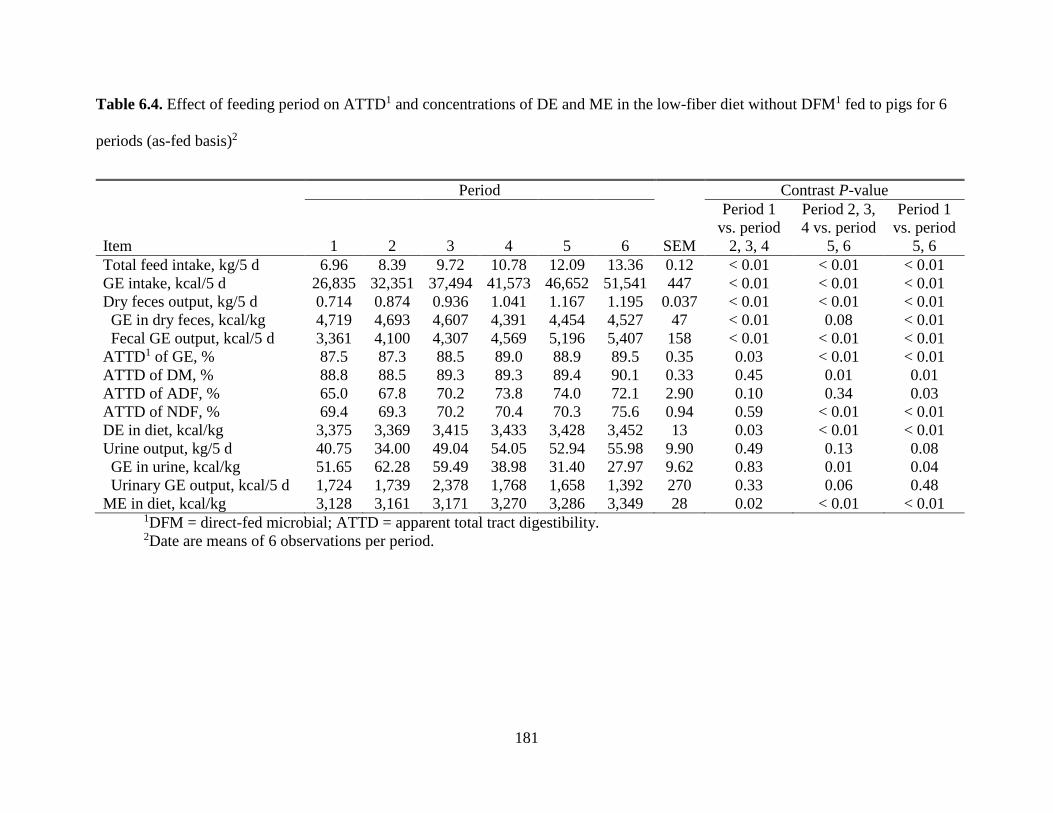
181
Table 6.4. Effect of feeding period on ATTD1 and concentrations of DE and ME in the low-fiber diet without DFM1 fed to pigs for 6
periods (as-fed basis)2
Period Contrast P-value
Item 1 2 3 4 5 6 SEM
Period 1
vs. period
2, 3, 4
Period 2, 3,
4 vs. period
5, 6
Period 1
vs. period
5, 6
Total feed intake, kg/5 d 6.96 8.39 9.72 10.78 12.09 13.36 0.12 < 0.01 < 0.01 < 0.01
GE intake, kcal/5 d 26,835 32,351 37,494 41,573 46,652 51,541 447 < 0.01 < 0.01 < 0.01
Dry feces output, kg/5 d 0.714 0.874 0.936 1.041 1.167 1.195 0.037 < 0.01 < 0.01 < 0.01
GE in dry feces, kcal/kg 4,719 4,693 4,607 4,391 4,454 4,527 47 < 0.01 0.08 < 0.01
Fecal GE output, kcal/5 d 3,361 4,100 4,307 4,569 5,196 5,407 158 < 0.01 < 0.01 < 0.01
ATTD1 of GE, % 87.5 87.3 88.5 89.0 88.9 89.5 0.35 0.03 < 0.01 < 0.01
ATTD of DM, % 88.8 88.5 89.3 89.3 89.4 90.1 0.33 0.45 0.01 0.01
ATTD of ADF, % 65.0 67.8 70.2 73.8 74.0 72.1 2.90 0.10 0.34 0.03
ATTD of NDF, % 69.4 69.3 70.2 70.4 70.3 75.6 0.94 0.59 < 0.01 < 0.01
DE in diet, kcal/kg 3,375 3,369 3,415 3,433 3,428 3,452 13 0.03 < 0.01 < 0.01
Urine output, kg/5 d 40.75 34.00 49.04 54.05 52.94 55.98 9.90 0.49 0.13 0.08
GE in urine, kcal/kg 51.65 62.28 59.49 38.98 31.40 27.97 9.62 0.83 0.01 0.04
Urinary GE output, kcal/5 d 1,724 1,739 2,378 1,768 1,658 1,392 270 0.33 0.06 0.48
ME in diet, kcal/kg 3,128 3,161 3,171 3,270 3,286 3,349 28 0.02 < 0.01 < 0.01 1DFM = direct-fed microbial; ATTD = apparent total tract digestibility. 2Date are means of 6 observations per period.
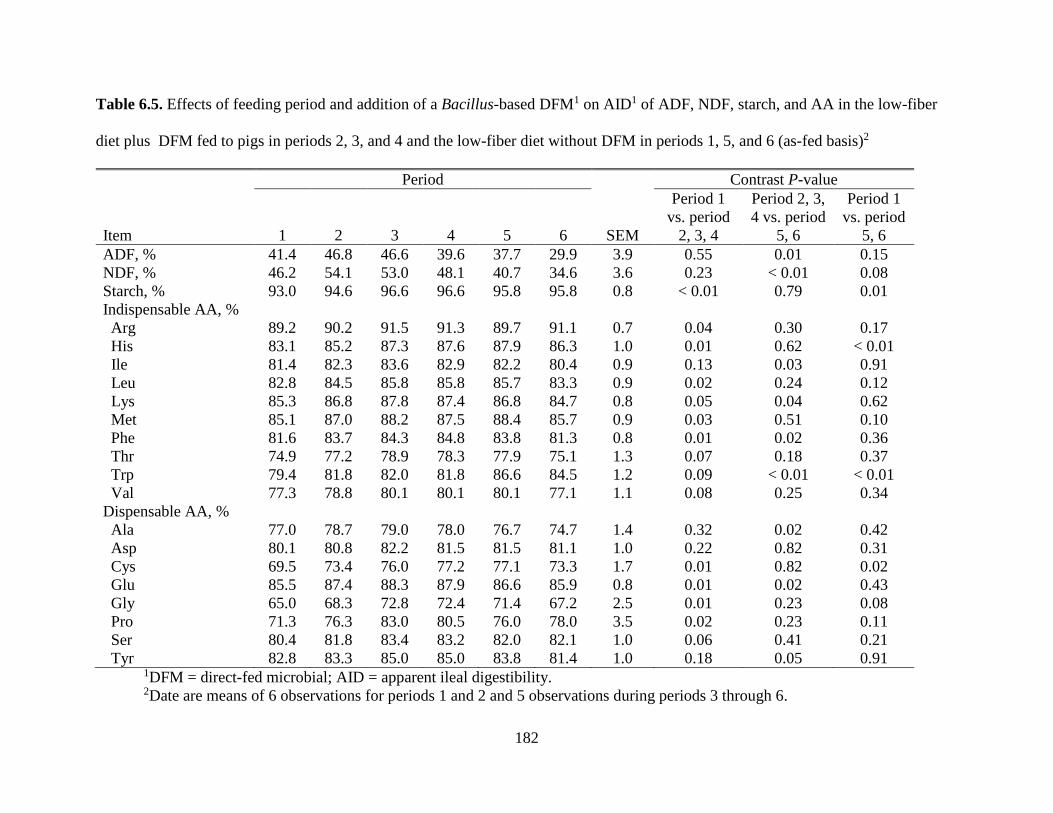
182
Table 6.5. Effects of feeding period and addition of a Bacillus-based DFM1 on AID1 of ADF, NDF, starch, and AA in the low-fiber
diet plus DFM fed to pigs in periods 2, 3, and 4 and the low-fiber diet without DFM in periods 1, 5, and 6 (as-fed basis)2
Period Contrast P-value
Item 1 2 3 4 5 6 SEM
Period 1
vs. period
2, 3, 4
Period 2, 3,
4 vs. period
5, 6
Period 1
vs. period
5, 6
ADF, % 41.4 46.8 46.6 39.6 37.7 29.9 3.9 0.55 0.01 0.15
NDF, % 46.2 54.1 53.0 48.1 40.7 34.6 3.6 0.23 < 0.01 0.08
Starch, % 93.0 94.6 96.6 96.6 95.8 95.8 0.8 < 0.01 0.79 0.01
Indispensable AA, %
Arg 89.2 90.2 91.5 91.3 89.7 91.1 0.7 0.04 0.30 0.17
His 83.1 85.2 87.3 87.6 87.9 86.3 1.0 0.01 0.62 < 0.01
Ile 81.4 82.3 83.6 82.9 82.2 80.4 0.9 0.13 0.03 0.91
Leu 82.8 84.5 85.8 85.8 85.7 83.3 0.9 0.02 0.24 0.12
Lys 85.3 86.8 87.8 87.4 86.8 84.7 0.8 0.05 0.04 0.62
Met 85.1 87.0 88.2 87.5 88.4 85.7 0.9 0.03 0.51 0.10
Phe 81.6 83.7 84.3 84.8 83.8 81.3 0.8 0.01 0.02 0.36
Thr 74.9 77.2 78.9 78.3 77.9 75.1 1.3 0.07 0.18 0.37
Trp 79.4 81.8 82.0 81.8 86.6 84.5 1.2 0.09 < 0.01 < 0.01
Val 77.3 78.8 80.1 80.1 80.1 77.1 1.1 0.08 0.25 0.34
Dispensable AA, %
Ala 77.0 78.7 79.0 78.0 76.7 74.7 1.4 0.32 0.02 0.42
Asp 80.1 80.8 82.2 81.5 81.5 81.1 1.0 0.22 0.82 0.31
Cys 69.5 73.4 76.0 77.2 77.1 73.3 1.7 0.01 0.82 0.02
Glu 85.5 87.4 88.3 87.9 86.6 85.9 0.8 0.01 0.02 0.43
Gly 65.0 68.3 72.8 72.4 71.4 67.2 2.5 0.01 0.23 0.08
Pro 71.3 76.3 83.0 80.5 76.0 78.0 3.5 0.02 0.23 0.11
Ser 80.4 81.8 83.4 83.2 82.0 82.1 1.0 0.06 0.41 0.21
Tyr 82.8 83.3 85.0 85.0 83.8 81.4 1.0 0.18 0.05 0.91 1DFM = direct-fed microbial; AID = apparent ileal digestibility. 2Date are means of 6 observations for periods 1 and 2 and 5 observations during periods 3 through 6.
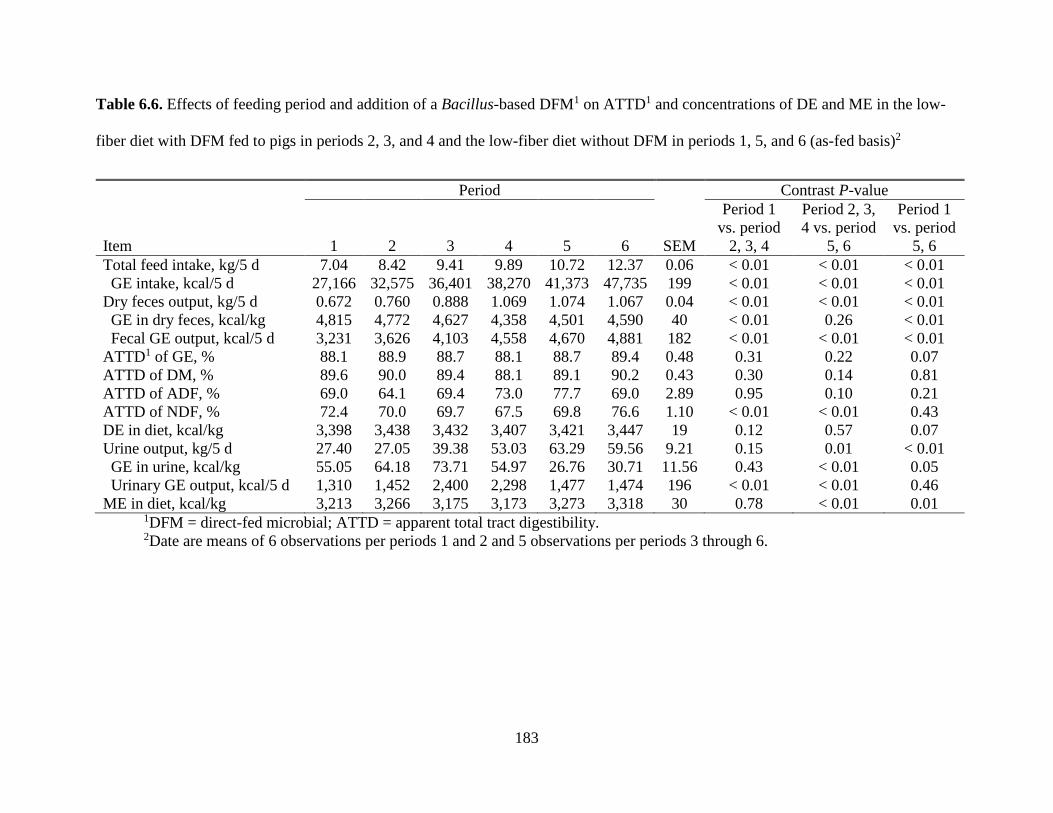
183
Table 6.6. Effects of feeding period and addition of a Bacillus-based DFM1 on ATTD1 and concentrations of DE and ME in the low-
fiber diet with DFM fed to pigs in periods 2, 3, and 4 and the low-fiber diet without DFM in periods 1, 5, and 6 (as-fed basis)2
Period Contrast P-value
Item 1 2 3 4 5 6 SEM
Period 1
vs. period
2, 3, 4
Period 2, 3,
4 vs. period
5, 6
Period 1
vs. period
5, 6
Total feed intake, kg/5 d 7.04 8.42 9.41 9.89 10.72 12.37 0.06 < 0.01 < 0.01 < 0.01
GE intake, kcal/5 d 27,166 32,575 36,401 38,270 41,373 47,735 199 < 0.01 < 0.01 < 0.01
Dry feces output, kg/5 d 0.672 0.760 0.888 1.069 1.074 1.067 0.04 < 0.01 < 0.01 < 0.01
GE in dry feces, kcal/kg 4,815 4,772 4,627 4,358 4,501 4,590 40 < 0.01 0.26 < 0.01
Fecal GE output, kcal/5 d 3,231 3,626 4,103 4,558 4,670 4,881 182 < 0.01 < 0.01 < 0.01
ATTD1 of GE, % 88.1 88.9 88.7 88.1 88.7 89.4 0.48 0.31 0.22 0.07
ATTD of DM, % 89.6 90.0 89.4 88.1 89.1 90.2 0.43 0.30 0.14 0.81
ATTD of ADF, % 69.0 64.1 69.4 73.0 77.7 69.0 2.89 0.95 0.10 0.21
ATTD of NDF, % 72.4 70.0 69.7 67.5 69.8 76.6 1.10 < 0.01 < 0.01 0.43
DE in diet, kcal/kg 3,398 3,438 3,432 3,407 3,421 3,447 19 0.12 0.57 0.07
Urine output, kg/5 d 27.40 27.05 39.38 53.03 63.29 59.56 9.21 0.15 0.01 < 0.01
GE in urine, kcal/kg 55.05 64.18 73.71 54.97 26.76 30.71 11.56 0.43 < 0.01 0.05
Urinary GE output, kcal/5 d 1,310 1,452 2,400 2,298 1,477 1,474 196 < 0.01 < 0.01 0.46
ME in diet, kcal/kg 3,213 3,266 3,175 3,173 3,273 3,318 30 0.78 < 0.01 0.01 1DFM = direct-fed microbial; ATTD = apparent total tract digestibility. 2Date are means of 6 observations per periods 1 and 2 and 5 observations per periods 3 through 6.

184
Table 6.7. Effects of feeding period and a high-fiber diet on AID1 of ADF, NDF, starch, and AA in a high-fiber diet without DFM1
fed to pigs in periods 2, 3, and 4 and the low-fiber diet without DFM in periods 1, 5, and 6 (as-fed basis)2
Period Contrast P-value
Item 1 2 3 4 5 6 SEM
Period 1
vs. period
2, 3, 4
Period 2, 3,
4 vs. period
5, 6
Period 1
vs. period
5, 6
ADF, % 50.4 49.2 50.6 43.3 40.1 36.9 3.1 0.48 < 0.01 < 0.01
NDF, % 55.8 42.5 46.2 37.0 44.5 40.9 3.2 < 0.01 0.75 < 0.01
Starch, % 94.7 94.3 97.1 98.8 94.1 97.7 0.6 < 0.01 0.07 0.08
Indispensable AA, %
Arg 90.1 86.9 88.5 89.3 89.2 90.9 0.6 < 0.01 < 0.01 0.98
His 85.7 81.8 83.3 83.7 86.9 85.3 0.7 < 0.01 < 0.01 0.69
Ile 83.5 81.2 82.5 81.4 82.5 81.0 0.7 0.04 0.93 0.05
Leu 85.1 85.5 86.4 85.8 85.2 83.8 0.7 0.34 0.03 0.50
Lys 86.9 82.6 83.2 82.7 87.1 85.3 0.7 < 0.01 < 0.01 0.36
Met 87.3 84.6 84.6 84.7 88.4 86.6 0.6 < 0.01 < 0.01 0.87
Phe 83.8 83.9 84.7 84.3 83.5 81.8 0.8 0.60 0.02 0.23
Thr 78.7 72.6 73.9 73.5 78.8 76.8 0.9 < 0.01 < 0.01 0.44
Trp 83.6 78.8 81.0 80.6 85.5 82.2 0.9 < 0.01 < 0.01 0.81
Val 80.2 78.5 80.0 78.6 79.8 77.5 0.9 0.23 0.75 0.17
Dispensable AA, %
Ala 80.1 79.1 78.2 76.1 78.5 76.1 1.0 0.07 0.56 0.03
Asp 81.9 76.3 77.7 78.1 81.3 81.2 0.8 < 0.01 < 0.01 0.48
Cys 75.5 70.6 73.7 75.1 76.7 74.7 1.2 0.13 0.03 0.90
Glu 87.6 85.6 85.0 85.6 86.9 86.9 0.7 0.01 0.01 0.37
Gly 70.8 68.1 72.4 70.9 71.8 70.5 1.4 0.81 0.52 0.84
Pro 73.7 70.0 77.5 79.6 80.2 78.7 2.4 0.36 0.03 0.02
Ser 82.4 79.4 80.4 80.9 82.6 82.7 0.8 0.02 < 0.01 0.84
Tyr 84.7 83.9 85.6 85.7 84.2 84.0 0.8 0.67 0.16 0.55 1DFM = direct-fed microbial; AID = apparent ileal digestibility. 2Date are means of 6 observations per period.

185
Table 6.8. Effects of feeding period and a high-fiber diet on ATTD1 and concentrations of DE and ME in a high-fiber diet without
DFM1 fed to pigs in periods 2, 3, and 4 and the low-fiber diet without DFM fed to pigs in periods 1, 5, and 6 (as-fed basis)2
Period Contrast P-value
Item 1 2 3 4 5 6 SEM
Period 1
vs. period
2, 3, 4
Period 2, 3,
4 vs. period
5, 6
Period 1
vs. period
5, 6
Total feed intake, kg/5 d 6.97 8.20 9.45 10.14 11.73 12.99 0.28 < 0.01 < 0.01 < 0.01
GE intake, kcal/5 d 26,874 33,887 39,070 41,915 45,251 50,096 1,137 < 0.01 < 0.01 < 0.01
Dry feces output, kg/5 d 0.687 1.409 1.604 1.732 1.179 1.246 0.050 < 0.01 < 0.01 < 0.01
GE in dry feces, kcal/kg 4,832 4,707 4,729 4,752 4,433 4,397 50 0.08 < 0.01 < 0.01
Fecal GE output, kcal/5 d 3,318 6,632 7,582 8,191 5,019 5,467 211 < 0.01 < 0.01 < 0.01
ATTD1 of GE, % 87.6 80.4 80.6 81.2 88.9 89.1 0.39 < 0.01 < 0.01 < 0.01
ATTD of DM, % 89.1 81.1 81.2 81.8 89.2 89.5 0.36 < 0.01 < 0.01 0.55
ATTD of ADF, % 68.4 61.2 61.6 62.7 72.1 69.4 2.22 0.01 < 0.01 0.35
ATTD of NDF, % 70.3 59.3 59.4 59.3 68.5 72.0 0.87 < 0.01 < 0.01 0.97
DE in diet, kcal/kg 3,381 3,325 3,332 3,358 3,430 3,437 16 0.01 < 0.01 < 0.01
Urine output, kg/5 d 32.58 41.75 42.00 45.52 44.90 61.93 9.66 0.17 0.09 0.01
GE in urine, kcal/kg 50.24 61.58 62.49 39.81 48.67 26.38 9.15 0.58 0.02 0.15
Urinary GE output, kcal/5 d 1,579 2,158 2,181 1,628 1,525 1,334 200 0.08 0.01 0.55
ME in diet, kcal/kg 3,155 3,059 3,102 3,198 3,296 3,334 31 0.31 < 0.01 < 0.01 1DFM = direct-fed microbial; ATTD = apparent total tract digestibility. 2Date are means of 6 observations per period.
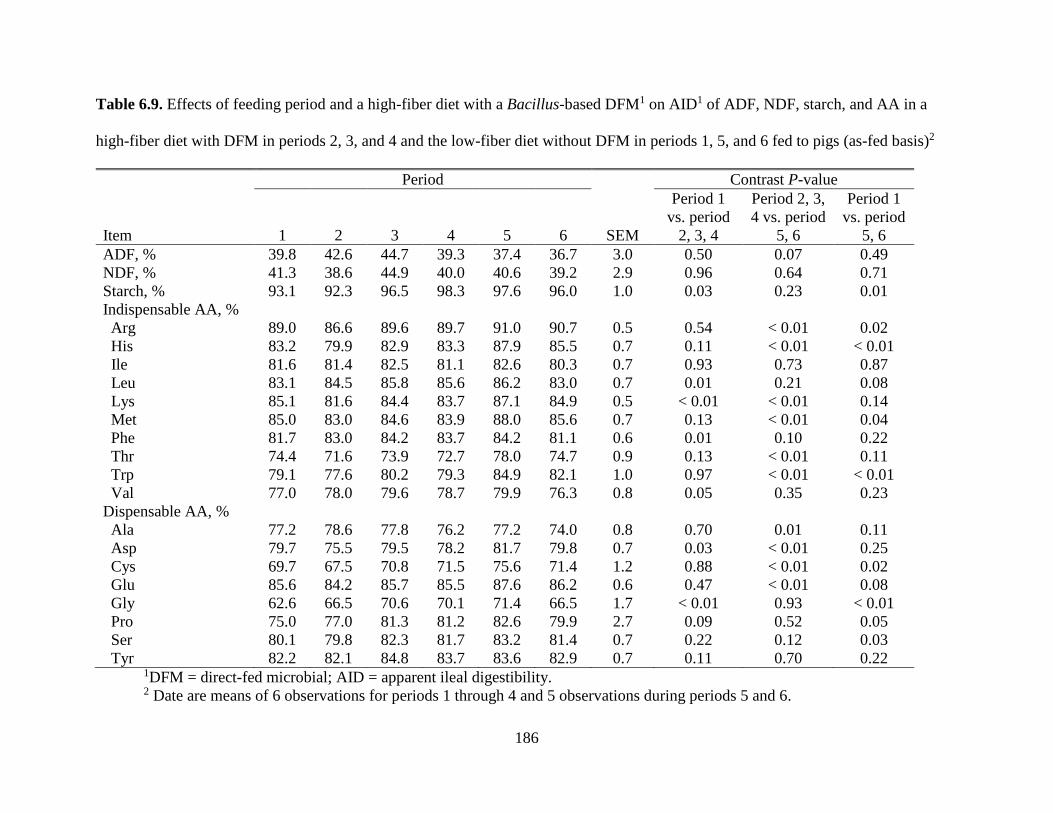
186
Table 6.9. Effects of feeding period and a high-fiber diet with a Bacillus-based DFM1 on AID1 of ADF, NDF, starch, and AA in a
high-fiber diet with DFM in periods 2, 3, and 4 and the low-fiber diet without DFM in periods 1, 5, and 6 fed to pigs (as-fed basis)2
Period Contrast P-value
Item 1 2 3 4 5 6 SEM
Period 1
vs. period
2, 3, 4
Period 2, 3,
4 vs. period
5, 6
Period 1
vs. period
5, 6
ADF, % 39.8 42.6 44.7 39.3 37.4 36.7 3.0 0.50 0.07 0.49
NDF, % 41.3 38.6 44.9 40.0 40.6 39.2 2.9 0.96 0.64 0.71
Starch, % 93.1 92.3 96.5 98.3 97.6 96.0 1.0 0.03 0.23 0.01
Indispensable AA, %
Arg 89.0 86.6 89.6 89.7 91.0 90.7 0.5 0.54 < 0.01 0.02
His 83.2 79.9 82.9 83.3 87.9 85.5 0.7 0.11 < 0.01 < 0.01
Ile 81.6 81.4 82.5 81.1 82.6 80.3 0.7 0.93 0.73 0.87
Leu 83.1 84.5 85.8 85.6 86.2 83.0 0.7 0.01 0.21 0.08
Lys 85.1 81.6 84.4 83.7 87.1 84.9 0.5 < 0.01 < 0.01 0.14
Met 85.0 83.0 84.6 83.9 88.0 85.6 0.7 0.13 < 0.01 0.04
Phe 81.7 83.0 84.2 83.7 84.2 81.1 0.6 0.01 0.10 0.22
Thr 74.4 71.6 73.9 72.7 78.0 74.7 0.9 0.13 < 0.01 0.11
Trp 79.1 77.6 80.2 79.3 84.9 82.1 1.0 0.97 < 0.01 < 0.01
Val 77.0 78.0 79.6 78.7 79.9 76.3 0.8 0.05 0.35 0.23
Dispensable AA, %
Ala 77.2 78.6 77.8 76.2 77.2 74.0 0.8 0.70 0.01 0.11
Asp 79.7 75.5 79.5 78.2 81.7 79.8 0.7 0.03 < 0.01 0.25
Cys 69.7 67.5 70.8 71.5 75.6 71.4 1.2 0.88 < 0.01 0.02
Glu 85.6 84.2 85.7 85.5 87.6 86.2 0.6 0.47 < 0.01 0.08
Gly 62.6 66.5 70.6 70.1 71.4 66.5 1.7 < 0.01 0.93 < 0.01
Pro 75.0 77.0 81.3 81.2 82.6 79.9 2.7 0.09 0.52 0.05
Ser 80.1 79.8 82.3 81.7 83.2 81.4 0.7 0.22 0.12 0.03
Tyr 82.2 82.1 84.8 83.7 83.6 82.9 0.7 0.11 0.70 0.22 1DFM = direct-fed microbial; AID = apparent ileal digestibility. 2 Date are means of 6 observations for periods 1 through 4 and 5 observations during periods 5 and 6.

187
Table 6.10. Effects of feeding period and a high-fiber diet plus a Bacillus-based DFM1 on ATTD1 and concentrations of DE and ME
in a high-fiber diet with DFM1 in periods 2, 3, and 4 and the low-fiber diet without DFM in periods 1, 5, and 6 fed to pigs (as-fed
basis)2
Period Contrast P-value
Item 1 2 3 4 5 6 SEM
Period 1
vs. period
2, 3, 4
Period 2, 3,
4 vs. period
5, 6
Period 1
vs. period
5, 6
Total feed intake, kg/5 d 7.01 8.37 9.63 10.74 12.03 13.08 0.13 < 0.01 < 0.01 < 0.01
GE intake, kcal/5 d 27,048 34,535 39,769 44,332 46,437 50,455 498 < 0.01 < 0.01 < 0.01
Dry feces output, kg/5 d 0.669 1.452 1.637 1.764 1.081 1.076 0.045 < 0.01 < 0.01 < 0.01
GE in dry feces, kcal/kg 4,796 4,789 4,813 4,877 4,587 4,650 57 0.64 < 0.01 0.02
Fecal GE output, kcal/5 d 3,210 6,953 7,881 8,602 4,942 5,008 218 < 0.01 < 0.01 < 0.01
ATTD1 of GE, % 88.1 79.9 80.2 80.6 89.4 89.5 0.35 < 0.01 < 0.01 0.01
ATTD of DM, % 89.5 80.9 81.3 81.6 90.0 90.6 0.24 < 0.01 < 0.01 0.01
ATTD of ADF, % 69.5 60.2 61.2 63.6 71.0 72.0 2.37 0.02 < 0.01 0.53
ATTD of NDF, % 70.7 60.7 61.1 61.5 69.8 75.2 1.05 < 0.01 < 0.01 0.18
DE in diet, kcal/kg 3,400 3,297 3,310 3,327 3,448 3,454 14 < 0.01 < 0.01 0.01
Urine output, kg/5 d 30.31 34.71 50.07 64.09 35.79 44.70 8.09 0.01 0.11 0.18
GE in urine, kcal/kg 60.76 71.53 51.63 47.22 51.83 32.09 11.63 0.66 0.07 0.07
Urinary GE output, kcal/5 d 1,567 2,126 2,482 2,068 1,514 1,245 221 0.01 < 0.01 0.48
ME in diet, kcal/kg 3,176 3,043 3,052 3,133 3,321 3,382 36 0.02 < 0.01 < 0.01 1DFM = direct-fed microbial; ATTD = apparent total tract digestibility. 2Date are means of 6 observations per periods 1 through 4 and 5 observations per periods 5 and 6.
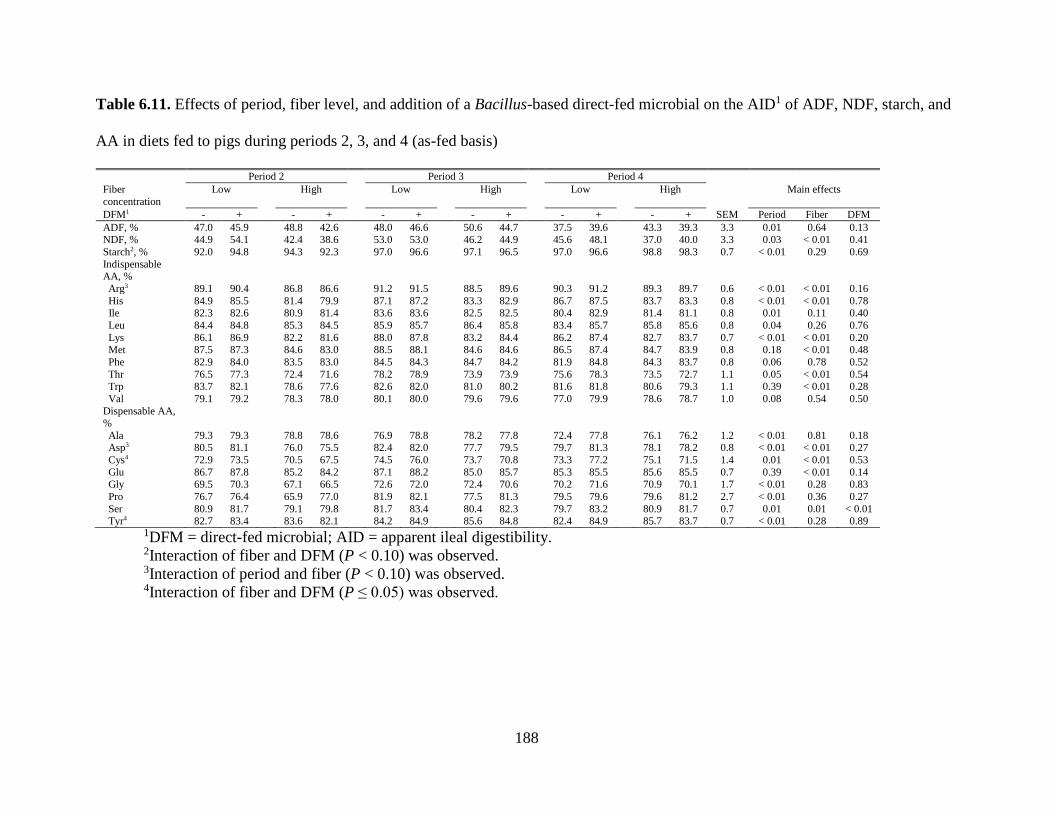
188
Table 6.11. Effects of period, fiber level, and addition of a Bacillus-based direct-fed microbial on the AID1 of ADF, NDF, starch, and
AA in diets fed to pigs during periods 2, 3, and 4 (as-fed basis)
Period 2 Period 3 Period 4
Fiber
concentration
Low High Low High Low High Main effects
DFM1 - + - + - + - + - + - + SEM Period Fiber DFM
ADF, % 47.0 45.9 48.8 42.6 48.0 46.6 50.6 44.7 37.5 39.6 43.3 39.3 3.3 0.01 0.64 0.13 NDF, % 44.9 54.1 42.4 38.6 53.0 53.0 46.2 44.9 45.6 48.1 37.0 40.0 3.3 0.03 < 0.01 0.41
Starch2, % 92.0 94.8 94.3 92.3 97.0 96.6 97.1 96.5 97.0 96.6 98.8 98.3 0.7 < 0.01 0.29 0.69
Indispensable AA, %
Arg3 89.1 90.4 86.8 86.6 91.2 91.5 88.5 89.6 90.3 91.2 89.3 89.7 0.6 < 0.01 < 0.01 0.16
His 84.9 85.5 81.4 79.9 87.1 87.2 83.3 82.9 86.7 87.5 83.7 83.3 0.8 < 0.01 < 0.01 0.78 Ile 82.3 82.6 80.9 81.4 83.6 83.6 82.5 82.5 80.4 82.9 81.4 81.1 0.8 0.01 0.11 0.40
Leu 84.4 84.8 85.3 84.5 85.9 85.7 86.4 85.8 83.4 85.7 85.8 85.6 0.8 0.04 0.26 0.76
Lys 86.1 86.9 82.2 81.6 88.0 87.8 83.2 84.4 86.2 87.4 82.7 83.7 0.7 < 0.01 < 0.01 0.20 Met 87.5 87.3 84.6 83.0 88.5 88.1 84.6 84.6 86.5 87.4 84.7 83.9 0.8 0.18 < 0.01 0.48
Phe 82.9 84.0 83.5 83.0 84.5 84.3 84.7 84.2 81.9 84.8 84.3 83.7 0.8 0.06 0.78 0.52
Thr 76.5 77.3 72.4 71.6 78.2 78.9 73.9 73.9 75.6 78.3 73.5 72.7 1.1 0.05 < 0.01 0.54 Trp 83.7 82.1 78.6 77.6 82.6 82.0 81.0 80.2 81.6 81.8 80.6 79.3 1.1 0.39 < 0.01 0.28
Val 79.1 79.2 78.3 78.0 80.1 80.0 79.6 79.6 77.0 79.9 78.6 78.7 1.0 0.08 0.54 0.50
Dispensable AA, %
Ala 79.3 79.3 78.8 78.6 76.9 78.8 78.2 77.8 72.4 77.8 76.1 76.2 1.2 < 0.01 0.81 0.18 Asp3 80.5 81.1 76.0 75.5 82.4 82.0 77.7 79.5 79.7 81.3 78.1 78.2 0.8 < 0.01 < 0.01 0.27
Cys4 72.9 73.5 70.5 67.5 74.5 76.0 73.7 70.8 73.3 77.2 75.1 71.5 1.4 0.01 < 0.01 0.53
Glu 86.7 87.8 85.2 84.2 87.1 88.2 85.0 85.7 85.3 85.5 85.6 85.5 0.7 0.39 < 0.01 0.14 Gly 69.5 70.3 67.1 66.5 72.6 72.0 72.4 70.6 70.2 71.6 70.9 70.1 1.7 < 0.01 0.28 0.83
Pro 76.7 76.4 65.9 77.0 81.9 82.1 77.5 81.3 79.5 79.6 79.6 81.2 2.7 < 0.01 0.36 0.27
Ser 80.9 81.7 79.1 79.8 81.7 83.4 80.4 82.3 79.7 83.2 80.9 81.7 0.7 0.01 0.01 < 0.01 Tyr4 82.7 83.4 83.6 82.1 84.2 84.9 85.6 84.8 82.4 84.9 85.7 83.7 0.7 < 0.01 0.28 0.89
1DFM = direct-fed microbial; AID = apparent ileal digestibility.
2Interaction of fiber and DFM (P < 0.10) was observed.
3Interaction of period and fiber (P < 0.10) was observed.
4Interaction of fiber and DFM (P ≤ 0.05) was observed.

189
Table 6.12. Effects of period, dietary fiber concentration, and addition of a Bacillus-based direct-fed microbial on ATTD1 and
concentrations of DE and ME in diets fed to pigs during periods 2, 3, and 4 (as-fed basis)
Period 2 Period 3 Period 4
Fiber
concentration
Low High Low High Low High Main effects
DFM1 - + - + - + - + - + - + SEM Period Fiber DFM
Total feed
intake2, kg/5 d
8.39 8.42 8.20 8.37 9.72 9.41 9.45 9.63 10.78 9.89 10.14 10.74 0.17 < 0.01 0.93 0.82
GE intake3, kcal/5 d
32,351 32,575 33,887 34,535 37,494 36,412 39,070 39,769 41,573 38,275 41,915 44,332 715 < 0.01 < 0.01 0.91
Dry feces
output4, kg/5 d
0.874 0.760 1.409 1.452 0.936 0.881 1.604 1.637 1.041 1.063 1.733 1.764 0.039 < 0.01 < 0.01 0.82
GE in dry
feces5, kcal/kg
4,693 4,772 4,707 4,789 4,607 4,631 4,729 4,813 4,391 4,365 4,752 4,877 38 < 0.01 < 0.01 < 0.01
Fecal GE
output6, kcal/5
d
4,100 3,626 6,632 6,953 4,307 4,083 7,582 7,881 4,569 4,541 8,201 8,602 186 < 0.01 < 0.01 0.73
ATTD1 of
GE, %
87.3 88.9 80.4 79.9 88.5 88.8 80.6 80.2 89.0 88.1 81.2 80.6 0.40 0.09 < 0.01 0.68
ATTD of DM7, %
88.5 90.0 81.1 80.9 89.3 89.5 81.2 81.3 89.3 88.2 81.8 81.6 0.35 0.57 < 0.01 0.88
ATTD of ADF, %
67.8 64.1 61.2 60.2 70.2 69.5 61.6 61.2 73.8 73.1 61.7 63.6 2.40 0.06 < 0.01 0.45
ATTD of
NDF8, %
69.3 70.0 59.3 60.7 70.2 69.9 59.4 61.1 70.4 67.4 59.3 61.3 0.89 0.63 < 0.01 0.46
DE in diet9,
kcal/kg
3,369 3,438 3,325 3,297 3,415 3,435 3,332 3,310 3,433 3,410 3,361 3,327 16 0.04 < 0.01 0.80
Urine output, kg/5 d
34.00 27.05 41.75 34.71 49.04 39.04 42.00 50.07 54.05 52.08 45.52 64.09 9.11 < 0.01 0.63 0.99
GE in urine,
kcal/kg
62.28 64.18 61.58 71.53 59.49 73.29 62.49 53.36 38.98 55.43 39.81 43.30 11.19 0.01 0.69 0.50
Urinary GE
output10,
kcal/5 d
1,739 1,452 2,158 2,216 2,378 2,408 2,181 2,482 1,768 2,305 1,628 2,031 226 < 0.01 0.57 0.33
ME in diet11,
kcal/kg
3,161 3,266 3,059 3,043 3,171 3,179 3,102 3,052 3,270 3,177 3,208 3,139 30 < 0.01 < 0.01 0.39
1DFM = direct-fed microbial; ATTD = apparent total tract digestibility.
2Interactions of period and DFM, fiber and DFM, and period, fiber, and DFM (P < 0.05) were observed.
3Interactions of period and fiber, period and DFM, fiber and DFM, and period, fiber, and DFM (P < 0.05) were observed. 9Interaction of period and fiber (P < 0.10) was observed.
5Interactions of period and fiber (P < 0.05) were observed.
6Interactions of period and fiber and fiber and DFM (P < 0.05) were observed. 7Interactions of period and fiber, period and DFM, and period and fiber and DFM (P < 0.05) were observed. 8Interaction of fiber and DFM (P < 0.05) was observed.
9Interactions of period and DFM, fiber and DFM, and period, fiber, and DFM (P < 0.10) were observed. 10Interactions of period and fiber (P < 0.05) and period and DFM (P < 0.10) were observed. 11Interactions of period and fiber and period and DFM (P < 0.05) were observed.

190
CHAPTER 7: DISAPPEARANCE OF NUTRIENTS AND ENERGY IN THE STOMACH
AND SMALL INTESTINE, CECUM, AND COLON OF PIGS FED CORN-SOYBEAN
MEAL DIETS CONTAINING DISTILLERS DRIED GRAINS WITH SOLUBLES,
WHEAT MIDDLINGS, OR SOYBEAN HULLS
ABSTRACT: Disappearance of nutrients and energy in the stomach and small intestine, cecum,
and colon of pigs fed diets containing distillers dried grains with solubles (DDGS), wheat
middlings, or soybean hulls was determined. A second objective was to test the hypothesis that
physical characteristics of dietary fiber in diets are correlated with the digestibility of nutrients
and energy by pigs fed experimental diets. Eight barrows (initial BW = 37.3 ± 1.0 kg) were
surgically equipped with a T-cannula in the distal ileum and a T-cannula in the colon
approximately 10 cm distal to the cecocolic junction. Pigs were randomly allotted to a replicated
4 × 4 Latin square design with 4 diets and 4 periods in each square. The basal diet was a corn-
soybean meal diet and 3 additional diets were formulated by substituting 30% of the nutrients
and energy from corn, soybean meal, and L-Lys HCl with DDGS, wheat middlings, or soybean
hulls. Titanium dioxide was included as an indigestible marker. Each period lasted 14 d. The
initial 8 d were considered an adaptation to the diet. On d 9 and 10, fecal samples were collected.
Colon digesta were collected for 8 h on d 11 and 12, whereas ileal digesta were collected for 8 h
on d 13 and 14. Values for apparent ileal digestibility (AID), apparent cecal digestibility (ACD),
and apparent total tract digestibility (ATTD) of nutrients and energy by pigs fed experimental
diets were calculated. Nutrient and energy flow along the gastrointestinal tract was calculated,
and disappearance of nutrients and energy was calculated using digestibility values and flow.
Results indicated that ACD and ATTD of soluble dietary fiber by pigs fed experimental diets
191
was not different. Pigs fed basal or wheat middlings diets had greater (P ≤ 0.05) ACD of
insoluble dietary fiber compared with pigs fed diets containing DDGS or soybean hulls.
Insoluble dietary fiber disappearance in the colon of pigs fed the soybean hulls diet was greater
(P ≤ 0.05) compared with other diets. Wheat middlings had greater (P ≤ 0.05) disappearance of
dietary fiber fractions compared with DDGS and soybean hulls. Water binding capacity, bulk
density, and viscosity of dietary fiber in experimental diets were not correlated with digestibility
of nutrients and energy by pigs. In conclusion, disappearance in the colon of most dietary fiber
fractions and energy was greater in diets containing soybean hulls or DDGS compared with basal
or wheat middlings diets.
Key words: cecum, co-products, dietary fiber, digestibility, pigs
INTRODUCTION
The U.S. swine feed industry has increased interest in co-product utilization because of
the potential to reduce diet costs by inclusion of less expensive ingredients in the diets. Distillers
dried grains with solubles (DDGS), wheat middlings, and soybean hulls are cost-effective co-
products that contain more dietary fiber and less starch compared with corn (Burkhalter et al.,
2001; Urriola et al., 2010; Jaworski et al., 2015). Feeding diets containing more dietary fiber
results in pigs obtaining a greater proportion of dietary energy from VFA produced via microbial
fermentation of dietary fiber compared with pigs fed high-starch and low-fiber diets (Bach
Knudsen, 2011). Microbial fermentation of dietary fiber varies among sources of dietary fiber
and, therefore, VFA absorption and utilization also varies (Urriola et al., 2010).
It is believed that the majority of microbial fermentation of dietary fiber occurs in the

192
cecum of pigs; however, the extent and degradation of specific dietary fiber fractions fermented
in the cecum and large intestine are unknown. Analyzed dietary fiber fractions, as well as the
physicochemical characteristics of diets, may be related to the amount of dietary fiber degraded
in specific sites of the gastrointestinal tract of pigs. Therefore, an experiment was conducted to
test the hypothesis that dietary physical characteristics of dietary fiber are correlated with the
digestibility of dietary fiber fractions and energy and may be used to predict the disappearance of
dietary fiber fractions and energy along the gastrointestinal tract of the pig. The first objective of
this experiment, therefore, was to quantify the disappearance of dietary fiber fractions in the
stomach and small intestine, cecum, and colon of pigs. The second objective was to determine
the correlation coefficients between physical dietary characteristics and the disappearance of
dietary fiber fractions along the gastrointestinal tract of the pig.
MATERIALS AND METHODS
The protocol for this experiment was reviewed and approved by the Institutional
Animal Care and Use Committee at the University of Illinois at Urbana-Champaign.
Animals, Housing, and Diets. Eight barrows (initial BW = 37.3 ± 1.0 kg) that were the
offspring of PIC359 boars and F-46 sows (Pig Improvement Company, Hendersonville, TN)
were surgically equipped with two T-cannulas. One cannula was placed in the distal ileum
according to Stein et al. (1998) and a second cannula was placed in the proximal colon
approximately 10 cm distal to the cecocolic junction. After surgery, pigs were housed in
individual pens and allowed to recover for 8 d. Each pen had a fully slatted tri-bar floor and was
equipped with a feeder and a nipple drinker. Cannulated pigs (initial BW = 41.0 ± 1.5 kg) were
193
randomly allotted to a replicated 4 × 4 Latin square design with 4 diets and 4 periods in each
square.
The DDGS was procured from One Earth Energy, Gibson City, IL (Table 7.1). Wheat
middlings were procured from Siemers Milling, Teutopolis, IL. Soybean hulls were procured
from Archer Daniels Midland Company, Decatur, IL.
Four experimental diets were prepared. The basal diet was a corn-soybean meal diet
(Table 7.2). Three additional diets were formulated by substituting 30% of the nutrients and
energy from corn, soybean meal, and L-Lys HCl with DDGS, wheat middlings, or soybean hulls.
Vitamins and minerals were included in all diets at 0.2% to meet current requirements (NRC,
2012) and titanium dioxide was included in all diets at 0.4% as an indigestible marker.
Feeding and Sample Collection. Pigs were provided feed in an amount equivalent to 3
times the estimated requirement for maintenance energy (i.e., 197 kcal ME / kg0.60; NRC, 2012)
and daily feed allotments were divided into two daily meals that were provided at 0700 and 1600
h. Water was available at all times. The BW of each pig was recorded at the beginning of the
experiment and at the end of each period. Each diet was fed during one 14-d period. The initial 8
d were considered the diet adaptation period. On d 9 and 10, fecal samples were collected and
stored at – 20°C immediately after collection. Colon digesta were collected for 8 h on d 11 and
12, whereas ileal digesta were collected for 8 h on d 13 and 14. Digesta were stored at -20°C
immediately after collection. The final BW of pigs was 84.7 ± 6.4 kg.
Chemical Analysis. Diets, ingredients, freeze-dried samples of ileal and colon digesta,
and feces dried at 65°C were ground through a 1 mm screen in a Wiley mill (model 4; Thomas
Scientific, Swedesboro, NJ). All samples were analyzed for DM (Method 930.15; AOAC Int.,
2007). Diets and ingredients were analyzed for ash (Method 942.05; AOAC Int., 2007) and acid

194
hydrolyzed ether extract (AEE) was determined by acid hydrolysis using 3N HCl (AnkomHCl,
Ankom Technology, Macedon, NY) followed by crude fat extraction using petroleum ether
(AnkomXT15, Ankom Technology, Macedon, NY). The concentration of GE in all samples was
determined using an isoperibol bomb calorimeter (model 6300, Parr Instruments, Moline, IL).
Benzoic acid was the standard for calibration. All diets and ingredients were analyzed for AA on
a Hitachi AA Analyzer, Model No. L8800 (Hitachi High Technologies America, Inc, Pleasanton,
CA) using ninhydrin for postcolum derivatization and norleucine as the internal standard. Prior
to analysis, samples were hydrolyzed with 6N HCl for 24 h at 110°C [Method 982.30 E(a);
AOAC Int., 2007]. Titanium concentration in all diets, ileal digesta samples, colon digesta
samples, and fecal samples were determined using an ICP procedure (Method 990.08; AOAC
Int., 2007). Samples were prepared using nitric acid-perchloric acid (Method 968.08 D(b);
AOAC Int., 2007). Total starch was analyzed in all diets and ingredients by the glucoamylase
procedure (Method 979.10; AOAC Int., 2007). All samples were analyzed for ADF and NDF
using Ankom Technology method 12 and 13, respectively (Ankom2000 Fiber Analyzer, Ankom
Technology, Macedon, NY), and ADL was analyzed in ingredients and diets using Ankom
Technology method 9 (Ankom DaisyII Incubator, Ankom Technology, Macedon, NY). Insoluble
and soluble dietary fiber was analyzed in all samples according to method 991.43 (AOAC Int.,
2007) using the AnkomTDF Dietary Fiber Analyzer (Ankom Technology, Macedon, NY).
Physicochemical Analysis. All samples of ingredients and diets were analyzed for water
binding capacity (Robertson et al., 2000) and bulk density (Cromwell et al., 2000). Values for
water binding capacity were expressed as the amount of water retained by the pellet (g / g;
Urriola and Stein, 2010). Viscosity was measured in ileal and colon digesta that was not freeze
dried using a Brookfield LV-DV-II+ Viscometer (Brookfield Eng. Lab. Inc., Middleboro, MA)

195
as described by Dikeman and Fahey (2006) using V-72, V-73, and V-75 spindles over a range of
speeds (0.5 to 6 rpm).
Calculations and Statistical Analysis. The concentration of total dietary fiber (insoluble
dietary fiber + soluble dietary fiber), cellulose (ADF – ADL), insoluble hemicelluloses (NDF –
ADF), non-starch polysaccharides (NSP; total dietary fiber – ADL), insoluble NSP (NSP –
soluble NSP), and non-cellulosic NSP (NSP – cellulose) were calculated for all samples. Total
nutrient concentration, on an as-fed basis, was calculated as the sum of ash, AEE, total AA,
starch, sugars, oligosaccharides, and total dietary fiber. Values for apparent ileal digestibility
(AID), apparent cecal digestibility (ACD), and apparent total tract digestibility (ATTD) of
nutrients and energy by pigs fed experimental diets were calculated according to Stein et al.
(2007). Values for AID, ACD, and ATTD of nutrients and energy in DDGS, wheat middlings,
and soybean hulls were calculated by multiplying the AID, ACD, or ATTD of nutrients and
energy in the corn-basal diet by 70.9% to calculate the contribution from the basal diet to the
AID, ACD, or ATTD of nutrients and energy in the DDGS, wheat middlings, or soybean hulls
test diets.
The ileal, cecal, and total tract flow of nutrients and energy (g or kcal / kg DMI) by pigs
fed experimental diets was calculated according to Urriola and Stein (2010). The disappearance
of nutrients and energy (g or kcal / kg DMI) in the stomach and small intestine of pigs was
calculated by subtracting the flow of nutrients and energy at the ileum from the nutrients and
energy in the experimental diets. Cecum disappearance of nutrients and energy was calculated by
subtracting the flow of nutrients and energy at the cecum from the flow of nutrients or energy at
the ileum. Disappearance of nutrients and energy by pigs in the colon was calculated by
subtracting the flow of nutrients and energy at the total tract from the flow of nutrients and

196
energy at the cecum. The disappearance of nutrients and energy in the stomach, small intestine,
cecum, and colon from DDGS, wheat middlings, and soybean hulls was calculated as the
difference between the flow of nutrients and energy from 70.9% of the basal corn-soybean meal
diet and the 3 diets containing DDGS, wheat middlings, or soybean hulls.
Viscosity of ileal and cecal digesta was calculated using the Rheocalc software
(Brookfield Eng. Lab. Inc., Middleboro, MA). The NLREG statistical software (NLREG,
Brentwood, TN) was used to report viscosity measurements in terms of the power law equation
(Cervantes-Pahm et al., 2013).
Homogeneity of the variance among treatments was confirmed using the UNIVARIATE
procedure of SAS. The BOXPLOT procedure of SAS (SAS Inst. Inc., Cary, NC) was used to
check for outliers. However, no outliers were identified. Data were analyzed using the MIXED
procedure (SAS Inst. Inc., Cary, NC) using pig and period as the random effects and diet or
ingredient as the fixed effect. Means were calculated using the LSMEANS statement in SAS.
Differences were evaluated using the PDIFF option. Correlation coefficients among
physicochemical characteristics of diets and the AID, ACD, and ATTD of nutrients and energy
by pigs fed experimental diets were determined using the CORR procedure (SAS Inst. Inc., Cary,
NC). The pig was the experimental unit for all analyses, except that dietary treatment was the
experimental unit for correlation analysis. A P-value ≤ 0.05 was used to determine significance
among dietary treatments for all outcomes.
RESULTS
All pigs were successfully cannulated at the distal ileum and in the proximal colon at
approximately 10 cm distal to the cecocolic junction. Pigs recovered from surgery without

197
complications and digesta were successfully collected from the cannula in the ileum and in the
colon. One pig fed the corn-soybean meal plus soybean hulls diet died in the middle of the
adaptation of period 3. Therefore, there were only 7 observations for the corn-soybean meal plus
soybean hulls diet.
Apparent Ileal, Cecal, and Total Tract Digestibility
The AID of DM and GE was least (P ≤ 0.05) in the diet containing soybean hulls and
greatest (P ≤ 0.05) in the basal corn-soybean meal diet, and the diet containing wheat middlings
had greater (P ≤ 0.05) AID of DM and GE than the DDGS diet (Table 7.3). The AID of ADF
was greater (P ≤ 0.05) in the basal diet and the diet containing wheat middlings compared with
the diet containing soybean hulls. The AID of NDF was least (P ≤ 0.05) in the diet containing
soybean hulls and greatest (P ≤ 0.05) in the wheat middlings diet. The AID of soluble dietary
fiber was greater (P ≤ 0.05) in the basal diet compared with diets containing soybean hulls or
DDGS. The AID of insoluble dietary fiber, total dietary fiber, NSP, insoluble NSP, and non-
cellulosic NSP was greater (P ≤ 0.05) in basal and wheat middlings diets compared with DDGS
and soybean hulls diets, but the AID of cellulose was less (P ≤ 0.05) in the soybean hulls diet
compared with the basal diet. The diet containing wheat middlings had the highest (P ≤ 0.05)
AID of insoluble hemicelluloses compared with the other 3 dietary treatments.
The ACD of DM and GE was least (P ≤ 0.05) in the diet containing soybean hulls and
greatest (P ≤ 0.05) in the basal corn-soybean meal diet, but the diet containing wheat middlings
had greater (P ≤ 0.05) ACD of DM and GE than the DDGS diet. The ACD of ADF in the basal
diet was greater (P ≤ 0.05) compared with diets containing DDGS or soybean hulls, and the
ACD of ADF in the wheat middlings diet was greater (P ≤ 0.05) compared with the diet
containing soybean hulls. The ACD of NDF was greater (P ≤ 0.05) in the wheat middlings diet
198
than in all other diets, but the soybean hull diet had less (P ≤ 0.05) ACD of NDF than all other
diets. The basal diet and the wheat middlings diet had the greatest (P ≤ 0.05) ACD of insoluble
dietary fiber, total dietary fiber, NSP, and insoluble NSP, followed by the diet containing DDGS,
whereas the soybean hulls diet had the least (P ≤ 0.05) ACD of these fractions. The basal diet
had greater (P ≤ 0.05) ACD of cellulose than diets containing DDGS or wheat middlings,
whereas the ACD of cellulose in the soybean hulls diet was less (P ≤ 0.05) than in all other diets.
The basal corn-soybean meal diet had the greatest (P ≤ 0.05) ATTD of DM and GE, and
diets containing DDGS or wheat middlings had greater ATTD of DM and GE (P ≤ 0.05) than the
soybean hull diet. With the exception of insoluble hemicelluloses and cellulose, the basal diet
had greater (P ≤ 0.05) ATTD of all dietary fiber components than the other diets but, with a few
exceptions, no differences among the other diets were observed. The DE was different (P ≤ 0.05)
among diets and was 3,430, 3,299, 3,218, and 2,948 kcal/kg in the basal diet, the DDGS diet, the
wheat middlings diet, and the soybean hull diet, respectively.
Wheat middlings had the greatest (P ≤ 0.05) AID of DM and GE followed by DDGS and
soybean hulls (Table 7.4). The AID of NDF, insoluble dietary fiber, total dietary fiber, insoluble
hemicelluloses, NSP, insoluble NSP, and non-cellulosic NSP also was greater (P ≤ 0.05) in
wheat middlings compared with DDGS and soybean hulls.
Wheat middlings also had the greatest (P ≤ 0.05) ACD of DM, GE, NDF, insoluble
dietary fiber, and total dietary fiber, and soybean hulls had the least (P ≤ 0.05) ACD of these
components. The ACD of ADF was greater (P ≤ 0.05) in DDGS compared with soybean hulls,
and the ACD of soluble dietary fiber, insoluble hemicelluloses, NSP, insoluble NSP, and non-
cellulosic NSP were greater (P ≤ 0.05) in wheat middlings compared with DDGS and soybean
hulls.
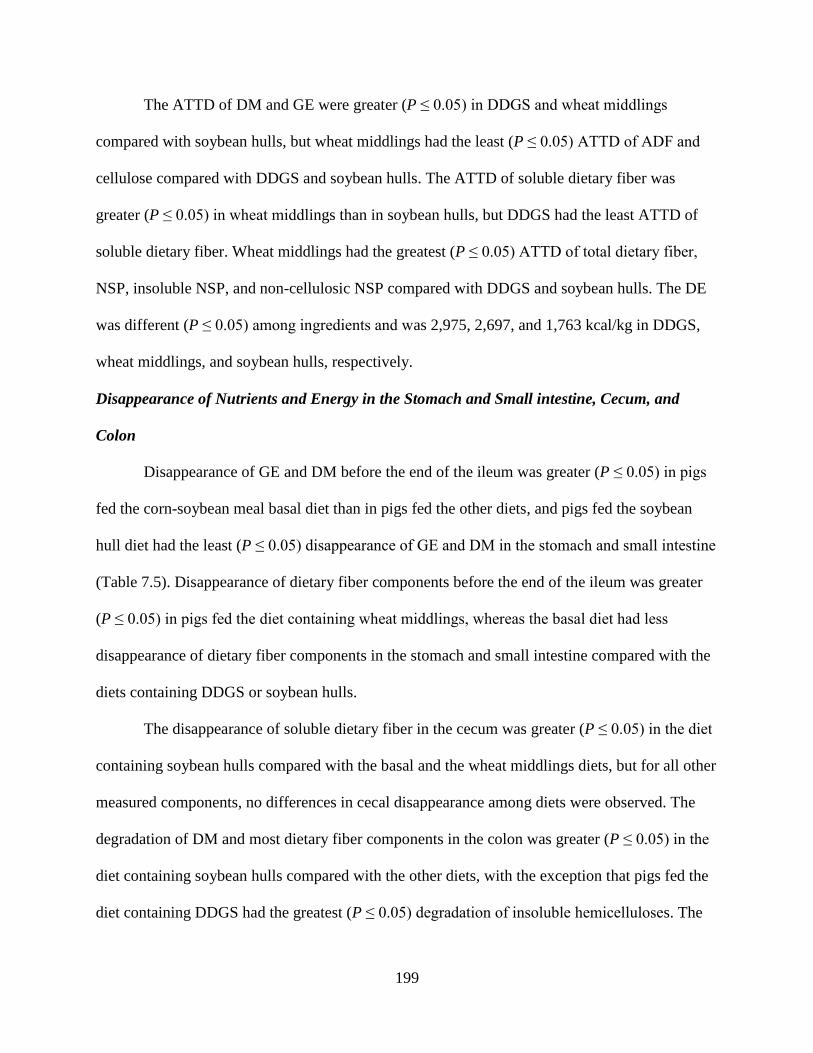
199
The ATTD of DM and GE were greater (P ≤ 0.05) in DDGS and wheat middlings
compared with soybean hulls, but wheat middlings had the least (P ≤ 0.05) ATTD of ADF and
cellulose compared with DDGS and soybean hulls. The ATTD of soluble dietary fiber was
greater (P ≤ 0.05) in wheat middlings than in soybean hulls, but DDGS had the least ATTD of
soluble dietary fiber. Wheat middlings had the greatest (P ≤ 0.05) ATTD of total dietary fiber,
NSP, insoluble NSP, and non-cellulosic NSP compared with DDGS and soybean hulls. The DE
was different (P ≤ 0.05) among ingredients and was 2,975, 2,697, and 1,763 kcal/kg in DDGS,
wheat middlings, and soybean hulls, respectively.
Disappearance of Nutrients and Energy in the Stomach and Small intestine, Cecum, and
Colon
Disappearance of GE and DM before the end of the ileum was greater (P ≤ 0.05) in pigs
fed the corn-soybean meal basal diet than in pigs fed the other diets, and pigs fed the soybean
hull diet had the least (P ≤ 0.05) disappearance of GE and DM in the stomach and small intestine
(Table 7.5). Disappearance of dietary fiber components before the end of the ileum was greater
(P ≤ 0.05) in pigs fed the diet containing wheat middlings, whereas the basal diet had less
disappearance of dietary fiber components in the stomach and small intestine compared with the
diets containing DDGS or soybean hulls.
The disappearance of soluble dietary fiber in the cecum was greater (P ≤ 0.05) in the diet
containing soybean hulls compared with the basal and the wheat middlings diets, but for all other
measured components, no differences in cecal disappearance among diets were observed. The
degradation of DM and most dietary fiber components in the colon was greater (P ≤ 0.05) in the
diet containing soybean hulls compared with the other diets, with the exception that pigs fed the
diet containing DDGS had the greatest (P ≤ 0.05) degradation of insoluble hemicelluloses. The

200
degradation of GE in the large intestine of pigs fed diets containing DDGS or soybean hulls was
greater (P ≤ 0.05) compared with the degradation in the basal diet and the diet containing wheat
middlings.
The disappearance of DM and all dietary fiber components before the end of the ileum
was greater (P ≤ 0.05) from wheat middlings compared with DDGS and soybean hulls (Table
7.6). Disappearance of GE in the stomach and small intestine was greater for wheat middlings
compared with soybean hulls.
There were no differences among DDGS, wheat middlings, or soybean hulls in the
disappearance of DM, GE, or dietary fiber components in the cecum of pigs. However,
disappearance of DM and most dietary fiber components in the colon was greater (P ≤ 0.05)
from soybean hulls than from DDGS and wheat middlings, and wheat middlings had the least (P
≤ 0.05) disappearance of dietary fiber components in the colon. The disappearance of GE in the
large intestine of pigs was also less (P ≤ 0.05) for wheat middlings compared with DDGS and
soybean hulls.
Physical Characteristics of Ileal and Cecal Digesta and Feces
The water binding capacity of ileal digesta from pigs fed the diet containing soybean
hulls was greater (P ≤ 0.05) compared with the other 3 diets (Table 7.7). Ileal digesta viscosity
was less (P ≤ 0.05) in pigs fed the diet containing wheat middlings than in digesta from pigs fed
diets containing DDGS or soybean hulls. The water binding capacity of cecal digesta from pigs
fed the diet containing soybean hulls was greater (P ≤ 0.05) than in digesta from all other diets,
and water binding capacity of cecal digesta from pigs fed the wheat middlings or DDGS diets
was greater (P ≤ 0.05) than in digesta from pigs fed the basal diet. The water binding capacity of
feces from pigs fed the wheat middlings diet was greater (P ≤ 0.05) than that of all other diets,

201
but pigs fed the basal diet or the soybean hull diets had water binding capacity in feces that was
less (P ≤ 0.05) than in the other diets.
Correlations between Physical Characteristics and Digestibility
A positive correlation between bulk density of experimental diets and ACD of GE (r =
0.88; P ≤ 0.05) was observed; however, no other correlations between physical characteristics of
experimental diets and digestibility were significant. Therefore, only the correlation coefficients
between physical characteristics of diets and ACD of nutrients and energy are presented in Table
7.8.
DISCUSSION
Ingredients used in this experiment contained similar concentrations of nutrients and
energy as reported by NRC (2012). Oil was not removed from DDGS used in this experiment
because DDGS contained 9.89% AEE which is approximately 3 times greater compared with
corn (3.27%). Corn contained 13.41% total dietary fiber and DDGS contained 38.72% total
dietary fiber, once again, approximately 3 times greater compared with corn. Soybean meal,
wheat middlings, and soybean hulls contained 18.80, 37.11, and 67.46% total dietary fiber,
respectively.
The ATTD of DM and GE in the corn-soybean meal basal diet and the diet containing
DDGS used in the current experiment are in agreement with previous research that used similar
corn-soybean meal diets (Urriola and Stein, 2010). The ATTD of DM, GE, insoluble dietary
fiber, total dietary fiber, and insoluble NSP for the corn-soybean meal basal diet compared with
the other 3 diets is likely the reason for the greater DE that was observed in the corn-soybean
meal basal diet compared with the other 3 diets. The DE obtained for experimental diets in the
current experiment are in agreement with calculated values (NRC, 2012). The ATTD of soluble

202
dietary fiber in experimental diets was, on average, 86.5% and this was in agreement with
Urriola and Stein (2010). The average ATTD of soluble dietary fiber was 20 percentage units
greater compared with the ATTD of insoluble dietary fiber among experimental diets, thus
confirming results indicating that soluble dietary fiber is more fermentable by pigs compared
with insoluble dietary fiber (Urriola et al., 2010). Due to the differentiation of components of
dietary fiber, it was possible to distinguish the digestibility of the different dietary fiber fractions.
The ATTD of cellulose by pigs fed the basal diet or the DDGS diet was greater compared with
the ATTD of insoluble hemicelluloses, whereas diets containing wheat middlings and soybean
hulls had greater ATTD of insoluble hemicelluloses, NSP, insoluble NSP, and non-cellulosic
NSP compared with cellulose. It may be speculated that cellulolytic enzymes and bacteria are
utilized in ethanol production, and this may render the cellulose in DDGS more susceptible for
fermentation in the pig.
The AID, ACD, and ATTD of DM and GE are less in DDGS, wheat middlings, and
soybean hulls than in the experimental diets because these ingredients contain more dietary fiber
and less starch. The ATTD of total dietary fiber from DDGS was 54.69% in the current
experiment, which is in agreement with the average ATTD of total dietary fiber from 8 DDGS
sources (49.5%) obtained by Urriola et al. (2010). The ATTD of most dietary fiber fractions
were greater in wheat middlings compared with DDGS and soybean hulls; however, the ATTD
of GE was not different between wheat middlings and DDGS. This may be explained by the
greater concentration of fat in DDGS compared with wheat middlings.
The AID of dietary fiber fractions in diets and ingredients are relatively low and in
agreement with data from Bach Knudsen et al. (2013), indicating that the AID of NSP by pigs
range from -7 to 40%. The ACD of soluble dietary fiber in diets and ingredients was greater than

203
the AID of soluble dietary fiber, whereas values for the ACD of insoluble dietary fiber were
close to values observed for the AID of insoluble dietary fiber. This observation indicates that
mainly soluble dietary fiber is fermented in the cecum. However, the ACD of GE was close to
the AID of GE in diets and ingredients, which indicates that fermentation of soluble dietary fiber
in the cecum has a low energy contribution. This is likely mostly because the concentration of
soluble dietary fiber is low in the diets and ingredients used in the current experiment.
The colon of pigs is the main site for insoluble dietary fiber fermentation as indicated by
the greater disappearance of insoluble dietary fiber fractions in the colon compared with the
stomach and small intestine, and the cecum. To our knowledge, this is the first time dietary fiber
fermentation has been estimated separately in the cecum and in the colon of pigs. The structure
of insoluble dietary fiber fractions is much more hydrophobic and crystalline and, therefore,
microbial fermentation of insoluble dietary fiber fractions occurs more slowly and requires
longer retention time in the colon of pigs compared with soluble dietary fiber (Bach Knudsen
and Hansen, 1991; Wilfart et al., 2007). Differences in size and microbial populations of the
cecum and the colon also may influence dietary fiber fermentation. The cecum and colon have
been reported to be 0.3 and 1.75% of the empty BW of pigs, respectively, and this difference in
size indicates the importance of the colon to dietary fiber fermentation (Agyekum et al., 2012).
Total viable counts of anaerobic bacteria increase from 109 viable counts in the distal ileum to
1012 viable counts in pig feces and it is expected that viable counts in the cecum is between the
values in the ileum and the colon (Jensen and Jørgensen, 1994).
Antithetical to our hypothesis, water binding capacity and bulk density of experimental
diets were not correlated with ileal, cecal, or total tract digestibility of nutrients and energy, with
the exception that bulk density was positively correlated with ACD of GE. Serena et al. (2008)
204
also were unable to correlate physicochemical properties of dietary fiber and digestibility of
energy in sows.
Overall, ATTD of insoluble dietary fiber in wheat middlings was greater than in DDGS
and soybean hulls, but the ATTD of cellulose was less in wheat middlings. However, the energy
contribution from cellulose fermentation in wheat middlings is relatively low because wheat
middlings has a low concentration of cellulose. Soybean hulls had the greatest concentration of
total dietary fiber and the least concentrations of starch and fat and, as a result, fermentation of
dietary fiber contributes the majority of the DE in soybean hulls. The energy contribution from
dietary fiber fermentation is much less compared with the energy contribution from enzymatic
digestion of starch and fat, which is the reason soybean hulls had the least DE compared with
DDGS and wheat middlings (Nelson and Cox, 2008). The ATTD of soluble dietary fiber in
DDGS in the current experiment was less compared with the ATTD of soluble dietary fiber in 8
sources of DDGS determined by Urriola et al. (2010). The ATTD of soluble dietary fiber was
also less than the ATTD of insoluble dietary fiber in DDGS and these differences may be
attributed to the low concentration of soluble dietary fiber in DDGS as well as differences in
ethanol production today compared with several years ago. A greater variety of cellulolytic
enzymes and bacteria are utilized in ethanol plants today and it is also likely that the efficacy of
cellulose degradation by ethanol plants has been improved; therefore, the dietary fiber fractions
remaining in DDGS may be different.
CONCLUSION
In contrast to our hypothesis, the physical characteristics of dietary fiber in experimental
diets were not correlated with the digestibility of energy or dietary fiber fractions in experimental
diets. Soluble dietary fiber is mostly fermented in the cecum of pigs, but this does not contribute

205
a great amount of energy supply to the pig due to the low concentration of soluble dietary fiber in
most swine diets. Insoluble dietary fiber is mostly fermented in the colon of pigs and contributes
a significant energy supply to pigs fed diets containing DDGS, wheat middlings, or soybean
hulls because the concentration of insoluble dietary fiber is greater when these co-products are
added to a corn-soybean meal diet. Dietary fiber fractions in wheat middlings are more
fermentable compared with the dietary fiber fractions in DDGS and soybean hulls; however, the
DE in DDGS is similar to that of wheat middlings because of the greater concentration of fat in
DDGS compared with wheat middlings. The DE in soybean hulls is mostly attributed to
insoluble dietary fiber fermentation in the colon, and this is the reason the DE in soybean hulls is
less than in DDGS or wheat middlings.

206
LITERATURE CITED
Agyekum, A. K., B. A. Slominski, and C. M. Nyachoti. 2012. Organ weight, intestinal
morphology, and fasting whole-body oxygen consumption in growing pigs fed diets
containing distillers dried grains with solubles alone or in combination with a
multienzyme supplement. J. Anim. Sci. 90:9:3032-3040.
AOAC Int. 2007 AOAC International. 2007. Official Methods of Analysis of AOAC Int. 18th
ed. Rev. 2. W. Hortwitz and G. W. Latimer, Jr., eds. AOAC Int., Gaithersburg, MD.
Bach Knudsen, K. E. 2011. Triennial growth symposium: Effects of polymeric carbohydrates on
growth and development in pigs. J. Anim. Sci. 89:7:1965-1980.
Bach Knudsen, K. E., and I. Hansen. 1991. Gastrointestinal implications in pigs of wheat and oat
fractions. 1. Digestibility and bulking properties of polysaccharides and other major
constituents. Br. J. Nutr. 65:217-232.
Bach Knudsen, K. E., H. N. Lærke, and H. Jørgensen. 2013. Carbohydrates and carbohydrate
utilization in swine. In: L. I. Chiba, editor, Sustainable Swine Nutrition. John Wiley &
Sons, Inc., Ames, IA. p. 109-135.
Burkhalter, T. M., N. R. Merchen, L. L. Bauer, S. M. Murray, A. R. Patil, J. L. Brent Jr., and G.
C. Fahey Jr. 2001. The ratio of insoluble to soluble fiber components in soybean hulls
affects ileal and total-tract nutrient digetibilities and fecal characteristics of dogs. J. Nutr.
131:1978-1985.
Cervantes-Pahm, S. K., Y. Liu, and H. H. Stein. 2013. Comparative digestibility of energy and
nutrients and fermentability of dietary fiber in eight cereal grains fed to pigs. J. Sci. Food
Agric. 94:841-849.

207
Cromwell, G. L., T. R. Cline, J. D. Crenshaw, T. D. Crenshaw, R. A. Easter, R. C. Ewan, C. R.
Hamilton, G. M. Hill, A. J. Lewis, D. C. Mahan, J. L. Nelssen, J. E. Pettigrew, T. L.
Veum, and J. T. Yen. 2000. Variability among sources and laboratories in analyses of
wheat middlings. J. Anim. Sci. 78:2652-2658.
Dikeman, C. L., M. R. Murphy, and G. C. Fahey, Jr. 2006. Dietary fibers affect viscosity of
solutions and simulated human gastric and small intestinal digesta. J. Nutr. 136:913-919.
Jaworski, N. W., A. Owusu-Asiedu, A. Awati, A. Thomas, and H. H. Stein. 2015a. Effect of a 3-
strain Bacillus-based direct-fed microbial on growth performance, volatile fatty acid
production, carcass characteristics, and gastrointestinal tract weights in growing-finishing
pigs fed low or high fiber diets. J. Anim. Sci. 93(Suppl. s3):856 (Abstr.).
Jaworski, N. W., A. Owusu-Asiedu, A. Awati, A. Thomas, and H. H. Stein. 2015b. Effect of a 3-
strain Bacillus-based direct-fed microbial on growth performance and volatile fatty acid
production in nursery pigs fed low or high fiber diets. J. Anim. Sci. 93(Suppl. s3):856
(Abstr.).
Jaworski, N. W., H. N. Lærke, K. E. Bach Knudsen, and H. H. Stein. 2015. Carbohydrate
composition and in vitro digestibility of dry matter and nonstarch polysaccharides in
corn, sorghum, and wheat and coproducts from these grains. J. Anim. Sci. 93:1103-1113.
Jensen, B. B., and H. Jørgensen. 1994. Effect of dietary fiber on microbial activity and microbial
gas production in various regions of the gastrointestinal tract of pigs. Appl. Environ.
Microbiol. 60:1897-1904.
Nelson D. L., and M. M. Cox. 2008. Carbohydrates and glycobiology. P 235-241 in Lehninger
Principles of Biochemistry 5th Ed. W. H. Freeman, New York, NY.
208
NRC. 2012. Nutrient Requirements of Swine. 10th rev. ed. Natl. Acad. Press, Washington, DC.
Robertson, J. A., F. D. de Monredon, P. Dysseler, F. Guillon, R. Amado, and J. Thibault. 2000.
Hydration properties of dietary fibre and resistant starch: a European collaborative study.
Lebensm.-Wiss. u.-Technol. 33:72-79.
Serena, A., H. Jørgensen, and K. E. Bach Knudsen. 2008. Digestion of carbohydrates and
utilization of energy in sows fed diets with contrasting levels and physicochemical
properties of dietary fiber. J. Anim. Sci. 86:2208-2216.
Stein, H. H., B. Séve, M. F. Fuller, P. J. Moughan, and C. F. M. de Lange. 2007. Invited review:
Amino acid bioavailability and digestibility in pig feed ingredients: Terminology and
application. J. Anim. Sci. 85:172-180.
Stein, H. H., C. F. Shipley, and R. A. Easter. 1998. Technical Note: A technique for inserting a
T-cannula into the distal ileum of pregnant sows. J. Anim. Sci. 76:1433-1436.
Urriola, P. E., and H. H. Stein. 2010. Effects of distillers dried grains with solubles on amino
acid, energy, and fiber digestibility and on hindgut fermentation of dietary fiber in a corn-
soybean meal diet fed to growing pigs. J. Anim. Sci. 88:1454-1462.
Urriola, P. E., G. C. Shurson, and H. H. Stein. 2010. Digestibility of dietary fiber in distillers
coproducts fed to growing pigs. J. Anim. Sci. 88:7:2373-2381.
Wilfart, A., L. Montagne, H. Simmins, J. van Milgen, and J. Noblet. 2007. Sites of nutrient
digestion in growing pigs: Effects of dietary fiber. J. Anim. Sci. 85:976-983.
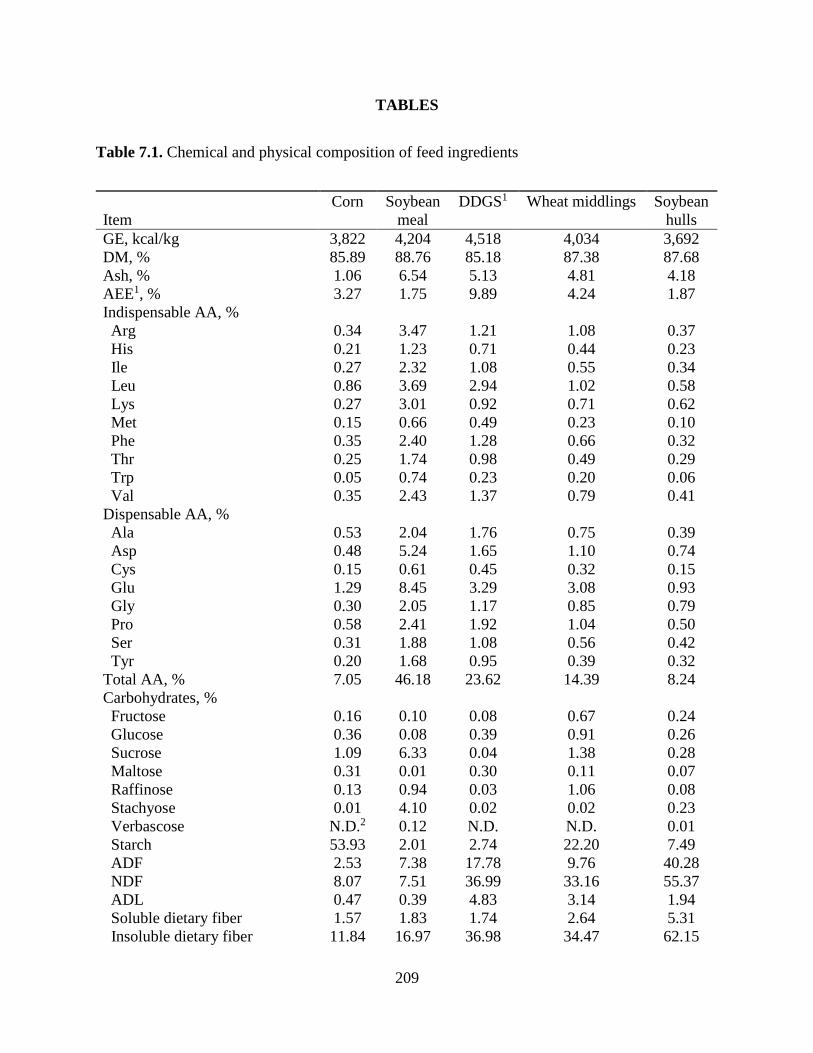
209
TABLES
Table 7.1. Chemical and physical composition of feed ingredients
Item
Corn Soybean
meal
DDGS1 Wheat middlings Soybean
hulls
GE, kcal/kg 3,822 4,204 4,518 4,034 3,692
DM, % 85.89 88.76 85.18 87.38 87.68
Ash, % 1.06 6.54 5.13 4.81 4.18
AEE1, % 3.27 1.75 9.89 4.24 1.87
Indispensable AA, %
Arg 0.34 3.47 1.21 1.08 0.37
His 0.21 1.23 0.71 0.44 0.23
Ile 0.27 2.32 1.08 0.55 0.34
Leu 0.86 3.69 2.94 1.02 0.58
Lys 0.27 3.01 0.92 0.71 0.62
Met 0.15 0.66 0.49 0.23 0.10
Phe 0.35 2.40 1.28 0.66 0.32
Thr 0.25 1.74 0.98 0.49 0.29
Trp 0.05 0.74 0.23 0.20 0.06
Val 0.35 2.43 1.37 0.79 0.41
Dispensable AA, %
Ala 0.53 2.04 1.76 0.75 0.39
Asp 0.48 5.24 1.65 1.10 0.74
Cys 0.15 0.61 0.45 0.32 0.15
Glu 1.29 8.45 3.29 3.08 0.93
Gly 0.30 2.05 1.17 0.85 0.79
Pro 0.58 2.41 1.92 1.04 0.50
Ser 0.31 1.88 1.08 0.56 0.42
Tyr 0.20 1.68 0.95 0.39 0.32
Total AA, % 7.05 46.18 23.62 14.39 8.24
Carbohydrates, %
Fructose 0.16 0.10 0.08 0.67 0.24
Glucose 0.36 0.08 0.39 0.91 0.26
Sucrose 1.09 6.33 0.04 1.38 0.28
Maltose 0.31 0.01 0.30 0.11 0.07
Raffinose 0.13 0.94 0.03 1.06 0.08
Stachyose 0.01 4.10 0.02 0.02 0.23
Verbascose N.D.2 0.12 N.D. N.D. 0.01
Starch 53.93 2.01 2.74 22.20 7.49
ADF 2.53 7.38 17.78 9.76 40.28
NDF 8.07 7.51 36.99 33.16 55.37
ADL 0.47 0.39 4.83 3.14 1.94
Soluble dietary fiber 1.57 1.83 1.74 2.64 5.31
Insoluble dietary fiber 11.84 16.97 36.98 34.47 62.15
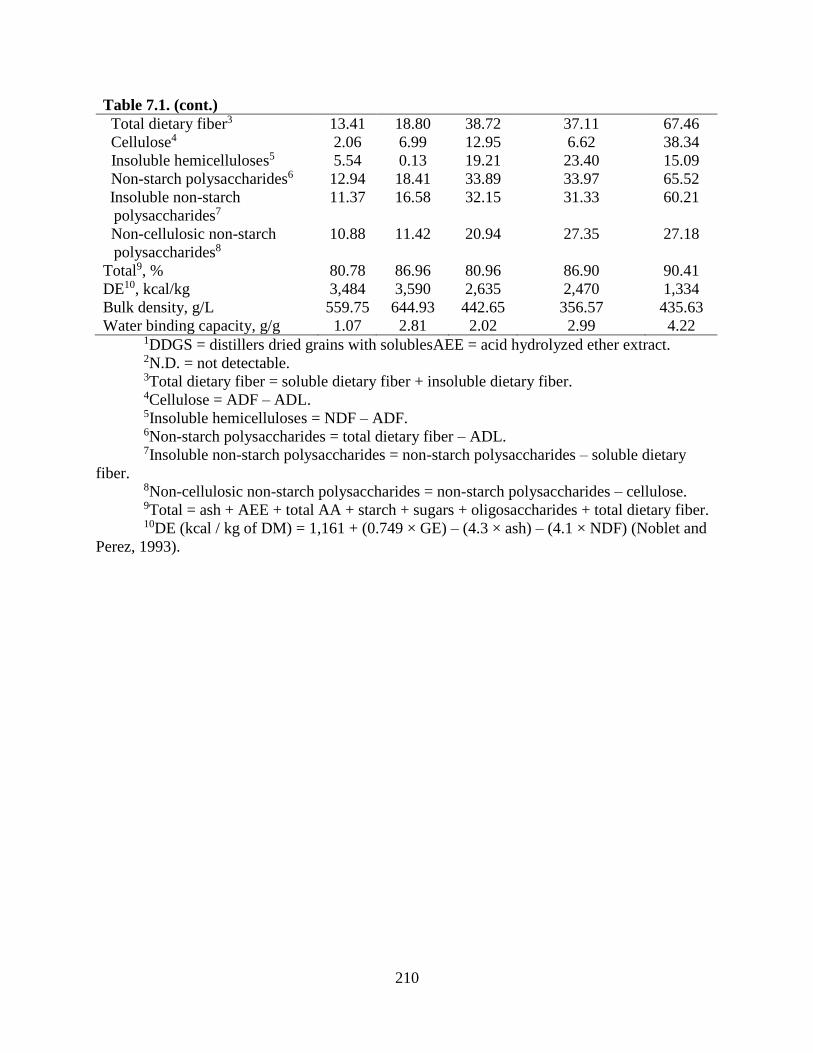
210
Table 7.1. (cont.)
Total dietary fiber3 13.41 18.80 38.72 37.11 67.46
Cellulose4 2.06 6.99 12.95 6.62 38.34
Insoluble hemicelluloses5 5.54 0.13 19.21 23.40 15.09
Non-starch polysaccharides6 12.94 18.41 33.89 33.97 65.52
Insoluble non-starch
polysaccharides7
11.37 16.58 32.15 31.33 60.21
Non-cellulosic non-starch
polysaccharides8
10.88 11.42 20.94 27.35 27.18
Total9, % 80.78 86.96 80.96 86.90 90.41
DE10, kcal/kg 3,484 3,590 2,635 2,470 1,334
Bulk density, g/L 559.75 644.93 442.65 356.57 435.63
Water binding capacity, g/g 1.07 2.81 2.02 2.99 4.22 1DDGS = distillers dried grains with solublesAEE = acid hydrolyzed ether extract. 2N.D. = not detectable. 3Total dietary fiber = soluble dietary fiber + insoluble dietary fiber. 4Cellulose = ADF – ADL. 5Insoluble hemicelluloses = NDF – ADF. 6Non-starch polysaccharides = total dietary fiber – ADL. 7Insoluble non-starch polysaccharides = non-starch polysaccharides – soluble dietary
fiber. 8Non-cellulosic non-starch polysaccharides = non-starch polysaccharides – cellulose. 9Total = ash + AEE + total AA + starch + sugars + oligosaccharides + total dietary fiber. 10DE (kcal / kg of DM) = 1,161 + (0.749 × GE) – (4.3 × ash) – (4.1 × NDF) (Noblet and
Perez, 1993).

211
Table 7.2. Ingredient composition, analyzed nutrients and energy, and physical characteristics of
experimental diets
Item
Basal Basal +
DDGS1
Basal + wheat
middlings
Basal + soybean
hulls
Ingredient, %
Corn 64.50 45.15 45.15 45.15
Soybean meal 32.25 22.58 22.58 22.58
DDGS - 29.10 - -
Wheat middlings - - 29.10 -
Soybean hulls - - - 29.10
Limestone 0.85 0.85 0.85 0.85
Dicalcium P 1.15 1.15 1.15 1.15
Lysine HCl 0.25 0.18 0.18 0.18
Titanium dioxide 0.40 0.40 0.40 0.40
Salt 0.40 0.40 0.40 0.40
Vitamin-mineral premix2 0.20 0.20 0.20 0.20
Analyzed composition
GE, kcal/kg 3,831 3,968 3,862 3,745
DM, % 87.22 87.04 87.44 87.59
Ash, % 5.76 6.01 6.07 6.12
AEE3, % 3.15 4.97 3.33 2.52
Indispensable AA, %
Arg 1.38 1.24 1.24 1.01
His 0.55 0.57 0.50 0.43
Ile 0.94 0.91 0.80 0.73
Leu 1.81 2.05 1.54 1.39
Lys 1.37 1.15 1.21 1.13
Met 0.29 0.33 0.27 0.22
Phe 1.03 1.06 0.89 0.78
Thr 0.76 0.78 0.65 0.58
Trp 0.28 0.26 0.25 0.21
Val 1.04 1.07 0.93 0.81
Dispensable AA, %
Ala 1.02 1.20 0.93 0.81
Asp 2.09 1.87 1.74 1.61
Cys 0.30 0.33 0.29 0.25
Glu 3.67 3.50 3.45 2.77
Gly 0.86 0.90 0.84 0.83
Pro 1.23 1.38 1.13 0.98
Ser 0.85 0.88 0.74 0.69
Tyr 0.68 0.71 0.57 0.54
Total AA, % 20.33 20.34 18.14 16.11
Carbohydrates, %

212
Table 7.2. (cont.)
Fructose 0.20 0.12 0.37 0.35
Glucose 0.26 0.37 0.60 0.40
Sucrose 2.69 1.80 2.22 1.78
Maltose 0.16 0.18 0.23 0.33
Raffinose 0.39 0.26 0.59 0.28
Stachyose 1.29 0.77 0.91 0.90
Verbascose 0.03 0.02 0.02 0.02
Starch 35.09 27.64 32.51 28.83
ADF 3.93 6.43 5.18 15.00
NDF 7.68 16.30 15.01 21.72
ADL 0.45 1.11 1.21 0.88
Soluble dietary fiber 1.49 1.37 2.02 2.21
Insoluble dietary fiber 12.14 19.00 19.06 26.35
Total dietary fiber4 13.63 20.37 21.08 28.56
Cellulose5 3.48 5.32 3.97 14.12
Insoluble hemicelluloses6 3.75 9.87 9.83 6.72
Non-starch polysaccharides7 13.18 19.26 19.87 27.68
Insoluble non-starch
polysaccharides8
11.69 17.89 18.66 26.80
Non-cellulosic non-starch
polysaccharides9
9.70 13.94 15.90 13.56
Total10, % 82.98 82.85 86.07 86.20
DE11, kcal/kg 3,393 3,429 3,270 2,959
Bulk density, g/L 638.68 584.13 533.40 574.07
Water binding capacity, g/g 1.47 1.58 1.84 2.21 1DDGS = distillers dried grains with solubles.
2The vitamin-micromineral premix provided the following quantities of vitamins and
micro-minerals per kilogram of complete diet: Vitamin A as retinyl acetate, 11,136 IU; vitamin
D3 as cholecalciferol, 2,208 IU; vitamin E as DL-alpha tocopheryl acetate, 66 IU; vitamin K as
menadione dimethylprimidinol bisulfite, 1.42 mg; thiamin as thiamine mononitrate, 0.24 mg;
riboflavin, 6.59 mg; pyridoxine as pyridoxine hydrochloride, 0.24 mg; vitamin B12, 0.03 mg; D-
pantothenic acid as D-calcium pantothenate, 23.5 mg; niacin, 44.1 mg; folic acid, 1.59 mg;
biotin, 0.44 mg; Cu, 20 mg as copper sulfate; Fe, 126 mg as iron sulfate; I, 1.26 mg as
ethylenediamine dihydriodide; Mn, 60.2 mg as manganous sulfate; Se, 0.25 mg as sodium
selenite and selenium yeast; and Zn, 124.9 mg as zinc sulfate. 3AEE = acid hydrolyzed ether extract. 4Total dietary fiber = soluble dietary fiber + insoluble dietary fiber. 5Cellulose = ADF – ADL. 6Insoluble hemicelluloses = NDF – ADF. 7Non-starch polysaccharides = total dietary fiber – ADL. 8Insoluble non-starch polysaccharides = non-starch polysaccharides – soluble dietary
fiber. 9Non-cellulosic non-starch polysaccharides = non-starch polysaccharides – cellulose. 10Total = ash + AEE + total AA + starch + sugars + oligosaccharides + total dietary fiber. 11DE calculated from NRC (2012).

213
Table 7.3. Apparent ileal, cecal, and total tract digestibility of dry matter, energy, and nutrients
in experimental diets
Item
Basal Basal +
DDGS
Basal +
wheat
middlings
Basal +
soybean
hulls
SEM P-value
Apparent ileal digestibility, %
DM 72.6a 56.0c 62.8b 48.9d 1.4 < 0.001
GE 74.6a 60.8c 65.5b 54.7d 1.3 < 0.001
ADF 29.5a 20.6ab 24.5a 10.7b 4.9 0.014
NDF 26.0b 24.1b 38.5a 15.0c 4.2 < 0.001
Soluble dietary fiber 43.9a 5.3c 33.7ab 17.8bc 7.6 0.002
Insoluble dietary fiber 41.2a 23.3b 43.0a 17.6b 3.6 < 0.001
Total dietary fiber 41.5a 22.1b 42.0a 17.6b 3.5 < 0.001
Cellulose 30.2a 17.4bc 24.9ab 9.9c 5.1 0.009
Insoluble hemicelluloses 22.5b 26.4b 46.0a 25.4b 4.0 < 0.001
Non-starch polysaccharides 42.0a 21.4b 43.2a 17.5b 3.6 < 0.001
Insoluble non-starch
polysaccharides
41.9a 22.6b 44.3a 17.4b 3.7 < 0.001
Non-cellulosic non-starch
polysaccharides
46.5a 22.8b 47.9a 24.9b 4.0 < 0.001
Apparent cecal digestibility, %
DM 75.7a 61.3c 68.0b 53.3d 1.4 < 0.001
GE 74.6a 61.2c 67.6b 55.7d 1.5 < 0.001
ADF 27.0a 21.9ab 19.3b 8.6c 3.1 < 0.001
NDF 26.6b 23.3b 37.6a 16.0c 2.7 < 0.001
Soluble dietary fiber 67.6 62.1 66.7 67.5 4.5 0.637
Insoluble dietary fiber 48.7a 31.9b 47.6a 22.7c 2.2 < 0.001
Total dietary fiber 50.7a 33.9b 49.4a 26.1c 2.3 < 0.001
Cellulose 30.4a 20.0b 21.5b 7.8c 3.2 < 0.001
Insoluble hemicelluloses 26.1bc 24.3c 47.4a 32.2b 2.9 < 0.001
Non-starch polysaccharides 52.5a 34.1b 51.7a 26.4c 2.3 < 0.001
Insoluble non-starch
polysaccharides
50.6a 32.0b 50.1a 22.9c 2.2 < 0.001
Non-cellulosic non-starch
polysaccharides
60.4a 39.5c 59.4a 45.3b 2.5 < 0.001
Apparent total tract
digestibility, %
DM 89.1a 82.8b 82.9b 78.3c 0.7 < 0.001
GE 89.5a 83.1b 83.3b 78.7c 0.7 < 0.001
ADF 66.3a 67.2a 40.3c 56.9b 3.7 < 0.001
NDF 63.9 66.2 61.9 63.5 2.1 0.345
Soluble dietary fiber 86.6 84.1 90.1 85.4 3.8 0.122
Insoluble dietary fiber 71.2a 64.1b 64.7b 64.0b 1.9 0.001

214
Table 7.3. (cont.)
Total dietary fiber 72.9a 65.5b 67.1b 65.7b 1.8 < 0.001
Cellulose 72.2a 69.8a 52.7c 60.1b 3.3 < 0.001
Insoluble hemicelluloses 61.3b 65.6b 73.3a 78.0a 2.1 < 0.001
Non-starch polysaccharides 74.7a 66.1c 71.3ab 67.6bc 1.9 < 0.001
Insoluble non-starch
polysaccharides
73.1a 64.7c 69.1b 66.0bc 1.9 0.001
Non-cellulosic non-starch
polysaccharides
75.5a 64.7b 75.9a 75.3a 1.7 < 0.001
DE, kcal/kg 3,430a 3,299b 3,218c 2,948d 27 < 0.001 a-dValues within a row lacking a common superscript letter are different (P < 0.05).

215
Table 7.4. Apparent ileal, cecal, and total tract digestibility of dry matter, energy, and nutrients
in distillers dried grains with solubles (DDGS), wheat middlings, and soybean hulls
Item
DDGS Wheat
middlings
Soybean
hulls
SEM P-value
Apparent ileal digestibility, %
DM 15.7b 39.0a -8.1c 5.4 < 0.001
GE 29.2b 42.4a 1.3c 4.7 < 0.001
ADF 9.3 15.6 6.7 8.7 0.657
NDF 22.7b 44.9a 11.0b 7.1 0.001
Soluble dietary fiber -74.3b 28.4a -3.1a 18.8 0.001
Insoluble dietary fiber 7.7b 45.9a 5.3b 7.0 < 0.001
Total dietary fiber 4.1b 44.6a 4.5b 7.0 < 0.001
Cellulose 4.5 12.2 5.5 10.3 0.752
Insoluble hemicelluloses 35.1b 57.2a 24.7b 7.1 0.001
Non-starch polysaccharides 1.5b 46.6a 3.8b 7.4 < 0.001
Insoluble non-starch
polysaccharides
5.5b 48.2a 4.5b 7.4 < 0.001
Non-cellulosic non-starch
polysaccharides
-0.5b 55.3a 2.1b 8.3 < 0.001
Apparent cecal digestibility, %
DM 24.5b 47.7a -2.3c 5.1 < 0.001
GE 28.0b 47.1a 2.1c 5.4 < 0.001
ADF 11.7a 7.2ab 3.2b 4.2 0.023
NDF 21.1b 42.4a 11.3c 3.3 < 0.001
Soluble dietary fiber 26.8b 81.8a 50.7b 10.7 0.001
Insoluble dietary fiber 17.1b 47.8a 9.3c 3.4 < 0.001
Total dietary fiber 17.6b 50.2a 13.0b 3.5 < 0.001
Cellulose 7.2 4.1 2.1 4.9 0.433
Insoluble hemicelluloses 29.9b 57.8a 32.5b 3.9 < 0.001
Non-starch polysaccharides 16.7b 53.5a 12.6b 3.6 < 0.001
Insoluble non-starch
polysaccharides
16.0b 51.2a 9.0b 3.6 < 0.001
Non-cellulosic non-starch
polysaccharides
22.0b 66.0a 24.9b 4.9 < 0.001
Apparent total tract digestibility, %
DM 68.6a 68.4a 52.7b 2.8 < 0.001
GE 64.8a 66.3a 46.9b 3.0 < 0.001
ADF 46.7a 8.2b 56.6a 5.8 < 0.001
NDF 66.6 60.2 63.9 3.5 0.209
Soluble dietary fiber 46.4c 116.9a 63.5b 9.4 < 0.001
Insoluble dietary fiber 55.1 61.6 59.1 3.7 0.069
Total dietary fiber 54.7b 65.5a 59.4b 3.6 0.002
Cellulose 50.1a 15.9b 59.6a 5.7 < 0.001
Insoluble hemicelluloses 84.9 81.9 82.3 2.5 0.535

216
Table 7.4. (cont.)
Non-starch polysaccharides 57.2b 72.4a 61.4b 3.7 0.001
Insoluble non-starch
polysaccharides
57.7b 68.7a 61.2b 3.9 0.010
Non-cellulosic non-starch
polysaccharides
61.6b 86.1a 63.3b 3.6 < 0.001
DE, kcal/kg 2,975a 2,697b 1,763c 116 < 0.001 a-cValues within a row lacking a common superscript letter are different (P ≤ 0.05).

217
Table 7.5. Disappearance of dietary dry matter, energy, and nutrients (g or kcal/kg of DMI) in
the stomach and small intestine, cecum, and colon of pigs fed experimental diets
Item
Basal Basal +
DDGS1
Basal +
wheat
middlings
Basal +
soybean
hulls
SEM P-value
Stomach and small intestine
DM 633.4a 487.6c 548.8b 428.0d 11.9 < 0.001
GE 3,276a 2,769b 2,894b 2,337c 57 < 0.001
ADF 13.1 15.2 14.4 19.4 3.2 0.328
NDF 22.1c 45.2b 66.0a 38.0b 7.2 < 0.001
Soluble dietary fiber 7.5a 0.9b 7.7a 4.5ab 1.5 0.002
Insoluble dietary fiber 57.2b 50.9b 93.9a 54.0b 7.7 < 0.001
Total dietary fiber 64.6b 51.8b 101.6a 58.4b 8.2 < 0.001
Cellulose 11.9 10.7 11.2 17.2 2.7 0.153
Insoluble hemicelluloses 9.2d 23.0b 51.8a 18.9c 4.2 < 0.001
Non-starch polysaccharides 63.4b 47.3b 98.3a 56.0b 7.9 < 0.001
Insoluble non-starch
polysaccharides
55.9b 46.4b 90.6a 51.6b 7.4 < 0.001
Non-cellulosic non-starch
polysaccharides
51.6b 36.5c 87.3a 38.7bc 6.2 < 0.001
Cecum
DM 30.8 45.8 49.5 43.6 15.9 0.690
GE 26.4 18.5 116.5 72.2 73.8 0.548
ADF -1.0 1.0 -3.0 -2.9 3.1 0.685
NDF 0.3 -1.3 -2.1 1.8 5.8 0.953
Soluble dietary fiber 4.0c 8.9ab 7.6bc 12.7a 2.0 0.012
Insoluble dietary fiber 10.6 18.9 10.3 16.4 8.0 0.720
Total dietary fiber 14.6 27.8 17.9 29.0 8.3 0.389
Cellulose 0.3 1.6 -1.3 -2.5 2.7 0.646
Insoluble hemicelluloses 1.5 -2.4 1.1 4.7 3.2 0.385
Non-starch polysaccharides 15.8 28.4 19.5 29.4 8.7 0.420
Insoluble non-starch
polysaccharides
11.9 19.5 11.9 16.8 7.8 0.769
Non-cellulosic non-starch
polysaccharides
15.2 26.9 20.5 31.8 6.9 0.095
Colon
DM 114.8c 187.6b 128.8c 217.3a 11.4 < 0.001
GE 647b 999a 687b 977a 61 < 0.001
ADF 17.5c 33.5b 12.1c 80.7a 4.5 < 0.001
NDF 33.1c 80.2b 41.6c 116.6a 6.3 < 0.001
Soluble dietary fiber 3.3 3.5 5.4 4.5 1.0 0.106
Insoluble dietary fiber 31.3c 70.3b 36.9c 123.2a 6.7 < 0.001
Total dietary fiber 34.7c 73.9b 42.4c 128.0a 7.3 < 0.001
Cellulose 16.4c 30.4b 13.8c 81.9a 4.3 < 0.001

218
Table 7.5. (cont.)
Insoluble hemicelluloses 15.3c 46.6a 29.3b 35.5b 3.1 < 0.001
Non-starch polysaccharides 33.6c 70.8b 44.1c 129.2a 7.1 < 0.001
Insoluble non-starch
polysaccharides
30.2c 67.3b 38.6c 124.4a 6.6 < 0.001
Non-cellulosic non-starch
polysaccharides
17.0c 40.3a 30.1b 46.8a 4.7 < 0.001
1DDGS = distillers dried grains with solubles. a-dValues within a row lacking a common superscript letter are different (P ≤ 0.05).

219
Table 7.6. Disappearance of dry matter, energy, and nutrients (g or kcal/kg of DMI) from
distillers dried grains with solubles (DDGS), wheat middlings, and soybean hulls in the stomach
and small intestine, cecum, and colon of pigs
Item
DDGS Wheat
middlings
Soybean
hulls
SEM P-value
Stomach and small intestine
DM 430.8b 549.3a 428.0b 32.1 0.015
GE 2,472ab 2,896a 2,333b 164 0.050
ADF 14.0 14.4 19.6 3.3 0.289
NDF 43.2b 66.2a 38.3b 7.7 0.006
Soluble dietary fiber 0.3b 7.8a 4.6a 1.5 0.002
Insoluble dietary fiber 45.8b 94.2a 54.3b 7.9 < 0.001
Total dietary fiber 46.0b 101.9a 58.7b 8.3 < 0.001
Cellulose 9.6 11.2 17.3 2.8 0.071
Insoluble hemicelluloses 29.2b 51.9a 19.0c 4.7 < 0.001
Non-starch polysaccharides 41.6b 98.6a 56.4b 8.0 < 0.001
Insoluble non-starch
polysaccharides
41.3b 90.9a 51.9b 7.5 < 0.001
Non-cellulosic non-starch
polysaccharides
32.0b 87.5a 39.1b 6.5 < 0.001
Cecum
DM 21.7 26.1 19.5 17.8 0.942
GE -15.6 87.5 38.9 83.3 0.523
ADF 1.7 -2.2 -2.1 3.4 0.549
NDF -1.4 -2.3 1.8 6.5 0.871
Soluble dietary fiber 6.0 4.7 9.7 2.1 0.141
Insoluble dietary fiber 11.7 3.0 9.1 9.0 0.699
Total dietary fiber 17.7 7.7 18.9 9.9 0.576
Cellulose 1.4 -1.5 -2.5 3.6 0.533
Insoluble hemicelluloses -3.4 0.3 4.0 3.7 0.241
Non-starch polysaccharides 17.4 8.3 18.3 9.8 0.623
Insoluble non-starch
polysaccharides
11.4 3.7 8.6 8.8 0.746
Non-cellulosic non-starch
polysaccharides
16.1 9.6 20.9 7.7 0.361
Colon
DM 108.5b 50.4c 137.0a 11.8 < 0.001
GE 563a 248b 530a 62 < 0.001
ADF 21.3b -0.1c 68.3a 4.9 < 0.001
NDF 57.2b 18.4c 93.2a 6.9 < 0.001
Soluble dietary fiber 1.2 3.1 2.1 1.0 0.219
Insoluble dietary fiber 48.4b 15.0c 101.0a 7.4 < 0.001
Total dietary fiber 49.5b 18.1c 103.3a 8.0 < 0.001

220
Table 7.6. (cont.)
Cellulose 19.1b 2.4c 70.4a 5.0 < 0.001
Insoluble hemicelluloses 36.0a 18.4b 24.6b 3.5 0.002
Non-starch polysaccharides 47.3b 20.6c 105.4a 8.0 < 0.001
Insoluble non-starch
polysaccharides
46.1b 17.4c 103.0a 7.4 < 0.001
Non-cellulosic non-starch
polysaccharides
27.9a 18.5b 35.0a 5.5 0.003
a-cValues within a row lacking a common superscript letter are different (P ≤ 0.05).

221
Table 7.7. Viscosity of ileal and cecal digesta and water binding capacity of ileal and cecal
digesta and feces from pigs fed experimental diets
Item Basal Basal +
DDGS1
Basal +
wheat
middlings
Basal +
soybean
hulls
SEM P-value
Ileal digesta
Water binding capacity, g/g 2.95b 3.12b 2.81b 3.82a 0.32 < 0.001
Viscosity
Constant, cP 15,675ab 19,164a 6,361b 20,516a 4,218 0.044
Exponent -1.21 -1.38 -1.01 -1.40 0.14 0.125
R2 0.92 0.99 0.91 0.96 - -
Cecal digesta
Water binding capacity, g/g 1.71c 2.03b 2.23b 2.73a 0.11 < 0.001
Viscosity
Constant, cP 7,362 8,203 4,735 14,822 3,405 0.134
Exponent -0.91 -0.98 -0.92 -1.19 0.14 0.232
R2 0.96 0.98 0.96 0.99 - -
Feces
Water binding capacity, g/g 2.09c 2.65b 3.07a 2.21c 0.06 < 0.001 a-cValues within a row lacking a common superscript letter are different (P ≤ 0.05).

222
Table 7.8. Correlation coefficients1 between physical characteristics of experimental diets and apparent cecal digestibility (ACD) of
dry matter, energy, and dietary fiber fractions and physical characteristics of cecal digesta from pigs fed experimental diets
Correlation coefficient
Cecal
digesta
measurement
ACD
of
DM,
%
ACD
of
GE,
%
ACD
of
soluble
dietary
fiber,
%
ACD of
insoluble
dietary
fiber, %
ACD
of
total
dietary
fiber,
%
ACD of non-
starch
polysaccharides,
%
Water
binding
capacity,
g/g
Viscosity, cP
Physical
characteristic
Water binding
capacity
-0.64 -0.61 -0.31 -0.70 -0.68 -0.66 0.37 0.38
Bulk density 0.87 0.88* 0.86 0.61 0.65 0.65 -0.86 0.48 1Correlation coefficients were determined between all variables, but the table has been reduced for brevity.
*P ≤ 0.050 ** P < 0.01.

223
CHAPTER 8: CONCLUDING REMARKS
The overall focus of this dissertation was to evaluate effects of feeding diets with greater
concentrations of dietary fiber to pigs. Distillers dried grains with solubles (DDGS), wheat
middlings, wheat bran, and soybean hulls were the fibrous co-products that were added to corn-
soybean meal-based pig diets because these co-products are readily available and typically
included in U.S. swine diets. Three major factors necessary to better understand the energy
supply and utilization by pigs fed high fiber diets were previously outlined and identified, and
these were focused on throughout the dissertation to achieve the goal of developing strategies to
increase dietary fiber fermentation and, subsequently, energy supply to pigs.
High fiber diets, created by addition of DDGS and wheat middlings at the expense of
corn and soybean meal, have decreased concentrations of NE. Swine nutritionists have two
options: 1) increase NE by adding fat to the diet, or 2) rely on the pig to increase feed intake to
meet its energy requirement. Option 2 was utilized in this dissertation, and it was determined that
ADFI of weanling pigs fed high fiber diets decreased by about 5%, which led to a 3.6%
reduction in BW at the end of the nursery period compared with weanling pigs fed low fiber
diets. Once pigs entered the grower phase however, ADFI of high fiber-fed pigs increased 4.3%
compared with low fiber-fed pigs, which led to a 6% increase in ADG of high fiber-fed pigs.
This observation of compensatory gain is remarkable and exciting and leads to the conclusion
that the weanling pig is not capable of compensating for lower dietary NE through increased feed
intake due to gut fill associated with the lower bulk density of the high fiber diet. Rather, the
growing-finishing pig that has been adapted to the high fiber diet since weaning is capable of
compensating for lower dietary NE through increased feed intake, and gut fill is not a hindrance.
Therefore, it is concluded that pigs require a certain period of time to allow their gastrointestinal

224
tract to adapt to the bulk of high fiber diets and this certainly will increase co-product utilization
in swine diets, leading to the overall goal of increasing the sustainability of swine production.
On the other hand, high fiber-fed pigs adapted by increasing the weight of the large
intestine, and this reduced dressing percentage of the carcass. Most pork producers are paid on a
carcass basis and, therefore, the price paid to producers for high fiber-fed pigs will be less.
Producers must account for this plus the increased feed intake that will occur when they reduce
diet costs by increasing inclusion of fibrous co-products. Further research is, therefore, necessary
to determine a time period of withdrawal of the high fiber diet prior to harvest to decrease the
weight of the large intestine in order to maintain dressing percentage.
Intestinal concentrations of VFA were greater in low fiber-fed pigs compared with high
fiber fed pigs. These results, however, may be interpreted multiple ways. Taken as presented in
this dissertation, it is concluded that a corn-soybean meal-based diet is more fermentable
compared with a corn-soybean meal-DDGS-wheat middlings based diet. This conclusion is
further strengthened by the fact that apparent total tract digestibility (ATTD) of ADF and NDF
were both greater in low fiber diets compared with high fiber diets. However, the intestinal
concentrations of VFA also may be interpreted such that high fiber-fed pigs had greater intestinal
VFA absorption compared with low fiber-fed pigs. This interpretation was addressed by
analyzing tissue samples for relative gene expression of monocarboxylate transporter – 1
(MCT1) and basigin (CD147) because these are VFA transporters, and it has been indicated that
increased intestinal concentrations of VFA correspond with increased abundance of VFA
transporters. Finishing pigs fed high fiber diets did, indeed, have increased relative expression of
MCT1 and CD147 in the cecum, and this may be the reason for the lower concentration of VFA
in the cecum of finishing pigs fed high fiber diets. To further complicate interpretation, feed
225
intake and diet digestibility can be used to calculate fecal output and, therefore, express VFA
concentration in feces on a g per d basis. Results from this calculation indicate that high fiber-fed
pigs have a much greater concentration of VFA in feces per d compared with low fiber-fed pigs
because high fiber-fed pigs had a greater feed intake and lower digestibility and, therefore, more
fermentable substrate. Also, antithetical with the interpretation is that increased dietary fiber will
decrease passage rate. Therefore, caution is warranted when analyzing and interpreting VFA
data. It is suggested that future experiments concerning VFA may be best presented as a
proportion of the indigestible marker included in the diet. This will remove the confounding
effects that feed intake, diet digestibility, and passage rate on intestinal VFA concentration.
Heat production (HP) of pigs fed increasing concentrations of wheat bran decreased. This
was not expected because it was understood that increased dietary fiber would lead to increased
fermentation and, therefore, result in greater HP. However, from what we have learned, the
fermentability of wheat bran is low and increased insoluble dietary fiber decreases passage rate,
which decreases the amount of time microbes have to ferment dietary fiber. The ATTD of
nutrients and energy also decreased, which decreased overall metabolism, thereby decreased HP
of pigs fed increasing concentrations of wheat bran was observed.
As pigs increased in age and BW, along with time fed a high fiber diet, high fiber-fed
pigs were just as efficient as low fiber-fed pigs. We speculated that perhaps high fiber-fed pigs
increased energy supply through increased dietary fiber fermentation as pigs adapted over time.
However, this was not the case because the pigs fed low or high fiber diets both increased
apparent ileal digestibility (AID) of starch, which led to slight increases in DE and ME over a
period of 12 wks. Therefore, it is concluded that pigs merely adapt to a high fiber diet by
increased size of the gastrointestinal tract to enable the pig to increase feed intake of a bulky diet.

226
This research also indicates that a 5 d adaptation period is sufficient to determine concentrations
of DE and ME in high fiber diets fed to pigs.
Addition of a Bacillus-based direct-fed microbial (DFM) to low or high fiber diets
improved G:F of nursery pigs. In contrast with our hypothesis, this was not caused by increased
intestinal concentrations of VFA. Relative gene expression of glucagon-like peptide-2 receptor
(GLP-2R) increased in liver tissue of nursery pigs fed DFM-containing diets and, therefore, it is
speculated that DFM increased the amount of GLP-2 in circulation, which may lead to improved
intestinal growth and permeability. However, further research is necessary to elucidate the mode
of action by which DFM improved nursery pig G:F.
The cecum of pigs is sometimes thought of like a rumen in that it is the fermentation
chamber of pigs. This thought was confirmed because about 25 g of total dietary fiber per kg
DMI was degraded in the cecum compared with 81 g total dietary fiber degraded per kg DMI in
the colon of pigs fed high fiber diets containing DDGS, wheat middlings, or soybean hulls. The
cecum of pigs is only about 0.3% of empty BW of pigs compared with the colon, which is 1.75%
of empty BW. It is quite remarkable that 25 g of total dietary fiber may be degraded in a much
smaller organ compared with the larger colon.
Finally, it was determined that water binding capacity and bulk density of diets
containing corn, soybean meal, DDGS, wheat middlings, and soybean hulls were not correlated
with the digestibility of nutrients and energy by pigs. Therefore, it appears that physicochemical
characteristics of dietary fiber may not be good predictors of dietary fiber fermentation although
the physicochemical characteristics of dietary fiber may still be useful to characterize dietary
fiber as well as serve as a potential aid in determining the feed intake capacity in nursery pigs fed
high-fiber diets.

227
Collectively, this dissertation has substantially increased the understanding of energy
utilization in high and low fiber diets fed to pigs. Importance must be placed on 3 key findings:
1) the pigs ability to adapt to a high fiber diet by increasing the size of the gastrointestinal tract,
enabling greater feed intake to meet its energy requirement is remarkable, but 2) unfortunately
the pig is unable to increase dietary fiber fermentation through adaptation; and 3) intestinal
concentrations of VFA were greater in pigs fed low-fiber diets compared with high-fiber diets,
but caution is warranted as regards data interpretation. From this work, pork production can
become more sustainable by increasing inclusion of fibrous co-products in swine diets. It is
recommended that inclusion of fibrous co-products begin at weaning and continuously fed up to
a certain period of time prior to harvest. A withdrawal period from the high-fiber diet will
prevent the producer from being penalized by the packer for a lower dressing percentage. Co-
product inclusion in swine diets also may be increased through use of feed additive technologies
such as DFM; however, further research and strategic implementation are necessary to obtain
consistent beneficial results.