
Utility Analysis and Group Behavior: An Empirical StudyUTILITY ANALYSIS AND GROUP BEHAVIOR AN...
10
Utility Analysis and Group Behavior: An Empirical Study The Harvard community has made this article openly available. Please share how this access benefits you. Your story matters Citation Weitzman, Martin L. 1965. Utility analysis and group behavior: An empirical study. Journal of Political Economy 73(1): 18-26. Published Version http://dx.doi.org/10.1086/258989 Citable link http://nrs.harvard.edu/urn-3:HUL.InstRepos:3710799 Terms of Use This article was downloaded from Harvard University’s DASH repository, and is made available under the terms and conditions applicable to Other Posted Material, as set forth at http:// nrs.harvard.edu/urn-3:HUL.InstRepos:dash.current.terms-of- use#LAA
Transcript of Utility Analysis and Group Behavior: An Empirical StudyUTILITY ANALYSIS AND GROUP BEHAVIOR AN...
Utility Analysis and GroupBehavior: An Empirical Study
The Harvard community has made thisarticle openly available. Please share howthis access benefits you. Your story matters
Citation Weitzman, Martin L. 1965. Utility analysis and group behavior: Anempirical study. Journal of Political Economy 73(1): 18-26.
Published Version http://dx.doi.org/10.1086/258989
Citable link http://nrs.harvard.edu/urn-3:HUL.InstRepos:3710799
Terms of Use This article was downloaded from Harvard University’s DASHrepository, and is made available under the terms and conditionsapplicable to Other Posted Material, as set forth at http://nrs.harvard.edu/urn-3:HUL.InstRepos:dash.current.terms-of-use#LAA

UTILITY ANALYSIS AND GROUP BEHAVIOR
AN EMPIRICAL STUDY'
MARTIN WEITZMAN
Massachusetts Institute of Technology
I. INTRODUCTION
U TILITY analysis is a highly theo- retical construct whose main function in economic theory is to
serve as a link in the chain connecting human preferences with economic behav- ior. That few aspects of utility analysis have been satisfactorily subjected to empirical testing is unfortunate for eco- nomics because of this key role in the theory of demand.
The experiments thus far performed have primarily involved individuals or small groups in laboratory situations. Ideally a utility experiment should in- volve many participants in a more or less natural environment. Of course it is dif- ficult to incorporate these features into a practical, controlled, experimental framework.
In this paper the theory and results of an altogether different approach will be presented. Extensive data of group be- havior at a race track will provide the in- formation for an analysis of several utili- ty hypotheses. In particular an "average man at the race track" will be defined, his underlying decision-making mecha- nism investigated, and his indifference map between various risk combinations presented. His utility of money curve will be constructed and correlated with the theoretical literature on this subject.
1 Thanks are due to Professor Arnold Zellner who provided insight and encouragement. This work was done at the Social Systems Research Institute, Uni- versity of Wisconsin, and was supported in part by National Science Foundation Grant GS-151.
II. THE EXPECTED-UTILITY HYPOTHESIS
The theoretical content of utility anal- ysis has been amply discussed in the lit- erature.2 We shall make no reference here to any but the most directly relevant aspects.
Each person is assumed to possess a subjective preference pattern among al- ternative situations. Generally speaking, a utility function is any function that arithmetizes the relation of preference among the situations.3 When risk is in- volved, each situation is associated with a probability of occurrence.
The usefulness of the utility concept derives primarily from its behavioral im- plications. A fundamental postulate as- serts that each individual acts in such a manner that, to a very good approxima- tion, he is behaving as if he were maxi-
2 R. Duncan Luce and Howard Raiffa, Games and Decisions (New York: John Wiley & Sons, 1958), chap. ii and Appendix 1; Leonard J. Savage, The Foundations of Statistics (New York: John Wiley & Sons, 1954), chap. v; Jerome Rothenberg, The Meas- urement of Social Welfare (Englewood Cliffs, N.J.: Prentice-Hall, Inc., 1961), Part III; Armen Alchian, "The Meaning of Utility Measurement," A merican Economic Review, XLIII (March, 1953), 26-50; Daniel Ellsberg, "Classic and Current Notions of Measurable Utility," Economic Journal, LXIV (September, 1954), 528-56.
3 In this paper I am avoiding the issue between utility as a measure of preference order versus utility as a measure of preference intensity. Some strict operationalists (notably Ellsberg, op. cit.) regard the two concepts of utility as quite disjoint. Rothenberg (op. cit., pp. 211-17) argues cogently for a high de- gree of likeness. A good discussion is available in Milton Friedman and L. J. Savage, "The Expected Utility Hypothesis and the Measurability of Util- ity," Journal of Political Economy, LX (December, 1952), 463-74.
18
UTILITY ANALYSIS AND GROUP BEHAVIOR 19
mizing his utility function over the rele- vant range of action states.
The personal utility of the risk situa- tion consisting of the possibility of win- ning m dollars with probability p will be denoted U(p, m), where U is some func- tion of p and m. In writing an individu- al's utility as a function of p and m alone I am abstracting from the influence of all other possible variables. Changes in these other factors might shift the utility func- tion over time, but for any specified time we may abstract away their influence as being of fixed quality while the afore- mentioned two determinants serve as variables.
The expected-utility hypothesis im- plies, among other things, that a modifi- cation on the structure of the utility function for a risk situation can be made of the form U(p, mn) = pui(m), where u(m) is the personal utility of the money prize, m dollars.4 The principle of maxi- mization of U(p, in) now becomes maxi- mization of the expected utility pu(m).5
Friedman and Savage were the first to construct a hypothesis that explained in a quantitative way the risk behavior of low-income consumer units.6 Their utili-
4 We are not concerned here with the Von Neu- mann-Morgenstern axiomatic system underlying this hypothesis, but only with the behavioral calcu- lus which it implies.
5 To be more precise, the maximization of ex- pected utility (EU) hypothesis asserts that an indi- vidual maximizes pu(x), where p is the objective probability. The maximization of subjectively ex- pected utility (SEU) hypothesis holds that an indi- vidual maximizes p*- u(x), where p* is that person's subjective probability. Strictly speaking, it is the content of the EU hypothesis that will be empirical- ly investigated in this paper. Insofar as the audience evaluates p* close to p, the EU and SEU hypotheses will predict almost identical behavior and, to that extent, will be operationally indistinguishable. The role of subjective probability is an important issue and shelving it at this point does not imply that it is irrelevant, but only that it is difficult to incorporate into this study.
ty of money curve contained sections of differing curvature which corresponded to qualitatively different economic levels. As a result of this construction, they were able to account for such seemingly con- tradictory attitudes toward risk as the simultaneous taking of insurance and participation in gambling.
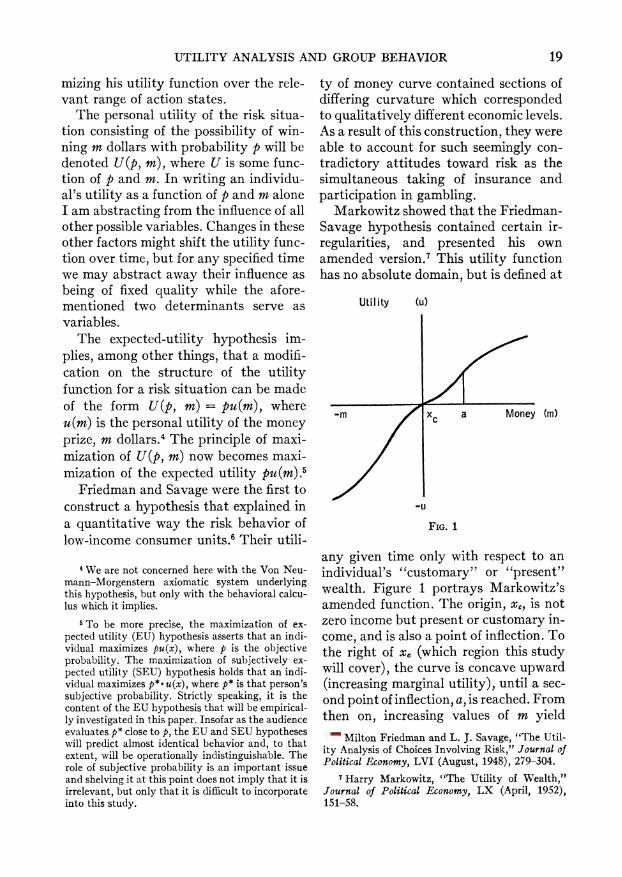
Markowitz showed that the Friedman- Savage hypothesis contained certain ir- regularities, and presented his own amended version.7 This utility function has no absolute domain, but is defined at
Utility Cu)
-m a Money Cm)
-u
FIG. 1
any given time only with respect to an individual's "customary" or "present" wealth. Figure 1 portrays Markowitz's amended function. The origin, x?, is not zero income but present or customary in- come, and is also a point of inflection. To the right of x, (which region this study will cover), the curve is concave upward (increasing marginal utility), until a sec- ond point of inflection, a, is reached. From then on, increasing values of m yield
6 Milton Friedman and L. J. Savage, "The Util- ity Analysis of Choices Involving Risk," Journal of Political Economy, LVI (August, 1948), 279-304.
Harry Markowitz, "The Utility of Wealth," Journal of Political Economy, LX (April, 1952), 151-58.
20 MARTIN WEITZMAN
decreasing marginal utility (the curve is convex upward). The exact location of a would depend on the individual's atti- tude toward risk. People who are less averse to bearing risk over a wide range (for example, gamblers) would be expect- ed to possess a utility function with a located further to the right.
Markowitz uses his utility function as a device to explain and predict reactions toward risk. The shape of this utility function is consistent with many em- pirical generalizations about risk behav- ior. We shall see that the results of this study bear out Markowitz's construct for at least one section of his curve.
III. EXPERIMENTAL BACKGROUND: THE
RACE TRACK AND PARIMUTUEL BETTING
Racing results at four New York race tracks (Aqueduct, Belmont, Jamaica, and Saratoga) were studied for the ten- year period 1954-63. During the racing season activity rotates among these four tracks so that at any given time only one is being used. Nine races are run each day, Monday through Saturday, and on the average nine horses are entered in each race, although the number may vary from four to fourteen. Results were obtained from May through October of each year so that during the ten-year pe- riod over 12,000 races and over 110,000 performances were investigated.
It is essential for a comprehension of the theory underlying this study that the reader understand fully the process of parimutuel betting. This system of gam- bling is unique in that the odds are deter- mined by the aggregate wagering pat- terns of the crowd itself, rather than fixed beforehand. All the money bet on pro- spective winners of a race is pooled. A fixed percentage (the "take") is sub- tracted as revenue for the track and state government. Those people who hold the
winning tickets receive the rest. The odds on any horse are computed by subtract- ing the sum bet on the horse from the pool after take and dividing by the sum bet on the horse. For each dollar bet, the amount of money actually returned (the "return") is the odds plus one, the one being the dollar bet.
A totalizer (centrally located score- board) summarizes the results of previ- ous betting by running the current odds continuously as bets pour in for a period of about twenty minutes before each race.
A rational person wagering at the race track selects a particular horse to win because he thinks that in some sense, considering his personal attitude toward risk, the horse is more of a "winner" than the odds at which he is being portrayed would seem to say. The race-track crowd is a group of people, each following his own personal motives and preferences, who collectively arrive via a market type of mechanism at the return which each horse pays. In this study we shall be in- terested in the general relationship be- tween the return and the frequency of winning. The reason for the existence of this general relationship, as contrasted with the rationale behind any given bet- tor's specific choice, will be explained in terms of utility effects operating on the different amounts of money to be won.8
IV. THE EXPERIMENTAL
PROBABILITY CURVE
It was found experimentally that the probability of a horse's victory could be
8 It is possible that effects other than utility are operating. However, it is not at all clear what these other effects might be, nor does it seem, on the face of it, that a strong a priori case could be made for their relevance. In the absence of such knowledge we are forced to perform the obvious abstraction. If dynamic effects are operating, this analysis squeezes them into a static framework.

UTILITY ANALYSIS AND GROUP BEHAVIOR 21
expressed as a smooth and sharply deter- mined function of the return which it paid.9
After the data from all of the races were collected, each horse was classified according to the return to the dollar it would have paid had it won and subclas- sified within that category as a winner or a loser (values of return are figured to the nearest $0.05 at the track). An empirical probability of winning-the ratio of the number of victories divided by the num- ber of entries-was then associated with each value of return. Weighted aggrega- tion performed on this data yielded 257 separate points of the form (x, p), where x is the value of return to the dollar and p is the empirical probability of victory associated with that return.
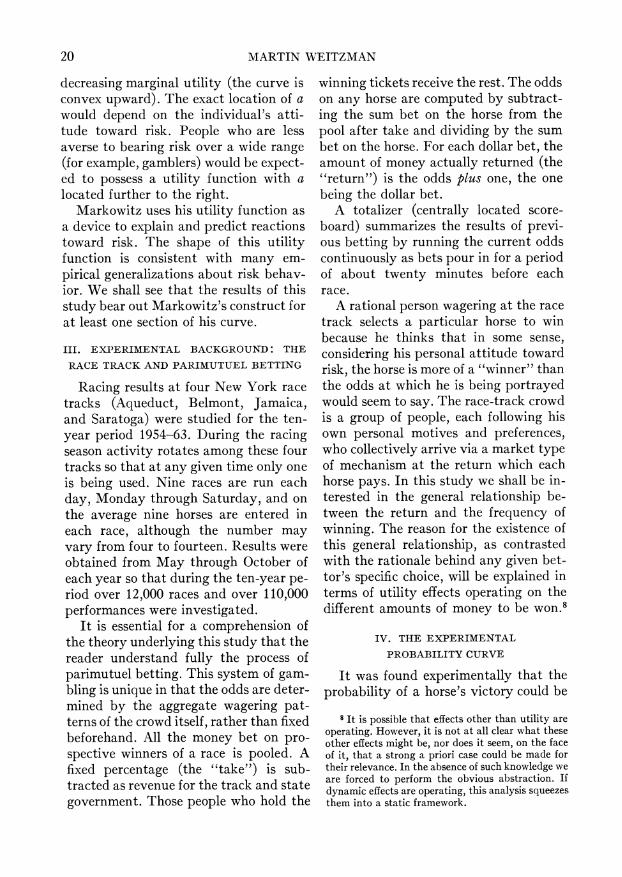
The 257 points, themselves derived from over 110,000 runnings, were fitted to a curve (shown in Fig. 2) by employ- ing a weighted least-squares method that corrected for heteroscedasticity. Various functional forms were tested in an effort to ascertain the underlying "true" func- tion. The rectangular hyperbola, p= A/x, yielded fair results.'0
The most appropriate function was judged to be the "corrected" hyperbolic form,"
p A+ Blog(1+x) x x
9 The reader may be confused at this point by usage of the word "function." It is being employed here in its strict mathematical sense; a functionf of a variable x is a unique association of a number f(x) with each number x in the domain of definition. No causality in the physical sense is meant to be implied by this definition. Thus it is not being maintained that the crowd-determined return causes the objec- tive probability of a horse's victory-more likely it is the other way around and the crowd's estimation of the horse's probability of victory sets the return. The existence of probability as a function of return in the mathematical, not the causal, sense is under investigation.
It was not understood why this particu- lar function yielded more suitable results than others, but its superiority was evi- dent. Neither did complicated combina- tions of other functions (including poly- nomials) make a better fit, nor did the addition of extra terms to this function significantly improve matters; further- more, their addition could not be justi- fied statistically.'
There was no trend to the residuals of the "corrected" hyperbola; they were distributed in a random fashion about their origin.'8 This also testifies to the fact that the underlying equilibrium curve is an appropriate fit. The evident conclusion is that in the empirical data there exists a pattern which appears to have a high degree of coherence, and which is aptly described by the chosen functional form.
10 The weighted least-squares procedure yielded
A5i 0.8545 -
(0.0075) xi
with R2 = 0.9807. The coefficient estimate is several times its standard error, and the coefficient of de- termination is significantly large. However, the residuals were successively correlated, indicating a systematic trend for the error term.
11 The weighted least-squares procedure yielded
A
X 1.00 1 1- 0.08 7 og ( 1+ xi) (0.0190) X (0.0099) xi
with R2= 0.9852. Both coefficient estimates are several times their standard errors, and the co- efficient of determination is unusually large.
12 That is, the low values computed for their t- statistics did not allow rejection of the hypothesis that the added coefficients were zero.
13 The Durbin-Watson d-statistic was 1.94. This indicates that the null hypothesis of residual inde- pendence could be upheld against the alternative hy- pothesis of positively correlated successive disturb- ances at both the 1 and 5 per cent levels (H. Theil and A. L. Nagar, "Testing the Independence of Re- gression Disturbances," Journal of the A merican Sta- tistical Association, LVI [December, 1951], 793-806).

22 MARTIN WEITZMAN
V. FORMULATION OF THE MODEL
MR. AVMART
The study described in this paper deals with the group behavior of racing devotees in the face of uncertainty. Any conclusions relate, strictly speaking, only to the actions of the assemblage and not necessarily to the conduct of any member of it. In order to create a convenient mode of expression we will make the pop- ulation homogeneous and then inquire what attitudes toward risk each hypo- thetical member would be required to possess and what actions he would have to perform in order to explain the data which were obtained. To avoid redun- dantly using a lengthy descriptive phrase, we will call a member of the arti- ficially constructed "homogeneous" race- track crowd Mr. Avmart (average man at the race track).
Mr. Avmart's wagers are allocated among the entrants in a race in exactly the same proportion as the entire crowd apportions its money among the various horses. Of course, no real person at the track distributes his bets over a con- tinuous spectrum of values in the manner prescribed above.'4
Mr. Avmart bets a total of exactly $5.00 in each race. This figure is very close to the amount averaged per bettor for individual wagers placed in the win pool in the four race tracks surveyed. The exact value is not important, since it is used only in constructing a determi-
14 Actually it is preferable for conceptual reasons to think of Avmart as using a randomizing device to select the horse he bets on. The outcomes of this randomizing device are bets on the various horses and the probabilities of these outcomes are propor- tional to the amount the crowd has wagered on that horse. In this manner Avmart bets on only one horse per race, the probability of betting on that horse being proportional to the aggregate amount wagered on that horse. The long-run effects are the same as if he distributed bets continuously for each race in the manner prescribed above.
nate scale for Avmart's utility of money curve and does not alter the shape of the curve. In that capacity $5.00 is the closest round figure, and a good enough approximation to the true social average.
The question of Mr. Avmart's exist- ence is a pertinent issue. In the literal sense, of course, he is a completely ficti- tious entity, being nothing more than an anthropomorphic version of a race-track crowd.
As will be shown, by postulating a cer- tain very precise utility curve for Avmart and aggregating him into a race-track crowd, the risk behavior of that crowd will be explained. The race-track crowd behaves as if it were a homogeneous con- glomeration of a certain individual, namely, Avmart.
To a psychologist concerned with ex- istence and reality on an individual level, this formulation of Avmart might be quite disquieting. But to an economist, interested in utility theory primarily for its implications in market behavior, atti- tudes toward risk, and the theory of de- mand, this operational definition of Av- mart should coincide with that aspect of human behavior in which he is profes- sionally interested-namely, a personal component of social behavior which when performed collectively by individu- als, yields the true group action.
VI. AVMART S INDIFFERENCE CURVE
We come now to a key theoretical deri- vation. The empirically acquired curve of Figure 2 with the scale of the x-axis blown up fivefold represents Avmart's in- difference map between various risk situ- ations involving money prizes and prob- abilities. But before this can be shown, Avmart must be more fully explained.
Mr. Avmart was constructed with the idea of a social average in mind. He was made to be the "most typical bettor." Of
UTILITY ANALYSIS AND GROUP BEHAVIOR 23
course, when he was so constructed he ceased to exist in the strict sense, but that conclusion would hold in any social averaging situation.
So far, however, nothing has been said about Avmart's motivation. Let us mo- tivate him the way we assume any bettor at the track is motivated: to make those
(p) Probability
.6 -
. 5-
.4-
. 3-
.2
.1
I I... .. .... (x) 0 10 20 30 4 0 50 60 70 80 90 Return
FIG. 2.-The theoretical probability curve
wagers he believes are maximizing his utility function. Avmart, average bettor that he is, apportions his $5.00 per race exactly as the entire crowd is apportion- ing its total money. But Avmart does not consciously or unconsciously set out to act in this manner. Being an individual in a risk situation, we are postulating that his behavior can be described as maximization of personal utility.
Suppose Figure 2 were (hypothetical- ly) reproduced as Figure 2', where the two are identical except that the scale of the x-axis of the former is magnified five-
fold and now called the m(money) axis. The curve of Figure 2' is one of Avmart's utility isoquants.
Consider any two points A and B on the curve of Figure 2'. A is the point (ml, pi) representing the possibility that Avmart will win ml dollars with proba- bility pi, while B is the point (M2, p2) rep-
resenting his possibility of winning Mi2
dollars with probability P2.15 Suppose Avmart "prefers" A to B. Since he bets
15 This option is never presented to anyone at the race track in so clear a fashion. No real bettor pur- chases a "possibility of winning m dollars with prob- ability p"; but whenever he picks the horse paying m dollars the results of this study show that in the long run he can expect the proportion of victories as- sociated with that horse to be p. In this manner we can speak of Avmart being offered the "package" (in, p)-the possibility of winning in dollars with probability p. Although, of course, no real bettor ever thinks directly of a horse in such a general man- ner, it is precisely the existence of an underlying bias toward or against certain "packages" in which we are interested.
24 MARTIN WEITZMAN
in exactly the same ratios as the racing populace, A is socially preferred to B. This means that some of the money that would have been bet on B will now move to A. With more money being bet on A, the return declines and that point moves to the left while B shifts to the right as the return on it improves. These return movements cause A to become less and B more desirable. Eventually an equi- librium situation is reached where A and B are of equal desirability. But the curve of Figure 2 (and hence of Fig. 2') is itself an equilibrium curve. Then A and B are of the same utility to Avmart, and like- wise for any other pair of points on the curve of Figure 2'-that is, that curve is one of his risk-indifference contours.'6
The fact that the rectangular hyper- bola was a fairly good fit to the experi- mental probability curve is significant. This means that Avmart's adherence to the expected value hypothesis (maximi- zation of expected value), which would result in a hyperbola (mp = constant) for his indifference contour, is not a com- pletely inappropriate description of his behavior. Stated more precisely, the risk- indifference contour which would result from the assumption of maximization of expected value is a good first-order ap-
16 Although Avmart is indifferent between any two points of Figure 2', this does not mean that he can now carelessly place bets anywhere on that curve. Figure 2' is an indifference map given the pre- vailing social betting patterns. If the crowd (Av- mart) changes betting patterns, then Figure 2' is altered. The situation is made somewhat clearer by considering (as we are assuming) a crowd of many Avmarts, each with identical utility functions, and each making one $5.00 bet. If the probability versus return curve deviates momentarily from that re- quired to give all bets equal utility, then Avmarts will line up at the ticket window to drive the prob- ability versus return curve back to the proper shape. It is interesting to note that the existence of a "take" had no bearing on the interpretation of Figure 2' as Avmart's risk indifference curve. The relevant ques- tion is "given the fact that Avmart pays a 'fee' for the pleasure of gambling, which gambling levels or 'packages' does he then prefer to bet on?"
proximation to the curve actually ob- tained. However, a more exact fit of a slightly different form could be statisti- cally justified with a high level of con- fidence.
VII. AVMART S UTILITY OF
MONEY CURVE
By assuming that Avmart obeys the expected utility hypothesis, we can de- termine his utility of money function exactly. For every point on Avmart's in- difference map of Figure 2' the following equalities hold: U(p, m) = pu(m) = K, where K is the constant utility of that curve. Remembering that Figure 2' also yields p as a function of m, p = p(m) where m = 5x, we have that K =
p(m)u(m), or u(m) = Klp(m). We shall make u($5) = 5 "utiles" in order to fix the utility scale. Then K is equated to 5p($5), where p($5) is the value of the Figure 2' function for m = $5.
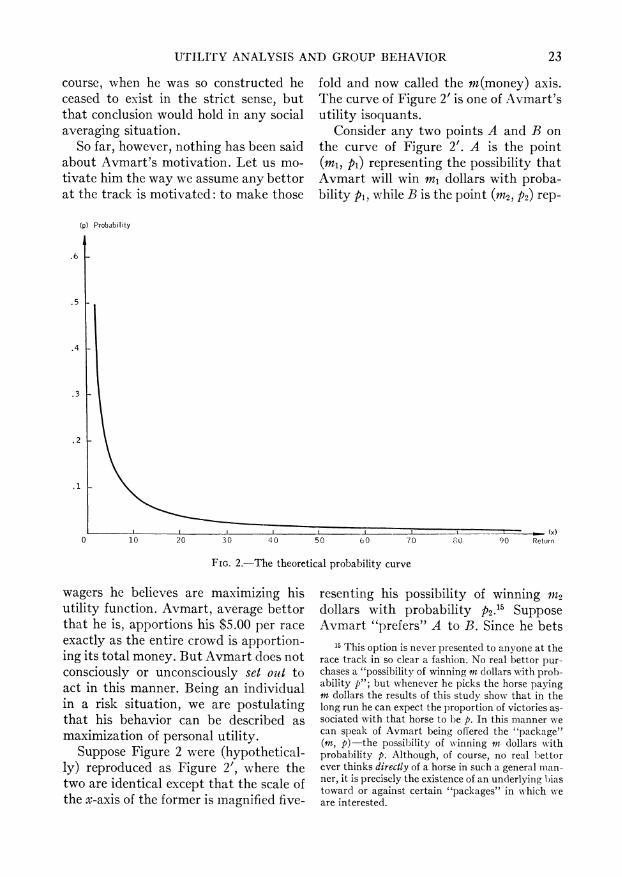
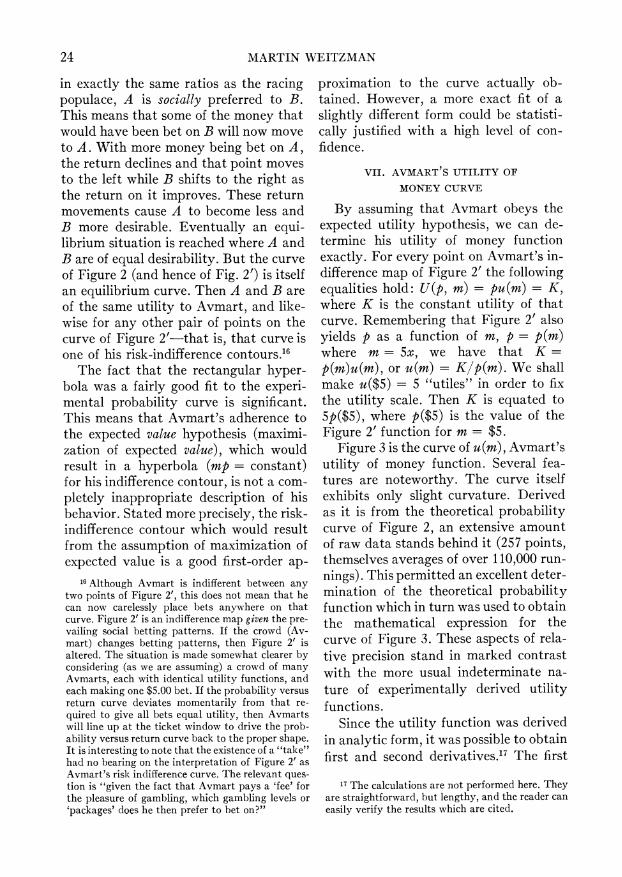
Figure 3 is the curve of u(m), Avmart's utility of money function. Several fea- tures are noteworthy. The curve itself exhibits only slight curvature. Derived as it is from the theoretical probability curve of Figure 2, an extensive amount of raw data stands behind it (257 points, themselves averages of over 110,000 run- nings). This permitted an excellent deter- mination of the theoretical probability function which in turn was used to obtain the mathematical expression for the curve of Figure 3. These aspects of rela- tive precision stand in marked contrast with the more usual indeterminate na- ture of experimentally derived utility functions.
Since the utility function was derived in analytic form, it was possible to obtain first and second derivatives.17 The first
17 The calculations are not performed here. They are straightforward, but lengthy, and the reader can easily verify the results which are cited.
UTILITY ANALYSIS AND GROUP BEHAVIOR 25
derivative is always positive for positive m. The second derivative is also positive for all positive values of m, but ap- proaches zero very rapidly as m gets larger. At m = $500, d2Xudm2 is already less than one hundredth of its value at m = $5.00. It is thus approaching a point of inflection as m becomes larger, and it seems not implausible to suppose that data over a wider range would show the eventual attainment of a point of inflec- tion, and then a change in the sign of the second derivative. Because this curve
was obtained only for values of m be- tween $5.00 and $500.00, the status of this conjecture unfortunately could not be tested, and it also could not be ascer- tained whether or not another point of inflection lay to the left of this interval. However, it does appear that the range of m for which Figure 3 has been drawn coincides with Markowitz's range of in- creasing marginal utility (xc < m < a in Fig. 1). This range was explicitly created in order to explain gambling behavior on a theoretical level. It is especially large
(u) utility in "utiles" 18 (5 "utiles" = u($5))
900
800
700
bOOt
500-
400 -
300 -
200 -
100 -
0 100 200 300 400 500 600 money in dollars
FIG. 3.-Avmart's utility of money curve

26 MARTIN WEITZMAN
in this case (a > $500.00) because Av- mart represents a group that possesses greater propensity toward risk-bearing.
Because only this interval was investi- gated, the results do not constitute a test of the applicability of Markowitz's hypothesis to Avmart's behavior over the entire range for which it was formu- lated. Nevertheless, for the range exam- ined, the results are completely in accord with what his theory predicts.'8
VIII. CONCLUSION
A new approach to the empirical study of some facets of utility theory has been explained and presented. Instead of con- centrating on individuals and trying to derive utility generalizations from their experimental behavior, more nearly the
18 A study performed by R. M. Griffith ("Odds Adjustments by American Horse Race Betters," American Journal of Psychology, LXII [1949], 290) noted the existence of a systematic undervaluation of the chances of short-odded horses and overvaluation of long-odded horses. Griffith was primarily inter- ested in other matters, but he noted this quantita- tive trend as well as a rough qualitative similarity in data from the years 1947 and 1934. This correlation appeared strange to him, since one year was a prosperous one, and the other was during the De- pression. These results are neatly explained by the utility interpretation outlined above.
converse approach was attempted. A plethora of data concerning the collec- tive risk actions of parimutuel bettors was employed in investigating utility as- pects of the behavior of a hypothetical member of the group. Mr. Avmart was operationally defined to be an "average" constituent of the race-track populace. One of Avmart's indifference contours among risk situations was shown. As- suming Avmart's adherence to the ex- pected utility hypothesis, his utility of money curve was derived. This curve was strikingly similar to the one proposed on theoretical grounds by Markowitz as an amendment to the Friedman-Savage hypothesis.
The conclusion is not that human be- ings possess, in any real sense of that word, a sharply defined utility function which they consult when making deci- sions. Indeed, to be of use in the context of economic theory it is sufficient only to believe that in some appropriate statisti- cal sense people behave as if they pos- sessed such a function. The results of this study show that the crowd at the race track behaves as if it were composed of a group of individuals each of whom possesses an identical utility function of the Markowitz variety.