Utilities Division Study Session October 22 2015
24
Utilities Division October 22, 2015 Study Session
-
Upload
adam-mcdaniel -
Category
Documents
-
view
16 -
download
3
description
Utilities Division Study Session October 22 2015
Transcript of Utilities Division Study Session October 22 2015

Utilities Division
October 22, 2015
Study Session
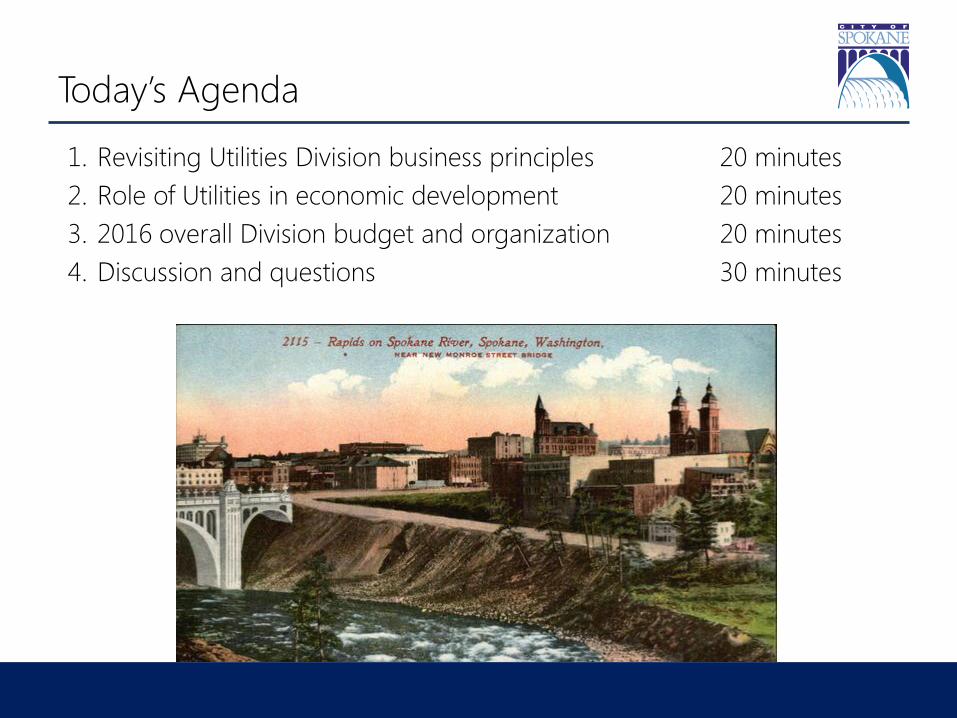
Today’s Agenda
1. Revisiting Utilities Division business principles 20 minutes
2. Role of Utilities in economic development 20 minutes
3. 2016 overall Division budget and organization 20 minutes
4. Discussion and questions 30 minutes

Revisiting Utilities Division Business Principles
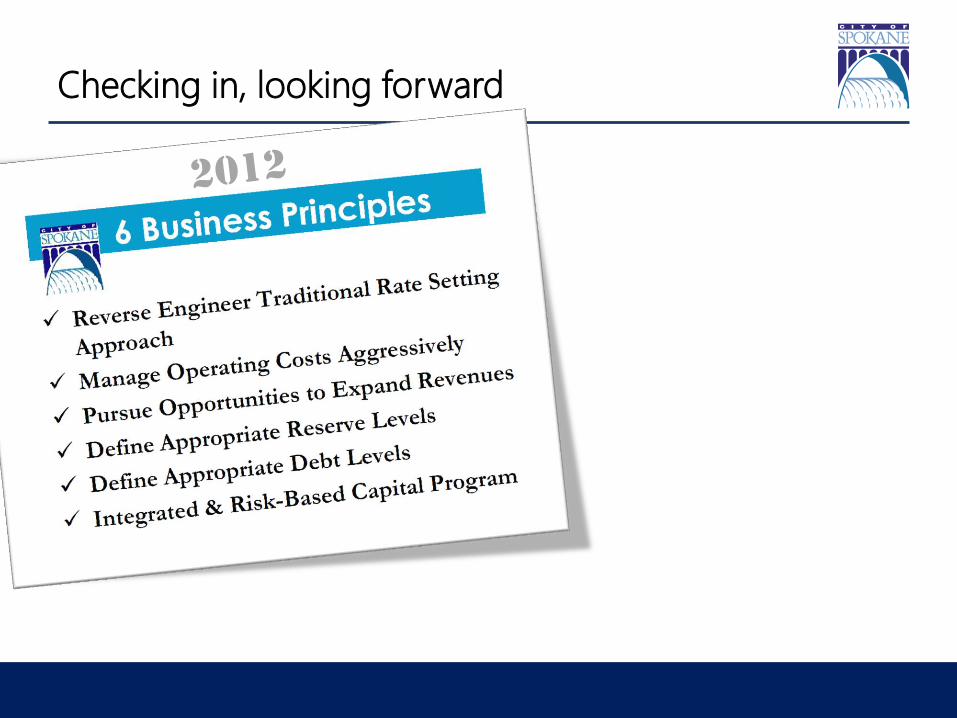
Checking in, looking forward

Rates
• Culture
• Continue to live within
our means

Costs
Continue to manage
costs aggressively oExpense growth within our rates
oContinue creativity and refine
and implement discipline

Pursue opportunities to
expand rate base Low marginal cost
opportunities:
Waste to Energy, Water
o Major link between Utilities and
economic development/growth
Sustainable development
Support targeted growth areas
Capacity and Service
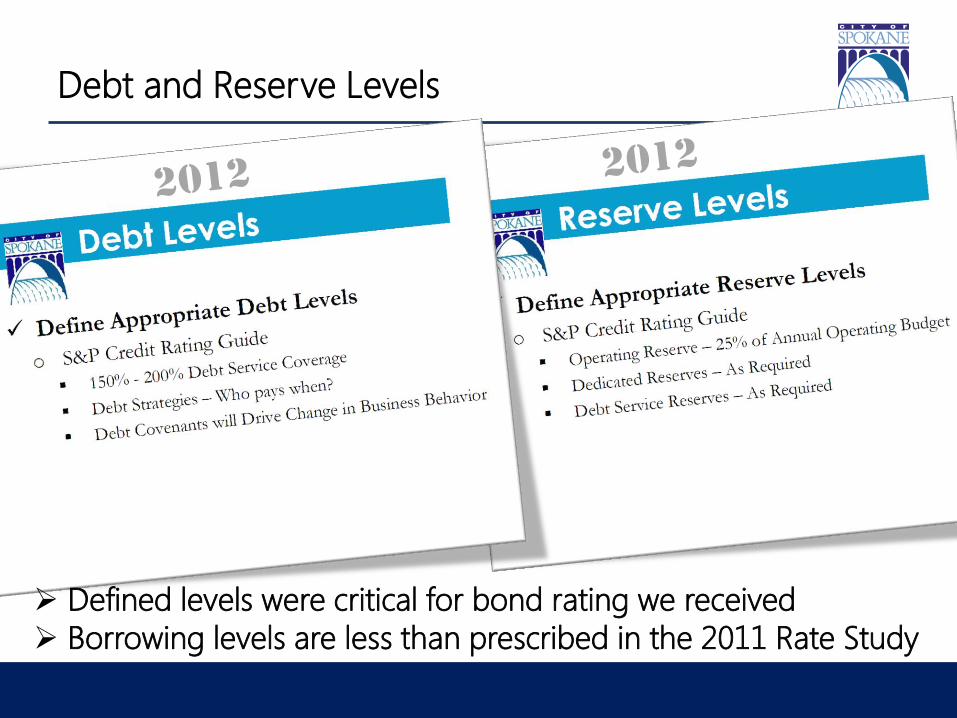
Debt and Reserve Levels
Defined levels were critical for bond rating we received
Borrowing levels are less than prescribed in the 2011 Rate Study

Capital Programs
Integrated and risk –
based capital program Integrated approach for highest
ROI
Added value and added
complexity
o Continue risk assessment of Utility
infrastructure
Water System Loss
Waste to Energy Facility
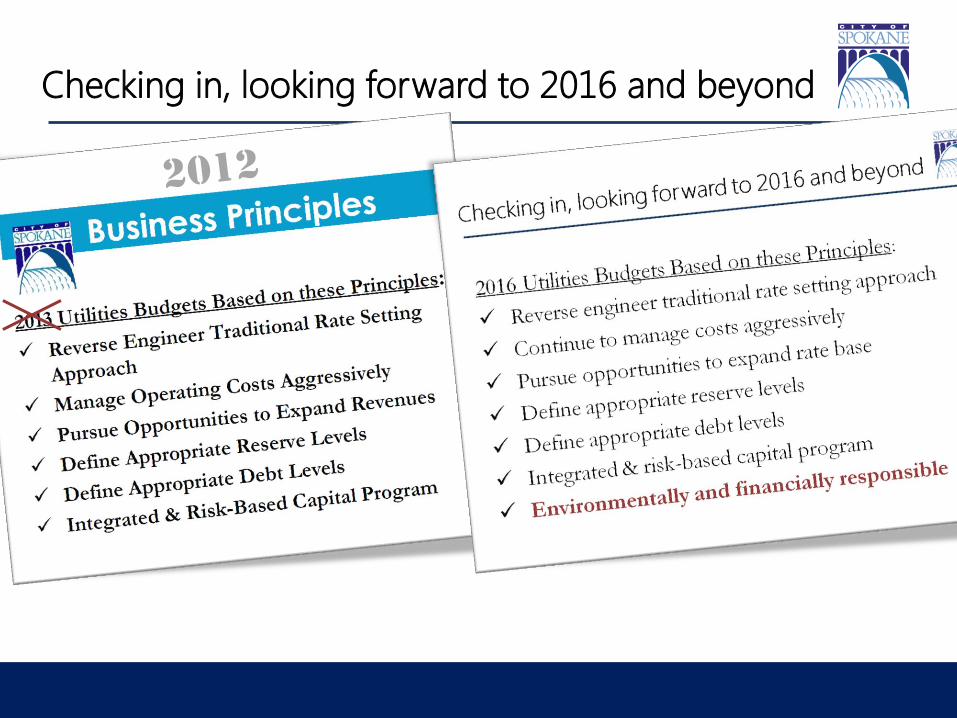
Checking in, looking forward to 2016 and beyond

Environmentally and Financially Responsible
• Meet and surpass environmental requirements while
maintaining affordability of services
• Encourage protection of natural resources through
appropriate rate structures, conservation and recycling
• Allow for growth while maintaining current water and waste
use levels
• Attack water system loss
• Commit portion of revenue growth in Utilities revenue/tax to
incentivize economic development
Role of Utilities in Economic Development

Transportation Roads
Rail
Air
Ports
Intermodal
Business
Climate
Sustainability
Location
Human Capital Labor Pool
Labor Costs/Product.
Training Res./Skill Dev.
Real Estate
Utilities &
Infrastructure
Permitting &
Regulatory
Environment
Everything &
Everyone
Working
Together =
Competitive
Community
Business Resources Innovation
Entrepreneurship
Financing
Incentives
Economic Development
10 Key
Competitiveness
Factors

Business & Environmental Interests are Aligned
First Rule of
Business:
First Rule of
Environmental
Science:
Protect
Your
Greatest
Assets
Protect
Your
Greatest
Assets
River and aquifer are regions greatest assets & greatest competitive advantage.

Evolution of Integration
• Integrated Clean Water
Plan
• Integrated: streets,
parks, water, sidewalks,
ped/bike, trees, etc.
• Rates tied to CPI
• CNG Conversion
• Operating WTE Facility
• Cleaner River, Faster
• Formalized capital
planning
• Reorganized around
integration
• Set multi-year utility
rates
• Sold 20-year bonds
• 20-year street levy
Sustainable Natural Resources
Integrated Approach
Environmentally &
Financially Responsible

Monthly Utility Cost Comparison*
Spokane Seattle Portland
Water $17.86 $53.75 $67.26
Wastewater $28.06 $94.72 $76.00
Stormwater/ Drainage $3.95 $29.20 $27.16
Integrated Capital $26.34
Solid Waste & Recycling $28.42 $76.20 $35.65
MONTHLY $104.63 $253.87 $206.07
ANNUALLY $1,255.56 $3,046.44 $2,472.84
*Example is based on usage for a family of four in a single residential home.
*Charges are for inside City residents for each location.
*Water consumption is assumed to be 50 gallons/day per person—or 8 units per month.
*Example uses as close to 68-gallon cart as possible depending on the options of each City.
2016 Overall Division Budget and Organization
Wastewater
Water
Integrated Capital
Solid Waste Collection
Solid Waste Disposal
Budgetary
Org. Chart
Utility Billing/Admin (Program)
Environmental Programs (Program)
121 FTE
$44,495,286
174 FTE
$34,477,862
157 FTE
$39,695,503
14 FTE
$133,933,399
76 FTE
$28,108,224
24 FTE
$5,237,320
3 FTE
$395,393
Utilities Division
605 FTE
$298,037,157
Fleet Services 36 FTE
$11,694,170
Mike Taylor
Dan Kegley Steve Burns
Katherine Miller Kara Heatherly
Scott Windsor Corin Morse
Chuck Conklin Ken Gimpel
Gene Jakubczak Steve Riggs
Rick Romero Marlene Feist
7 Departments
•6 Department Heads
•7 Additional Exempts

Ken Gimpel,
Assistant Utility
Director
Fleet
Services
Solid Waste
Collection
Utility Billing
Chuck Conklin,
Director
Solid Waste
Disposal
RPWRF
Dan Kegley,
Director
Wastewater Ops
Water Ops
Upriver Dam
Katherine
Miller, Director
Integrated
Capital
Marlene Feist,
Director,
Strategic
Development
Utilities Division
Rick Romero
7 Departments
•6 Department Heads
•7 Additional Exempts
Gene Jakubczak
Scott Windsor
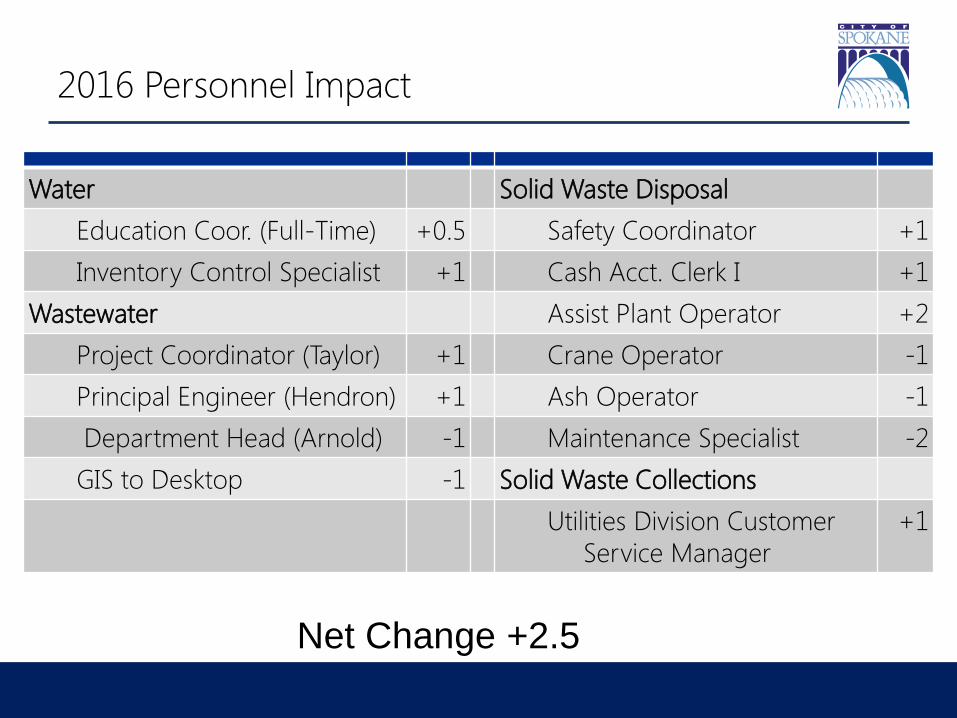
2016 Personnel Impact
Water Solid Waste Disposal
Education Coor. (Full-Time) +0.5 Safety Coordinator +1
Inventory Control Specialist +1 Cash Acct. Clerk I +1
Wastewater Assist Plant Operator +2
Project Coordinator (Taylor) +1 Crane Operator -1
Principal Engineer (Hendron) +1 Ash Operator -1
Department Head (Arnold) -1 Maintenance Specialist -2
GIS to Desktop -1 Solid Waste Collections
Utilities Division Customer
Service Manager
+1
Net Change +2.5

Division Operating Budget Summary
2014
Adopted
2015
Adopted
2016
Program
% Change
(‘15 /‘16)
Wages & Benefits 52,125,943 54,394,424 55,626,208 2.2%
Supplies & Services 58,680,863 42,820,367 41,679,802 -2.7%
Interfund 28,782,582 34,089,313 33,950,491 -0.4%
Intergov’tl Prof Srvs 36,573,759 37,649,595 38,886,140 3.2%
Other 18,604,706 12,166,372 10,776,467 -12.9%
Operating Expenses 194,767,853 181,120,071 180,919,108 -0.1%
Capital 92,178,790 110,679,900 101,472,136 -9.1%
Debt Service 1,517,237 1,647,749 15,645,913 *89.5%
Total 288,463,880 293,447,720 298,037,157 1.5%
FTE# 594 602.50 **605
*Revenue Bond Principal & Interest/ Nelson Center (Operating Transfer out from ICM to Debt Svcs)
* *After Online Budget Planner closed 2.5 positions were added for a total of 605 (See Personnel Impact)

Next Study Session: October 29th
Solid Waste Collection
Solid Waste Disposal
Water
Wastewater
Budget Summaries and Personnel Impacts
2016 Rate Review
Accomplishments and Strategic Direction
2016 Projects and Capital Program
Performance Measures

Discussion and Questions


![CALIFORNIA PUBLIC UTILITIES COMMISSION … PUBLIC UTILITIES COMMISSION WATER DIVISION Advice Letter Cover Sheet [ ] APPROVED [ ] WITHDRAWN [ ] REJECTED Signature: Comments: Date: Utility](https://static.fdocuments.us/doc/165x107/5acc93d57f8b9aad468cdf45/california-public-utilities-commission-public-utilities-commission-water-division.jpg)


