Utah's Vital Statistics Marriages and Divorces 2007
62
Utah Department of Health Center for Health Data Utah's Vital Statistics Marriages and Divorces 2007
Transcript of Utah's Vital Statistics Marriages and Divorces 2007
Utah Department of HealthCenter for Health Data
Utah's Vital Statistics
Marriages and Divorces
2007

Blank
Utah's Vital Statistics
Marriages and Divorces
June 2009Technical Report No. 267
2007
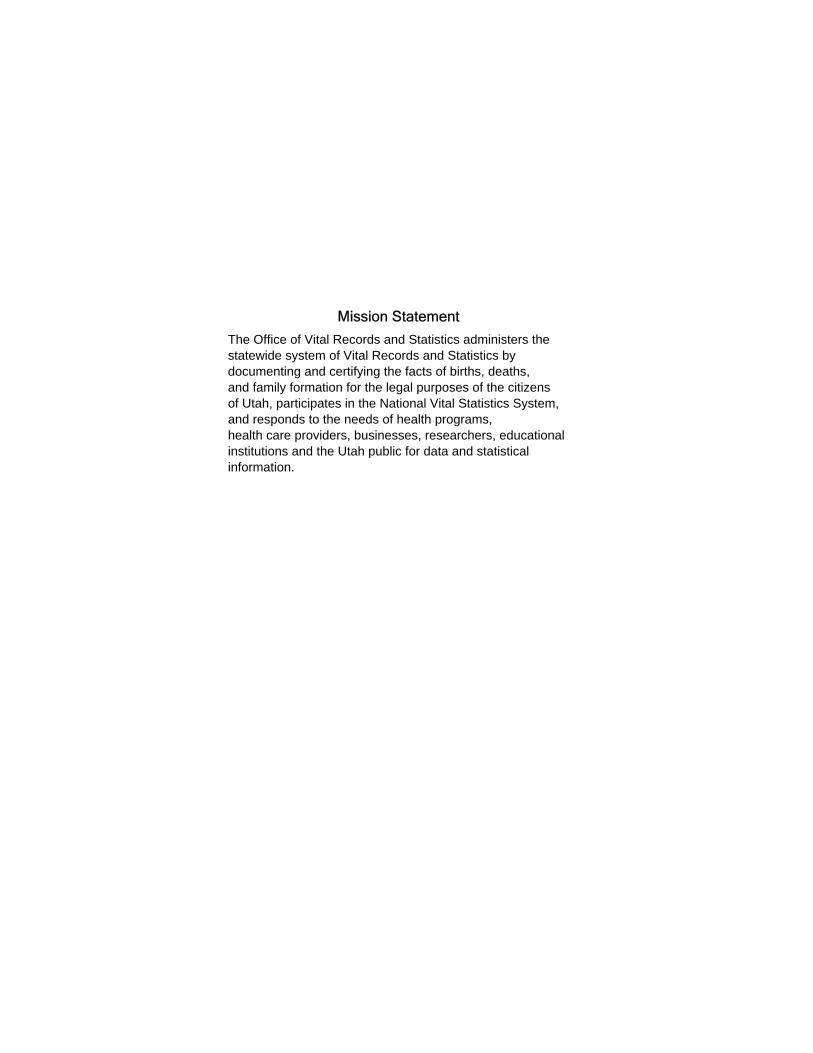
Mission Statement
The Office of Vital Records and Statistics administers thestatewide system of Vital Records and Statistics bydocumenting and certifying the facts of births, deaths, and family formation for the legal purposes of the citizens of Utah, participates in the National Vital Statistics System, and responds to the needs of health programs, health care providers, businesses, researchers, educational institutions and the Utah public for data and statistical information.
TABLE OF CONTENTS
Page ix List of Summary Tables xi List of Reference Tables xii List of Appendices S-1 Summary Tables R-1 Reference Tables T-1 Technical Notes
v

Blank
List of Summary Tables Page
S-3 Table 1. Estimated midyear population, marriage numbers and rates and divorce numbers and rates: Utah and United States, 1940, 1950, 1960, 1965, and 1970-2007
S-4 Table 2. Marriage numbers and rates by health district, county of occurrence: Utah,
2000 and 2005-2007 S-5 Table 3. First marriages and remarriages for bride and groom, numbers and rates:
Utah, 1970-2007 S-6 Table 4. Median age of bride and groom in first and second marriages: Utah, 1965
and 1970-2007 S-7 Table 5. Marriages by type of officiant, percent: Utah, 1970-2007 S-8 Table 6. Education level of brides for first marriages and remarriages, percent:
Utah, 1990-2007 S-9 Table 7. Marriages by health district, county of residence and age of bride: Utah,
2007 S-10 Table 8. Marriages where bride is less than 20 years of age by health district and
county of residence, number and percent: Utah, 2006 and 2007 S-11 Table 9. Marriages of persons under 20 and divorces of persons married at less than
20 years of age: Utah and United States, 1970, 1975-2007 S-12 Table 10. Marriage and divorce rates: Utah and United States, 1960 and 1970-2007 S-13 Table 11. Divorces by health district, county of occurrence, number and rate: Utah,
2006 and 2007
vii
(List of Summary Tables continued)
S-14 Table 12. Divorces by median age of husband and wife and order of marriage: Utah and United States, 1970-2007
S-15 Table 13. Children involved in dissolutions of marriage, average number per divorce,
and rate per 1,000 children: Utah and United States, 1960 and 1970-2007
viii
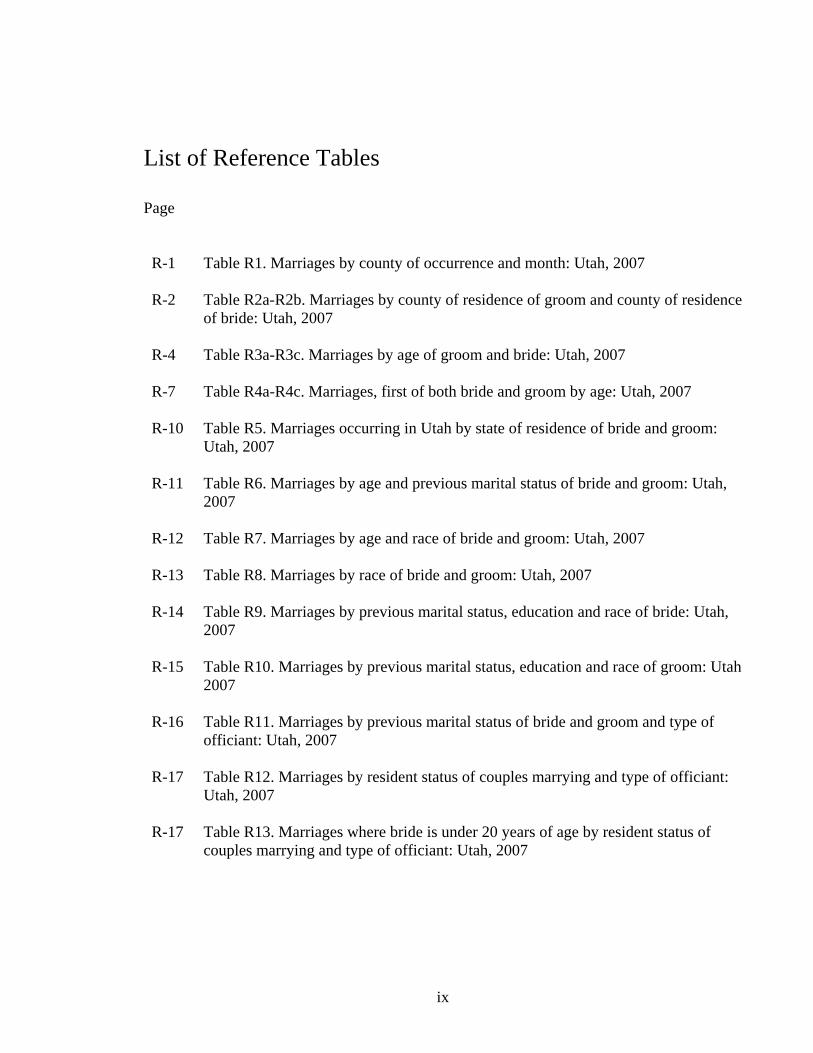
List of Reference Tables Page R-1 Table R1. Marriages by county of occurrence and month: Utah, 2007 R-2 Table R2a-R2b. Marriages by county of residence of groom and county of residence
of bride: Utah, 2007 R-4 Table R3a-R3c. Marriages by age of groom and bride: Utah, 2007 R-7 Table R4a-R4c. Marriages, first of both bride and groom by age: Utah, 2007 R-10 Table R5. Marriages occurring in Utah by state of residence of bride and groom:
Utah, 2007 R-11 Table R6. Marriages by age and previous marital status of bride and groom: Utah,
2007 R-12 Table R7. Marriages by age and race of bride and groom: Utah, 2007 R-13 Table R8. Marriages by race of bride and groom: Utah, 2007 R-14 Table R9. Marriages by previous marital status, education and race of bride: Utah,
2007 R-15 Table R10. Marriages by previous marital status, education and race of groom: Utah
2007 R-16 Table R11. Marriages by previous marital status of bride and groom and type of
officiant: Utah, 2007 R-17 Table R12. Marriages by resident status of couples marrying and type of officiant:
Utah, 2007 R-17 Table R13. Marriages where bride is under 20 years of age by resident status of
couples marrying and type of officiant: Utah, 2007
ix
(List of Reference Tables continued) Page
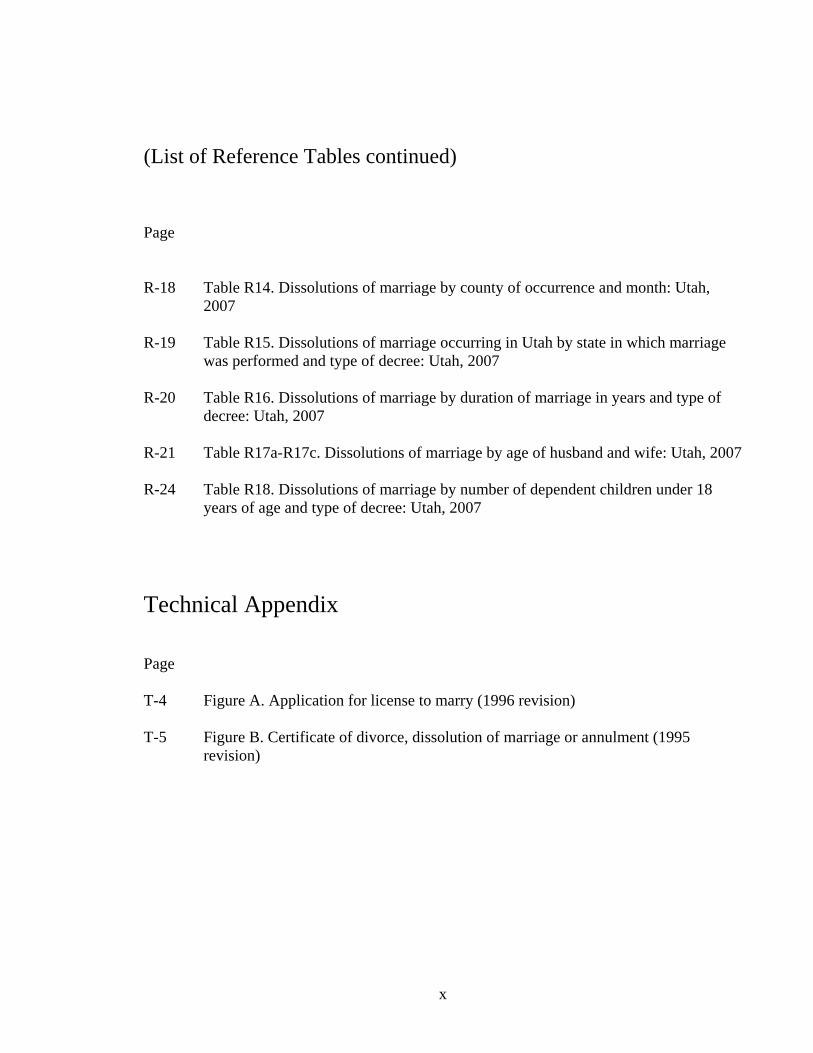
R-18 Table R14. Dissolutions of marriage by county of occurrence and month: Utah,
2007 R-19 Table R15. Dissolutions of marriage occurring in Utah by state in which marriage
was performed and type of decree: Utah, 2007 R-20 Table R16. Dissolutions of marriage by duration of marriage in years and type of
decree: Utah, 2007 R-21 Table R17a-R17c. Dissolutions of marriage by age of husband and wife: Utah, 2007 R-24 Table R18. Dissolutions of marriage by number of dependent children under 18
years of age and type of decree: Utah, 2007
Technical Appendix Page T-4 Figure A. Application for license to marry (1996 revision) T-5 Figure B. Certificate of divorce, dissolution of marriage or annulment (1995
revision)
x

2007 Summary Tables:
Marriages and Divorces

Blank
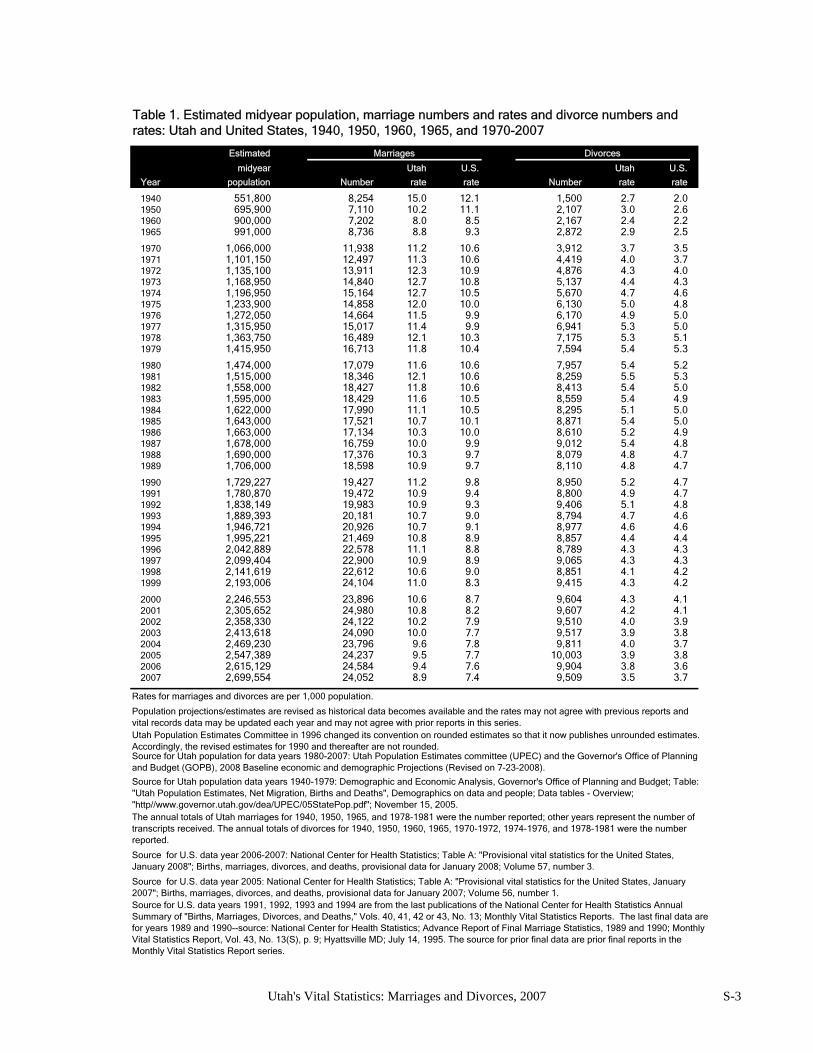
Estimated Marriages Divorces
midyear Utah U.S. Utah U.S.
Year population Number rate rate Number rate rate
1940 551,800 8,254 15.0 12.1 1,500 2.7 2.01950 695,900 7,110 10.2 11.1 2,107 3.0 2.61960 900,000 7,202 8.0 8.5 2,167 2.4 2.21965 991,000 8,736 8.8 9.3 2,872 2.9 2.5
1970 1,066,000 11,938 11.2 10.6 3,912 3.7 3.51971 1,101,150 12,497 11.3 10.6 4,419 4.0 3.71972 1,135,100 13,911 12.3 10.9 4,876 4.3 4.01973 1,168,950 14,840 12.7 10.8 5,137 4.4 4.31974 1,196,950 15,164 12.7 10.5 5,670 4.7 4.61975 1,233,900 14,858 12.0 10.0 6,130 5.0 4.81976 1,272,050 14,664 11.5 9.9 6,170 4.9 5.01977 1,315,950 15,017 11.4 9.9 6,941 5.3 5.01978 1,363,750 16,489 12.1 10.3 7,175 5.3 5.11979 1,415,950 16,713 11.8 10.4 7,594 5.4 5.3
1980 1,474,000 17,079 11.6 10.6 7,957 5.4 5.21981 1,515,000 18,346 12.1 10.6 8,259 5.5 5.31982 1,558,000 18,427 11.8 10.6 8,413 5.4 5.01983 1,595,000 18,429 11.6 10.5 8,559 5.4 4.91984 1,622,000 17,990 11.1 10.5 8,295 5.1 5.01985 1,643,000 17,521 10.7 10.1 8,871 5.4 5.01986 1,663,000 17,134 10.3 10.0 8,610 5.2 4.91987 1,678,000 16,759 10.0 9.9 9,012 5.4 4.81988 1,690,000 17,376 10.3 9.7 8,079 4.8 4.71989 1,706,000 18,598 10.9 9.7 8,110 4.8 4.7
1990 1,729,227 19,427 11.2 9.8 8,950 5.2 4.71991 1,780,870 19,472 10.9 9.4 8,800 4.9 4.71992 1,838,149 19,983 10.9 9.3 9,406 5.1 4.81993 1,889,393 20,181 10.7 9.0 8,794 4.7 4.61994 1,946,721 20,926 10.7 9.1 8,977 4.6 4.61995 1,995,221 21,469 10.8 8.9 8,857 4.4 4.41996 2,042,889 22,578 11.1 8.8 8,789 4.3 4.31997 2,099,404 22,900 10.9 8.9 9,065 4.3 4.31998 2,141,619 22,612 10.6 9.0 8,851 4.1 4.21999 2,193,006 24,104 11.0 8.3 9,415 4.3 4.2
2000 2,246,553 23,896 10.6 8.7 9,604 4.3 4.12001 2,305,652 24,980 10.8 8.2 9,607 4.2 4.12002 2,358,330 24,122 10.2 7.9 9,510 4.0 3.92003 2,413,618 24,090 10.0 7.7 9,517 3.9 3.82004 2,469,230 23,796 9.6 7.8 9,811 4.0 3.72005 2,547,389 24,237 9.5 7.7 10,003 3.9 3.82006 2,615,129 24,584 9.4 7.6 9,904 3.8 3.62007 2,699,554 24,052 8.9 7.4 9,509 3.5 3.7
Source for U.S. data year 2005: National Center for Health Statistics; Table A: "Provisional vital statistics for the United States, January 2007"; Births, marriages, divorces, and deaths, provisional data for January 2007; Volume 56, number 1.Source for U.S. data years 1991, 1992, 1993 and 1994 are from the last publications of the National Center for Health Statistics Annual Summary of "Births, Marriages, Divorces, and Deaths," Vols. 40, 41, 42 or 43, No. 13; Monthly Vital Statistics Reports. The last final data are for years 1989 and 1990--source: National Center for Health Statistics; Advance Report of Final Marriage Statistics, 1989 and 1990; Monthly Vital Statistics Report, Vol. 43, No. 13(S), p. 9; Hyattsville MD; July 14, 1995. The source for prior final data are prior final reports in the Monthly Vital Statistics Report series.
Source for Utah population data years 1940-1979: Demographic and Economic Analysis, Governor's Office of Planning and Budget; Table: "Utah Population Estimates, Net Migration, Births and Deaths", Demographics on data and people; Data tables - Overview; "http//www.governor.utah.gov/dea/UPEC/05StatePop.pdf"; November 15, 2005.The annual totals of Utah marriages for 1940, 1950, 1965, and 1978-1981 were the number reported; other years represent the number of transcripts received. The annual totals of divorces for 1940, 1950, 1960, 1965, 1970-1972, 1974-1976, and 1978-1981 were the number reported.
Source for U.S. data year 2006-2007: National Center for Health Statistics; Table A: "Provisional vital statistics for the United States, January 2008"; Births, marriages, divorces, and deaths, provisional data for January 2008; Volume 57, number 3.
Source for Utah population for data years 1980-2007: Utah Population Estimates committee (UPEC) and the Governor's Office of Planningand Budget (GOPB), 2008 Baseline economic and demographic Projections (Revised on 7-23-2008).
Table 1. Estimated midyear population, marriage numbers and rates and divorce numbers and rates: Utah and United States, 1940, 1950, 1960, 1965, and 1970-2007
Rates for marriages and divorces are per 1,000 population.
Population projections/estimates are revised as historical data becomes available and the rates may not agree with previous reports and vital records data may be updated each year and may not agree with prior reports in this series.Utah Population Estimates Committee in 1996 changed its convention on rounded estimates so that it now publishes unrounded estimates. Accordingly, the revised estimates for 1990 and thereafter are not rounded.
Utah's Vital Statistics: Marriages and Divorces, 2007 S-3
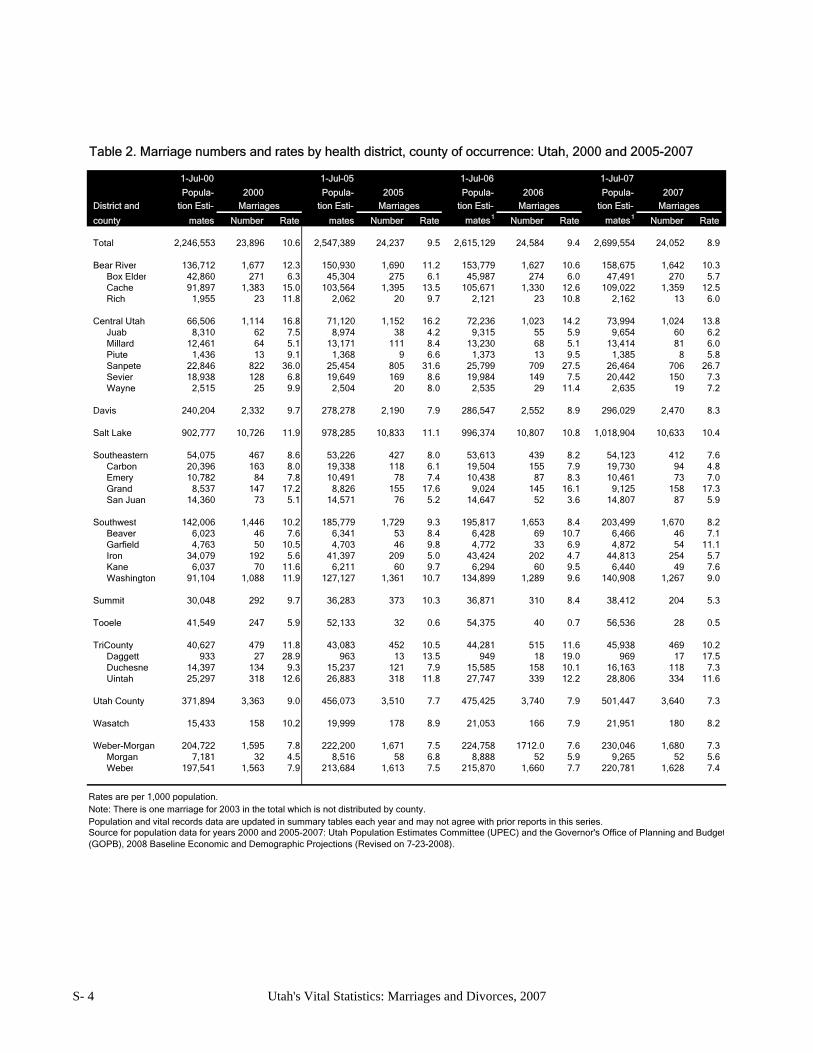
1-Jul-00 1-Jul-05 1-Jul-06 1-Jul-07
Popula- 2000 Popula- 2005 Popula- 2006 Popula- 2007
District and tion Esti- Marriages tion Esti- Marriages tion Esti- Marriages tion Esti- Marriages
county mates Number Rate mates Number Rate mates1 Number Rate mates1 Number Rate
Total 2,246,553 23,896 10.6 2,547,389 24,237 9.5 2,615,129 24,584 9.4 2,699,554 24,052 8.9
Bear River 136,712 1,677 12.3 150,930 1,690 11.2 153,779 1,627 10.6 158,675 1,642 10.3Box Elder 42,860 271 6.3 45,304 275 6.1 45,987 274 6.0 47,491 270 5.7Cache 91,897 1,383 15.0 103,564 1,395 13.5 105,671 1,330 12.6 109,022 1,359 12.5Rich 1,955 23 11.8 2,062 20 9.7 2,121 23 10.8 2,162 13 6.0
Central Utah 66,506 1,114 16.8 71,120 1,152 16.2 72,236 1,023 14.2 73,994 1,024 13.8Juab 8,310 62 7.5 8,974 38 4.2 9,315 55 5.9 9,654 60 6.2Millard 12,461 64 5.1 13,171 111 8.4 13,230 68 5.1 13,414 81 6.0Piute 1,436 13 9.1 1,368 9 6.6 1,373 13 9.5 1,385 8 5.8Sanpete 22,846 822 36.0 25,454 805 31.6 25,799 709 27.5 26,464 706 26.7Sevier 18,938 128 6.8 19,649 169 8.6 19,984 149 7.5 20,442 150 7.3Wayne 2,515 25 9.9 2,504 20 8.0 2,535 29 11.4 2,635 19 7.2
Davis 240,204 2,332 9.7 278,278 2,190 7.9 286,547 2,552 8.9 296,029 2,470 8.3
Salt Lake 902,777 10,726 11.9 978,285 10,833 11.1 996,374 10,807 10.8 1,018,904 10,633 10.4
Southeastern 54,075 467 8.6 53,226 427 8.0 53,613 439 8.2 54,123 412 7.6Carbon 20,396 163 8.0 19,338 118 6.1 19,504 155 7.9 19,730 94 4.8Emery 10,782 84 7.8 10,491 78 7.4 10,438 87 8.3 10,461 73 7.0Grand 8,537 147 17.2 8,826 155 17.6 9,024 145 16.1 9,125 158 17.3San Juan 14,360 73 5.1 14,571 76 5.2 14,647 52 3.6 14,807 87 5.9
Southwest 142,006 1,446 10.2 185,779 1,729 9.3 195,817 1,653 8.4 203,499 1,670 8.2Beaver 6,023 46 7.6 6,341 53 8.4 6,428 69 10.7 6,466 46 7.1Garfield 4,763 50 10.5 4,703 46 9.8 4,772 33 6.9 4,872 54 11.1Iron 34,079 192 5.6 41,397 209 5.0 43,424 202 4.7 44,813 254 5.7Kane 6,037 70 11.6 6,211 60 9.7 6,294 60 9.5 6,440 49 7.6Washington 91,104 1,088 11.9 127,127 1,361 10.7 134,899 1,289 9.6 140,908 1,267 9.0
Summit 30,048 292 9.7 36,283 373 10.3 36,871 310 8.4 38,412 204 5.3
Tooele 41,549 247 5.9 52,133 32 0.6 54,375 40 0.7 56,536 28 0.5
TriCounty 40,627 479 11.8 43,083 452 10.5 44,281 515 11.6 45,938 469 10.2Daggett 933 27 28.9 963 13 13.5 949 18 19.0 969 17 17.5Duchesne 14,397 134 9.3 15,237 121 7.9 15,585 158 10.1 16,163 118 7.3Uintah 25,297 318 12.6 26,883 318 11.8 27,747 339 12.2 28,806 334 11.6
Utah County 371,894 3,363 9.0 456,073 3,510 7.7 475,425 3,740 7.9 501,447 3,640 7.3
Wasatch 15,433 158 10.2 19,999 178 8.9 21,053 166 7.9 21,951 180 8.2
Weber-Morgan 204,722 1,595 7.8 222,200 1,671 7.5 224,758 1712.0 7.6 230,046 1,680 7.3Morgan 7,181 32 4.5 8,516 58 6.8 8,888 52 5.9 9,265 52 5.6Weber 197,541 1,563 7.9 213,684 1,613 7.5 215,870 1,660 7.7 220,781 1,628 7.4
Rates are per 1,000 population.Note: There is one marriage for 2003 in the total which is not distributed by county.Population and vital records data are updated in summary tables each year and may not agree with prior reports in this series.
Table 2. Marriage numbers and rates by health district, county of occurrence: Utah, 2000 and 2005-2007
Source for population data for years 2000 and 2005-2007: Utah Population Estimates Committee (UPEC) and the Governor's Office of Planning and Budget(GOPB), 2008 Baseline Economic and Demographic Projections (Revised on 7-23-2008).
S- 4 Utah's Vital Statistics: Marriages and Divorces, 2007
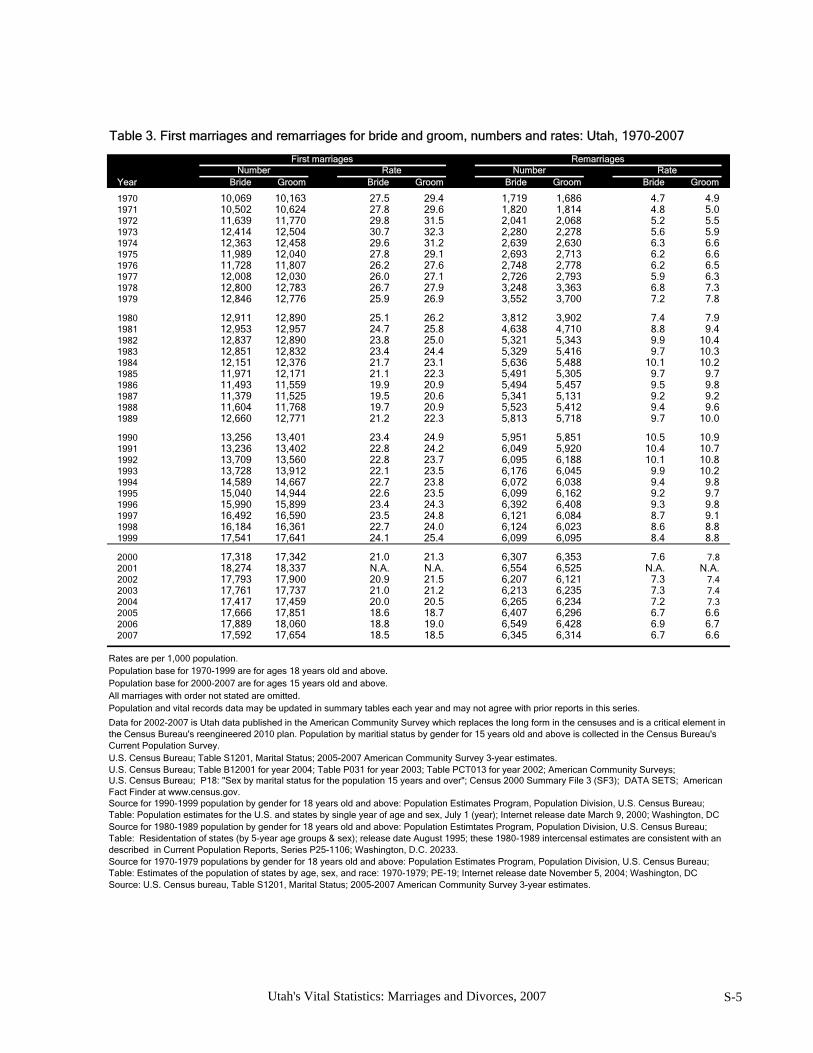
First marriages RemarriagesNumber Rate Number Rate
Year Bride Groom Bride Groom Bride Groom Bride Groom
1970 10,069 10,163 27.5 29.4 1,719 1,686 4.7 4.91971 10,502 10,624 27.8 29.6 1,820 1,814 4.8 5.01972 11,639 11,770 29.8 31.5 2,041 2,068 5.2 5.51973 12,414 12,504 30.7 32.3 2,280 2,278 5.6 5.91974 12,363 12,458 29.6 31.2 2,639 2,630 6.3 6.61975 11,989 12,040 27.8 29.1 2,693 2,713 6.2 6.61976 11,728 11,807 26.2 27.6 2,748 2,778 6.2 6.51977 12,008 12,030 26.0 27.1 2,726 2,793 5.9 6.31978 12,800 12,783 26.7 27.9 3,248 3,363 6.8 7.31979 12,846 12,776 25.9 26.9 3,552 3,700 7.2 7.8
1980 12,911 12,890 25.1 26.2 3,812 3,902 7.4 7.91981 12,953 12,957 24.7 25.8 4,638 4,710 8.8 9.41982 12,837 12,890 23.8 25.0 5,321 5,343 9.9 10.41983 12,851 12,832 23.4 24.4 5,329 5,416 9.7 10.31984 12,151 12,376 21.7 23.1 5,636 5,488 10.1 10.21985 11,971 12,171 21.1 22.3 5,491 5,305 9.7 9.71986 11,493 11,559 19.9 20.9 5,494 5,457 9.5 9.81987 11,379 11,525 19.5 20.6 5,341 5,131 9.2 9.21988 11,604 11,768 19.7 20.9 5,523 5,412 9.4 9.61989 12,660 12,771 21.2 22.3 5,813 5,718 9.7 10.0
1990 13,256 13,401 23.4 24.9 5,951 5,851 10.5 10.91991 13,236 13,402 22.8 24.2 6,049 5,920 10.4 10.71992 13,709 13,560 22.8 23.7 6,095 6,188 10.1 10.81993 13,728 13,912 22.1 23.5 6,176 6,045 9.9 10.21994 14,589 14,667 22.7 23.8 6,072 6,038 9.4 9.81995 15,040 14,944 22.6 23.5 6,099 6,162 9.2 9.71996 15,990 15,899 23.4 24.3 6,392 6,408 9.3 9.81997 16,492 16,590 23.5 24.8 6,121 6,084 8.7 9.11998 16,184 16,361 22.7 24.0 6,124 6,023 8.6 8.81999 17,541 17,641 24.1 25.4 6,099 6,095 8.4 8.8
2000 17,318 17,342 21.0 21.3 6,307 6,353 7.6 7.82001 18,274 18,337 N.A. N.A. 6,554 6,525 N.A. N.A.2002 17,793 17,900 20.9 21.5 6,207 6,121 7.3 7.42003 17,761 17,737 21.0 21.2 6,213 6,235 7.3 7.42004 17,417 17,459 20.0 20.5 6,265 6,234 7.2 7.32005 17,666 17,851 18.6 18.7 6,407 6,296 6.7 6.62006 17,889 18,060 18.8 19.0 6,549 6,428 6.9 6.72007 17,592 17,654 18.5 18.5 6,345 6,314 6.7 6.6
Rates are per 1,000 population.Population base for 1970-1999 are for ages 18 years old and above.Population base for 2000-2007 are for ages 15 years old and above.All marriages with order not stated are omitted. Population and vital records data may be updated in summary tables each year and may not agree with prior reports in this series.
U.S. Census Bureau; Table S1201, Marital Status; 2005-2007 American Community Survey 3-year estimates.
Source: U.S. Census bureau, Table S1201, Marital Status; 2005-2007 American Community Survey 3-year estimates.
U.S. Census Bureau; Table B12001 for year 2004; Table P031 for year 2003; Table PCT013 for year 2002; American Community Surveys;
Source for 1970-1979 populations by gender for 18 years old and above: Population Estimates Program, Population Division, U.S. Census Bureau; Table: Estimates of the population of states by age, sex, and race: 1970-1979; PE-19; Internet release date November 5, 2004; Washington, DC
Table 3. First marriages and remarriages for bride and groom, numbers and rates: Utah, 1970-2007
Source for 1980-1989 population by gender for 18 years old and above: Population Estimtates Program, Population Division, U.S. Census Bureau; Table: Residentation of states (by 5-year age groups & sex); release date August 1995; these 1980-1989 intercensal estimates are consistent with andescribed in Current Population Reports, Series P25-1106; Washington, D.C. 20233.
Source for 1990-1999 population by gender for 18 years old and above: Population Estimates Program, Population Division, U.S. Census Bureau; Table: Population estimates for the U.S. and states by single year of age and sex, July 1 (year); Internet release date March 9, 2000; Washington, DC
Data for 2002-2007 is Utah data published in the American Community Survey which replaces the long form in the censuses and is a critical element in the Census Bureau's reengineered 2010 plan. Population by maritial status by gender for 15 years old and above is collected in the Census Bureau's Current Population Survey.
U.S. Census Bureau; P18: "Sex by marital status for the population 15 years and over"; Census 2000 Summary File 3 (SF3); DATA SETS; AmericanFact Finder at www.census.gov.
Utah's Vital Statistics: Marriages and Divorces, 2007 S-5
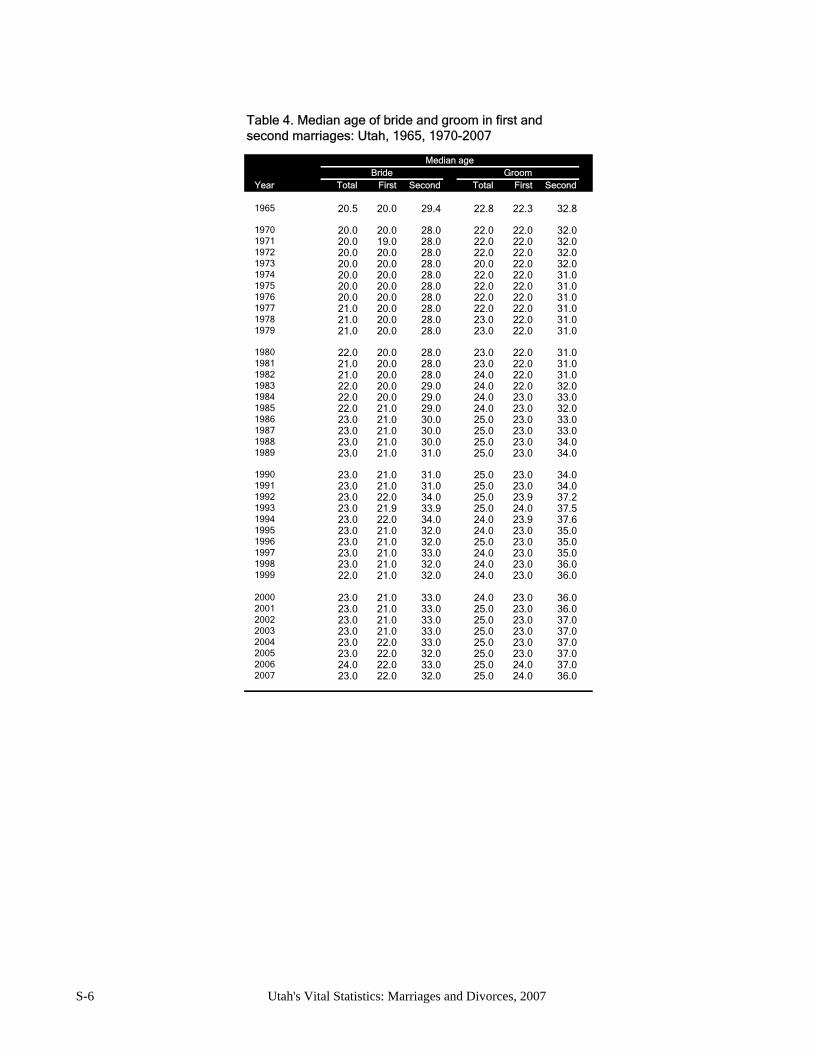
Median ageBride Groom
Year Total First Second Total First Second
1965 20.5 20.0 29.4 22.8 22.3 32.8
1970 20.0 20.0 28.0 22.0 22.0 32.01971 20.0 19.0 28.0 22.0 22.0 32.01972 20.0 20.0 28.0 22.0 22.0 32.01973 20.0 20.0 28.0 20.0 22.0 32.01974 20.0 20.0 28.0 22.0 22.0 31.01975 20.0 20.0 28.0 22.0 22.0 31.01976 20.0 20.0 28.0 22.0 22.0 31.01977 21.0 20.0 28.0 22.0 22.0 31.01978 21.0 20.0 28.0 23.0 22.0 31.01979 21.0 20.0 28.0 23.0 22.0 31.0
1980 22.0 20.0 28.0 23.0 22.0 31.01981 21.0 20.0 28.0 23.0 22.0 31.01982 21.0 20.0 28.0 24.0 22.0 31.01983 22.0 20.0 29.0 24.0 22.0 32.01984 22.0 20.0 29.0 24.0 23.0 33.01985 22.0 21.0 29.0 24.0 23.0 32.01986 23.0 21.0 30.0 25.0 23.0 33.01987 23.0 21.0 30.0 25.0 23.0 33.01988 23.0 21.0 30.0 25.0 23.0 34.01989 23.0 21.0 31.0 25.0 23.0 34.0
1990 23.0 21.0 31.0 25.0 23.0 34.01991 23.0 21.0 31.0 25.0 23.0 34.01992 23.0 22.0 34.0 25.0 23.9 37.21993 23.0 21.9 33.9 25.0 24.0 37.51994 23.0 22.0 34.0 24.0 23.9 37.61995 23.0 21.0 32.0 24.0 23.0 35.01996 23.0 21.0 32.0 25.0 23.0 35.01997 23.0 21.0 33.0 24.0 23.0 35.01998 23.0 21.0 32.0 24.0 23.0 36.01999 22.0 21.0 32.0 24.0 23.0 36.0
2000 23.0 21.0 33.0 24.0 23.0 36.02001 23.0 21.0 33.0 25.0 23.0 36.02002 23.0 21.0 33.0 25.0 23.0 37.02003 23.0 21.0 33.0 25.0 23.0 37.02004 23.0 22.0 33.0 25.0 23.0 37.02005 23.0 22.0 32.0 25.0 23.0 37.02006 24.0 22.0 33.0 25.0 24.0 37.02007 23.0 22.0 32.0 25.0 24.0 36.0
Table 4. Median age of bride and groom in first and second marriages: Utah, 1965, 1970-2007
S-6 Utah's Vital Statistics: Marriages and Divorces, 2007
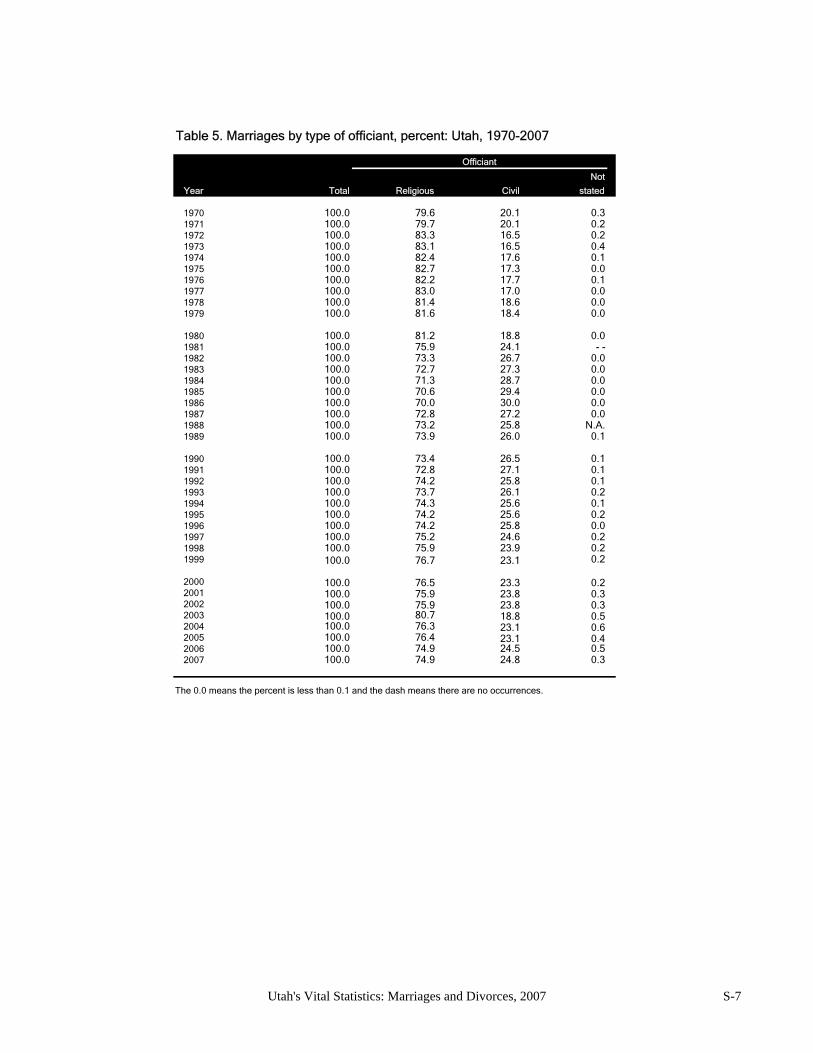
Not
Year Total Religious Civil stated
1970 100.0 79.6 20.1 0.31971 100.0 79.7 20.1 0.21972 100.0 83.3 16.5 0.21973 100.0 83.1 16.5 0.41974 100.0 82.4 17.6 0.11975 100.0 82.7 17.3 0.01976 100.0 82.2 17.7 0.11977 100.0 83.0 17.0 0.01978 100.0 81.4 18.6 0.01979 100.0 81.6 18.4 0.0
1980 100.0 81.2 18.8 0.01981 100.0 75.9 24.1 - -1982 100.0 73.3 26.7 0.01983 100.0 72.7 27.3 0.01984 100.0 71.3 28.7 0.01985 100.0 70.6 29.4 0.01986 100.0 70.0 30.0 0.01987 100.0 72.8 27.2 0.01988 100.0 73.2 25.8 N.A.1989 100.0 73.9 26.0 0.1
1990 100.0 73.4 26.5 0.11991 100.0 72.8 27.1 0.11992 100.0 74.2 25.8 0.11993 100.0 73.7 26.1 0.21994 100.0 74.3 25.6 0.11995 100.0 74.2 25.6 0.21996 100.0 74.2 25.8 0.01997 100.0 75.2 24.6 0.21998 100.0 75.9 23.9 0.21999 100.0 76.7 23.1 0.2
2000 100.0 76.5 23.3 0.22001 100.0 75.9 23.8 0.32002 100.0 75.9 23.8 0.32003 100.0 80.7 18.8 0.52004 100.0 76.3 23.1 0.62005 100.0 76.4 23.1 0.42006 100.0 74.9 24.5 0.52007 100.0 74.9 24.8 0.3
The 0.0 means the percent is less than 0.1 and the dash means there are no occurrences.
Officiant
Table 5. Marriages by type of officiant, percent: Utah, 1970-2007
Utah's Vital Statistics: Marriages and Divorces, 2007 S-7
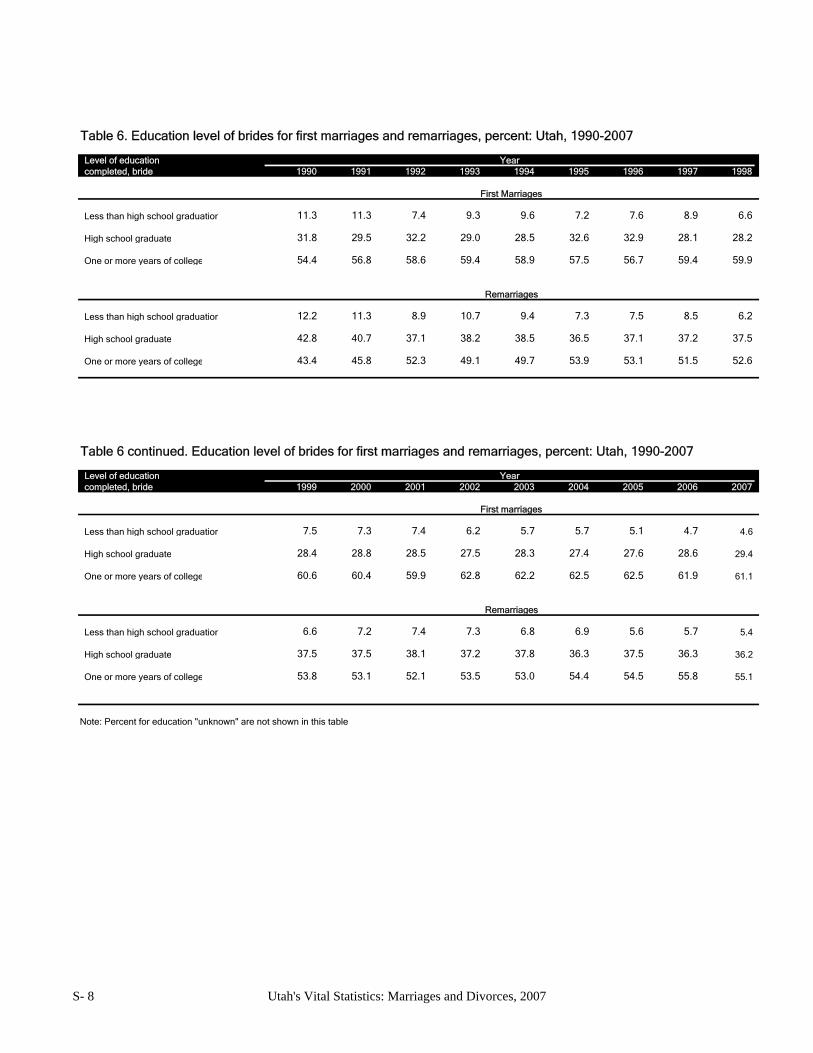
Level of education Yearcompleted, bride 1990 1991 1992 1993 1994 1995 1996 1997 1998
First Marriages
Less than high school graduation 11.3 11.3 7.4 9.3 9.6 7.2 7.6 8.9 6.6
High school graduate 31.8 29.5 32.2 29.0 28.5 32.6 32.9 28.1 28.2
One or more years of college 54.4 56.8 58.6 59.4 58.9 57.5 56.7 59.4 59.9
Remarriages
Less than high school graduation 12.2 11.3 8.9 10.7 9.4 7.3 7.5 8.5 6.2
High school graduate 42.8 40.7 37.1 38.2 38.5 36.5 37.1 37.2 37.5
One or more years of college 43.4 45.8 52.3 49.1 49.7 53.9 53.1 51.5 52.6
Level of education Yearcompleted, bride 1999 2000 2001 2002 2003 2004 2005 2006 2007
First marriages
Less than high school graduation 7.5 7.3 7.4 6.2 5.7 5.7 5.1 4.7 4.6
High school graduate 28.4 28.8 28.5 27.5 28.3 27.4 27.6 28.6 29.4
One or more years of college 60.6 60.4 59.9 62.8 62.2 62.5 62.5 61.9 61.1
Remarriages
Less than high school graduation 6.6 7.2 7.4 7.3 6.8 6.9 5.6 5.7 5.4
High school graduate 37.5 37.5 38.1 37.2 37.8 36.3 37.5 36.3 36.2
One or more years of college 53.8 53.1 52.1 53.5 53.0 54.4 54.5 55.8 55.1
Note: Percent for education "unknown" are not shown in this table
Table 6. Education level of brides for first marriages and remarriages, percent: Utah, 1990-2007
Table 6 continued. Education level of brides for first marriages and remarriages, percent: Utah, 1990-2007
S- 8 Utah's Vital Statistics: Marriages and Divorces, 2007
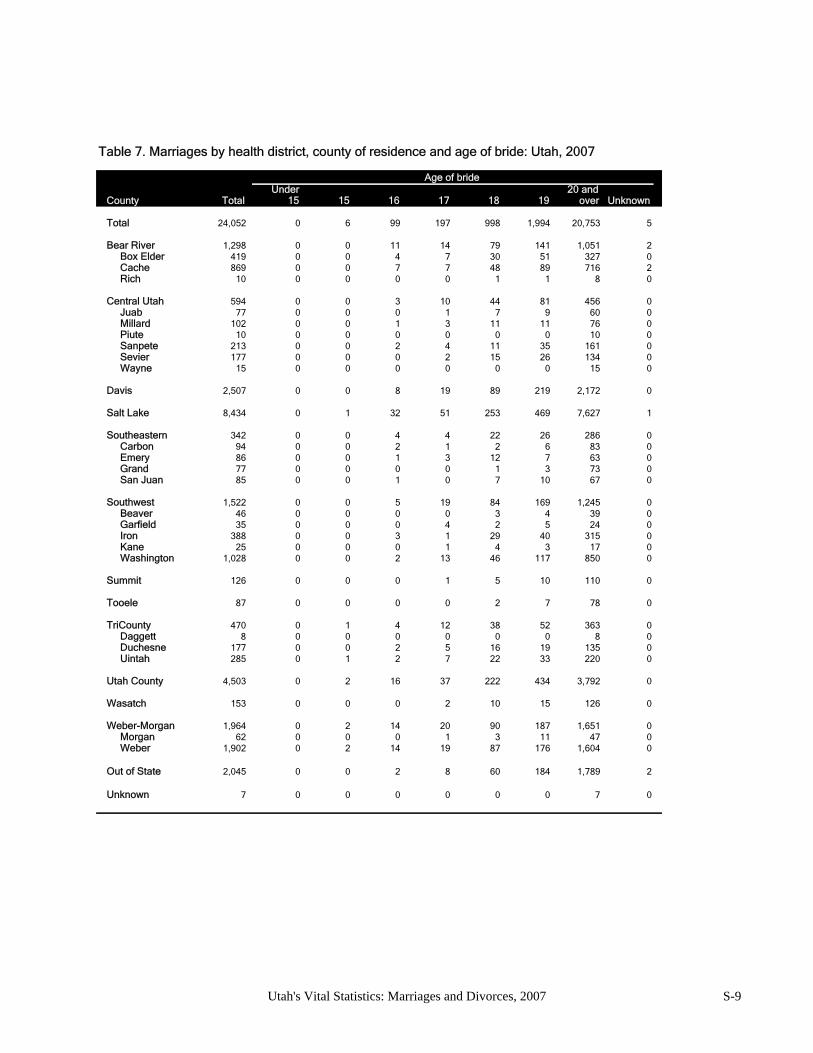
Age of brideUnder 20 and
County Total 15 15 16 17 18 19 over Unknown
Total 24,052 0 6 99 197 998 1,994 20,753 5
Bear River 1,298 0 0 11 14 79 141 1,051 2Box Elder 419 0 0 4 7 30 51 327 0Cache 869 0 0 7 7 48 89 716 2Rich 10 0 0 0 0 1 1 8 0
Central Utah 594 0 0 3 10 44 81 456 0Juab 77 0 0 0 1 7 9 60 0Millard 102 0 0 1 3 11 11 76 0Piute 10 0 0 0 0 0 0 10 0Sanpete 213 0 0 2 4 11 35 161 0Sevier 177 0 0 0 2 15 26 134 0Wayne 15 0 0 0 0 0 0 15 0
Davis 2,507 0 0 8 19 89 219 2,172 0
Salt Lake 8,434 0 1 32 51 253 469 7,627 1
Southeastern 342 0 0 4 4 22 26 286 0Carbon 94 0 0 2 1 2 6 83 0Emery 86 0 0 1 3 12 7 63 0Grand 77 0 0 0 0 1 3 73 0San Juan 85 0 0 1 0 7 10 67 0
Southwest 1,522 0 0 5 19 84 169 1,245 0Beaver 46 0 0 0 0 3 4 39 0Garfield 35 0 0 0 4 2 5 24 0Iron 388 0 0 3 1 29 40 315 0Kane 25 0 0 0 1 4 3 17 0Washington 1,028 0 0 2 13 46 117 850 0
Summit 126 0 0 0 1 5 10 110 0
Tooele 87 0 0 0 0 2 7 78 0
TriCounty 470 0 1 4 12 38 52 363 0Daggett 8 0 0 0 0 0 0 8 0Duchesne 177 0 0 2 5 16 19 135 0Uintah 285 0 1 2 7 22 33 220 0
Utah County 4,503 0 2 16 37 222 434 3,792 0
Wasatch 153 0 0 0 2 10 15 126 0
Weber-Morgan 1,964 0 2 14 20 90 187 1,651 0Morgan 62 0 0 0 1 3 11 47 0Weber 1,902 0 2 14 19 87 176 1,604 0
Out of State 2,045 0 0 2 8 60 184 1,789 2
Unknown 7 0 0 0 0 0 0 7 0
Table 7. Marriages by health district, county of residence and age of bride: Utah, 2007
Utah's Vital Statistics: Marriages and Divorces, 2007 S-9
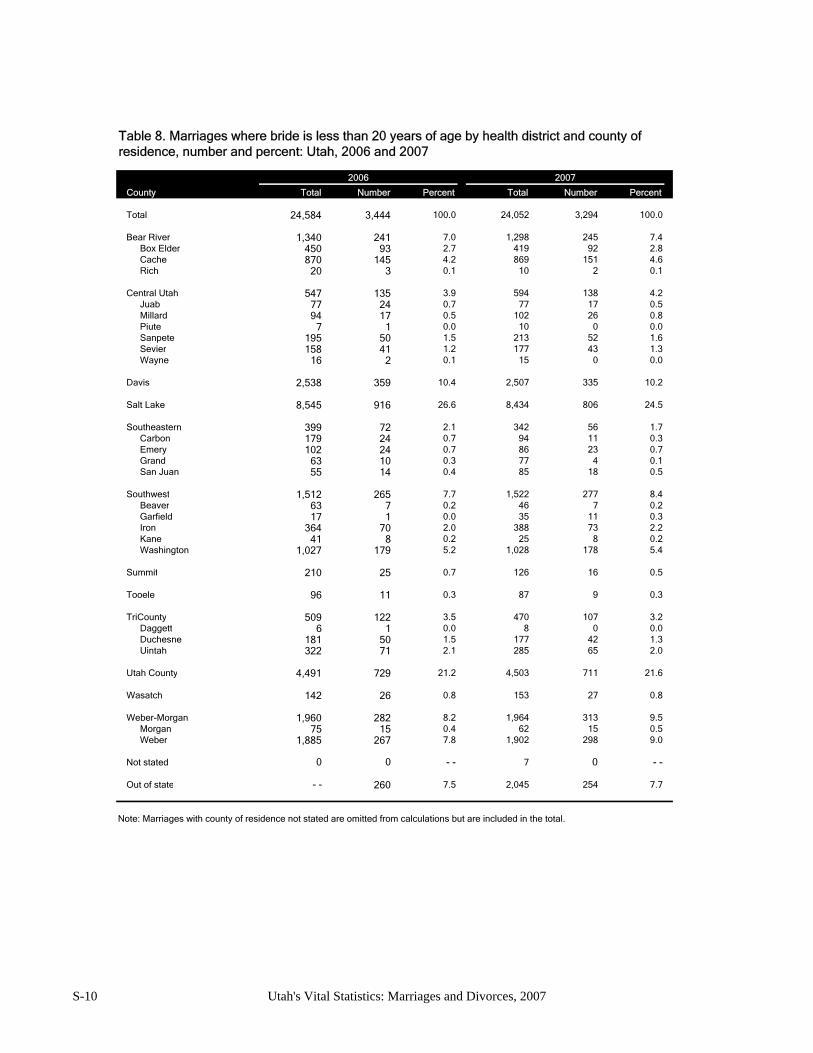
2006 2007
County Total Number Percent Total Number Percent
Total 24,584 3,444 100.0 24,052 3,294 100.0
Bear River 1,340 241 7.0 1,298 245 7.4Box Elder 450 93 2.7 419 92 2.8Cache 870 145 4.2 869 151 4.6Rich 20 3 0.1 10 2 0.1
Central Utah 547 135 3.9 594 138 4.2Juab 77 24 0.7 77 17 0.5Millard 94 17 0.5 102 26 0.8Piute 7 1 0.0 10 0 0.0Sanpete 195 50 1.5 213 52 1.6Sevier 158 41 1.2 177 43 1.3Wayne 16 2 0.1 15 0 0.0
Davis 2,538 359 10.4 2,507 335 10.2
Salt Lake 8,545 916 26.6 8,434 806 24.5
Southeastern 399 72 2.1 342 56 1.7Carbon 179 24 0.7 94 11 0.3Emery 102 24 0.7 86 23 0.7Grand 63 10 0.3 77 4 0.1San Juan 55 14 0.4 85 18 0.5
Southwest 1,512 265 7.7 1,522 277 8.4Beaver 63 7 0.2 46 7 0.2Garfield 17 1 0.0 35 11 0.3Iron 364 70 2.0 388 73 2.2Kane 41 8 0.2 25 8 0.2Washington 1,027 179 5.2 1,028 178 5.4
Summit 210 25 0.7 126 16 0.5
Tooele 96 11 0.3 87 9 0.3
TriCounty 509 122 3.5 470 107 3.2Daggett 6 1 0.0 8 0 0.0Duchesne 181 50 1.5 177 42 1.3Uintah 322 71 2.1 285 65 2.0
Utah County 4,491 729 21.2 4,503 711 21.6
Wasatch 142 26 0.8 153 27 0.8
Weber-Morgan 1,960 282 8.2 1,964 313 9.5Morgan 75 15 0.4 62 15 0.5Weber 1,885 267 7.8 1,902 298 9.0
Not stated 0 0 - - 7 0 - -
Out of state - - 260 7.5 2,045 254 7.7
Note: Marriages with county of residence not stated are omitted from calculations but are included in the total.
Table 8. Marriages where bride is less than 20 years of age by health district and county of residence, number and percent: Utah, 2006 and 2007
S-10 Utah's Vital Statistics: Marriages and Divorces, 2007
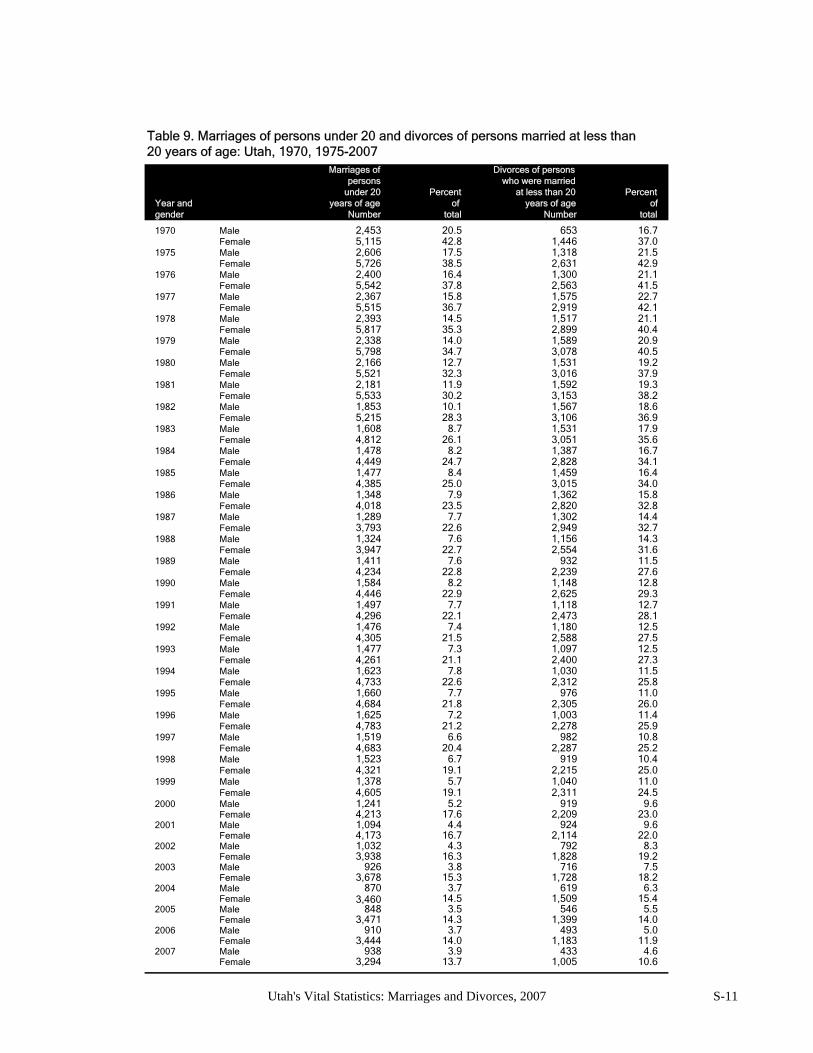
Marriages of Divorces of personspersons who were married
under 20 Percent at less than 20 PercentYear and years of age of years of age ofgender Number total Number total
1970 Male 2,453 20.5 653 16.7Female 5,115 42.8 1,446 37.0
1975 Male 2,606 17.5 1,318 21.5Female 5,726 38.5 2,631 42.9
1976 Male 2,400 16.4 1,300 21.1Female 5,542 37.8 2,563 41.5
1977 Male 2,367 15.8 1,575 22.7Female 5,515 36.7 2,919 42.1
1978 Male 2,393 14.5 1,517 21.1Female 5,817 35.3 2,899 40.4
1979 Male 2,338 14.0 1,589 20.9Female 5,798 34.7 3,078 40.5
1980 Male 2,166 12.7 1,531 19.2Female 5,521 32.3 3,016 37.9
1981 Male 2,181 11.9 1,592 19.3Female 5,533 30.2 3,153 38.2
1982 Male 1,853 10.1 1,567 18.6Female 5,215 28.3 3,106 36.9
1983 Male 1,608 8.7 1,531 17.9Female 4,812 26.1 3,051 35.6
1984 Male 1,478 8.2 1,387 16.7Female 4,449 24.7 2,828 34.1
1985 Male 1,477 8.4 1,459 16.4Female 4,385 25.0 3,015 34.0
1986 Male 1,348 7.9 1,362 15.8Female 4,018 23.5 2,820 32.8
1987 Male 1,289 7.7 1,302 14.4Female 3,793 22.6 2,949 32.7
1988 Male 1,324 7.6 1,156 14.3Female 3,947 22.7 2,554 31.6
1989 Male 1,411 7.6 932 11.5Female 4,234 22.8 2,239 27.6
1990 Male 1,584 8.2 1,148 12.8Female 4,446 22.9 2,625 29.3
1991 Male 1,497 7.7 1,118 12.7Female 4,296 22.1 2,473 28.1
1992 Male 1,476 7.4 1,180 12.5Female 4,305 21.5 2,588 27.5
1993 Male 1,477 7.3 1,097 12.5Female 4,261 21.1 2,400 27.3
1994 Male 1,623 7.8 1,030 11.5Female 4,733 22.6 2,312 25.8
1995 Male 1,660 7.7 976 11.0Female 4,684 21.8 2,305 26.0
1996 Male 1,625 7.2 1,003 11.4Female 4,783 21.2 2,278 25.9
1997 Male 1,519 6.6 982 10.8Female 4,683 20.4 2,287 25.2
1998 Male 1,523 6.7 919 10.4Female 4,321 19.1 2,215 25.0
1999 Male 1,378 5.7 1,040 11.0Female 4,605 19.1 2,311 24.5
2000 Male 1,241 5.2 919 9.6Female 4,213 17.6 2,209 23.0
2001 Male 1,094 4.4 924 9.6Female 4,173 16.7 2,114 22.0
2002 Male 1,032 4.3 792 8.3Female 3,938 16.3 1,828 19.2
2003 Male 926 3.8 716 7.5Female 3,678 15.3 1,728 18.2
2004 Male 870 3.7 619 6.3Female 3,460 14.5 1,509 15.4
2005 Male 848 3.5 546 5.5Female 3,471 14.3 1,399 14.0
2006 Male 910 3.7 493 5.0Female 3,444 14.0 1,183 11.9
2007 Male 938 3.9 433 4.6Female 3,294 13.7 1,005 10.6
Table 9. Marriages of persons under 20 and divorces of persons married at less than 20 years of age: Utah, 1970, 1975-2007
Utah's Vital Statistics: Marriages and Divorces, 2007 S-11
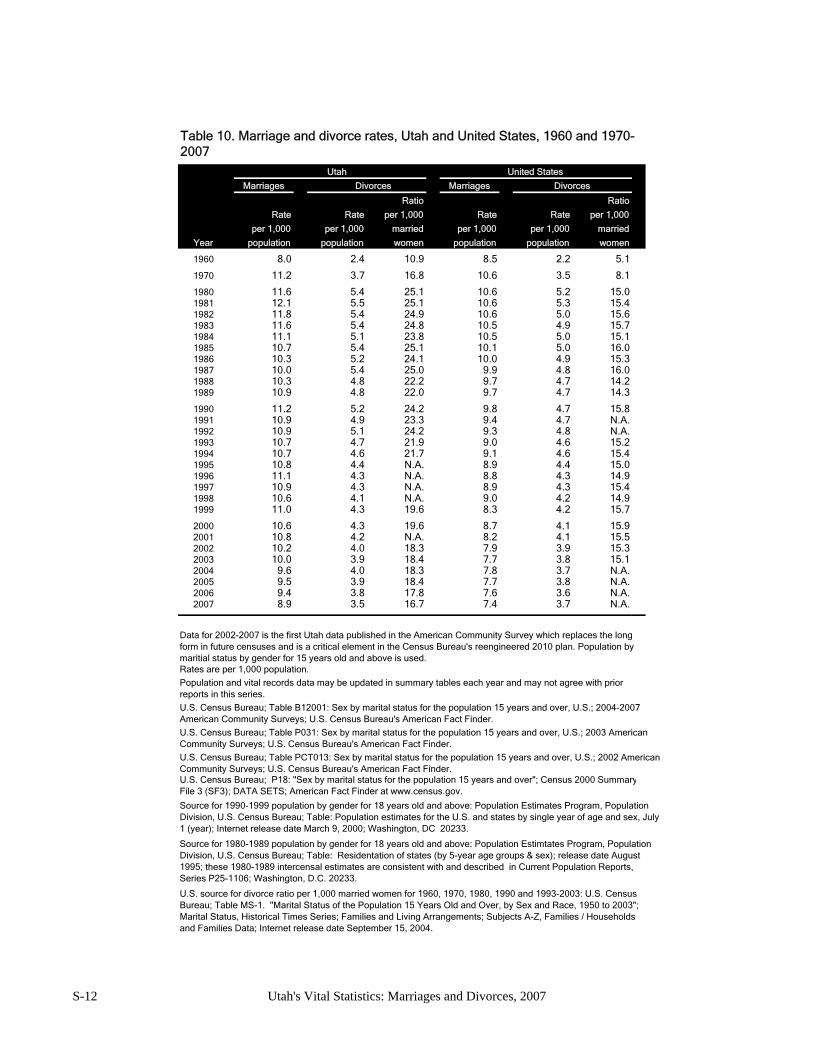
Utah United States
Marriages Divorces Marriages Divorces
Ratio Ratio
Rate Rate per 1,000 Rate Rate per 1,000
per 1,000 per 1,000 married per 1,000 per 1,000 married
Year population population women population population women
1960 8.0 2.4 10.9 8.5 2.2 5.1
1970 11.2 3.7 16.8 10.6 3.5 8.1
1980 11.6 5.4 25.1 10.6 5.2 15.01981 12.1 5.5 25.1 10.6 5.3 15.41982 11.8 5.4 24.9 10.6 5.0 15.61983 11.6 5.4 24.8 10.5 4.9 15.71984 11.1 5.1 23.8 10.5 5.0 15.11985 10.7 5.4 25.1 10.1 5.0 16.01986 10.3 5.2 24.1 10.0 4.9 15.31987 10.0 5.4 25.0 9.9 4.8 16.01988 10.3 4.8 22.2 9.7 4.7 14.21989 10.9 4.8 22.0 9.7 4.7 14.3
1990 11.2 5.2 24.2 9.8 4.7 15.81991 10.9 4.9 23.3 9.4 4.7 N.A.1992 10.9 5.1 24.2 9.3 4.8 N.A.1993 10.7 4.7 21.9 9.0 4.6 15.21994 10.7 4.6 21.7 9.1 4.6 15.41995 10.8 4.4 N.A. 8.9 4.4 15.01996 11.1 4.3 N.A. 8.8 4.3 14.91997 10.9 4.3 N.A. 8.9 4.3 15.41998 10.6 4.1 N.A. 9.0 4.2 14.91999 11.0 4.3 19.6 8.3 4.2 15.7
2000 10.6 4.3 19.6 8.7 4.1 15.92001 10.8 4.2 N.A. 8.2 4.1 15.52002 10.2 4.0 18.3 7.9 3.9 15.32003 10.0 3.9 18.4 7.7 3.8 15.12004 9.6 4.0 18.3 7.8 3.7 N.A.2005 9.5 3.9 18.4 7.7 3.8 N.A.2006 9.4 3.8 17.8 7.6 3.6 N.A.2007 8.9 3.5 16.7 7.4 3.7 N.A.
Rates are per 1,000 population.
Population and vital records data may be updated in summary tables each year and may not agree with prior reports in this series.
Data for 2002-2007 is the first Utah data published in the American Community Survey which replaces the long form in future censuses and is a critical element in the Census Bureau's reengineered 2010 plan. Population by maritial status by gender for 15 years old and above is used.
Table 10. Marriage and divorce rates, Utah and United States, 1960 and 1970-2007
U.S. source for divorce ratio per 1,000 married women for 1960, 1970, 1980, 1990 and 1993-2003: U.S. Census Bureau; Table MS-1. "Marital Status of the Population 15 Years Old and Over, by Sex and Race, 1950 to 2003"; Marital Status, Historical Times Series; Families and Living Arrangements; Subjects A-Z, Families / Households and Families Data; Internet release date September 15, 2004.
U.S. Census Bureau; P18: "Sex by marital status for the population 15 years and over"; Census 2000 SummaryFile 3 (SF3); DATA SETS; American Fact Finder at www.census.gov.
Source for 1980-1989 population by gender for 18 years old and above: Population Estimtates Program, Population Division, U.S. Census Bureau; Table: Residentation of states (by 5-year age groups & sex); release date August 1995; these 1980-1989 intercensal estimates are consistent with and described in Current Population Reports, Series P25-1106; Washington, D.C. 20233.
U.S. Census Bureau; Table B12001: Sex by marital status for the population 15 years and over, U.S.; 2004-2007 American Community Surveys; U.S. Census Bureau's American Fact Finder.
U.S. Census Bureau; Table P031: Sex by marital status for the population 15 years and over, U.S.; 2003 American Community Surveys; U.S. Census Bureau's American Fact Finder.
U.S. Census Bureau; Table PCT013: Sex by marital status for the population 15 years and over, U.S.; 2002 American Community Surveys; U.S. Census Bureau's American Fact Finder.
Source for 1990-1999 population by gender for 18 years old and above: Population Estimates Program, Population Division, U.S. Census Bureau; Table: Population estimates for the U.S. and states by single year of age and sex, July 1 (year); Internet release date March 9, 2000; Washington, DC 20233.
S-12 Utah's Vital Statistics: Marriages and Divorces, 2007
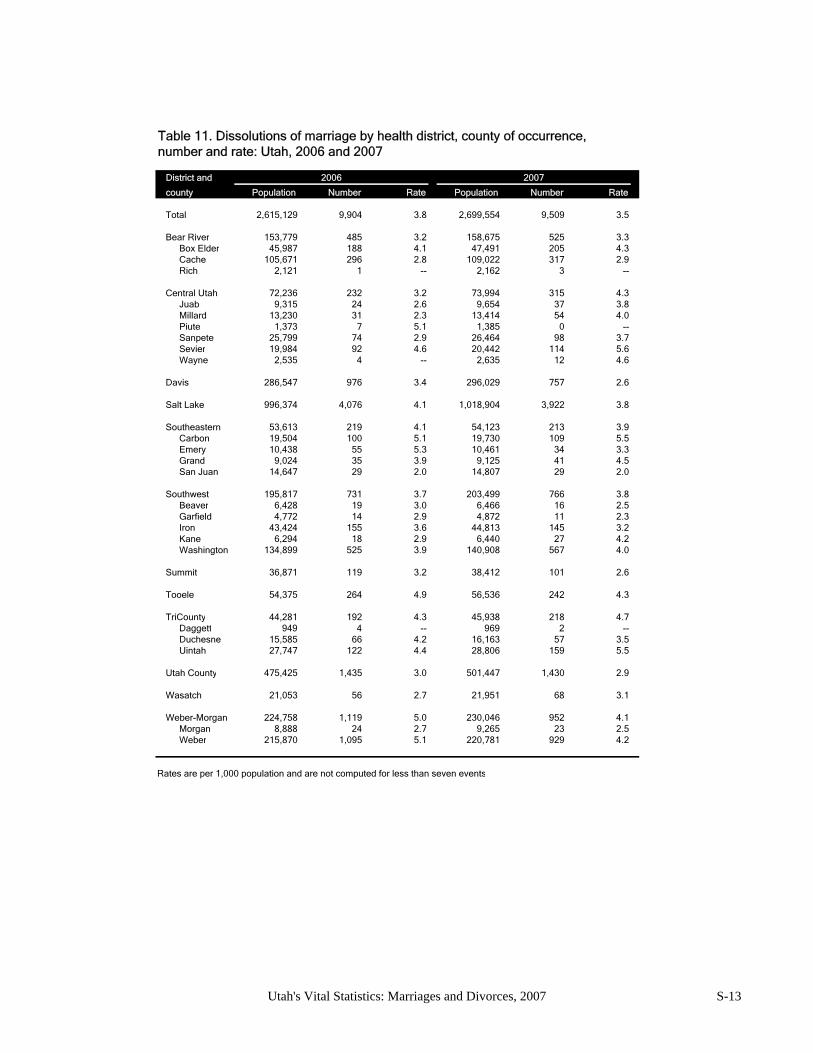
District and 2006 2007
county Population Number Rate Population Number Rate
Total 2,615,129 9,904 3.8 2,699,554 9,509 3.5
Bear River 153,779 485 3.2 158,675 525 3.3Box Elder 45,987 188 4.1 47,491 205 4.3Cache 105,671 296 2.8 109,022 317 2.9Rich 2,121 1 -- 2,162 3 --
Central Utah 72,236 232 3.2 73,994 315 4.3Juab 9,315 24 2.6 9,654 37 3.8Millard 13,230 31 2.3 13,414 54 4.0Piute 1,373 7 5.1 1,385 0 --Sanpete 25,799 74 2.9 26,464 98 3.7Sevier 19,984 92 4.6 20,442 114 5.6Wayne 2,535 4 -- 2,635 12 4.6
Davis 286,547 976 3.4 296,029 757 2.6
Salt Lake 996,374 4,076 4.1 1,018,904 3,922 3.8
Southeastern 53,613 219 4.1 54,123 213 3.9Carbon 19,504 100 5.1 19,730 109 5.5Emery 10,438 55 5.3 10,461 34 3.3Grand 9,024 35 3.9 9,125 41 4.5San Juan 14,647 29 2.0 14,807 29 2.0
Southwest 195,817 731 3.7 203,499 766 3.8Beaver 6,428 19 3.0 6,466 16 2.5Garfield 4,772 14 2.9 4,872 11 2.3Iron 43,424 155 3.6 44,813 145 3.2Kane 6,294 18 2.9 6,440 27 4.2Washington 134,899 525 3.9 140,908 567 4.0
Summit 36,871 119 3.2 38,412 101 2.6
Tooele 54,375 264 4.9 56,536 242 4.3
TriCounty 44,281 192 4.3 45,938 218 4.7Daggett 949 4 -- 969 2 --Duchesne 15,585 66 4.2 16,163 57 3.5Uintah 27,747 122 4.4 28,806 159 5.5
Utah County 475,425 1,435 3.0 501,447 1,430 2.9
Wasatch 21,053 56 2.7 21,951 68 3.1
Weber-Morgan 224,758 1,119 5.0 230,046 952 4.1Morgan 8,888 24 2.7 9,265 23 2.5Weber 215,870 1,095 5.1 220,781 929 4.2
Table 11. Dissolutions of marriage by health district, county of occurrence, number and rate: Utah, 2006 and 2007
Rates are per 1,000 population and are not computed for less than seven events
Utah's Vital Statistics: Marriages and Divorces, 2007 S-13
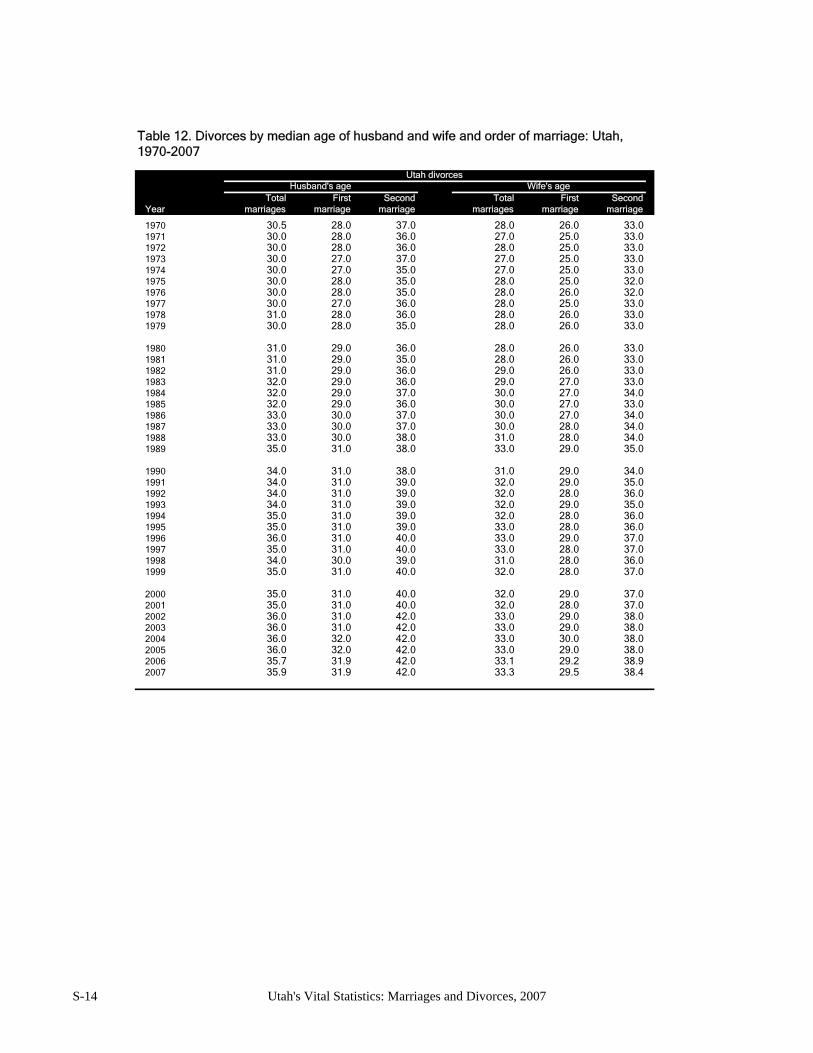
Total First Second Total First SecondYear marriages marriage marriage marriages marriage marriage
1970 30.5 28.0 37.0 28.0 26.0 33.01971 30.0 28.0 36.0 27.0 25.0 33.01972 30.0 28.0 36.0 28.0 25.0 33.01973 30.0 27.0 37.0 27.0 25.0 33.01974 30.0 27.0 35.0 27.0 25.0 33.01975 30.0 28.0 35.0 28.0 25.0 32.01976 30.0 28.0 35.0 28.0 26.0 32.01977 30.0 27.0 36.0 28.0 25.0 33.01978 31.0 28.0 36.0 28.0 26.0 33.01979 30.0 28.0 35.0 28.0 26.0 33.0
1980 31.0 29.0 36.0 28.0 26.0 33.01981 31.0 29.0 35.0 28.0 26.0 33.01982 31.0 29.0 36.0 29.0 26.0 33.01983 32.0 29.0 36.0 29.0 27.0 33.01984 32.0 29.0 37.0 30.0 27.0 34.01985 32.0 29.0 36.0 30.0 27.0 33.01986 33.0 30.0 37.0 30.0 27.0 34.01987 33.0 30.0 37.0 30.0 28.0 34.01988 33.0 30.0 38.0 31.0 28.0 34.01989 35.0 31.0 38.0 33.0 29.0 35.0
1990 34.0 31.0 38.0 31.0 29.0 34.01991 34.0 31.0 39.0 32.0 29.0 35.01992 34.0 31.0 39.0 32.0 28.0 36.01993 34.0 31.0 39.0 32.0 29.0 35.01994 35.0 31.0 39.0 32.0 28.0 36.01995 35.0 31.0 39.0 33.0 28.0 36.01996 36.0 31.0 40.0 33.0 29.0 37.01997 35.0 31.0 40.0 33.0 28.0 37.01998 34.0 30.0 39.0 31.0 28.0 36.01999 35.0 31.0 40.0 32.0 28.0 37.0
2000 35.0 31.0 40.0 32.0 29.0 37.02001 35.0 31.0 40.0 32.0 28.0 37.02002 36.0 31.0 42.0 33.0 29.0 38.02003 36.0 31.0 42.0 33.0 29.0 38.02004 36.0 32.0 42.0 33.0 30.0 38.02005 36.0 32.0 42.0 33.0 29.0 38.02006 35.7 31.9 42.0 33.1 29.2 38.92007 35.9 31.9 42.0 33.3 29.5 38.4
Utah divorcesHusband's age Wife's age
Table 12. Divorces by median age of husband and wife and order of marriage: Utah, 1970-2007
S-14 Utah's Vital Statistics: Marriages and Divorces, 2007
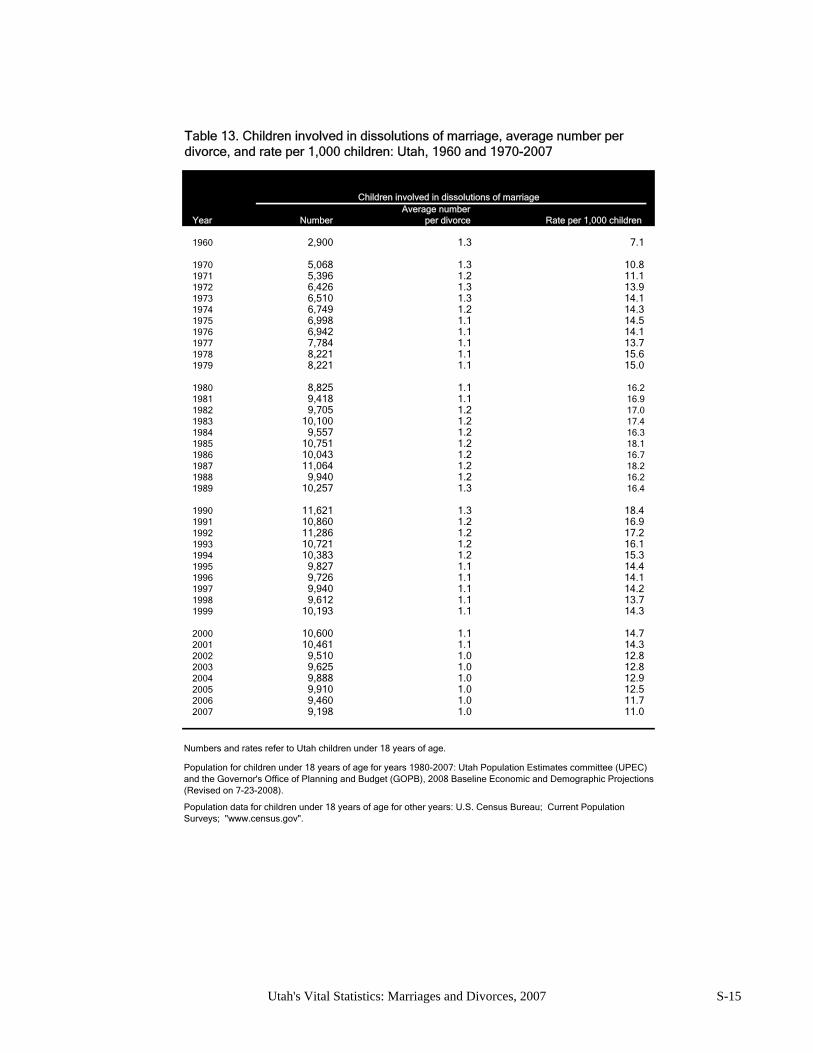
Children involved in dissolutions of marriageAverage number
Year Number per divorce Rate per 1,000 children
1960 2,900 1.3 7.1
1970 5,068 1.3 10.81971 5,396 1.2 11.11972 6,426 1.3 13.91973 6,510 1.3 14.11974 6,749 1.2 14.31975 6,998 1.1 14.51976 6,942 1.1 14.11977 7,784 1.1 13.71978 8,221 1.1 15.61979 8,221 1.1 15.0
1980 8,825 1.1 16.21981 9,418 1.1 16.91982 9,705 1.2 17.01983 10,100 1.2 17.41984 9,557 1.2 16.31985 10,751 1.2 18.11986 10,043 1.2 16.71987 11,064 1.2 18.21988 9,940 1.2 16.21989 10,257 1.3 16.4
1990 11,621 1.3 18.41991 10,860 1.2 16.91992 11,286 1.2 17.21993 10,721 1.2 16.11994 10,383 1.2 15.31995 9,827 1.1 14.41996 9,726 1.1 14.11997 9,940 1.1 14.21998 9,612 1.1 13.71999 10,193 1.1 14.3
2000 10,600 1.1 14.72001 10,461 1.1 14.32002 9,510 1.0 12.82003 9,625 1.0 12.82004 9,888 1.0 12.92005 9,910 1.0 12.52006 9,460 1.0 11.72007 9,198 1.0 11.0
Numbers and rates refer to Utah children under 18 years of age.
Table 13. Children involved in dissolutions of marriage, average number per divorce, and rate per 1,000 children: Utah, 1960 and 1970-2007
Population data for children under 18 years of age for other years: U.S. Census Bureau; Current Population Surveys; "www.census.gov".
Population for children under 18 years of age for years 1980-2007: Utah Population Estimates committee (UPEC) and the Governor's Office of Planning and Budget (GOPB), 2008 Baseline Economic and Demographic Projections (Revised on 7-23-2008).
Utah's Vital Statistics: Marriages and Divorces, 2007 S-15

Blank
2007 Reference Tables:
Marriages and Divorces

Blank
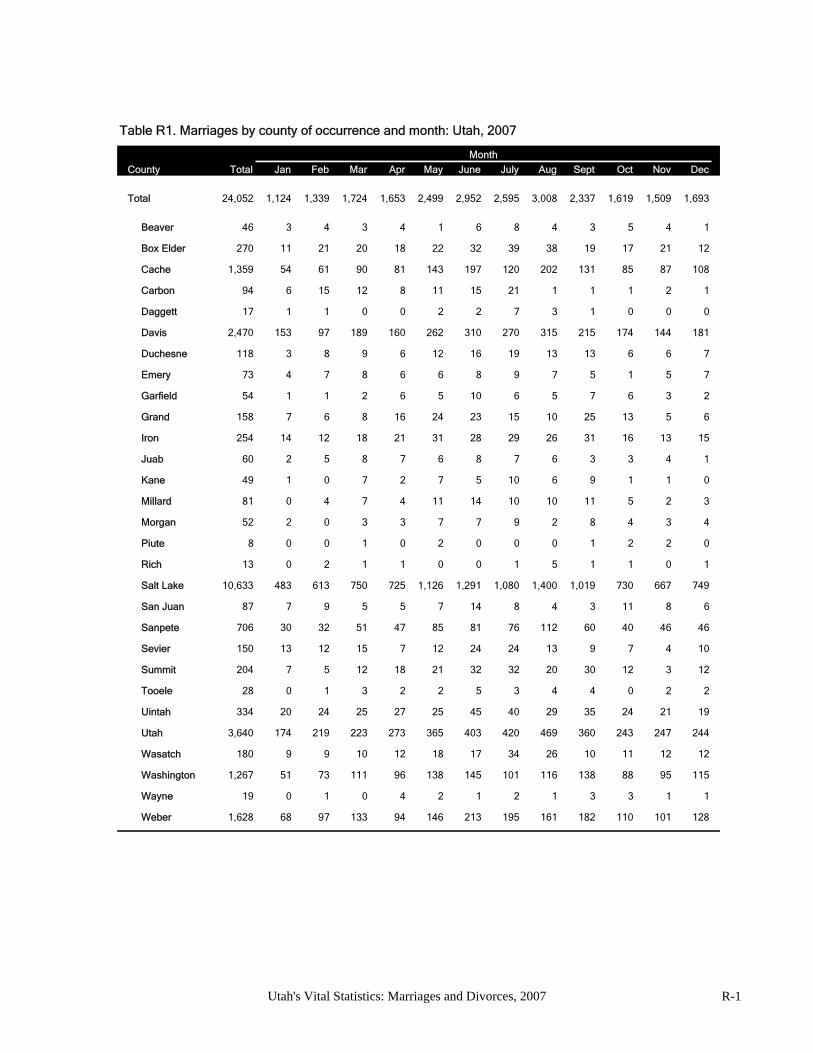
Month
County Total Jan Feb Mar Apr May June July Aug Sept Oct Nov Dec
Total 24,052 1,124 1,339 1,724 1,653 2,499 2,952 2,595 3,008 2,337 1,619 1,509 1,693
Beaver 46 3 4 3 4 1 6 8 4 3 5 4 1
Box Elder 270 11 21 20 18 22 32 39 38 19 17 21 12
Cache 1,359 54 61 90 81 143 197 120 202 131 85 87 108
Carbon 94 6 15 12 8 11 15 21 1 1 1 2 1
Daggett 17 1 1 0 0 2 2 7 3 1 0 0 0
Davis 2,470 153 97 189 160 262 310 270 315 215 174 144 181
Duchesne 118 3 8 9 6 12 16 19 13 13 6 6 7
Emery 73 4 7 8 6 6 8 9 7 5 1 5 7
Garfield 54 1 1 2 6 5 10 6 5 7 6 3 2
Grand 158 7 6 8 16 24 23 15 10 25 13 5 6
Iron 254 14 12 18 21 31 28 29 26 31 16 13 15
Juab 60 2 5 8 7 6 8 7 6 3 3 4 1
Kane 49 1 0 7 2 7 5 10 6 9 1 1 0
Millard 81 0 4 7 4 11 14 10 10 11 5 2 3
Morgan 52 2 0 3 3 7 7 9 2 8 4 3 4
Piute 8 0 0 1 0 2 0 0 0 1 2 2 0
Rich 13 0 2 1 1 0 0 1 5 1 1 0 1
Salt Lake 10,633 483 613 750 725 1,126 1,291 1,080 1,400 1,019 730 667 749
San Juan 87 7 9 5 5 7 14 8 4 3 11 8 6
Sanpete 706 30 32 51 47 85 81 76 112 60 40 46 46
Sevier 150 13 12 15 7 12 24 24 13 9 7 4 10
Summit 204 7 5 12 18 21 32 32 20 30 12 3 12
Tooele 28 0 1 3 2 2 5 3 4 4 0 2 2
Uintah 334 20 24 25 27 25 45 40 29 35 24 21 19
Utah 3,640 174 219 223 273 365 403 420 469 360 243 247 244
Wasatch 180 9 9 10 12 18 17 34 26 10 11 12 12
Washington 1,267 51 73 111 96 138 145 101 116 138 88 95 115
Wayne 19 0 1 0 4 2 1 2 1 3 3 1 1
Weber 1,628 68 97 133 94 146 213 195 161 182 110 101 128
Table R1. Marriages by county of occurrence and month: Utah, 2007
Utah's Vital Statistics: Marriages and Divorces, 2007 R-1
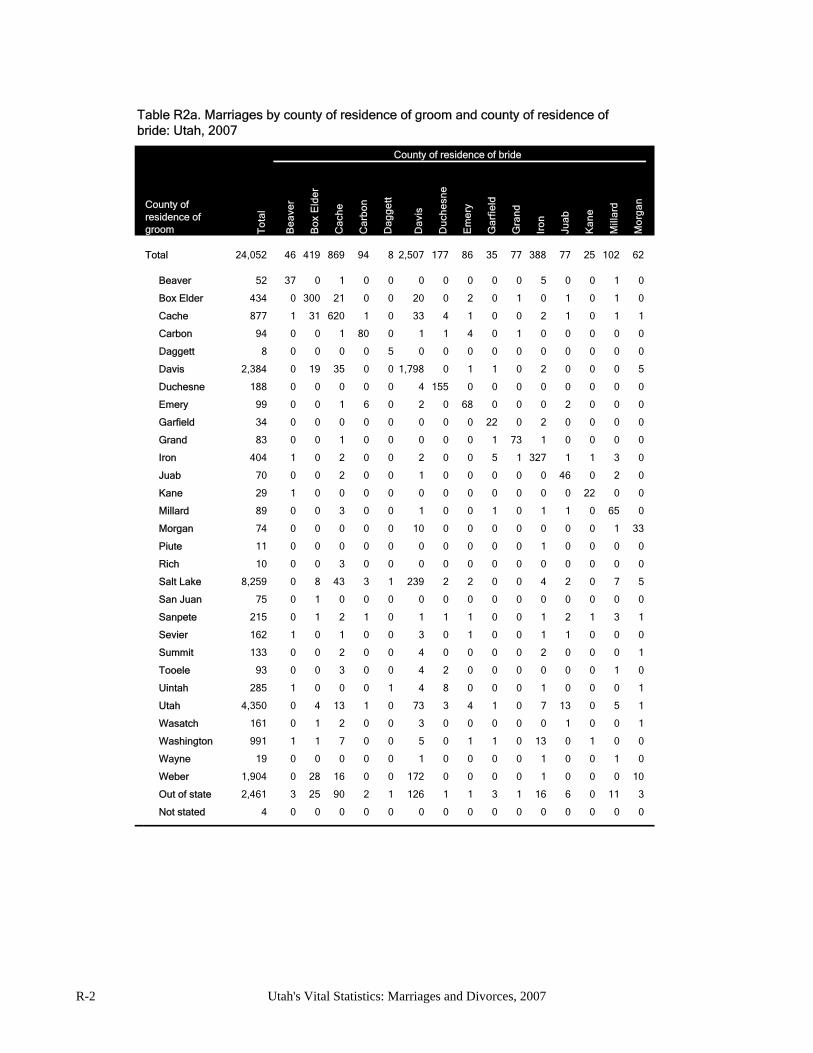
County of residence of bride
To
tal
Be
ave
r
Bo
x E
lde
r
Ca
che
Ca
rbo
n
Da
gg
ett
Da
vis
Du
che
sne
Em
ery
Ga
rfie
ld
Gra
nd
Iro
n
Jua
b
Ka
ne
Mill
ard
Mo
rga
n
Total 24,052 46 419 869 94 8 2,507 177 86 35 77 388 77 25 102 62
Beaver 52 37 0 1 0 0 0 0 0 0 0 5 0 0 1 0
Box Elder 434 0 300 21 0 0 20 0 2 0 1 0 1 0 1 0
Cache 877 1 31 620 1 0 33 4 1 0 0 2 1 0 1 1
Carbon 94 0 0 1 80 0 1 1 4 0 1 0 0 0 0 0
Daggett 8 0 0 0 0 5 0 0 0 0 0 0 0 0 0 0
Davis 2,384 0 19 35 0 0 1,798 0 1 1 0 2 0 0 0 5
Duchesne 188 0 0 0 0 0 4 155 0 0 0 0 0 0 0 0
Emery 99 0 0 1 6 0 2 0 68 0 0 0 2 0 0 0
Garfield 34 0 0 0 0 0 0 0 0 22 0 2 0 0 0 0
Grand 83 0 0 1 0 0 0 0 0 1 73 1 0 0 0 0
Iron 404 1 0 2 0 0 2 0 0 5 1 327 1 1 3 0
Juab 70 0 0 2 0 0 1 0 0 0 0 0 46 0 2 0
Kane 29 1 0 0 0 0 0 0 0 0 0 0 0 22 0 0
Millard 89 0 0 3 0 0 1 0 0 1 0 1 1 0 65 0
Morgan 74 0 0 0 0 0 10 0 0 0 0 0 0 0 1 33
Piute 11 0 0 0 0 0 0 0 0 0 0 1 0 0 0 0
Rich 10 0 0 3 0 0 0 0 0 0 0 0 0 0 0 0
Salt Lake 8,259 0 8 43 3 1 239 2 2 0 0 4 2 0 7 5
San Juan 75 0 1 0 0 0 0 0 0 0 0 0 0 0 0 0
Sanpete 215 0 1 2 1 0 1 1 1 0 0 1 2 1 3 1
Sevier 162 1 0 1 0 0 3 0 1 0 0 1 1 0 0 0
Summit 133 0 0 2 0 0 4 0 0 0 0 2 0 0 0 1
Tooele 93 0 0 3 0 0 4 2 0 0 0 0 0 0 1 0
Uintah 285 1 0 0 0 1 4 8 0 0 0 1 0 0 0 1
Utah 4,350 0 4 13 1 0 73 3 4 1 0 7 13 0 5 1
Wasatch 161 0 1 2 0 0 3 0 0 0 0 0 1 0 0 1
Washington 991 1 1 7 0 0 5 0 1 1 0 13 0 1 0 0
Wayne 19 0 0 0 0 0 1 0 0 0 0 1 0 0 1 0
Weber 1,904 0 28 16 0 0 172 0 0 0 0 1 0 0 0 10
Out of state 2,461 3 25 90 2 1 126 1 1 3 1 16 6 0 11 3
Not stated 4 0 0 0 0 0 0 0 0 0 0 0 0 0 0 0
Table R2a. Marriages by county of residence of groom and county of residence of bride: Utah, 2007
County of residence of groom
R-2 Utah's Vital Statistics: Marriages and Divorces, 2007
County of residence of bride
Piu
te
Ric
h
Sa
lt L
ake
Sa
n J
ua
n
Sa
np
ete
Se
vie
r
Su
mm
it
To
oe
le
Uin
tah
Uta
h
Wa
satc
h
Wa
shin
gto
n
Wa
yne
We
be
r
Ou
t o
f st
ate
No
t st
ate
d
Total 10 10 8,434 85 213 177 126 87 285 4,503 153 1,028 15 1,902 2,045 7
Beaver 0 0 0 0 0 1 0 0 0 1 0 2 0 1 3 0
Box Elder 0 0 25 0 0 1 0 0 0 6 0 3 0 30 22 1
Cache 0 0 62 1 4 3 1 3 3 23 2 4 0 20 55 0
Carbon 0 0 1 0 0 0 0 0 0 3 0 0 0 0 2 0
Daggett 0 0 0 0 0 0 0 0 0 0 0 0 0 2 1 0
Davis 0 0 235 0 2 0 3 9 0 61 1 10 0 145 55 2
Duchesne 0 0 8 0 1 0 0 0 13 4 0 0 0 1 2 0
Emery 0 0 3 0 2 2 0 0 0 8 0 1 0 0 4 0
Garfield 0 0 3 0 0 1 0 0 0 1 0 2 0 0 3 0
Grand 0 0 1 1 0 0 0 0 0 0 0 0 0 1 4 0
Iron 0 1 11 0 2 2 0 0 1 12 0 18 0 2 12 0
Juab 0 0 4 0 0 0 0 1 1 10 0 0 0 0 3 0
Kane 0 0 1 0 1 0 0 1 0 1 0 0 0 0 2 0
Millard 0 0 3 0 0 3 0 0 0 5 0 0 0 1 5 0
Morgan 0 0 4 0 0 0 2 0 0 5 0 0 0 16 3 0
Piute 6 0 1 0 0 2 0 0 0 1 0 0 0 0 0 0
Rich 0 4 2 0 0 0 0 0 0 0 0 0 0 0 1 0
Salt Lake 0 0 7,342 2 11 2 19 30 1 300 10 20 0 53 153 0
San Juan 0 0 1 68 1 0 0 0 0 2 0 0 0 1 1 0
Sanpete 0 0 12 0 162 3 0 0 0 16 1 1 1 1 3 0
Sevier 0 0 5 0 3 134 0 0 0 7 0 1 0 1 3 0
Summit 0 0 19 0 2 0 84 1 0 10 2 0 0 3 3 0
Tooele 0 0 38 0 0 1 1 28 0 5 0 3 0 2 5 0
Uintah 0 0 7 0 0 1 0 0 253 1 0 0 0 0 7 0
Utah 1 3 287 1 7 6 7 4 2 3,712 11 21 1 17 143 2
Wasatch 1 0 13 0 0 0 0 0 1 15 119 1 0 1 2 0
Washington 1 0 23 0 3 6 0 0 0 13 1 880 0 6 28 0
Wayne 0 0 0 0 0 2 0 0 0 1 0 0 11 0 2 0
Weber 0 1 58 0 2 1 2 4 1 20 1 6 1 1,555 25 0
Out of state 1 1 265 12 10 6 7 6 9 259 5 54 1 43 1,492 1
Not stated 0 0 0 0 0 0 0 0 0 1 0 1 0 0 1 1
Table R2b. Marriages by county of residence of groom and county of residence of bride: Utah, 2007
County of residence of groom
Utah's Vital Statistics: Marriages and Divorces, 2007 R-3
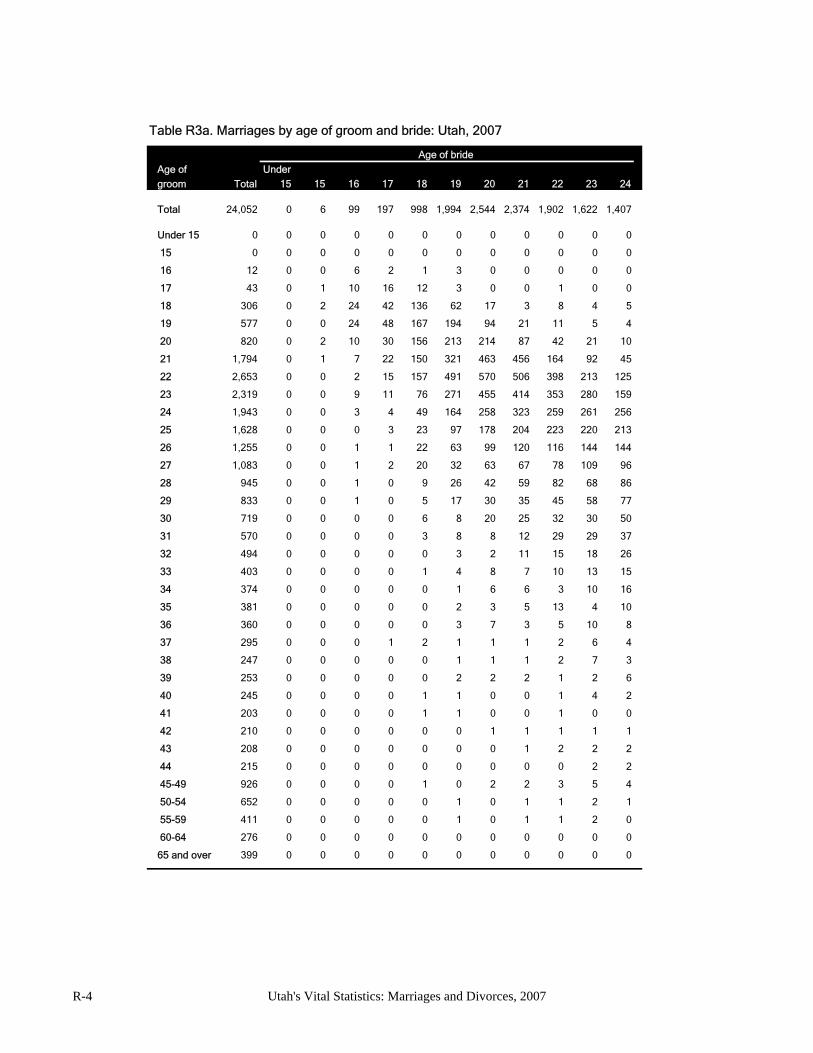
Age of bride
Age of Under
groom Total 15 15 16 17 18 19 20 21 22 23 24
Total 24,052 0 6 99 197 998 1,994 2,544 2,374 1,902 1,622 1,407
Under 15 0 0 0 0 0 0 0 0 0 0 0 0
15 0 0 0 0 0 0 0 0 0 0 0 0
16 12 0 0 6 2 1 3 0 0 0 0 0
17 43 0 1 10 16 12 3 0 0 1 0 0
18 306 0 2 24 42 136 62 17 3 8 4 5
19 577 0 0 24 48 167 194 94 21 11 5 4
20 820 0 2 10 30 156 213 214 87 42 21 10
21 1,794 0 1 7 22 150 321 463 456 164 92 45
22 2,653 0 0 2 15 157 491 570 506 398 213 125
23 2,319 0 0 9 11 76 271 455 414 353 280 159
24 1,943 0 0 3 4 49 164 258 323 259 261 256
25 1,628 0 0 0 3 23 97 178 204 223 220 213
26 1,255 0 0 1 1 22 63 99 120 116 144 144
27 1,083 0 0 1 2 20 32 63 67 78 109 96
28 945 0 0 1 0 9 26 42 59 82 68 86
29 833 0 0 1 0 5 17 30 35 45 58 77
30 719 0 0 0 0 6 8 20 25 32 30 50
31 570 0 0 0 0 3 8 8 12 29 29 37
32 494 0 0 0 0 0 3 2 11 15 18 26
33 403 0 0 0 0 1 4 8 7 10 13 15
34 374 0 0 0 0 0 1 6 6 3 10 16
35 381 0 0 0 0 0 2 3 5 13 4 10
36 360 0 0 0 0 0 3 7 3 5 10 8
37 295 0 0 0 1 2 1 1 1 2 6 4
38 247 0 0 0 0 0 1 1 1 2 7 3
39 253 0 0 0 0 0 2 2 2 1 2 6
40 245 0 0 0 0 1 1 0 0 1 4 2
41 203 0 0 0 0 1 1 0 0 1 0 0
42 210 0 0 0 0 0 0 1 1 1 1 1
43 208 0 0 0 0 0 0 0 1 2 2 2
44 215 0 0 0 0 0 0 0 0 0 2 2
45-49 926 0 0 0 0 1 0 2 2 3 5 4
50-54 652 0 0 0 0 0 1 0 1 1 2 1
55-59 411 0 0 0 0 0 1 0 1 1 2 0
60-64 276 0 0 0 0 0 0 0 0 0 0 0
65 and over 399 0 0 0 0 0 0 0 0 0 0 0
Table R3a. Marriages by age of groom and bride: Utah, 2007
R-4 Utah's Vital Statistics: Marriages and Divorces, 2007
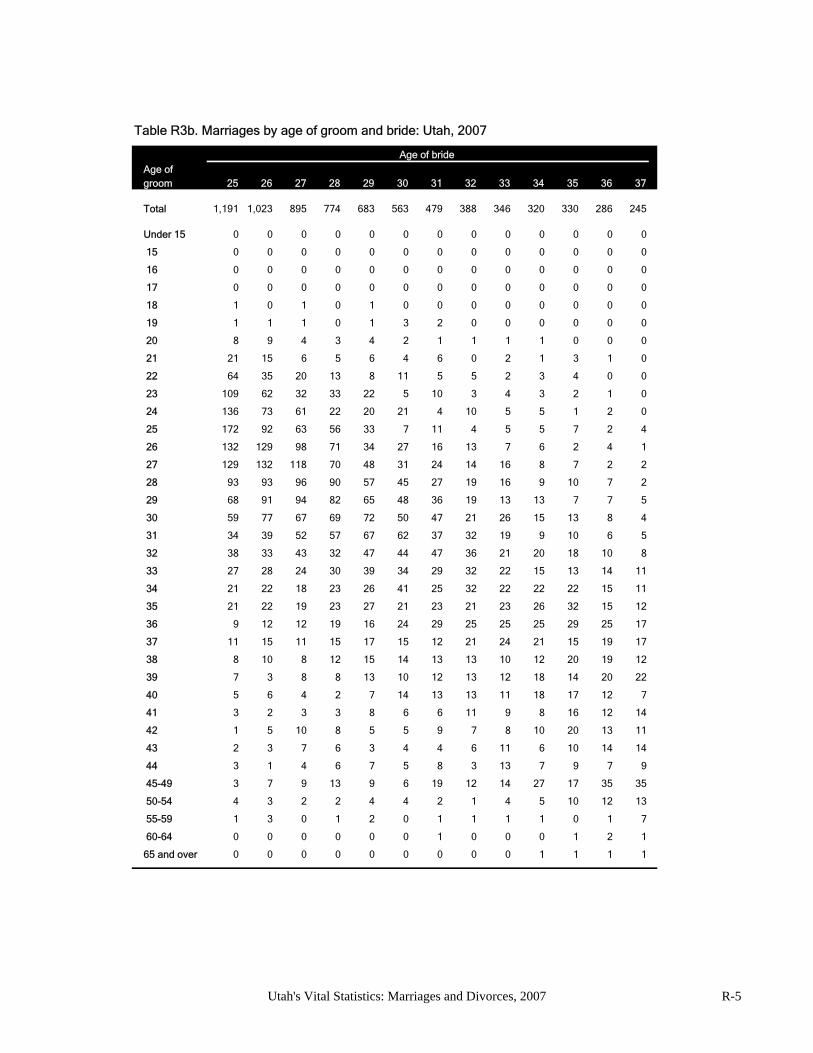
Age of bride
Age ofgroom 25 26 27 28 29 30 31 32 33 34 35 36 37
Total 1,191 1,023 895 774 683 563 479 388 346 320 330 286 245
Under 15 0 0 0 0 0 0 0 0 0 0 0 0 0
15 0 0 0 0 0 0 0 0 0 0 0 0 0
16 0 0 0 0 0 0 0 0 0 0 0 0 0
17 0 0 0 0 0 0 0 0 0 0 0 0 0
18 1 0 1 0 1 0 0 0 0 0 0 0 0
19 1 1 1 0 1 3 2 0 0 0 0 0 0
20 8 9 4 3 4 2 1 1 1 1 0 0 0
21 21 15 6 5 6 4 6 0 2 1 3 1 0
22 64 35 20 13 8 11 5 5 2 3 4 0 0
23 109 62 32 33 22 5 10 3 4 3 2 1 0
24 136 73 61 22 20 21 4 10 5 5 1 2 0
25 172 92 63 56 33 7 11 4 5 5 7 2 4
26 132 129 98 71 34 27 16 13 7 6 2 4 1
27 129 132 118 70 48 31 24 14 16 8 7 2 2
28 93 93 96 90 57 45 27 19 16 9 10 7 2
29 68 91 94 82 65 48 36 19 13 13 7 7 5
30 59 77 67 69 72 50 47 21 26 15 13 8 4
31 34 39 52 57 67 62 37 32 19 9 10 6 5
32 38 33 43 32 47 44 47 36 21 20 18 10 8
33 27 28 24 30 39 34 29 32 22 15 13 14 11
34 21 22 18 23 26 41 25 32 22 22 22 15 11
35 21 22 19 23 27 21 23 21 23 26 32 15 12
36 9 12 12 19 16 24 29 25 25 25 29 25 17
37 11 15 11 15 17 15 12 21 24 21 15 19 17
38 8 10 8 12 15 14 13 13 10 12 20 19 12
39 7 3 8 8 13 10 12 13 12 18 14 20 22
40 5 6 4 2 7 14 13 13 11 18 17 12 7
41 3 2 3 3 8 6 6 11 9 8 16 12 14
42 1 5 10 8 5 5 9 7 8 10 20 13 11
43 2 3 7 6 3 4 4 6 11 6 10 14 14
44 3 1 4 6 7 5 8 3 13 7 9 7 9
45-49 3 7 9 13 9 6 19 12 14 27 17 35 35
50-54 4 3 2 2 4 4 2 1 4 5 10 12 13
55-59 1 3 0 1 2 0 1 1 1 1 0 1 7
60-64 0 0 0 0 0 0 1 0 0 0 1 2 1
65 and over 0 0 0 0 0 0 0 0 0 1 1 1 1
Table R3b. Marriages by age of groom and bride: Utah, 2007
Utah's Vital Statistics: Marriages and Divorces, 2007 R-5
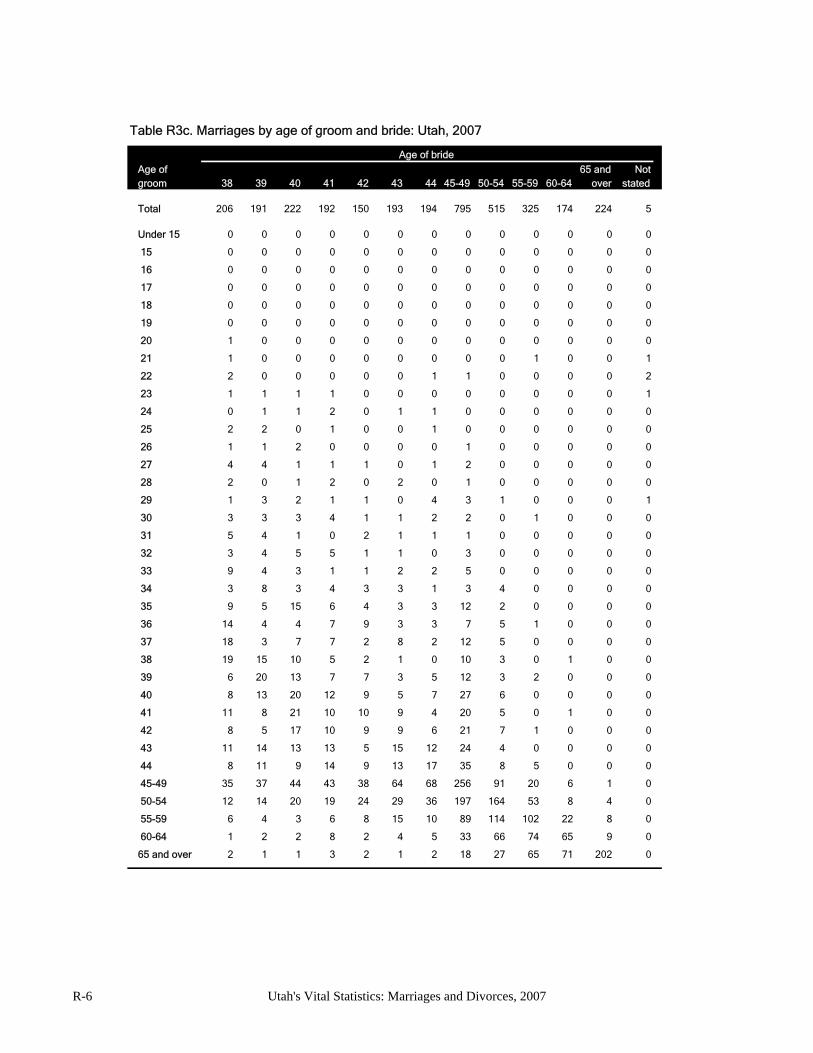
Age of bride
Age of 65 and Notgroom 38 39 40 41 42 43 44 45-49 50-54 55-59 60-64 over stated
Total 206 191 222 192 150 193 194 795 515 325 174 224 5
Under 15 0 0 0 0 0 0 0 0 0 0 0 0 0
15 0 0 0 0 0 0 0 0 0 0 0 0 0
16 0 0 0 0 0 0 0 0 0 0 0 0 0
17 0 0 0 0 0 0 0 0 0 0 0 0 0
18 0 0 0 0 0 0 0 0 0 0 0 0 0
19 0 0 0 0 0 0 0 0 0 0 0 0 0
20 1 0 0 0 0 0 0 0 0 0 0 0 0
21 1 0 0 0 0 0 0 0 0 1 0 0 1
22 2 0 0 0 0 0 1 1 0 0 0 0 2
23 1 1 1 1 0 0 0 0 0 0 0 0 1
24 0 1 1 2 0 1 1 0 0 0 0 0 0
25 2 2 0 1 0 0 1 0 0 0 0 0 0
26 1 1 2 0 0 0 0 1 0 0 0 0 0
27 4 4 1 1 1 0 1 2 0 0 0 0 0
28 2 0 1 2 0 2 0 1 0 0 0 0 0
29 1 3 2 1 1 0 4 3 1 0 0 0 1
30 3 3 3 4 1 1 2 2 0 1 0 0 0
31 5 4 1 0 2 1 1 1 0 0 0 0 0
32 3 4 5 5 1 1 0 3 0 0 0 0 0
33 9 4 3 1 1 2 2 5 0 0 0 0 0
34 3 8 3 4 3 3 1 3 4 0 0 0 0
35 9 5 15 6 4 3 3 12 2 0 0 0 0
36 14 4 4 7 9 3 3 7 5 1 0 0 0
37 18 3 7 7 2 8 2 12 5 0 0 0 0
38 19 15 10 5 2 1 0 10 3 0 1 0 0
39 6 20 13 7 7 3 5 12 3 2 0 0 0
40 8 13 20 12 9 5 7 27 6 0 0 0 0
41 11 8 21 10 10 9 4 20 5 0 1 0 0
42 8 5 17 10 9 9 6 21 7 1 0 0 0
43 11 14 13 13 5 15 12 24 4 0 0 0 0
44 8 11 9 14 9 13 17 35 8 5 0 0 0
45-49 35 37 44 43 38 64 68 256 91 20 6 1 0
50-54 12 14 20 19 24 29 36 197 164 53 8 4 0
55-59 6 4 3 6 8 15 10 89 114 102 22 8 0
60-64 1 2 2 8 2 4 5 33 66 74 65 9 0
65 and over 2 1 1 3 2 1 2 18 27 65 71 202 0
Table R3c. Marriages by age of groom and bride: Utah, 2007
R-6 Utah's Vital Statistics: Marriages and Divorces, 2007
Age of bride
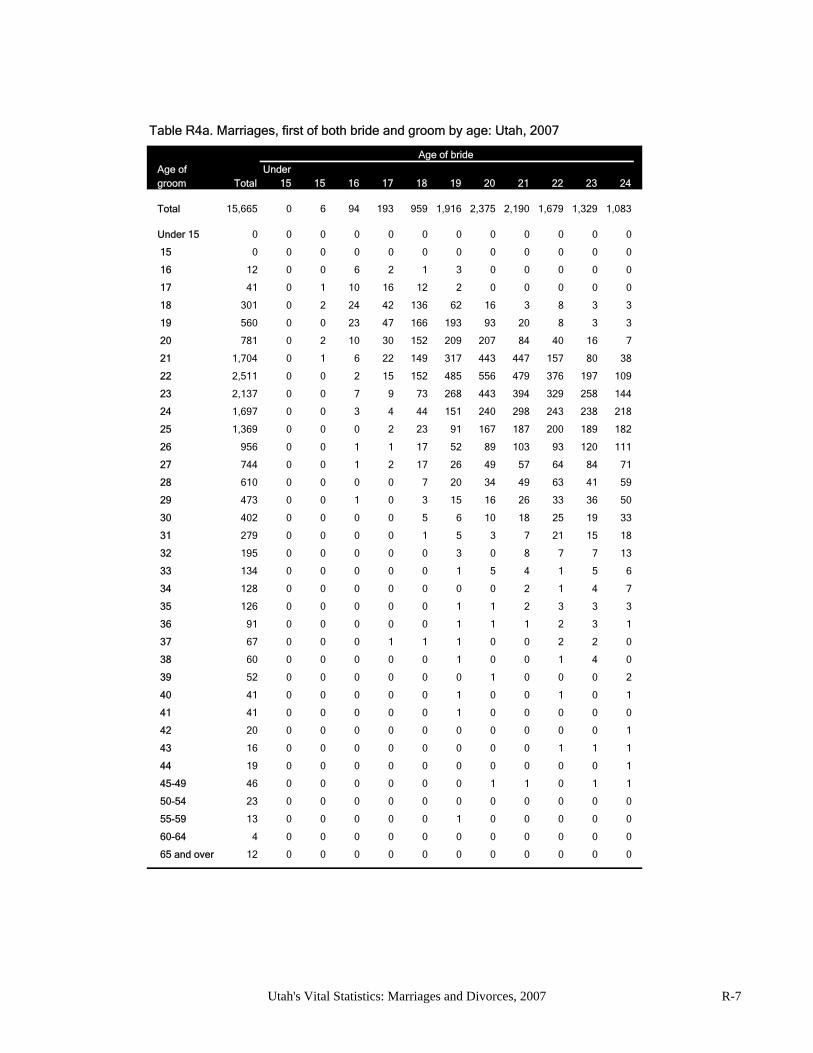
Age of Undergroom Total 15 15 16 17 18 19 20 21 22 23 24
Total 15,665 0 6 94 193 959 1,916 2,375 2,190 1,679 1,329 1,083
Under 15 0 0 0 0 0 0 0 0 0 0 0 0
15 0 0 0 0 0 0 0 0 0 0 0 0
16 12 0 0 6 2 1 3 0 0 0 0 0
17 41 0 1 10 16 12 2 0 0 0 0 0
18 301 0 2 24 42 136 62 16 3 8 3 3
19 560 0 0 23 47 166 193 93 20 8 3 3
20 781 0 2 10 30 152 209 207 84 40 16 7
21 1,704 0 1 6 22 149 317 443 447 157 80 38
22 2,511 0 0 2 15 152 485 556 479 376 197 109
23 2,137 0 0 7 9 73 268 443 394 329 258 144
24 1,697 0 0 3 4 44 151 240 298 243 238 218
25 1,369 0 0 0 2 23 91 167 187 200 189 182
26 956 0 0 1 1 17 52 89 103 93 120 111
27 744 0 0 1 2 17 26 49 57 64 84 71
28 610 0 0 0 0 7 20 34 49 63 41 59
29 473 0 0 1 0 3 15 16 26 33 36 50
30 402 0 0 0 0 5 6 10 18 25 19 33
31 279 0 0 0 0 1 5 3 7 21 15 18
32 195 0 0 0 0 0 3 0 8 7 7 13
33 134 0 0 0 0 0 1 5 4 1 5 6
34 128 0 0 0 0 0 0 0 2 1 4 7
35 126 0 0 0 0 0 1 1 2 3 3 3
36 91 0 0 0 0 0 1 1 1 2 3 1
37 67 0 0 0 1 1 1 0 0 2 2 0
38 60 0 0 0 0 0 1 0 0 1 4 0
39 52 0 0 0 0 0 0 1 0 0 0 2
40 41 0 0 0 0 0 1 0 0 1 0 1
41 41 0 0 0 0 0 1 0 0 0 0 0
42 20 0 0 0 0 0 0 0 0 0 0 1
43 16 0 0 0 0 0 0 0 0 1 1 1
44 19 0 0 0 0 0 0 0 0 0 0 1
45-49 46 0 0 0 0 0 0 1 1 0 1 1
50-54 23 0 0 0 0 0 0 0 0 0 0 0
55-59 13 0 0 0 0 0 1 0 0 0 0 0
60-64 4 0 0 0 0 0 0 0 0 0 0 0
65 and over 12 0 0 0 0 0 0 0 0 0 0 0
Table R4a. Marriages, first of both bride and groom by age: Utah, 2007
Utah's Vital Statistics: Marriages and Divorces, 2007 R-7
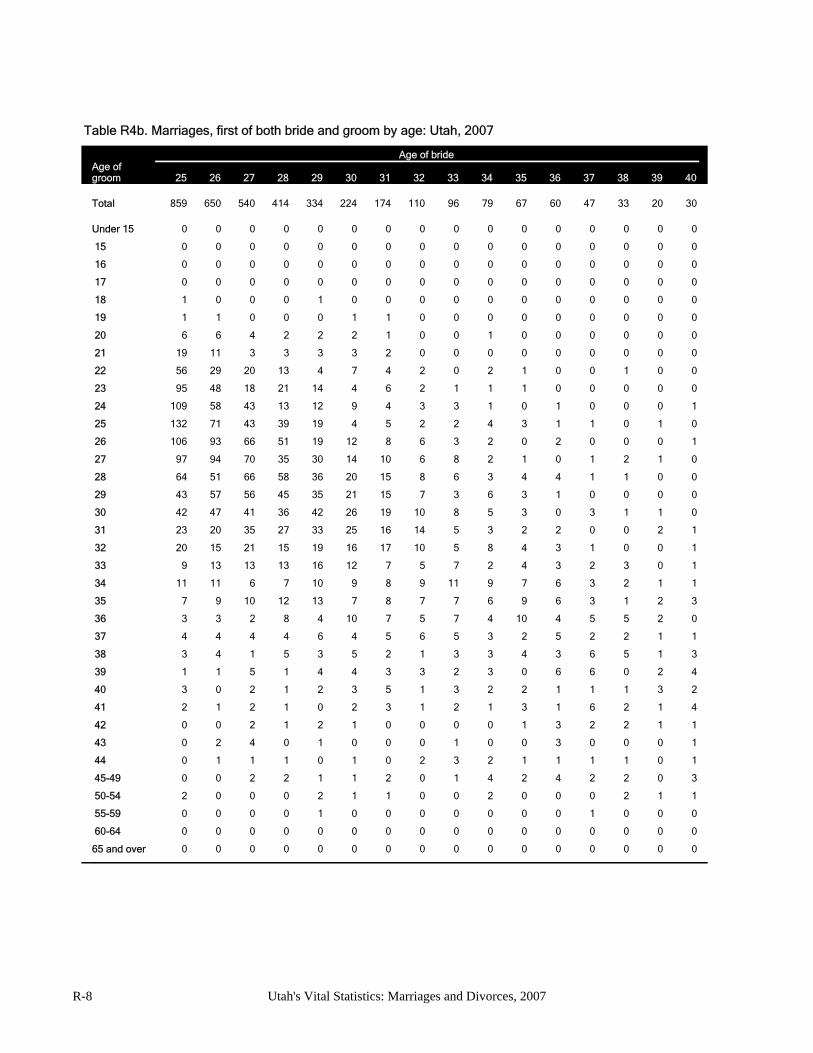
Age of brideAge ofgroom 25 26 27 28 29 30 31 32 33 34 35 36 37 38 39 40
Total 859 650 540 414 334 224 174 110 96 79 67 60 47 33 20 30
Under 15 0 0 0 0 0 0 0 0 0 0 0 0 0 0 0 0
15 0 0 0 0 0 0 0 0 0 0 0 0 0 0 0 0
16 0 0 0 0 0 0 0 0 0 0 0 0 0 0 0 0
17 0 0 0 0 0 0 0 0 0 0 0 0 0 0 0 0
18 1 0 0 0 1 0 0 0 0 0 0 0 0 0 0 0
19 1 1 0 0 0 1 1 0 0 0 0 0 0 0 0 0
20 6 6 4 2 2 2 1 0 0 1 0 0 0 0 0 0
21 19 11 3 3 3 3 2 0 0 0 0 0 0 0 0 0
22 56 29 20 13 4 7 4 2 0 2 1 0 0 1 0 0
23 95 48 18 21 14 4 6 2 1 1 1 0 0 0 0 0
24 109 58 43 13 12 9 4 3 3 1 0 1 0 0 0 1
25 132 71 43 39 19 4 5 2 2 4 3 1 1 0 1 0
26 106 93 66 51 19 12 8 6 3 2 0 2 0 0 0 1
27 97 94 70 35 30 14 10 6 8 2 1 0 1 2 1 0
28 64 51 66 58 36 20 15 8 6 3 4 4 1 1 0 0
29 43 57 56 45 35 21 15 7 3 6 3 1 0 0 0 0
30 42 47 41 36 42 26 19 10 8 5 3 0 3 1 1 0
31 23 20 35 27 33 25 16 14 5 3 2 2 0 0 2 1
32 20 15 21 15 19 16 17 10 5 8 4 3 1 0 0 1
33 9 13 13 13 16 12 7 5 7 2 4 3 2 3 0 1
34 11 11 6 7 10 9 8 9 11 9 7 6 3 2 1 1
35 7 9 10 12 13 7 8 7 7 6 9 6 3 1 2 3
36 3 3 2 8 4 10 7 5 7 4 10 4 5 5 2 0
37 4 4 4 4 6 4 5 6 5 3 2 5 2 2 1 1
38 3 4 1 5 3 5 2 1 3 3 4 3 6 5 1 3
39 1 1 5 1 4 4 3 3 2 3 0 6 6 0 2 4
40 3 0 2 1 2 3 5 1 3 2 2 1 1 1 3 2
41 2 1 2 1 0 2 3 1 2 1 3 1 6 2 1 4
42 0 0 2 1 2 1 0 0 0 0 1 3 2 2 1 1
43 0 2 4 0 1 0 0 0 1 0 0 3 0 0 0 1
44 0 1 1 1 0 1 0 2 3 2 1 1 1 1 0 1
45-49 0 0 2 2 1 1 2 0 1 4 2 4 2 2 0 3
50-54 2 0 0 0 2 1 1 0 0 2 0 0 0 2 1 1
55-59 0 0 0 0 1 0 0 0 0 0 0 0 1 0 0 0
60-64 0 0 0 0 0 0 0 0 0 0 0 0 0 0 0 0
65 and over 0 0 0 0 0 0 0 0 0 0 0 0 0 0 0 0
Table R4b. Marriages, first of both bride and groom by age: Utah, 2007
R-8 Utah's Vital Statistics: Marriages and Divorces, 2007
Age of bride
Age of 65 and Notgroom 41 42 43 44 45-49 50-54 55-59 60-64 over stated
Total 16 16 7 6 24 16 10 3 6 0
Under 15 0 0 0 0 0 0 0 0 0 0
15 0 0 0 0 0 0 0 0 0 0
16 0 0 0 0 0 0 0 0 0 0
17 0 0 0 0 0 0 0 0 0 0
18 0 0 0 0 0 0 0 0 0 0
19 0 0 0 0 0 0 0 0 0 0
20 0 0 0 0 0 0 0 0 0 0
21 0 0 0 0 0 0 0 0 0 0
22 0 0 0 0 0 0 0 0 1 0
23 0 0 0 0 0 0 0 0 1 0
24 0 0 1 0 0 0 0 0 0 0
25 1 0 0 0 0 0 0 0 0 0
26 0 0 0 0 0 0 0 0 0 0
27 0 1 0 0 1 0 0 0 0 0
28 0 0 0 0 0 0 0 0 0 0
29 0 1 0 0 0 0 0 0 0 0
30 1 0 0 0 1 0 0 0 0 0
31 0 0 0 0 1 0 0 0 0 0
32 1 1 0 0 0 0 0 0 0 0
33 0 0 0 0 2 0 0 0 0 0
34 1 1 0 0 1 0 0 0 0 0
35 1 1 0 0 0 1 0 0 0 0
36 1 1 1 0 0 0 0 0 0 0
37 1 0 1 0 0 0 0 0 0 0
38 1 0 0 0 1 0 0 0 0 0
39 2 1 0 1 0 0 0 0 0 0
40 0 1 0 2 3 0 0 0 0 0
41 3 2 0 0 3 0 0 0 0 0
42 0 2 0 0 1 0 0 0 0 0
43 0 0 0 0 0 1 0 0 0 0
44 0 0 0 1 1 0 0 0 0 0
45-49 3 1 2 2 3 3 2 0 0 0
50-54 0 2 0 0 3 6 0 0 0 0
55-59 0 1 2 0 3 2 2 0 0 0
60-64 0 0 0 0 0 0 3 1 0 0
65 and over 0 0 0 0 0 3 3 2 4 0
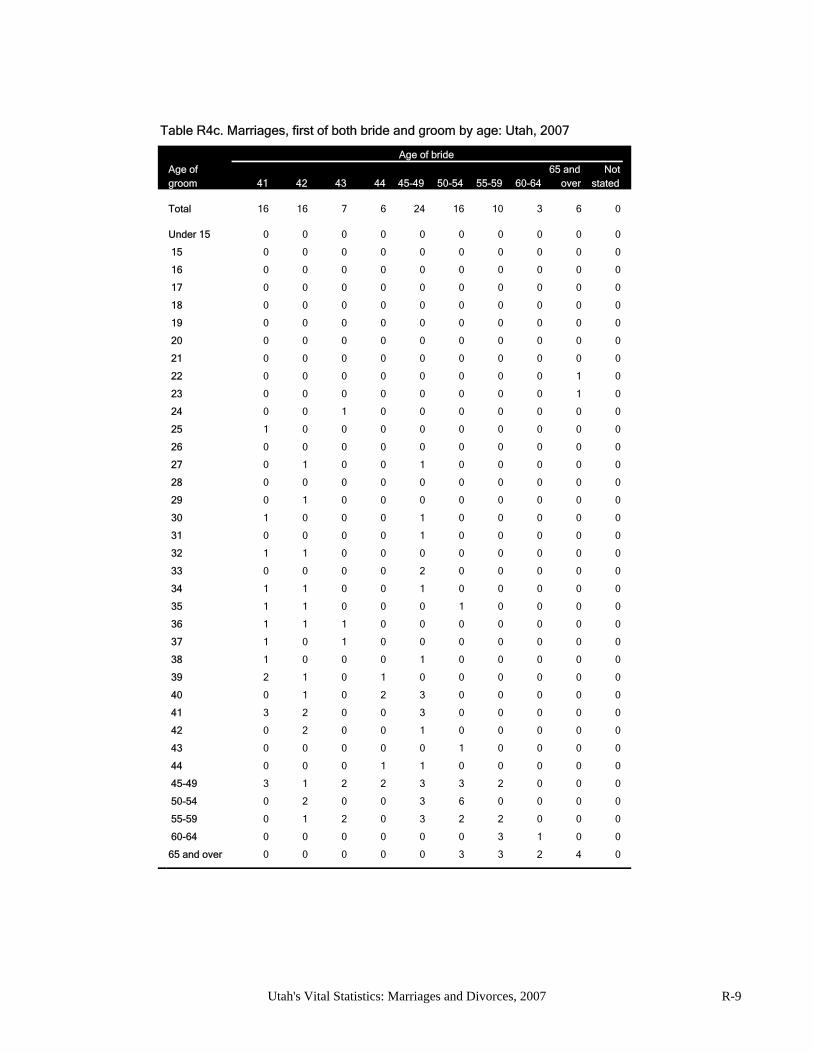
Table R4c. Marriages, first of both bride and groom by age: Utah, 2007
Utah's Vital Statistics: Marriages and Divorces, 2007 R-9
State Bride Groom State Bride Groom
Total 24,052 24,052 Nebraska 13 12Nevada 129 155
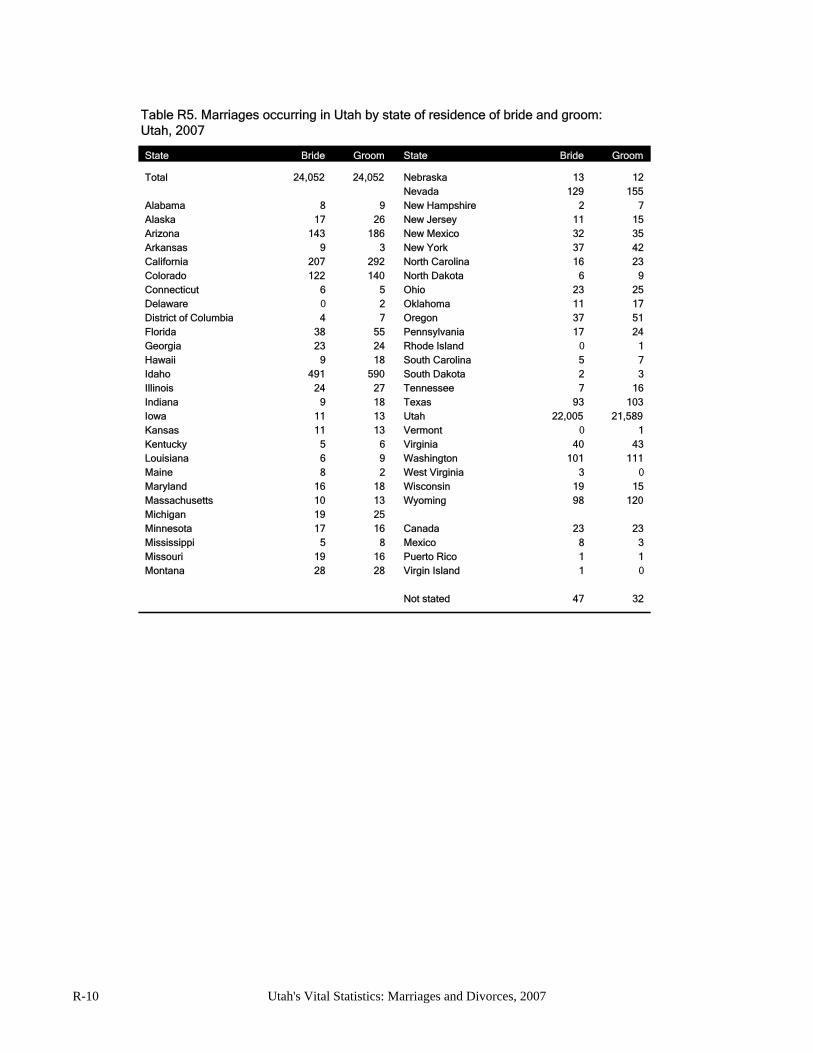
Alabama 8 9 New Hampshire 2 7Alaska 17 26 New Jersey 11 15Arizona 143 186 New Mexico 32 35Arkansas 9 3 New York 37 42California 207 292 North Carolina 16 23Colorado 122 140 North Dakota 6 9Connecticut 6 5 Ohio 23 25Delaware 0 2 Oklahoma 11 17District of Columbia 4 7 Oregon 37 51Florida 38 55 Pennsylvania 17 24Georgia 23 24 Rhode Island 0 1Hawaii 9 18 South Carolina 5 7Idaho 491 590 South Dakota 2 3Illinois 24 27 Tennessee 7 16Indiana 9 18 Texas 93 103Iowa 11 13 Utah 22,005 21,589Kansas 11 13 Vermont 0 1Kentucky 5 6 Virginia 40 43Louisiana 6 9 Washington 101 111Maine 8 2 West Virginia 3 0Maryland 16 18 Wisconsin 19 15Massachusetts 10 13 Wyoming 98 120Michigan 19 25Minnesota 17 16 Canada 23 23Mississippi 5 8 Mexico 8 3Missouri 19 16 Puerto Rico 1 1Montana 28 28 Virgin Island 1 0
Not stated 47 32
Table R5. Marriages occurring in Utah by state of residence of bride and groom: Utah, 2007
R-10 Utah's Vital Statistics: Marriages and Divorces, 2007
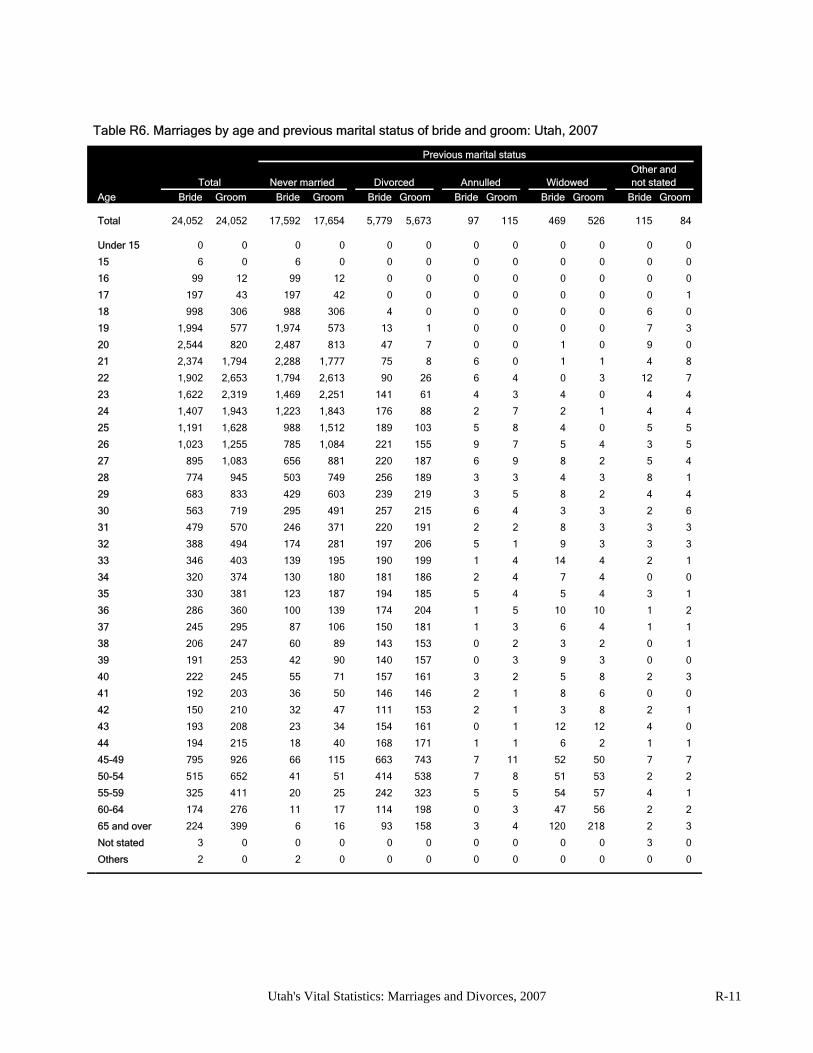
Previous marital status
Other andTotal Never married Divorced Annulled Widowed not stated
Age Bride Groom Bride Groom Bride Groom Bride Groom Bride Groom Bride Groom
Total 24,052 24,052 17,592 17,654 5,779 5,673 97 115 469 526 115 84
Under 15 0 0 0 0 0 0 0 0 0 0 0 0
15 6 0 6 0 0 0 0 0 0 0 0 0
16 99 12 99 12 0 0 0 0 0 0 0 0
17 197 43 197 42 0 0 0 0 0 0 0 1
18 998 306 988 306 4 0 0 0 0 0 6 0
19 1,994 577 1,974 573 13 1 0 0 0 0 7 3
20 2,544 820 2,487 813 47 7 0 0 1 0 9 0
21 2,374 1,794 2,288 1,777 75 8 6 0 1 1 4 8
22 1,902 2,653 1,794 2,613 90 26 6 4 0 3 12 7
23 1,622 2,319 1,469 2,251 141 61 4 3 4 0 4 4
24 1,407 1,943 1,223 1,843 176 88 2 7 2 1 4 4
25 1,191 1,628 988 1,512 189 103 5 8 4 0 5 5
26 1,023 1,255 785 1,084 221 155 9 7 5 4 3 5
27 895 1,083 656 881 220 187 6 9 8 2 5 4
28 774 945 503 749 256 189 3 3 4 3 8 1
29 683 833 429 603 239 219 3 5 8 2 4 4
30 563 719 295 491 257 215 6 4 3 3 2 6
31 479 570 246 371 220 191 2 2 8 3 3 3
32 388 494 174 281 197 206 5 1 9 3 3 3
33 346 403 139 195 190 199 1 4 14 4 2 1
34 320 374 130 180 181 186 2 4 7 4 0 0
35 330 381 123 187 194 185 5 4 5 4 3 1
36 286 360 100 139 174 204 1 5 10 10 1 2
37 245 295 87 106 150 181 1 3 6 4 1 1
38 206 247 60 89 143 153 0 2 3 2 0 1
39 191 253 42 90 140 157 0 3 9 3 0 0
40 222 245 55 71 157 161 3 2 5 8 2 3
41 192 203 36 50 146 146 2 1 8 6 0 0
42 150 210 32 47 111 153 2 1 3 8 2 1
43 193 208 23 34 154 161 0 1 12 12 4 0
44 194 215 18 40 168 171 1 1 6 2 1 1
45-49 795 926 66 115 663 743 7 11 52 50 7 7
50-54 515 652 41 51 414 538 7 8 51 53 2 2
55-59 325 411 20 25 242 323 5 5 54 57 4 1
60-64 174 276 11 17 114 198 0 3 47 56 2 2
65 and over 224 399 6 16 93 158 3 4 120 218 2 3
Not stated 3 0 0 0 0 0 0 0 0 0 3 0
Others 2 0 2 0 0 0 0 0 0 0 0 0
Table R6. Marriages by age and previous marital status of bride and groom: Utah, 2007
Utah's Vital Statistics: Marriages and Divorces, 2007 R-11
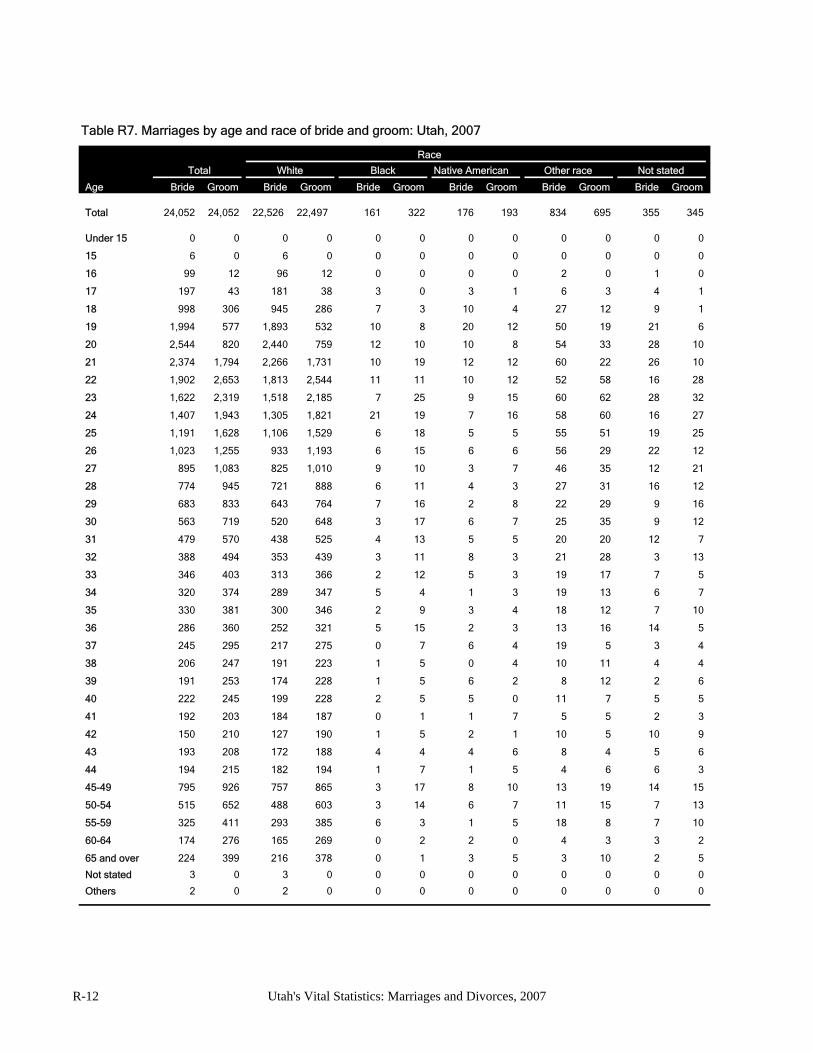
Race
Total White Black Native American Other race Not stated
Age Bride Groom Bride Groom Bride Groom Bride Groom Bride Groom Bride Groom
Total 24,052 24,052 22,526 22,497 161 322 176 193 834 695 355 345
Under 15 0 0 0 0 0 0 0 0 0 0 0 0
15 6 0 6 0 0 0 0 0 0 0 0 0
16 99 12 96 12 0 0 0 0 2 0 1 0
17 197 43 181 38 3 0 3 1 6 3 4 1
18 998 306 945 286 7 3 10 4 27 12 9 1
19 1,994 577 1,893 532 10 8 20 12 50 19 21 6
20 2,544 820 2,440 759 12 10 10 8 54 33 28 10
21 2,374 1,794 2,266 1,731 10 19 12 12 60 22 26 10
22 1,902 2,653 1,813 2,544 11 11 10 12 52 58 16 28
23 1,622 2,319 1,518 2,185 7 25 9 15 60 62 28 32
24 1,407 1,943 1,305 1,821 21 19 7 16 58 60 16 27
25 1,191 1,628 1,106 1,529 6 18 5 5 55 51 19 25
26 1,023 1,255 933 1,193 6 15 6 6 56 29 22 12
27 895 1,083 825 1,010 9 10 3 7 46 35 12 21
28 774 945 721 888 6 11 4 3 27 31 16 12
29 683 833 643 764 7 16 2 8 22 29 9 16
30 563 719 520 648 3 17 6 7 25 35 9 12
31 479 570 438 525 4 13 5 5 20 20 12 7
32 388 494 353 439 3 11 8 3 21 28 3 13
33 346 403 313 366 2 12 5 3 19 17 7 5
34 320 374 289 347 5 4 1 3 19 13 6 7
35 330 381 300 346 2 9 3 4 18 12 7 10
36 286 360 252 321 5 15 2 3 13 16 14 5
37 245 295 217 275 0 7 6 4 19 5 3 4
38 206 247 191 223 1 5 0 4 10 11 4 4
39 191 253 174 228 1 5 6 2 8 12 2 6
40 222 245 199 228 2 5 5 0 11 7 5 5
41 192 203 184 187 0 1 1 7 5 5 2 3
42 150 210 127 190 1 5 2 1 10 5 10 9
43 193 208 172 188 4 4 4 6 8 4 5 6
44 194 215 182 194 1 7 1 5 4 6 6 3
45-49 795 926 757 865 3 17 8 10 13 19 14 15
50-54 515 652 488 603 3 14 6 7 11 15 7 13
55-59 325 411 293 385 6 3 1 5 18 8 7 10
60-64 174 276 165 269 0 2 2 0 4 3 3 2
65 and over 224 399 216 378 0 1 3 5 3 10 2 5
Not stated 3 0 3 0 0 0 0 0 0 0 0 0
Others 2 0 2 0 0 0 0 0 0 0 0 0
Table R7. Marriages by age and race of bride and groom: Utah, 2007
R-12 Utah's Vital Statistics: Marriages and Divorces, 2007
Race of bride
Native Other Not
Race of groom Total White Black American race stated
Total 24,052 22,526 161 176 834 355
White 22,497 21,686 77 113 456 165
Black 322 221 77 2 16 6
Native American 193 131 1 56 5 0
Other race 695 325 5 3 354 8
Not stated 345 163 1 2 3 176
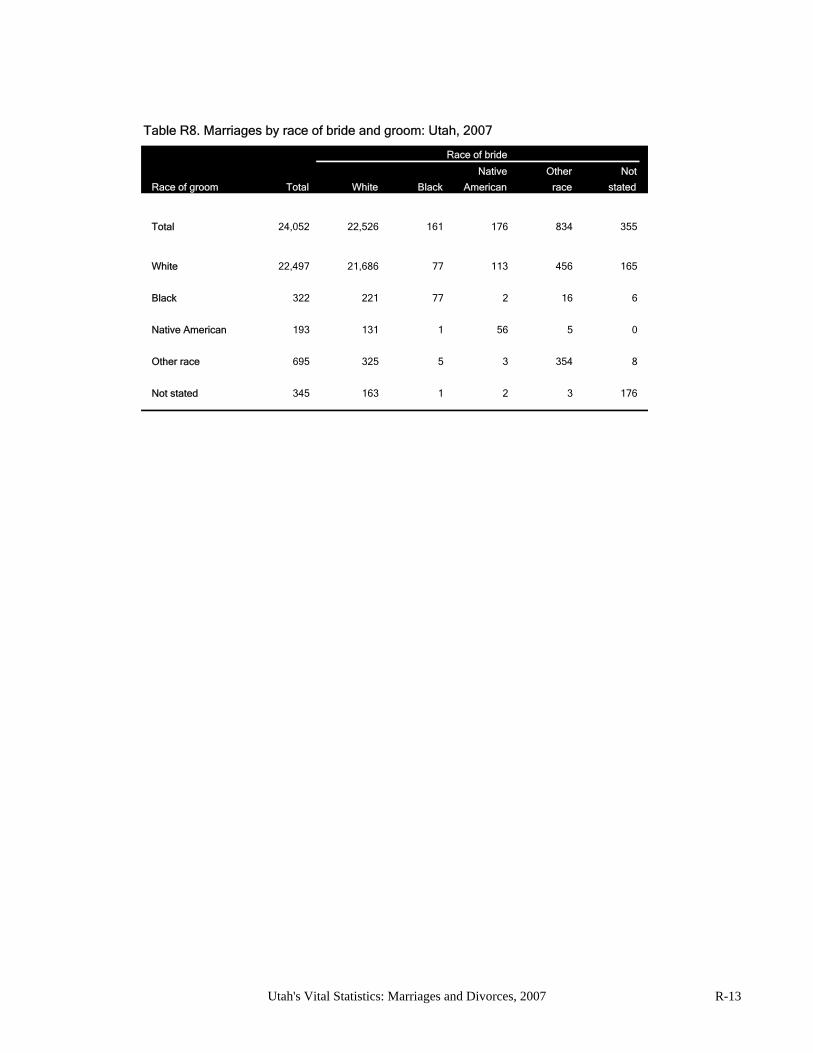
Table R8. Marriages by race of bride and groom: Utah, 2007
Utah's Vital Statistics: Marriages and Divorces, 2007 R-13
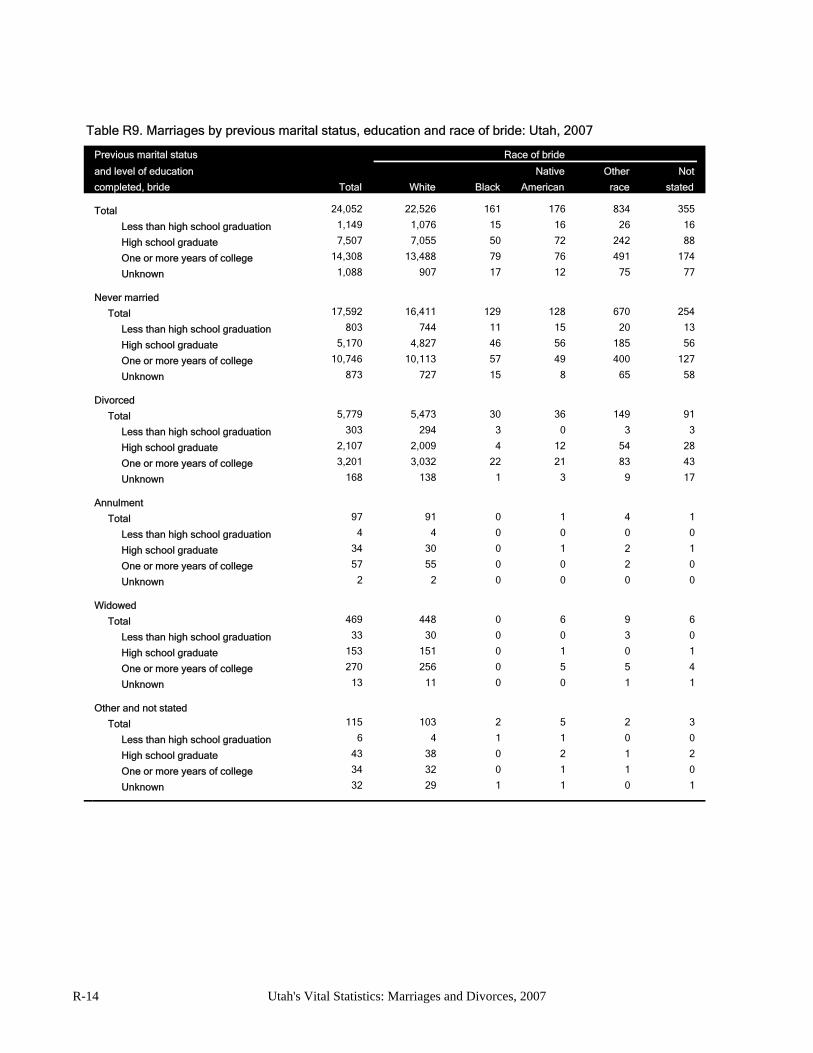
Previous marital status Race of bride
and level of education Native Other Not
completed, bride Total White Black American race stated
Total 24,052 22,526 161 176 834 355
Less than high school graduation 1,149 1,076 15 16 26 16
High school graduate 7,507 7,055 50 72 242 88
One or more years of college 14,308 13,488 79 76 491 174
Unknown 1,088 907 17 12 75 77
Never married
Total 17,592 16,411 129 128 670 254
Less than high school graduation 803 744 11 15 20 13
High school graduate 5,170 4,827 46 56 185 56
One or more years of college 10,746 10,113 57 49 400 127
Unknown 873 727 15 8 65 58
Divorced
Total 5,779 5,473 30 36 149 91
Less than high school graduation 303 294 3 0 3 3
High school graduate 2,107 2,009 4 12 54 28
One or more years of college 3,201 3,032 22 21 83 43
Unknown 168 138 1 3 9 17
Annulment
Total 97 91 0 1 4 1
Less than high school graduation 4 4 0 0 0 0
High school graduate 34 30 0 1 2 1
One or more years of college 57 55 0 0 2 0
Unknown 2 2 0 0 0 0
Widowed
Total 469 448 0 6 9 6
Less than high school graduation 33 30 0 0 3 0
High school graduate 153 151 0 1 0 1
One or more years of college 270 256 0 5 5 4
Unknown 13 11 0 0 1 1
Other and not stated
Total 115 103 2 5 2 3
Less than high school graduation 6 4 1 1 0 0
High school graduate 43 38 0 2 1 2
One or more years of college 34 32 0 1 1 0
Unknown 32 29 1 1 0 1
Table R9. Marriages by previous marital status, education and race of bride: Utah, 2007
R-14 Utah's Vital Statistics: Marriages and Divorces, 2007
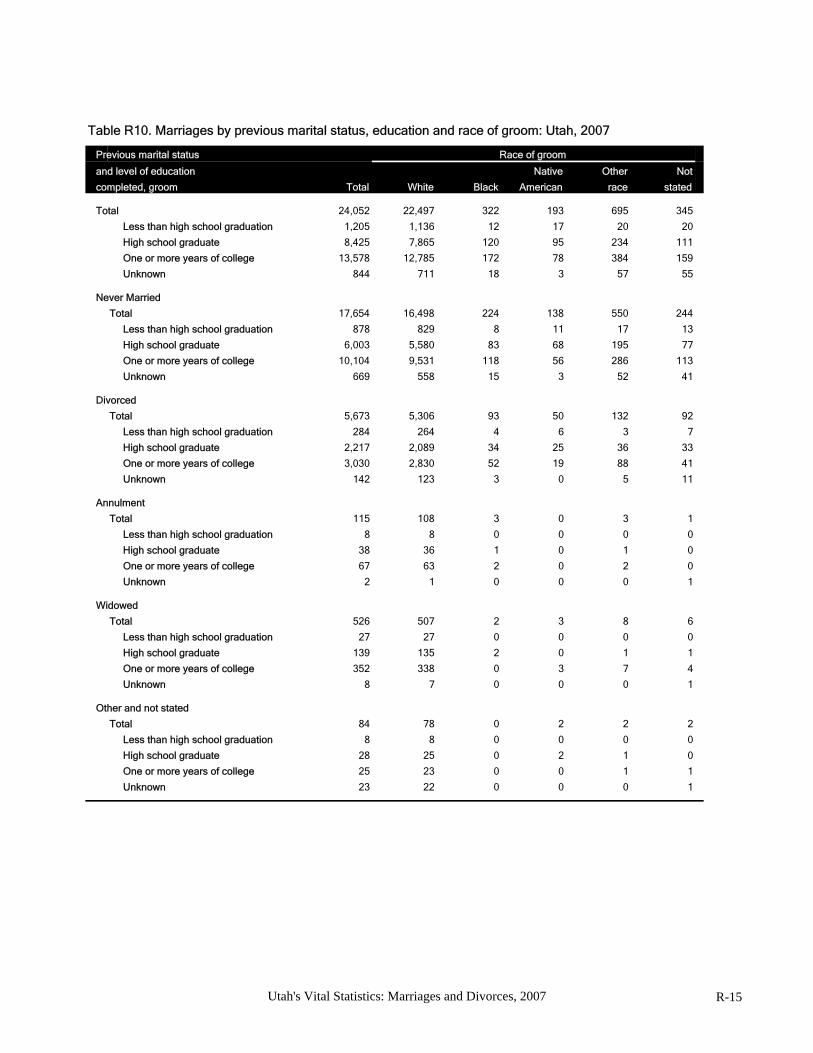
Previous marital status Race of groom
and level of education Native Other Not
completed, groom Total White Black American race stated
Total 24,052 22,497 322 193 695 345
Less than high school graduation 1,205 1,136 12 17 20 20
High school graduate 8,425 7,865 120 95 234 111
One or more years of college 13,578 12,785 172 78 384 159
Unknown 844 711 18 3 57 55
Never Married
Total 17,654 16,498 224 138 550 244
Less than high school graduation 878 829 8 11 17 13
High school graduate 6,003 5,580 83 68 195 77
One or more years of college 10,104 9,531 118 56 286 113
Unknown 669 558 15 3 52 41
Divorced
Total 5,673 5,306 93 50 132 92
Less than high school graduation 284 264 4 6 3 7
High school graduate 2,217 2,089 34 25 36 33
One or more years of college 3,030 2,830 52 19 88 41
Unknown 142 123 3 0 5 11
Annulment
Total 115 108 3 0 3 1
Less than high school graduation 8 8 0 0 0 0
High school graduate 38 36 1 0 1 0
One or more years of college 67 63 2 0 2 0
Unknown 2 1 0 0 0 1
Widowed
Total 526 507 2 3 8 6
Less than high school graduation 27 27 0 0 0 0
High school graduate 139 135 2 0 1 1
One or more years of college 352 338 0 3 7 4
Unknown 8 7 0 0 0 1
Other and not stated
Total 84 78 0 2 2 2
Less than high school graduation 8 8 0 0 0 0
High school graduate 28 25 0 2 1 0
One or more years of college 25 23 0 0 1 1
Unknown 23 22 0 0 0 1
Table R10. Marriages by previous marital status, education and race of groom: Utah, 2007
Utah's Vital Statistics: Marriages and Divorces, 2007 R-15
Officiant
Previous marital status To
tal
Ca
tho
lic
Jew
ish
L.D
.S.
Pro
test
an
t
An
y o
the
r re
ligio
n
Re
ligio
n n
ot
sta
ted
Co
un
ty C
lerk
Jud
ge
Just
ice
of
Pe
ace
Civ
il n
ot
sta
ted
Off
icia
nt
no
t st
ate
d
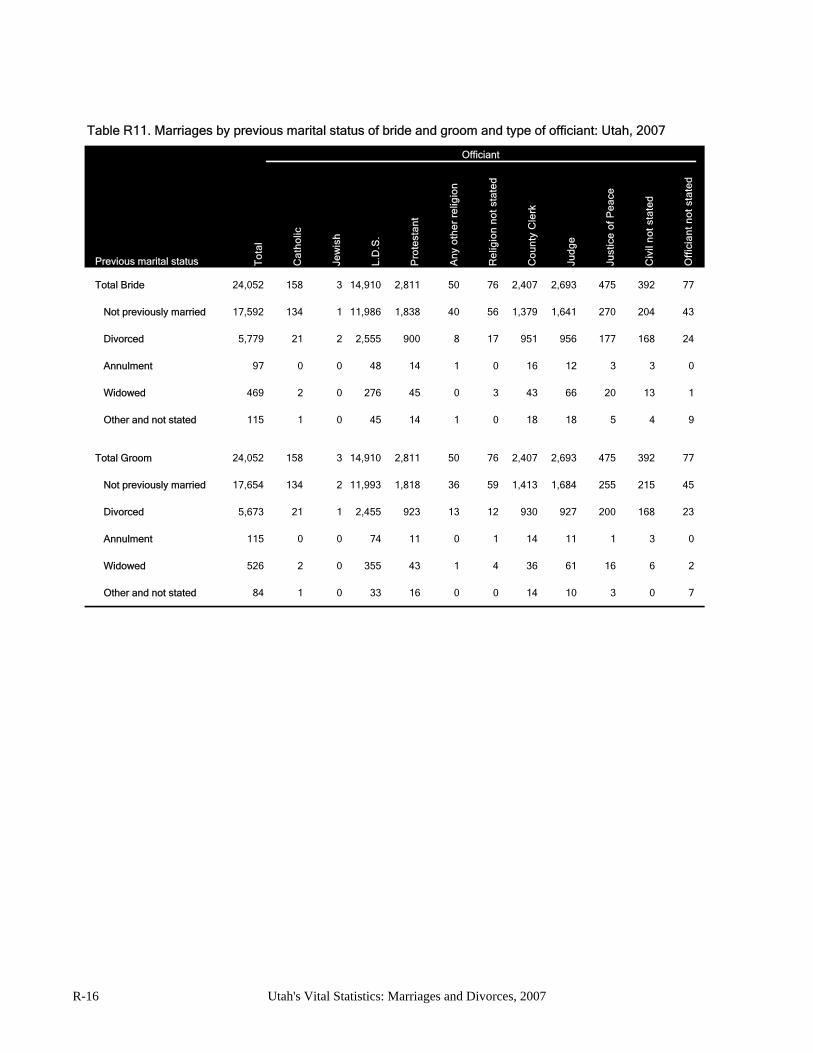
Total Bride 24,052 158 3 14,910 2,811 50 76 2,407 2,693 475 392 77
Not previously married 17,592 134 1 11,986 1,838 40 56 1,379 1,641 270 204 43
Divorced 5,779 21 2 2,555 900 8 17 951 956 177 168 24
Annulment 97 0 0 48 14 1 0 16 12 3 3 0
Widowed 469 2 0 276 45 0 3 43 66 20 13 1
Other and not stated 115 1 0 45 14 1 0 18 18 5 4 9
Total Groom 24,052 158 3 14,910 2,811 50 76 2,407 2,693 475 392 77
Not previously married 17,654 134 2 11,993 1,818 36 59 1,413 1,684 255 215 45
Divorced 5,673 21 1 2,455 923 13 12 930 927 200 168 23
Annulment 115 0 0 74 11 0 1 14 11 1 3 0
Widowed 526 2 0 355 43 1 4 36 61 16 6 2
Other and not stated 84 1 0 33 16 0 0 14 10 3 0 7
Table R11. Marriages by previous marital status of bride and groom and type of officiant: Utah, 2007
R-16 Utah's Vital Statistics: Marriages and Divorces, 2007
Officiant
Residence status To
tal
Ca
tho
lic
Jew
ish
L.D
.S.
Pro
test
an
t
An
y o
the
r re
ligio
n
Re
ligio
n n
ot
sta
ted
Co
un
ty C
lerk
Jud
ge
Just
ice
of
Pe
ace
Civ
il n
ot
sta
ted
Off
icia
nt
no
t st
ate
d
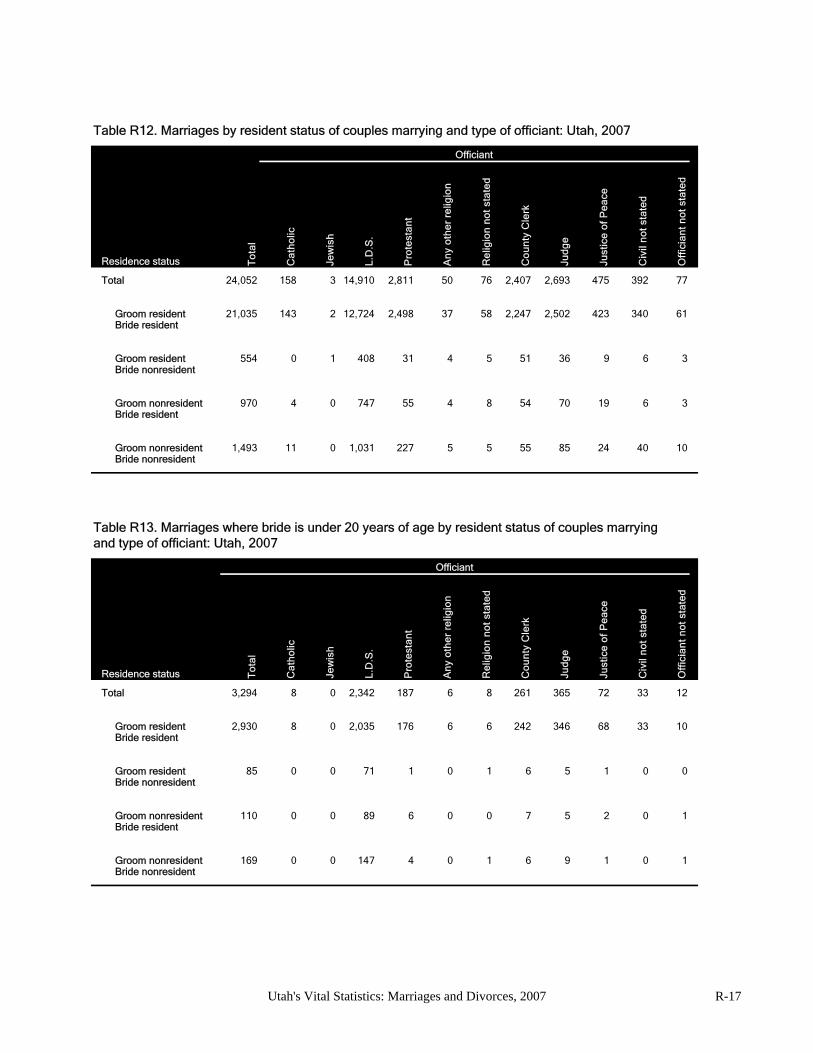
Total 24,052 158 3 14,910 2,811 50 76 2,407 2,693 475 392 77
Groom resident 21,035 143 2 12,724 2,498 37 58 2,247 2,502 423 340 61Bride resident
Groom resident 554 0 1 408 31 4 5 51 36 9 6 3Bride nonresident
Groom nonresident 970 4 0 747 55 4 8 54 70 19 6 3Bride resident
Groom nonresident 1,493 11 0 1,031 227 5 5 55 85 24 40 10Bride nonresident
Officiant
Residence status To
tal
Ca
tho
lic
Jew
ish
L.D
.S.
Pro
test
an
t
An
y o
the
r re
ligio
n
Re
ligio
n n
ot
sta
ted
Co
un
ty C
lerk
Jud
ge
Just
ice
of
Pe
ace
Civ
il n
ot
sta
ted
Off
icia
nt
no
t st
ate
d
Total 3,294 8 0 2,342 187 6 8 261 365 72 33 12
Groom resident 2,930 8 0 2,035 176 6 6 242 346 68 33 10Bride resident
Groom resident 85 0 0 71 1 0 1 6 5 1 0 0Bride nonresident
Groom nonresident 110 0 0 89 6 0 0 7 5 2 0 1Bride resident
Groom nonresident 169 0 0 147 4 0 1 6 9 1 0 1Bride nonresident
Table R13. Marriages where bride is under 20 years of age by resident status of couples marrying and type of officiant: Utah, 2007
Table R12. Marriages by resident status of couples marrying and type of officiant: Utah, 2007
Utah's Vital Statistics: Marriages and Divorces, 2007 R-17
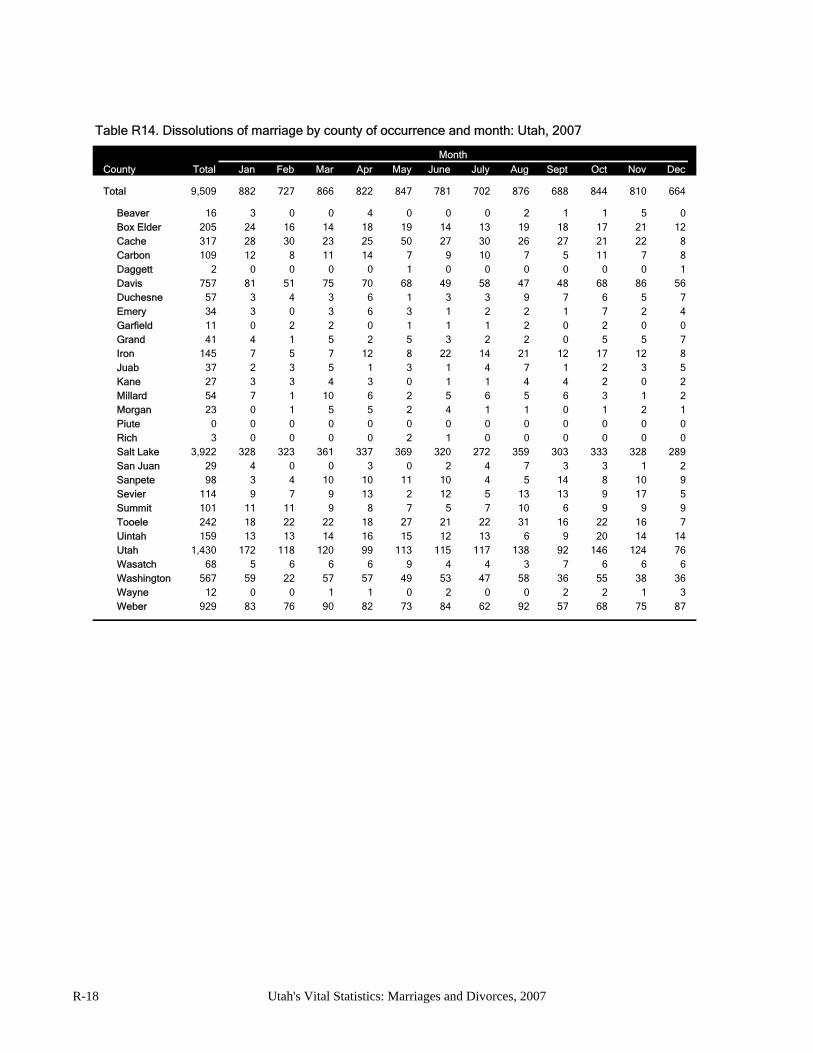
Month
County Total Jan Feb Mar Apr May June July Aug Sept Oct Nov Dec
Total 9,509 882 727 866 822 847 781 702 876 688 844 810 664
Beaver 16 3 0 0 4 0 0 0 2 1 1 5 0Box Elder 205 24 16 14 18 19 14 13 19 18 17 21 12Cache 317 28 30 23 25 50 27 30 26 27 21 22 8Carbon 109 12 8 11 14 7 9 10 7 5 11 7 8Daggett 2 0 0 0 0 1 0 0 0 0 0 0 1Davis 757 81 51 75 70 68 49 58 47 48 68 86 56Duchesne 57 3 4 3 6 1 3 3 9 7 6 5 7Emery 34 3 0 3 6 3 1 2 2 1 7 2 4Garfield 11 0 2 2 0 1 1 1 2 0 2 0 0Grand 41 4 1 5 2 5 3 2 2 0 5 5 7Iron 145 7 5 7 12 8 22 14 21 12 17 12 8Juab 37 2 3 5 1 3 1 4 7 1 2 3 5Kane 27 3 3 4 3 0 1 1 4 4 2 0 2Millard 54 7 1 10 6 2 5 6 5 6 3 1 2Morgan 23 0 1 5 5 2 4 1 1 0 1 2 1Piute 0 0 0 0 0 0 0 0 0 0 0 0 0Rich 3 0 0 0 0 2 1 0 0 0 0 0 0Salt Lake 3,922 328 323 361 337 369 320 272 359 303 333 328 289San Juan 29 4 0 0 3 0 2 4 7 3 3 1 2Sanpete 98 3 4 10 10 11 10 4 5 14 8 10 9Sevier 114 9 7 9 13 2 12 5 13 13 9 17 5Summit 101 11 11 9 8 7 5 7 10 6 9 9 9Tooele 242 18 22 22 18 27 21 22 31 16 22 16 7Uintah 159 13 13 14 16 15 12 13 6 9 20 14 14Utah 1,430 172 118 120 99 113 115 117 138 92 146 124 76Wasatch 68 5 6 6 6 9 4 4 3 7 6 6 6Washington 567 59 22 57 57 49 53 47 58 36 55 38 36Wayne 12 0 0 1 1 0 2 0 0 2 2 1 3Weber 929 83 76 90 82 73 84 62 92 57 68 75 87
Table R14. Dissolutions of marriage by county of occurrence and month: Utah, 2007
R-18 Utah's Vital Statistics: Marriages and Divorces, 2007
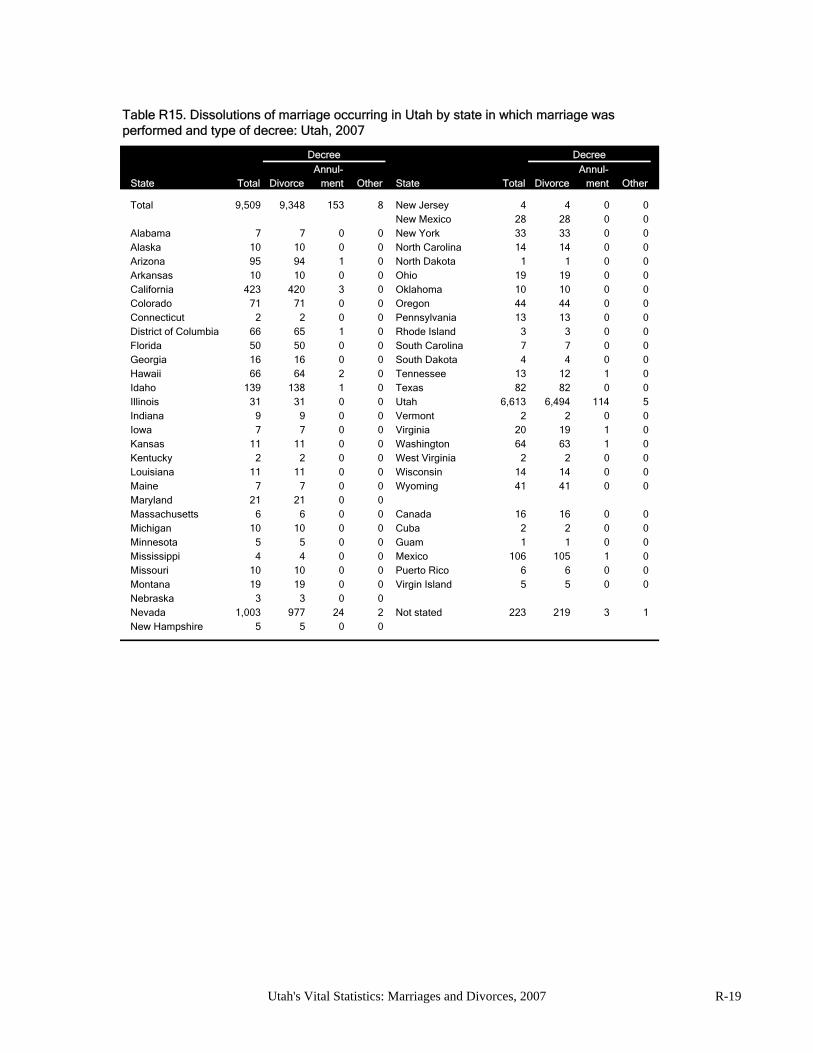
Decree Decree
Annul- Annul-State Total Divorce ment Other State Total Divorce ment Other
Total 9,509 9,348 153 8 New Jersey 4 4 0 0New Mexico 28 28 0 0
Alabama 7 7 0 0 New York 33 33 0 0Alaska 10 10 0 0 North Carolina 14 14 0 0Arizona 95 94 1 0 North Dakota 1 1 0 0Arkansas 10 10 0 0 Ohio 19 19 0 0California 423 420 3 0 Oklahoma 10 10 0 0Colorado 71 71 0 0 Oregon 44 44 0 0Connecticut 2 2 0 0 Pennsylvania 13 13 0 0District of Columbia 66 65 1 0 Rhode Island 3 3 0 0Florida 50 50 0 0 South Carolina 7 7 0 0Georgia 16 16 0 0 South Dakota 4 4 0 0Hawaii 66 64 2 0 Tennessee 13 12 1 0Idaho 139 138 1 0 Texas 82 82 0 0Illinois 31 31 0 0 Utah 6,613 6,494 114 5Indiana 9 9 0 0 Vermont 2 2 0 0Iowa 7 7 0 0 Virginia 20 19 1 0Kansas 11 11 0 0 Washington 64 63 1 0Kentucky 2 2 0 0 West Virginia 2 2 0 0Louisiana 11 11 0 0 Wisconsin 14 14 0 0Maine 7 7 0 0 Wyoming 41 41 0 0Maryland 21 21 0 0Massachusetts 6 6 0 0 Canada 16 16 0 0Michigan 10 10 0 0 Cuba 2 2 0 0Minnesota 5 5 0 0 Guam 1 1 0 0Mississippi 4 4 0 0 Mexico 106 105 1 0Missouri 10 10 0 0 Puerto Rico 6 6 0 0Montana 19 19 0 0 Virgin Island 5 5 0 0Nebraska 3 3 0 0Nevada 1,003 977 24 2 Not stated 223 219 3 1New Hampshire 5 5 0 0
Table R15. Dissolutions of marriage occurring in Utah by state in which marriage was performed and type of decree: Utah, 2007
Utah's Vital Statistics: Marriages and Divorces, 2007 R-19
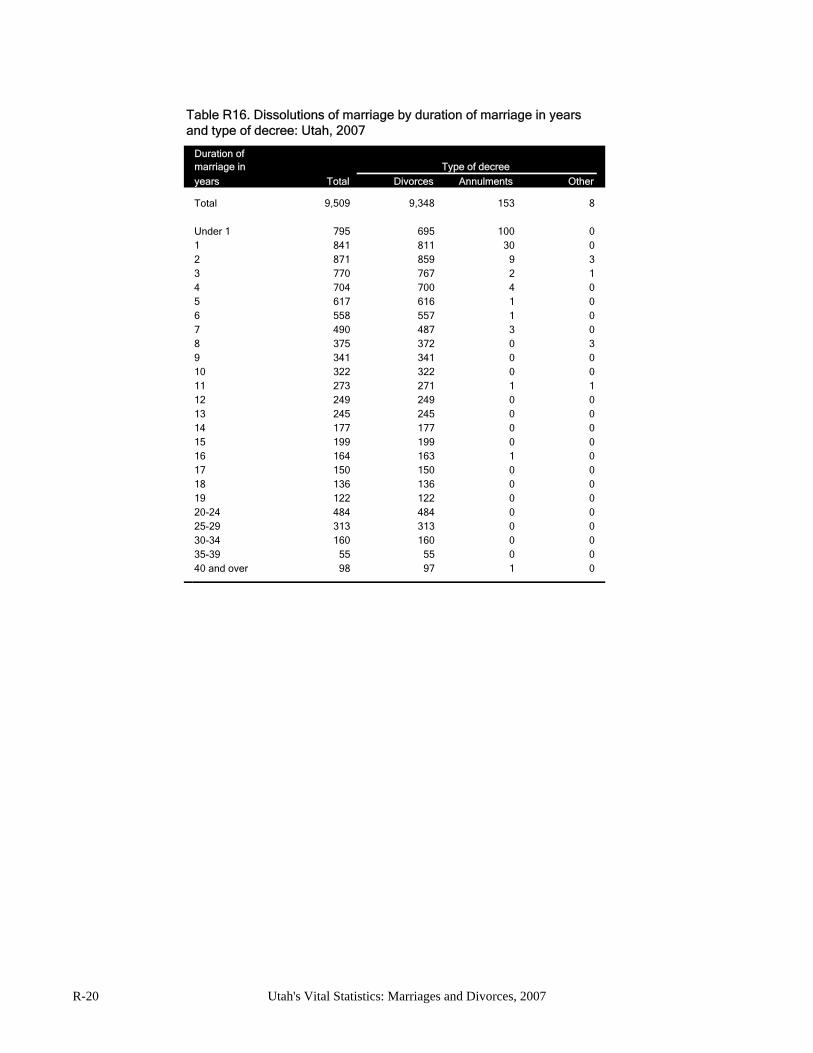
Duration ofmarriage in Type of decree
years Total Divorces Annulments Other
Total 9,509 9,348 153 8
Under 1 795 695 100 01 841 811 30 02 871 859 9 33 770 767 2 14 704 700 4 05 617 616 1 06 558 557 1 07 490 487 3 08 375 372 0 39 341 341 0 010 322 322 0 011 273 271 1 112 249 249 0 013 245 245 0 014 177 177 0 015 199 199 0 016 164 163 1 017 150 150 0 018 136 136 0 019 122 122 0 020-24 484 484 0 025-29 313 313 0 030-34 160 160 0 035-39 55 55 0 040 and over 98 97 1 0
Table R16. Dissolutions of marriage by duration of marriage in years and type of decree: Utah, 2007
R-20 Utah's Vital Statistics: Marriages and Divorces, 2007
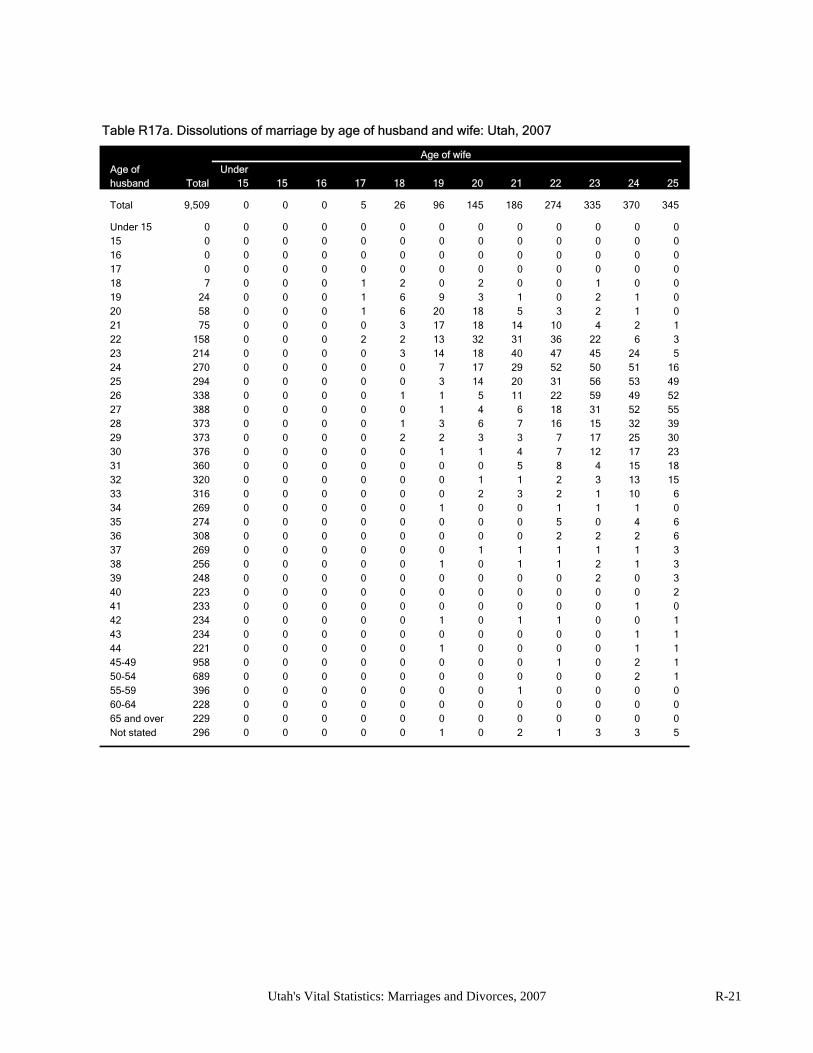
Age of wife
Age of Underhusband Total 15 15 16 17 18 19 20 21 22 23 24 25
Total 9,509 0 0 0 5 26 96 145 186 274 335 370 345
Under 15 0 0 0 0 0 0 0 0 0 0 0 0 015 0 0 0 0 0 0 0 0 0 0 0 0 016 0 0 0 0 0 0 0 0 0 0 0 0 017 0 0 0 0 0 0 0 0 0 0 0 0 018 7 0 0 0 1 2 0 2 0 0 1 0 019 24 0 0 0 1 6 9 3 1 0 2 1 020 58 0 0 0 1 6 20 18 5 3 2 1 021 75 0 0 0 0 3 17 18 14 10 4 2 122 158 0 0 0 2 2 13 32 31 36 22 6 323 214 0 0 0 0 3 14 18 40 47 45 24 524 270 0 0 0 0 0 7 17 29 52 50 51 1625 294 0 0 0 0 0 3 14 20 31 56 53 4926 338 0 0 0 0 1 1 5 11 22 59 49 5227 388 0 0 0 0 0 1 4 6 18 31 52 5528 373 0 0 0 0 1 3 6 7 16 15 32 3929 373 0 0 0 0 2 2 3 3 7 17 25 3030 376 0 0 0 0 0 1 1 4 7 12 17 2331 360 0 0 0 0 0 0 0 5 8 4 15 1832 320 0 0 0 0 0 0 1 1 2 3 13 1533 316 0 0 0 0 0 0 2 3 2 1 10 634 269 0 0 0 0 0 1 0 0 1 1 1 035 274 0 0 0 0 0 0 0 0 5 0 4 636 308 0 0 0 0 0 0 0 0 2 2 2 637 269 0 0 0 0 0 0 1 1 1 1 1 338 256 0 0 0 0 0 1 0 1 1 2 1 339 248 0 0 0 0 0 0 0 0 0 2 0 340 223 0 0 0 0 0 0 0 0 0 0 0 241 233 0 0 0 0 0 0 0 0 0 0 1 042 234 0 0 0 0 0 1 0 1 1 0 0 143 234 0 0 0 0 0 0 0 0 0 0 1 144 221 0 0 0 0 0 1 0 0 0 0 1 145-49 958 0 0 0 0 0 0 0 0 1 0 2 150-54 689 0 0 0 0 0 0 0 0 0 0 2 155-59 396 0 0 0 0 0 0 0 1 0 0 0 060-64 228 0 0 0 0 0 0 0 0 0 0 0 065 and over 229 0 0 0 0 0 0 0 0 0 0 0 0Not stated 296 0 0 0 0 0 1 0 2 1 3 3 5
Table R17a. Dissolutions of marriage by age of husband and wife: Utah, 2007
Utah's Vital Statistics: Marriages and Divorces, 2007 R-21
Age of wife
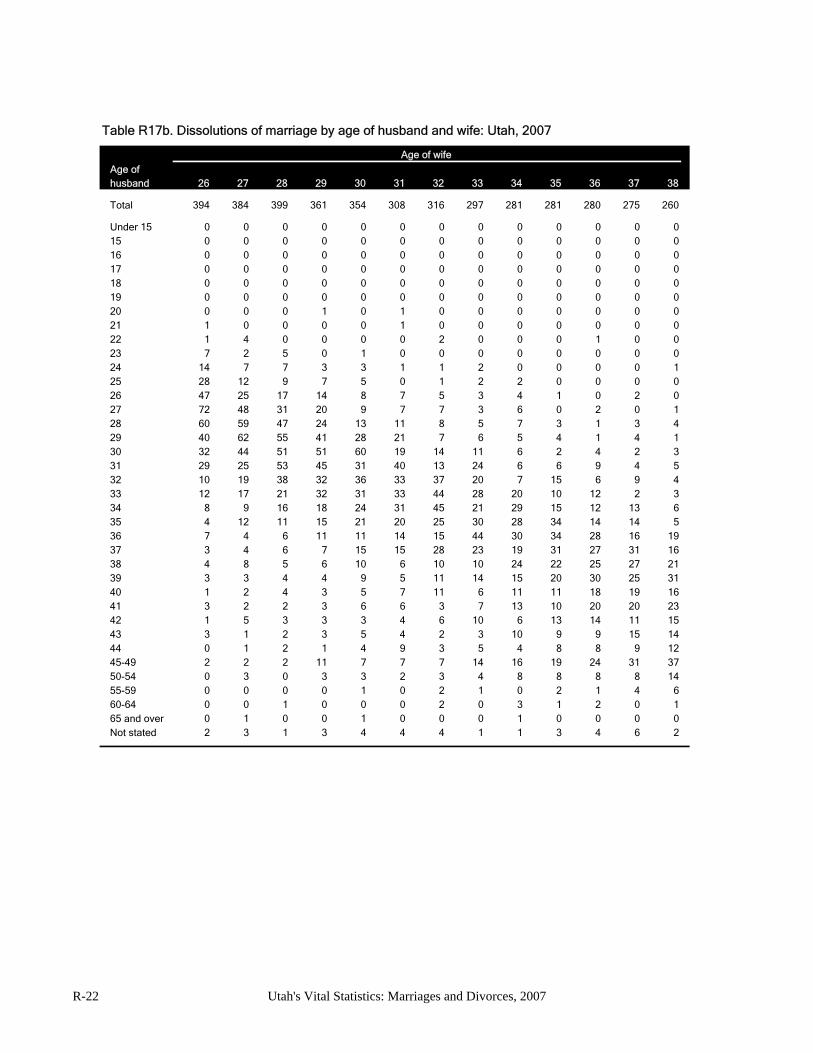
Age of husband 26 27 28 29 30 31 32 33 34 35 36 37 38
Total 394 384 399 361 354 308 316 297 281 281 280 275 260
Under 15 0 0 0 0 0 0 0 0 0 0 0 0 015 0 0 0 0 0 0 0 0 0 0 0 0 016 0 0 0 0 0 0 0 0 0 0 0 0 017 0 0 0 0 0 0 0 0 0 0 0 0 018 0 0 0 0 0 0 0 0 0 0 0 0 019 0 0 0 0 0 0 0 0 0 0 0 0 020 0 0 0 1 0 1 0 0 0 0 0 0 021 1 0 0 0 0 1 0 0 0 0 0 0 022 1 4 0 0 0 0 2 0 0 0 1 0 023 7 2 5 0 1 0 0 0 0 0 0 0 024 14 7 7 3 3 1 1 2 0 0 0 0 125 28 12 9 7 5 0 1 2 2 0 0 0 026 47 25 17 14 8 7 5 3 4 1 0 2 027 72 48 31 20 9 7 7 3 6 0 2 0 128 60 59 47 24 13 11 8 5 7 3 1 3 429 40 62 55 41 28 21 7 6 5 4 1 4 130 32 44 51 51 60 19 14 11 6 2 4 2 331 29 25 53 45 31 40 13 24 6 6 9 4 532 10 19 38 32 36 33 37 20 7 15 6 9 433 12 17 21 32 31 33 44 28 20 10 12 2 334 8 9 16 18 24 31 45 21 29 15 12 13 635 4 12 11 15 21 20 25 30 28 34 14 14 536 7 4 6 11 11 14 15 44 30 34 28 16 1937 3 4 6 7 15 15 28 23 19 31 27 31 1638 4 8 5 6 10 6 10 10 24 22 25 27 2139 3 3 4 4 9 5 11 14 15 20 30 25 3140 1 2 4 3 5 7 11 6 11 11 18 19 1641 3 2 2 3 6 6 3 7 13 10 20 20 2342 1 5 3 3 3 4 6 10 6 13 14 11 1543 3 1 2 3 5 4 2 3 10 9 9 15 1444 0 1 2 1 4 9 3 5 4 8 8 9 1245-49 2 2 2 11 7 7 7 14 16 19 24 31 3750-54 0 3 0 3 3 2 3 4 8 8 8 8 1455-59 0 0 0 0 1 0 2 1 0 2 1 4 660-64 0 0 1 0 0 0 2 0 3 1 2 0 165 and over 0 1 0 0 1 0 0 0 1 0 0 0 0Not stated 2 3 1 3 4 4 4 1 1 3 4 6 2
Table R17b. Dissolutions of marriage by age of husband and wife: Utah, 2007
R-22 Utah's Vital Statistics: Marriages and Divorces, 2007
Age of wife
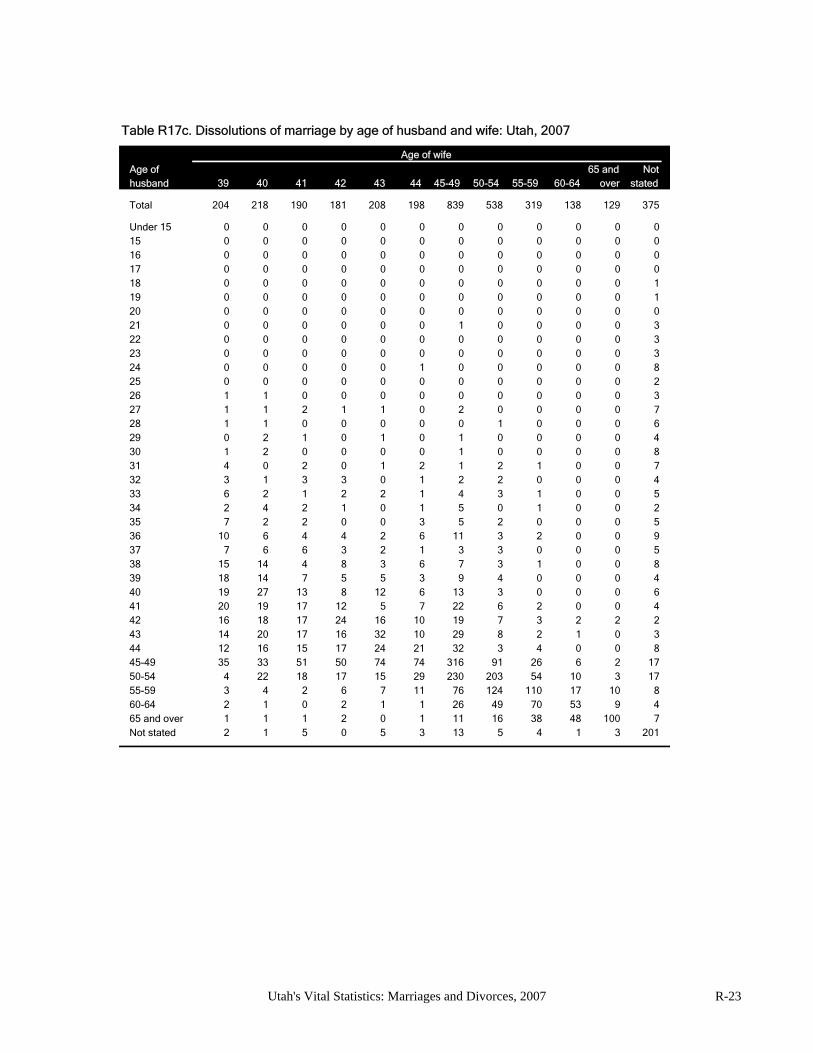
Age of 65 and Nothusband 39 40 41 42 43 44 45-49 50-54 55-59 60-64 over stated
Total 204 218 190 181 208 198 839 538 319 138 129 375
Under 15 0 0 0 0 0 0 0 0 0 0 0 015 0 0 0 0 0 0 0 0 0 0 0 016 0 0 0 0 0 0 0 0 0 0 0 017 0 0 0 0 0 0 0 0 0 0 0 018 0 0 0 0 0 0 0 0 0 0 0 119 0 0 0 0 0 0 0 0 0 0 0 120 0 0 0 0 0 0 0 0 0 0 0 021 0 0 0 0 0 0 1 0 0 0 0 322 0 0 0 0 0 0 0 0 0 0 0 323 0 0 0 0 0 0 0 0 0 0 0 324 0 0 0 0 0 1 0 0 0 0 0 825 0 0 0 0 0 0 0 0 0 0 0 226 1 1 0 0 0 0 0 0 0 0 0 327 1 1 2 1 1 0 2 0 0 0 0 728 1 1 0 0 0 0 0 1 0 0 0 629 0 2 1 0 1 0 1 0 0 0 0 430 1 2 0 0 0 0 1 0 0 0 0 831 4 0 2 0 1 2 1 2 1 0 0 732 3 1 3 3 0 1 2 2 0 0 0 433 6 2 1 2 2 1 4 3 1 0 0 534 2 4 2 1 0 1 5 0 1 0 0 235 7 2 2 0 0 3 5 2 0 0 0 536 10 6 4 4 2 6 11 3 2 0 0 937 7 6 6 3 2 1 3 3 0 0 0 538 15 14 4 8 3 6 7 3 1 0 0 839 18 14 7 5 5 3 9 4 0 0 0 440 19 27 13 8 12 6 13 3 0 0 0 641 20 19 17 12 5 7 22 6 2 0 0 442 16 18 17 24 16 10 19 7 3 2 2 243 14 20 17 16 32 10 29 8 2 1 0 344 12 16 15 17 24 21 32 3 4 0 0 845-49 35 33 51 50 74 74 316 91 26 6 2 1750-54 4 22 18 17 15 29 230 203 54 10 3 1755-59 3 4 2 6 7 11 76 124 110 17 10 860-64 2 1 0 2 1 1 26 49 70 53 9 465 and over 1 1 1 2 0 1 11 16 38 48 100 7Not stated 2 1 5 0 5 3 13 5 4 1 3 201
Table R17c. Dissolutions of marriage by age of husband and wife: Utah, 2007
Utah's Vital Statistics: Marriages and Divorces, 2007 R-23
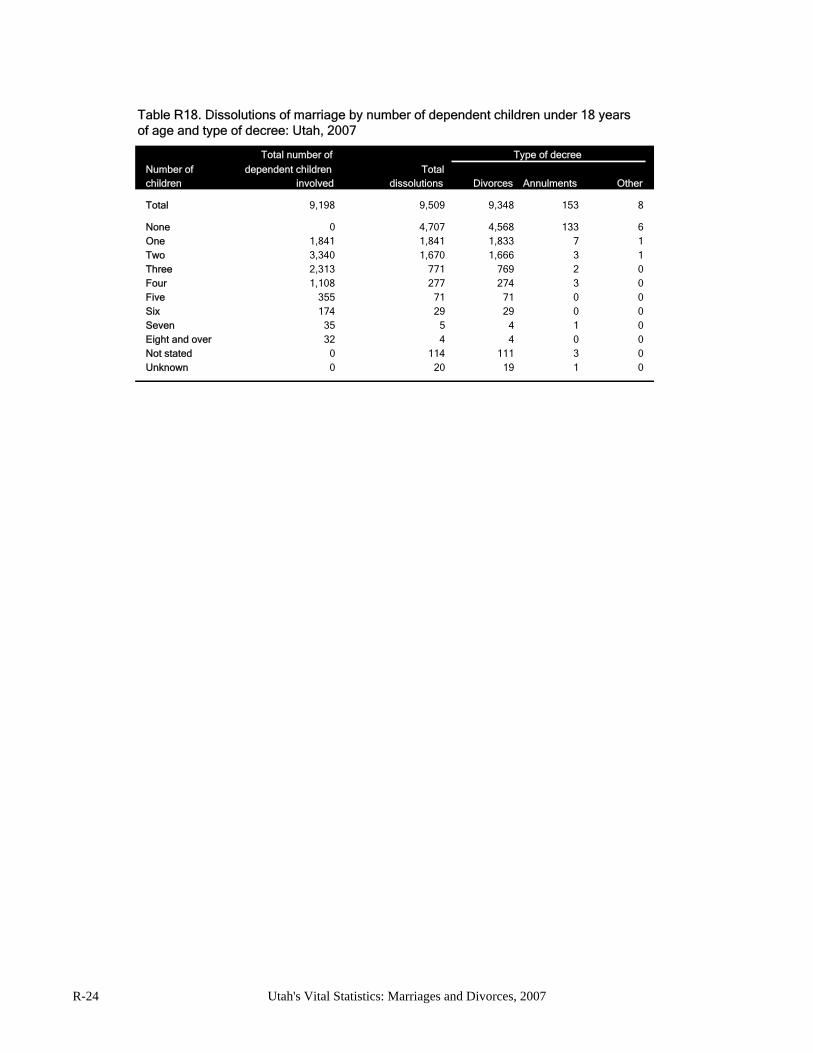
Total number of Type of decree
Number of dependent children Totalchildren involved dissolutions Divorces Annulments Other
Total 9,198 9,509 9,348 153 8
None 0 4,707 4,568 133 6One 1,841 1,841 1,833 7 1Two 3,340 1,670 1,666 3 1Three 2,313 771 769 2 0Four 1,108 277 274 3 0Five 355 71 71 0 0Six 174 29 29 0 0Seven 35 5 4 1 0Eight and over 32 4 4 0 0Not stated 0 114 111 3 0Unknown 0 20 19 1 0
Table R18. Dissolutions of marriage by number of dependent children under 18 years of age and type of decree: Utah, 2007
R-24 Utah's Vital Statistics: Marriages and Divorces, 2007

R-12 Utah's Vital Statistics: Marriages and Divorces, 2007

Blank
2007 Technical Appendix:
Marriages and Divorces

Blank
TECHNICAL NOTES
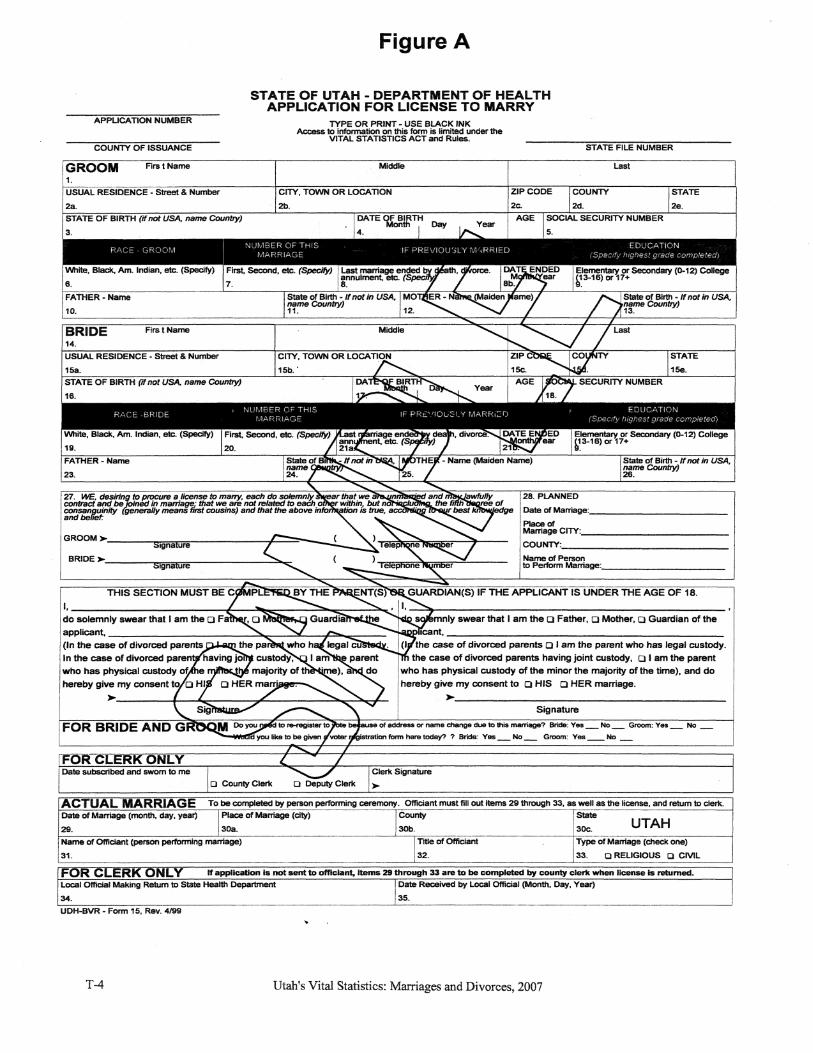
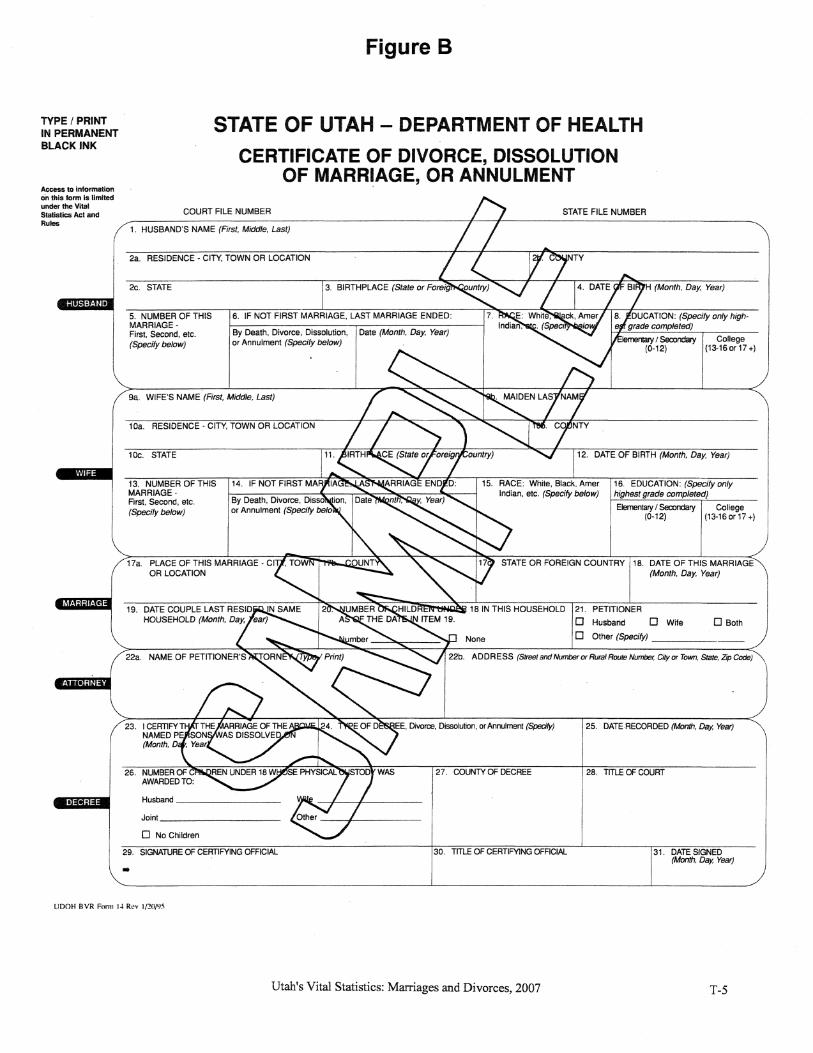
In 1957, the National Center for Health Statistics (NCHS), United States Department of Health and Human Services defined registration areas for the collection of marriage and divorce statistics. These areas were referred to as the Marriage Registration Area (MRA) and the Divorce Registration Area (DRA). Membership was voluntary for all states and the main requirement was central maintenance of marriage and divorce records. The MRA and DRA provided uniformity of data collection to provide detailed data for marriage and divorce studies at the national level. The State of Utah participated in both the MRA and DRA programs. In 1996 NCHS stopped the collection of detailed data from marriage and divorce records, but continues to collect counts of marriages performed and divorces granted from all vital registration areas of the United States. The Office of Vital Records and Statistics, Utah Department of Health, continues to collect the detailed data and to publish Utah’s Vital Statistics: Marriages and Divorces series. The following information will help users understand how marriage and divorce data are collected in the State of Utah. Title 26, Chapter 2, Section 24 of the Utah Code Annotated, 1953 requires marriages occurring in the state to be registered with the state registrar. Divorce or annulment reporting is required under Title 26, Chapter 2, Section 25 of the Utah Code Annotated, 1953. The divorce statute specifies that the decree of divorce become absolute (final) at the expiration of three months from the date the decree is entered, unless an appeal of the court, for good cause, orders a different date, but not more than six months thereafter. In most instances, the divorce certificate is completed at the time the decree is entered and the date the decree becomes final is 90 days later. The record is then transmitted to this office. For some decrees, during the intervening 90 days, an appeal is filed and the final date is delayed or the decree may be set aside and never becomes final. Occasionally this office is notified of these changes. However, it is difficult, particularly at the end of the year, to reflect all of these changes so that there are complete statistical tabulations. Data for the Reference Tables of this report are tabulated directly from records. The form used for reporting marriages was revised in 1996 and is shown in Figure A. The Certificate of Divorce, Annulment or Dissolution of Marriage, Figure B, was revised in 1995 and is being used in Utah's counties for submitting final divorce and annulment records to the Office of Vital Records and Statistics.

Blank

Blank
UTAH DEPARTMENT OF HEALTHCENTER FOR HEALTH DATAOFFICE OF VITAL RECORDS AND STATISTICSPO BOX 141012SALT LAKE CITY UT 84114-1012