U.S.$Solar$Finance$Update$ - SunSpec Home - SunSpec...
45
U.S. Solar Finance Update Thomas Tansy Solar Energy Finance Associa9on SunSpec Alliance [email protected] June 22, 2016 1
Transcript of U.S.$Solar$Finance$Update$ - SunSpec Home - SunSpec...
U.S. Solar Finance Update
Thomas Tansy Solar Energy Finance Associa9on
SunSpec Alliance [email protected] June 22, 2016 1

Agenda
• U.S. solar finance framework (10 min.) • Focus on unique aspects & risks (40 min.)
– Tax equity & ITC – Developer’s perspec9ve – Investment diligence & risk management – Long-‐term asset management
• Round table discussion (15 min.)
2

U.S. Market Sectors • Residen9al
– Mo9va9ons: cost savings, environmental concerns – Finance op9ons: loans, leases, frac9onal ownership – Key factors: energy cost, credit profile, state net metering policy
• Commercial & Industrial – Mo9va9ons: demand charge reduc9ons, tax relief – Finance op9ons: loans, leases, PPA’s – Key factors: building ownership, credit profile, energy use profile
• U9lity – Mo9va9ons: Renewable PorZolio Standard (RPS) compliance – Finance op9ons: rate-‐base, bonds, PPA’s – Key factor: public u9lity commission posture
3

10 Quarters of 1+ GW Growth
4 Source: GTM Research

38 41
47 53
60 67
36
46
56
66
77
88
4 8 12
19 26
2011 '12 '13 '17 '20 '21 '14 '15 '16
No ITC extension
'18 '19
ITC extension
2
+21GW
$35bn
Sustained by 2015 Investment Tax Credit Extension
5
Source: Bloomberg New Energy Finance

Supported By Rising Retail Energy Costs,
6Source: EIA, GTM Research

Decreasing PV System Costs,
7
Source: GTM Research

And New Grid Support Services
8
Source: SolarCity

Industry Concerns
• Affordable finance to scale growth – Private debt (bank lines) – Public debt (ABS) – Equity (IPO or Yieldco)
• Lifespan related risks – Asset management – O&M
9

U.S. Solar ABS Issuance Data (as of April 2016)
SCTY I – SolarCity – LMC Series I LLC (Series 2013-‐1) November 2013
SCTY II – SolarCity – LMC (Series II LLC (Series 2014-‐1) April 2014
SCTY III – SolarCity LMS (Series III) LLC (Series 2014-‐2) July 2014
Sunrun Callisto – Issuer 2015-‐1, LLC (Series 2015-‐1) July 2015
SCTY IV – SolarCity LMC Series IV, LLC (Series 2015-‐1) August 2015
Aurora Master Funding, LLC Series 2015-‐15
SCTY V-‐ SolarCity FTE Series 1, LLC (Series 2015-‐A),
SCTY-‐VI-‐SolarCity LMC Series V, LLC (Series 2016-‐1)
ABS Coupon/Yield 4.80% 4.59% 4.32%1 4.50%1 4.41%1 5.81%1 5.45%1
Bond Size $54.4M $70.2M $201.5M $111.0M $123.5M $100.0M $185M $57.45M Collateral Resi Leases/PPAs
(71%)/non-‐resi (29%)
Resi Leases/PPAs (87%)/non-‐resi (13%)
Resi Leases/PPAs (86%)/non-‐resi (14%)
Resi Leases/PPAs
Resi Leases/PPAs
CIMU (70.5%)/ Resi (29.5%)
MyPower Loans Resi Leases/PPAs
Tax Equity NA NA Master Lease Inverted Lease Partnership Flip/Back Leverage/Tax Loss Insurance
NA NA Master Lease (90.8% of ADSAB)
ADSAB2
(PV of cash flows) $87.8M $106.2M $276.0M $146.5M $182.0M $128.0M $249.5M $76.4M
OvercollateralizaYon3 38% 34% 27% 24.23% 32.1% 21.88% 25.9% 24.8% Advance Rate4 62% 66% 73% 75.77% 67.9% 78.12% 74.1% 75.2% Senior (Class A) Notes RaYng
$54.4M/ BBB+(sf)
$70.2M/ BBB+(sf)
$160M/ BBB+(sf)
$100M/ A(sf)
$103.5M/ A(sf)
$92.5M/ BBB(sf)
$151.55M/ BBB (sf)
$52.15M/ BBB(sf) [S]/ BBB+(sf) [K]
Subordinated (Class B) Notes RaYng
NA NA $41.5M/ BB(sf)
$11M/ BBB(sf)
$20M/ BBB(sf)
$7.5M/ B(sf)
$33.45M/ BB(sf)
$5.3M/ BB(sf) [S]/ BB+(sf) [K]
RaYng Agency UYlized S&P S&P S&P Kroll Kroll Kroll S&P/Kroll S&P/Kroll
1The Yields for these deals are a weighted average based on the size of two tranches offered in each capital structure. 2Aggregate Solar Discount Asset Balance (“ADSAB”) is calculated as the discounted payment streams from leases and PPAs, or notes. 3Calculated as (ADSAB – total Bond Size) ÷ ADSAB. 4Ratio of total Bond Size to ADSAB. 5Not yet priced or closed.
10

U.S. Solar Finance Outlook • Con9nued financial innova9on
– Easy credit for residen9al roooop – Credit backstop mechanisms for C&I financing – PorZolio financings for substa9on-‐level projects – Risk mi9ga9on and credit enhancement – Standardiza9on
• M&A and consolida9on – Solar installa9on companies – Solar financing companies
• Scale-‐up of issuances to public capital markets – Solar securi9za9ons – Yieldcos – Carve-‐outs, Newcos, REITs, and maybe MLPs – Green bonds
11

13
Project Financing
• U.S. style Project Financing requires three types of capital:
- Tax Equity (±40%)
- Non-Recourse Debt (±40%)
- Sponsor Equity (±20%)

14
Tax Equity
• About 40% of total installation cost
• Investment Tax Credit (ITC)
• Depreciable basis is basis less ½ of the ITC/cash grant

15
Investment Tax Credit (ITC)
• Example: $10M project with ITC - $3M ITC in Year 1.
- Depreciation using the Modified Accelerated Cost Recovery System (MACRS) over a 5-year period. Corporate taxation of 40%. • $8.5M * 40% = $3.4M in tax savings from depreciation over 5
years

16
Sample Project Finance Structures
• Sale Leaseback
• (Double) Partnership Flip
• Lease-Pass Through
17
Thank You Very Much!
For Further Questions:
Dirk Michels Ballard Spahr LLP Los Angeles: 2029 Century Park East, Suite 800
Los Angeles, CA 90067 New York: 919 Third Avenue, 37th Floor
New York, NY 10022 c: 858-254-2260 o: 424-204-4400 e: [email protected]

Prepared for
Ram Akella, CEO - Centrosolar
June 22, 2016
Developer & Investor’s Perspective

Developers & Investors - Share Objectives • Minimize risk of investment
• Maximize return on investment
• Realize returns in the shortest period of time
• Identify and mitigate each risk
Intersolar Europe 2016
19

Project Funnel – Basis for Success
Intersolar Europe 2016
20
OPPORTUNITIES X MWs Projects
PIPELINE X/~2 Projects
BACKLOG ~20% of X MWs
Pipeline Probability of being realized is ~50% of all opportunities considered
Backlog Realized projects represent ~20% of assessed opportunities

Project Development Stages
Intersolar Europe 2016
21
Stage 1 • Identification of potential project site(s)
• Development of technical support
• Funding of development costs
Stage 2 • Identify technical options
• Analyze cost/benefits
• Permitting needs
• Market assessment
Stage 3 • Technical & Financial analysis of preferred option
• Financing options
• Start of permitting process
• Preliminary technical concept
Stage 4 • Permitting • Supplier selection & contract negotiation
• Financing of project
Stage 5 • Start of design
• Project scheduling
• Permitting process finalization
Stage 6 • Construction oversight
Stage 7 • Performance testing
Developer’s – Main Activities
Stag
e 1
First contact with project developer St
age
2
Due diligence Financing structures
Stag
e 3
Financing documents St
age
4
Independent review of construction
Stag
e 5
Independent review of commissioning
Financier’s Perspective

Development Timeline – Utility Scale
Intersolar Europe 2016
22
Q1 Q2 Q3 Q4 Q1 Q2 Q3 Q4 Q1 Q2 Q3 Q4 Q1 Q2 Q3 Q4
OBTAIN PERMIT
INTERCONNECTION AGREEMENT EXECUTED
FINALIZE PROJECT FINANCING
Procurement & Construction of InterconnectionSubstation & Network Upgrade
Project Financing
Site Preparation Plant Construction
DEVELOPMENT PERIOD = AT RISK $ $ FUNDED BY FINANCIER
Negotiate Site Control Secure Land
Interconnection Agreement
PERMITTING
Year 1 Year 2 Year 3 Year 4
PPA Bidding & Negotiations
Developer's Involvement
Financier's Engagement DG projects and residential portfolios require much shorter time to be realized

Each Project Stage Funded by Different Capital Source
Intersolar Europe 2016
23
I) Development Stage All Equity
II) Construction Stage Equity/Debt
III) Permanent Capital Tax Equity/Equity/Debt
Development Stage = High Risk, High Return • Venture Capital • No Debt
Construction Stage = Moderate Risk, Moderate Return • Private Equity • Strategic Investors • Banks • Specialty Lenders
Operational Stage = Lowest Risk, Lower Return • Utilities • Infrastructure Funds • Engage with Banks,
Institutional Lenders and Tax Equity
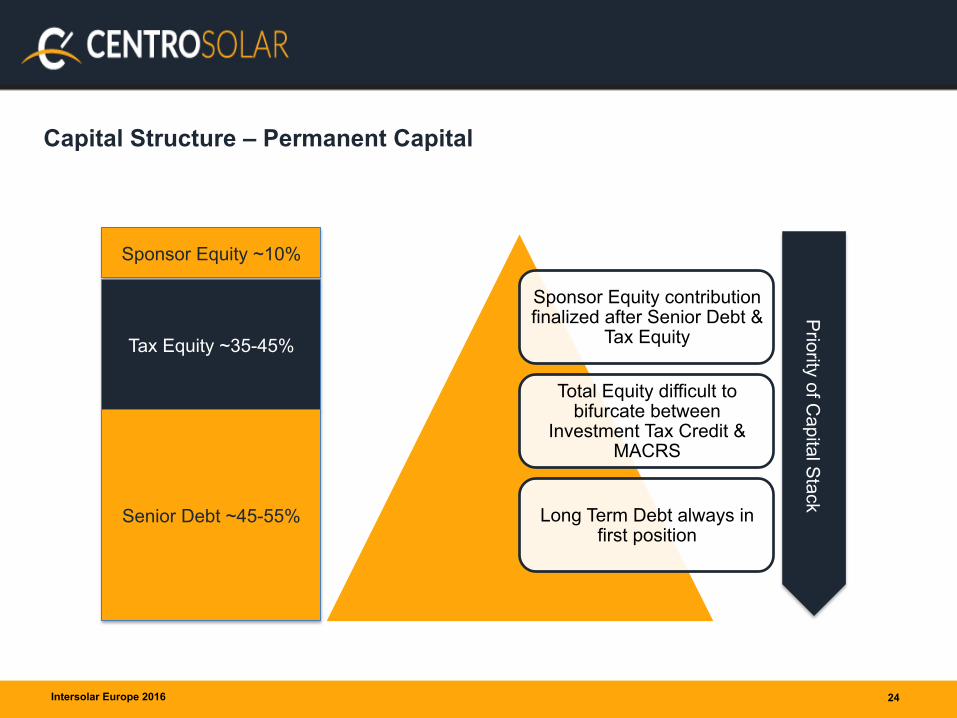
Capital Structure – Permanent Capital
Intersolar Europe 2016
24
Sponsor Equity ~10%
Tax Equity ~35-45%
Senior Debt ~45-55%
Sponsor Equity contribution finalized after Senior Debt &
Tax Equity
Total Equity difficult to bifurcate between
Investment Tax Credit & MACRS
Long Term Debt always in first position
Priority of C
apital Stack

Take Aways for Developers & Investors
• Priorities § Power Purchase Agreement
• Knowledge of cost of power and total cost an imperative § Long Term Debt
• Investment grade off takers are requisite • DSCR of 1.25x + • Keen focus on interest rates – moving target
§ Tax Equity • Established institutions with knowledge of the solar industry
• Target Hurdle Rate § Unlevered IRR rates of 7-9%
• Caution & Knowledge § Keep an on-going thirst for knowledge = costs, brokers, incentives,
valuation, etc. § Always remain cautious of whom you engage as advisors, brokers,
consutants Intersolar Europe 2016
25
Are Low Cost Capital Products Dead?
Lessons in Diligence from the Yieldco Meltdown

Mercatus Energy Investment Management (EIM) Software Platform
Helping Energy Producers Drive a Step Change Improvement in Organization Productivity and Speed in Decision Making
80 GW of Project Data
6 Technologies Integrated
Projects Managed Across 75 Countries
Solar Wind Storage Energy Efficiency Biomass CHP

Yieldcos: Dividend growth-‐oriented public companies, created by a parent company, that bundle renewable and/or convenBonal long-‐term contracted operaBng assets.
Having grown too big and too fast, Yieldcos suffered declines in revenue and loss of investment funds due to:
» Risky financial engineering » The relentless acquisiBons of assets and poor
project pipeline
» Deficient project data » Compliance and diligence failure
The Downfall of YieldCos – Lack of Diligence

• Every asset class; data integrity, transparency, compliance and accurate reporBng are key to aOract and retain investors. » It’s also mandated by
regulaBons post 2008 economic meltdown
• Without these aOributes, the Renewable Energy sector will not aOract investment.
• In order for Yieldcos and solar financing vehicles to regain credibility:
» Structure needs to be simplified
» Assets need to be closely managed
» Cash flows need to be tracked » Models need to be accurate
» Data needs to be validated systemaBcally
• For now the standards will be higher
Lessons Learned

• In the world of distributed generaBon, technology is key, investor confidence is necessary and financial games lead to trouble.
• Low-‐cost capital is necessary in gaining a compeBBve advantage in the clean energy market.
• If renewable companies have the process and technology to maintain a robust pipeline, to responsibly feed financial instruments and to make consistent dividend payments, they can gain a substanBal advantage when it comes to raising capital.
Key Takeaways

The most successful energy companies of the future will gain a compe55ve advantage by digi5zing their business processes.
ü AutomaBng manual processes and eliminaBon of clumsy unnecessary, Bme-‐wasBng, confusing, and expensive overhead
ü Taking “grunge” out of the asset investment management process
ü The Impact ü Stay compliant with investor criteria and guidelines
ü Assess project eligibility and clarify risk factors faster ü Speed Accuracy and Agility in Decision-‐making
ü Increase producBvity, efficiency and reduce costs across your enBre organisaBon
What it Means to be Digital/Digitally Diligent

Intersolar Europe Conference 2016 | München

ABOUT 3MEGAWATT
8 GW
2,000 Sites
20 Countries
3megawatt provides BluePoint the world’s leading
solar asset management software platform for solar asset owners and operators

ASSET MANAGEMENT - DIFFERENCES EUROPE | US

THE US MARKET IS MORE COMPLEX FOR ASSET MANAGEMENT
Europe US Asset Management Service 3rd party asset managers Developers
Investors Minority institutional Majority institutional
Monitoring Systems Very fragmented A few big players
EPC Plays big role post COD Plays little role post COD
Separation AM and O&M Little separation Segregated functions
Compliance Requirments Light More complex
Energy Sales Settlements Mostly easy Very complex
Certificate Settlement Mostly easy Complex
Reporting Requirements Mostly easy Complex
Integration with Storage Little traction w. C&I/utility Market developing faster
Pricing pressures High Medium/High
WHAT CHALLENGES ARE SPECIFIC TO THE US?
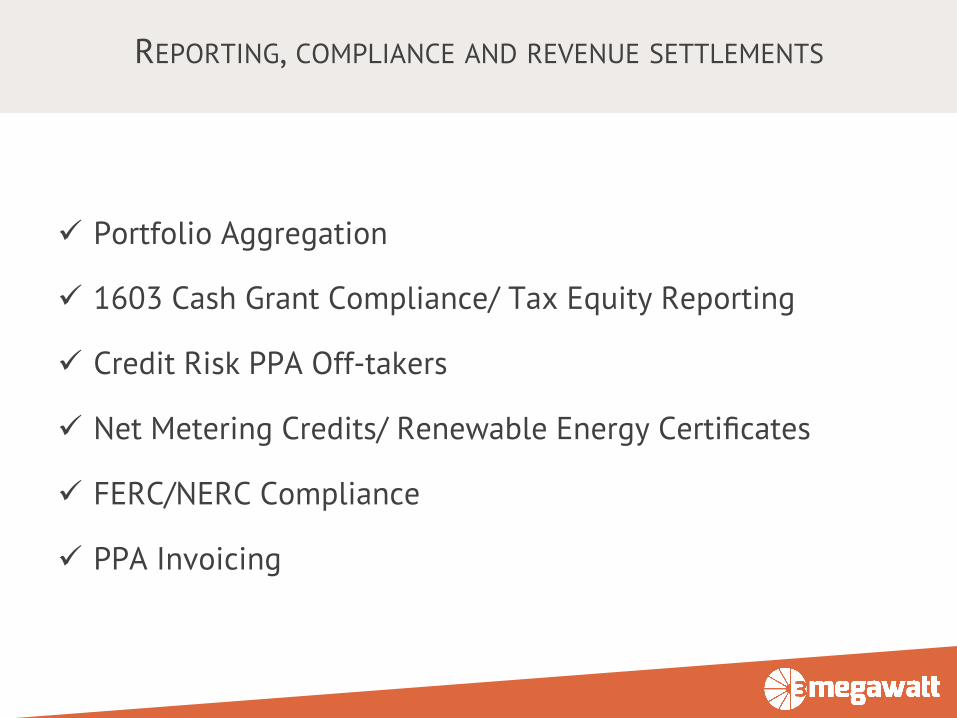
ü Portfolio Aggregation
ü 1603 Cash Grant Compliance/ Tax Equity Reporting
ü Credit Risk PPA Off-takers
ü Net Metering Credits/ Renewable Energy Certificates
ü FERC/NERC Compliance
ü PPA Invoicing
REPORTING, COMPLIANCE AND REVENUE SETTLEMENTS

WHAT IS NEW?

ü Community solar or distributed energy 2.0
ü Storage O&M
ü Demand charge reduction
ü Backup servicing
ü NERC CIP compliance
ü Spare part management systems
ü Solar Asset Management Software
THE CURRENT BUZZWORDS

THANK YOU
BLUEPOINT THE LEADING SOLAR ASSET MANAGEMENT PLATFORM

U.S. Solar Finance Update
Q&A
Thomas Tansy Solar Energy Finance Associa9on
SunSpec Alliance [email protected] June 22, 2016 41

Appendix I Sale Leaseback Structure

Appendix II (Double) Partnership Flip Structure

Appendix III Lease Pass-Through Structure