u>so 4H3>c-i5?q-w-ooo -...
22
• u>so 4H 3>c- i5?q- w- ooo FISHERIES RESEARCH BOARD OF CANADA Pacific Oceanographic Group Nanaimo, B.C. Report to File - 1.969-3 (File N6-47, 26 June, 1969) Preface Lake Fertilization (A proposal to enrich, with commercial fertilizer, the waters of a large sockeye-producing lake) The following presentation is intended for persons with a common concern but with different, interests in sockeye production. Consequently considerable scientific detail has been omitted but it is hoped that these aspects can be discussed and further developed with persons directly concerned with similar projects (e.g. FRB, Winnipeg). It is also hoped that some other investigators who may be interested in the project, and who wish to participate, will feel free to become active contributors to the research, effort. Introduction. "» Our interest in lake fertilization has grown out of a comparative ecological appraisal of the freshwater and marine environments of young salmonids. Available data suggest r.hat the organic production in two sockeye-producing lakes (Babine and Great Central) is low. In Babine Lake, we estimate from data reported by Narver and Anderson. (1968) that the annual primary production is less than 10 gC/m2/yr. In contrast, the Strait of Georgia has a minimum production of 150 gC/m2/yr and even at Ocean Station 'P1, which may be considered a relatively poor marine environment, the productivity is 50-70 gC/tn/yr. For an assessment: of such differences in primary production and their relation to fisheries, it is perhaps interesting to quote directly from an authority on. this subject (Winberg, 1.960): "There is a definite interrelationship between, the extent of primary production, and the production of fish in bodies of water. This is clearly shown, in particular, in the fertilization of fish ponds." Carbon fixed by photosynthesis at the primary level of production, is transferred to the secondary level of production (the zooplankton) and then directly to young salmonids and other planktivorous animals. The efficiency with which food is transferred along this route is a major problem for the aquatic scientist but as a first approximation, the more food that is made available, up to some maximal level, the more that will be. transferred to
Transcript of u>so 4H3>c-i5?q-w-ooo -...

•
u>so 4H 3>c- i5?q- w- ooo
FISHERIES RESEARCH BOARD OF CANADA
Pacific Oceanographic GroupNanaimo, B.C.
Report to File - 1.969-3(File N6-47, 26 June, 1969)
Preface
Lake Fertilization
(A proposal to enrich, with commercial fertilizer,the waters of a large sockeye-producing lake)
The following presentation is intended for persons with a common concernbut with different, interests in sockeye production. Consequently considerablescientific detail has been omitted but it is hoped that these aspects can bediscussed and further developed with persons directly concerned with similarprojects (e.g. FRB, Winnipeg). It is also hoped that some other investigatorswho may be interested in the project, and who wish to participate, will feelfree to become active contributors to the research, effort.
Introduction.
"»
Our interest in lake fertilization has grown out of a comparativeecological appraisal of the freshwater and marine environments of youngsalmonids. Available data suggest r.hat the organic production in twosockeye-producing lakes (Babine and Great Central) is low. In Babine Lake, weestimate from data reported by Narver and Anderson. (1968) that the annualprimary production is less than 10 gC/m2/yr. In contrast, the Strait ofGeorgia has a minimum production of 150 gC/m2/yr and even at Ocean Station 'P1,which may be considered a relatively poor marine environment, the productivityis 50-70 gC/tn/yr. For an assessment: of such differences in primary productionand their relation to fisheries, it is perhaps interesting to quote directlyfrom an authority on. this subject (Winberg, 1.960):
"There is a definite interrelationship between, the extent ofprimary production, and the production of fish in bodies of water.This is clearly shown, in particular, in the fertilization of fishponds."
Carbon fixed by photosynthesis at the primary level of production, istransferred to the secondary level of production (the zooplankton) and thendirectly to young salmonids and other planktivorous animals. The efficiencywith which food is transferred along this route is a major problem for theaquatic scientist but as a first approximation, the more food that is madeavailable, up to some maximal level, the more that will be. transferred to
- 2
higher trophic levels. Thus Johnson (1965) showed that in general the growthrate of young sockeye in different, lakes was related directly to the abundanceof zooplankton; Brett et al. (1969) showed that young sockeye. grew faster, upto a certain maximum rate, the more food they were given; and LeBrasseur (1969)showed the same effects for young chum salmon. While it is not our intentionto exhaustively review the literature on this subject, it. is part of ourconviction (and obviously that of some other scientists) that among factorsinfluencing the growth of young salmon, the amount of food available is veryimportant.
Returning to the question, of freshwater and marine productivity at theprimary level, it has been made apparent that large freshwater lakes, suchas Babine Lake, which produces between 20-100 x 106 smolts per year, areonly about l/10th to l/20th as productive as a marine habitat at the samelatitude. In this respect it is of interest to note that the young sockeyegrow for their first few months in. lake water at an average rate of about2% per day (Macdonald, 1969) while pink and chum salmon, who spend theirfirst, few months in a marine environment, grow at a rate of 4.5% per day(LeBrasseur and Parker, 1964; LeBrasseur, 1969). Compounded over severalmonths these growth rates not only produce a much larger biomass of fishbut also reflect the greater sustained food production of the marine,compared with the freshwater habitat. Finally it can be argued that thesedifferences in growth rates are genetic, which may in part be true, butfrom available data (loc. cit.) a strong indication has already been giventhat an environment which produces more fish food will grow more fish.
The basis for the low production of freshwater systems has been thesubject of a large number of scientific papers and perhaps one of the mostsuccinct, summaries is contained in several paragraphs from a paper by Rigler
(1964):
"WilL knowledge of the cycle of phosphorus in .lakes help usto increase their productivity? Twenty years ago the answer to thisquestion would have been an unhesitating "yes". Brandt (2) hadpreviously asserted that the supply of phosphorus was the factorlimiting the growth of phytoplankton and his conclusion hadrecently received support from the field and laboratory studies ofAtkins (1) and Harvey (6), and Einsele's (3) fertilizationexperiments in freshwater. Einsele had added, massive amounts ofinorganic phosphorus to the surface of Schleinsee and found thatthe bulk of this phosphorus was removed from the water by phytoplankton within a week and that in a month the concentration ofinorganic phosphorus had returned to its original low level.Thus, the relation between phosphorus and productivity appearedto be direct, simple and well established.
"Then phosphorus began to slip from its apparentlyunassailable position and a few of the observations contributingto its fall deserve mention. First, on many occasions the

concentration of inorganic phosphorus was not observed to decreaseas the population of phytoplankton increased, in fact, theopposite relation was occasionally observed. This suggested thatthe water was not the main storage depot for inorganic P, but wasmerely a temporary reservoir which could be replenished fromunknown sources of supply more rapidly than it could be emptiedby growing phytoplanktonc Thus the picture began to change froma simple,*static one into one in which phosphorus was rapidlycycled throughout the aquatic ecosystem, and it became obviousthat little more could be learned about the role of phosphorusunless new methods of studying it became available.
"The new tool, radioactive isotope technique, which madepossible further advances also served to cast doubt on theearlier conclusions about the role of phosphorus as a limitingfactor. Rodhe (13), using the Cl4 method of Stfeeman Nielsen (15),showed that in one lake the primary productivity of surface waterwas increased far more by the addition of a little hypolimneticwater than by the addition of phosphoruSo Finally, Goldman (4),also using C14 technique, has shown that trace amounts o£ anyone of a variety of elements such as Mo, Co, Zn or Mn, increasethe productivity of the surface waters of certain lakes. Theresult of these studies is that the relation between phosphorusand productivity is not as direct or obvious as it once appearedto be. However, I do not mean to imply that there is no relation,for when we talk of "the energetics of productivity" we aretalking about the flow of energy through an ecosystem and in anysystem involving living things the flow of energy and the cycleof an element, regardless whether the element is M6, Co, N or P,are inseparable. Before we can increase and direct the productivityof lakes as we do that of the land we will have to know much aboutthe cycle of phosphorus as well as the cycles of many other traceelementso"
While for scientific reasons we do not necessarily agree with the lastsentence of this quotation (primarily because the practical use of fertilizersin agriculture has not depended on a complete, or even partial, understandingof nutrient cycles in soils), the quotation does serve to show that anyincrease in aquatic productivity may be the result of several nutrients, andnot only phosphorus as was suggested in earlier literature. Preliminaryresults illustrating this point are shown in Fig. 1 where it may be seen thatsingle element additions (e.g.. phosphorus) were not really as effective inenhancing phytoplankton growth as combinations of phosphorus and nitrogen or,for maximum growth, a complete spectrum of nutrients. For all nutrients,however, the total quantity of an element available in a lake may be increased(e.g. by domestic eutrdphication) or decreased (e.g. by a decrease in thenumber of adult salmon carcasses returned to the lake) and any shift in thesteady state level of an element should, in time, be reflected in the totalproductivity of the lake (a fuller discussion of the mechanisms that may beinvolved in this type of nutrient balance is given in Annex I).

- 4 -
The addition of fertilizers to aquatic environments is not a new idea,either in theory or practise. In some parts of the world fish farming,including the addition of natural fertilizers, has been practised for manycenturies.
Among responsible scientists who have advocated lake fertilization inN. America are Dr. R.E. Foerster (former Director of FRB Station, Nanaimo)who states (Foerster, 1968)i
"Future studies of the phosphate balance of sockeye-producingwaters and the direction of its trend may prove most enlightening.Addition of suitable fertilizers may be found advantageous."
and Professor A.D. Hasler (University of Wisconsin), who strikes an interestingnote of optimism in an article devoted largely to pollution from excessivenutrient enrichment (Hasler, 1969):
"All eutrophication is not necessarily bad. Well-plannedenrichment could increase the production of food organisms forfish and hence raise the productivity of a natural or man-madelake. Many lakes in Canada, Alaska, and USSR are candidatesfor this potential."
In addition to these quotations, a number of recent reports on thebeneficial effects of freshwater fettilization, some of which show increasesin the growth rate and yield of fish, are given by Nelson and Edmondson (1955),Smith (1968) and Matarueva (1968). A summary of other literature onfertilization attempts in N. America is given in a recent FAO report whichstates in part (Gooch, 1967)%
"The history of published scientific attempts in NorthAmerica to increase aquatic productivity by addition offertilizers covers a mere 37-year period (1929-present). .....Although the results of these contributions make it relativelysafe to predict that fertilization, either with inorganics ororganics, will lead to an increase in aquatic productivity ofone kind or another, little progress has been made beyond thisprimitive predictive stage. In particular, only three attemptshave been made to monitor the fertilizer substances after theywere added to the pond, and then to correlate fish productionwith the levels of substances monitored. The inconsistentresults obtained in these three studies, and the meagreknowledge now extant about fertilizer dynamics in aquaticsystems indicate that a major revision is needed in theapproach to pond fertilization problems ..... no one: has^-yetmounted an aggressive and sustained study to elucidate therole played by artificial fertilization in aquatic (vertebrateor invertebrate) productivity."

- 5
The proposal
It is proposed that the effects of lake fertilization should be tested ona sockeye-producing lake with the intention of increasing the production (growthrate and/or standing stock) of sockeye smolts. It is further proposed in thisconnection that the fertilization be carried out in a large, deep lake andmaintained over a period of five years so as to permit a unique opportunity tostudy the effects of fertilization in a pelagic environment free from benthicactivity, and on a scale which would bear a relation to the possible commercialapplication of our procedures, should they prove successful.
Choice of a suitable lake
It is suggested that Great Central Lake on Vancouver Island is a suitablelake for this study. The reasons are as follows:
1) There is an escapement to the Somass River system (about 50% to greatCentral Lake) of between 20,000 and 100,000 sockeye per year (Table I). Thusthe lake may be expected to produce between 1 and 2 million smolts. Thesefigures are much less than some of the larger sockeye-producing lakes, but aresufficient to allow for adequate sampling and any effects on the populationshould be apparent without interfering with the more established commercialfisheries.
2) The lake has the right requirements as to size (ca 55 km2) and depth (max.200 m) - see Annex II.
3) There is a Department of Fisheries installation at Great Central Lake whichwill be most suitable for us to use as a laboratory base camp if the appropriatepermission is obtained. In addition, for some types of laboratory equipmentwhich are not generally transportable, the Nanaimo laboratory is sufficientlyclose for certain samples to be transported for analysis at the BiologicalStation.
Plan of action
The quantity of soluble inorganic and organic fertilizer required for thisproject is at present being determined in detail. Approximately, however, thetotal weight of material to be added over a period of 6-8 months would amountto between 50-100 tons and the cost of materials per year would be between$10,000 and $20,000. It is suggested that in view of the possible directeconomic gain* that could result from this type of project, a cost sharing ofthe materials might be explored (e.g. with IDS or possibly private enterprise),.
*If the benefits of fertilization were to be realised in a sustained escapementof 100-200,000 fish (Table I), the project would be financially successful.
- 6 -
The fertilizer would have to be stored and loaded from a base camp andit appears to us that the most suitable site for this operation would be nearthe B.C. Hydro project, approximately halfway up the lake. Soluble fertilizerwould be applied about <once every 7 to 10 days and a continuous monitoringprogram would be carried out by a team of scientists to evaluate the acuteand chronic effects of fertilization such as are expected to occur in nutrientlevels, growth rate of phytoplankton, zooplankton generations, size andquantity of prey available, and the survival and growth rate of young fish.
The program of intensive sampling will be maintained throughout the firstyear of nutrient additions, starting in 1970, and for the four subsequentyears fertilizer will be added and a monitor program will be maintained. Thelatter will require less scientific effort and wiil be formulated largely on^the basis of the first year's experience. Final results of these investigations,including any data available on adult returns following the years offertilization, will be made available through normal channels of FRBpublications including FRB Data Reports, Technical Reports and primarypublications in aquatic scientific journals.
Personnel involved
Personnel involved on a full-time basis during the first year ofoperations will be from FRB - Nanaimo and will largely consist of personsformerly associated with biological oceanographic studies in Saanich Inlet,the Fraser River plume and Trans-Pac projects. Among scientists andtechnicians they will include Dr. T.R. Parsons (i/c), W.E. Barraclough,CD. McAllister, R.J. LeBrasseur, W.P. Wickett, K. Stephens, J. Fulton,O.D. Kennedy and D. Robinson. In addition to these persons there will beextra assistance from summer students during the most active part of theprogram.
Anticipated effects of fertilization
From previous studies, both on Babine and Great Central Lake we areaware that the levels of nitrogen and phosphorus are low, especially thelatter. Since these elements are required by phytoplankton in an atomicratio of _ca 15:1 it is planned that the bulk of the fertilizer will consistof inorganic nitrogen and phosphorus in a readily soluble form. However,it may be seen from the preliminary results in Fig. 1 that maximum growthof Great Central Lake phytoplankton was obtained when a mixture of tracemetals, chelating agent and vitamins were added in addition to the N and P.In order to simulate this effect we are at present considering additions ofsmall amounts of top soil extract to the lake. In all these additions,however, prior tests will be performed on young fish to determine if thereare any side effects from the application of these materials. In thisrespect the previous use of fertilizers has not been reported to have anydirect effect on larger animals, except in the case of very shallow lakeswhere greatly increased productivity due to enrichment has been known tolead to oxygen depletion on the bottom.

A simulated effect of nutrient enrichment on phytoplankton and zooplanktongrowth is discussed in Annex III. The anticipated essential feature of thiseffect is that there will be a fairly rapid transfer of the increasedproduction at the primary level up to the secondary level and on to theplanktivorous fish. Thus by making repetitive small nutrient additions it isnot anticipated that there will be any loss in water clarity due to heavyphytoplankton growth, such as can occur in a heavily eutropihtod environment.In this respect the additions of N and P will be well below the 'acceptablelevels' advocated by Vollenweider (1968) and shown in Fig. 2 for differentlake depths.
References
Brett, J.R., J.E. Shelbourn and C.T. Shoop. The relation of temperature and'food ration to the growth rate and body composition of fingerling sockeyesalmon, Oncorhynchus nerka. J. Fish. Res. Bd. Canada (in press).
Foerster, R.E. 1968. The Sockeye Salmon. Bull. Fish. Res, Bd. Canada,No. 162, 205 p.
Gooch, B.C. 1967. Appraisal of North American fish culture fertilizationstudies. Fisheries Rept. FAO No. 44, JJ: 13-26, 1967.
Hasler, A.D. 1969. Cultural eutrophication is reversible. Bioscience,,19s 425-431.
Johnson, W.E. 1965. On mechanisms of self-regulation of population abundancein Oncorhynchus nerka. Mitt. Internat. Verein. Limnol., 13: 66-87.
LeBrasseur, R.J. 1969. Growth of juvenile chum salmon (Oncorhynchus keta)under different feeding regimes. J. Fish. Res. Bd. Canada (in press).
LeBrasseur, R.J. and R.R. Parker. 1964. Growth rate of Central BritishColumbia pink salmon (Oncorhynchus gorbuscha)0 J. Fish. Res. Bd.Canada, 21: 1101-1128.
MacDonald, JoG. 1969. The distribution, growth and survival of sockeyefry (Oncorhynchus nerka) produced in natural and artificial streamenvironments. J. Fish. Res. Bd. Canada, .26: 229-267.
Matarueva, A. 1968. Improvement in bacterial productivity of fish-breedingponds by fertilizing. Mikrobiologiya, JT7: 174-179,
Narver, D.W. and B.C. Anderson. MS 1968. Primary production and associatedmeasurements in the Babine Lake area in 1966-67 and in Owikeno Lake in1967. MS Rept. Series No. 1000, 20 p.
- 8
Nelson, P.R. and W.T. Edmondson. 1955. Limnological effects of fertilizingBare Lake, Alaska. Fisheries Bulletin 102, U.S. Fish and WildlifeService, 415-436.
Rigler, F.H. 1964. The contribution of zooplankton to the turnover ofphosphorus in the epilimnon of lakes. Canadian Fish Ciilturist, 32:3-9.
Smith, M.W. 1968. Fertilization and predator control to increase growthrate and yield of trout in a natural lake. J. Fish. Res. Bd. Canada,_25: 2011-2036.
Vollenweider, R.A. 1968. (publication in preparation)
Winberg, G.G. 1960. Primary production of bodies of water. Inst. Biol.Akad. Nauk Belorusskogo SSR, Minsk, 288 p.
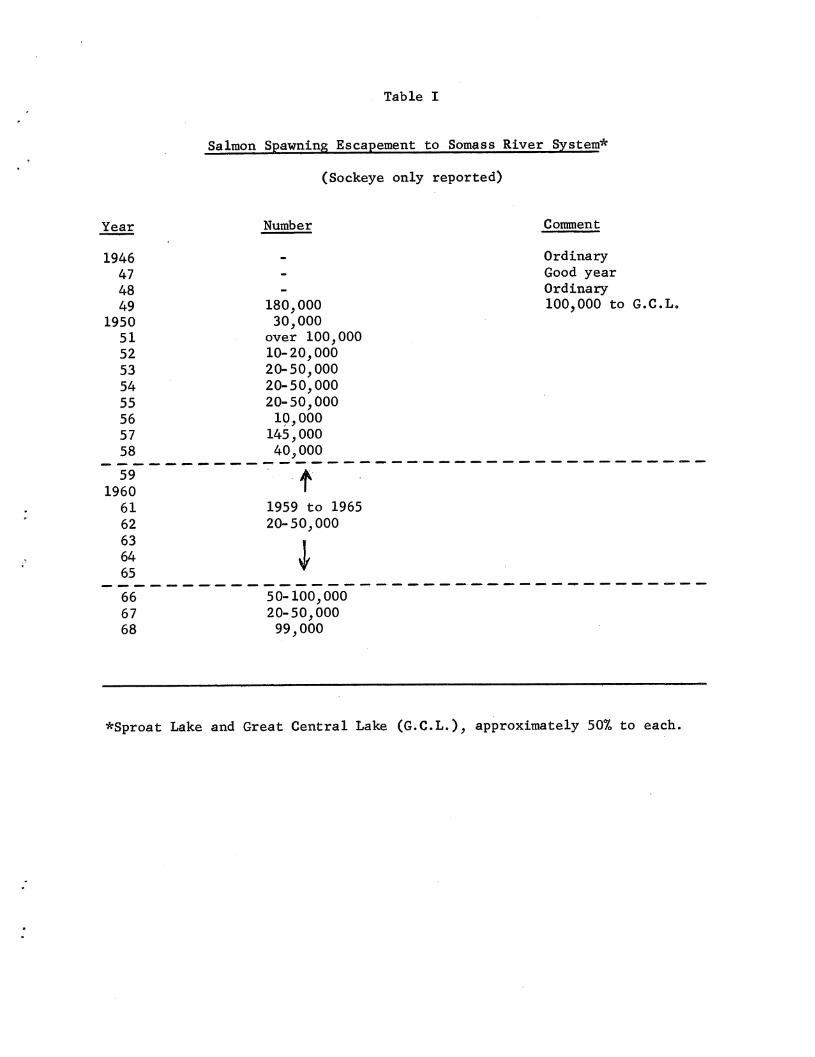
Table I
Salmon Spawning Escapement to Somass River System*
(Sockeye only reported)
Year Number Comment
1946 - Ordinary47 - Good year48 - Ordinary49 180,000 100,000 to G.C.L.
1950 30,00051 over 100,00052 10-20,00053 20-50,00054 20-50,00055 20-50,00056 10,00057 145,00058 40,000
_59 - ~~"f1960 '
61 1959 to 196562 20-50,00063
64
65I
66 50-100,00067 20-50,00068 99,000
*Sproat Lake and Great Central Lake (G.C.L.), approximately 50% to each.

u6iun^»^it
duoomo|SOHdWOINOINIAIV
It
SJLN3IUinNnv
V1Q3/S1VJL3W30VU1
o
31VHdS0Hd
oo
3ivyiiN
V103
SNIWVjjA
o<0
loyiNoo
o
4Jco<u
rH00a>mJ-ico
rH"Oco<u
coMda)o'O'd
a)*h•docowdd^•doooauuooaa)
0)CO
^5i-HOdCO«HCOrC
Hfl}^
ococu•u,dco
i?COrHP4O
do4J
CO
do
•HO4-»S3
CO
d<L>CD
••UCDH)
T3rO
COMrHCDrH
CDdCO•Hd
4JrHMdi-tCDaa)>
0>HOO
OCDCD
0,H-£M-lCOBM-lodwcod
•H
fa
0)o
COrHCI)__,d
dCOT>6a)
-oa)a)(Uood
O
CLrH4J
CD
CDU&o
COCO
soCO»H
3-° CDM-l•HO
4JCO
CDCOH4J.ilrHCO
<jdco:«hh
,d•OH
(D*HCD«H.g,d,£>£-uCOOJ-lCO
•HBrHCOOrHCD-UCO
*0COd-hddno«i-l

5 e
( n ) ONiavon
CVJ
CO
4J
aCD
no
dCDUCD
KHHH
M-l
O
CO
CD
CO
UO •
M-4 00vO
/-s ONH rH
8 <D^ tj
v~/ a)
co dd <dO rH
•H rH
4J O
*tno BCO O
r4
•3 'co /*\
^ S
CM
00
fa
Annex I
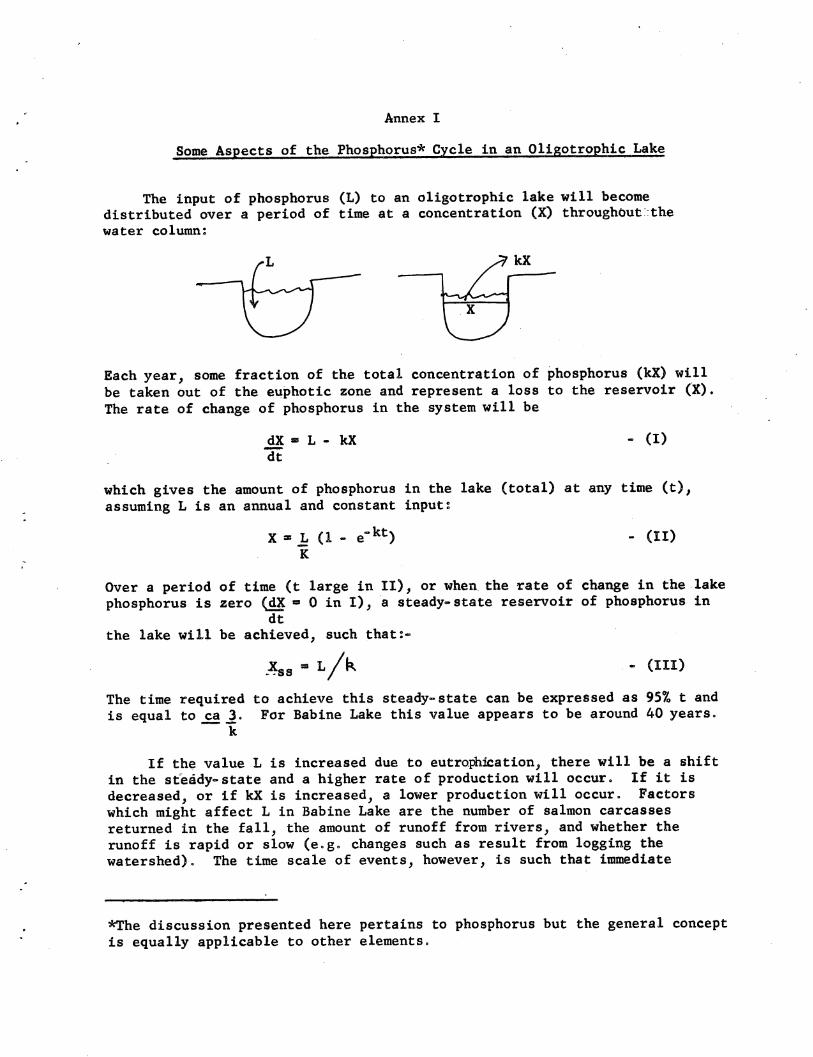
Some Aspects of the Phosphorus* Cycle in an Oligotrophic Lake
The input of phosphorus (L) to an oligotrophic lake will becomedistributed over a period of time at a concentration (X) throughout :thewater column:
Each year, some fraction of the total concentration of phosphorus (kX) willbe taken out of the euphotic zone and represent a loss to the reservoir (X).The rate of change of phosphorus in the system will be
jdX * L - kX - (I)
which gives the amount of phosphorus in the lake (total) at any time (t),assuming L is an annual and constant inputs
X- L (1 - e~kt) - (IDK
Over a period of time (t large in II), or when the rate of change in the lakephosphorus is zero (dX » 0 in I), a steady-state reservoir of phosphorus in
dt
the lake will be achieved, such that:-
*ss ,/k -(III)The time required to achieve this steady-state can be expressed as 95% t andis equal to _ca JL For Babine Lake this value appears to be around 40 years,
k
If the value L is increased due to eutrophication, there will be a shiftin the steady-state and a higher rate of production will occur., If it isdecreased, or if kX is increased, a lower production will occur. Factorswhich might affect L in Babine Lake are the number of salmon carcassesreturned in the fall, the amount of runoff from rivers, and whether therunoff is rapid or slow (e0g. changes such as result from logging thewatershed). The time scale of events, however, is such that immediate
*The discussion presented here pertains to phosphorus but the general conceptis equally applicable to other elements.
11
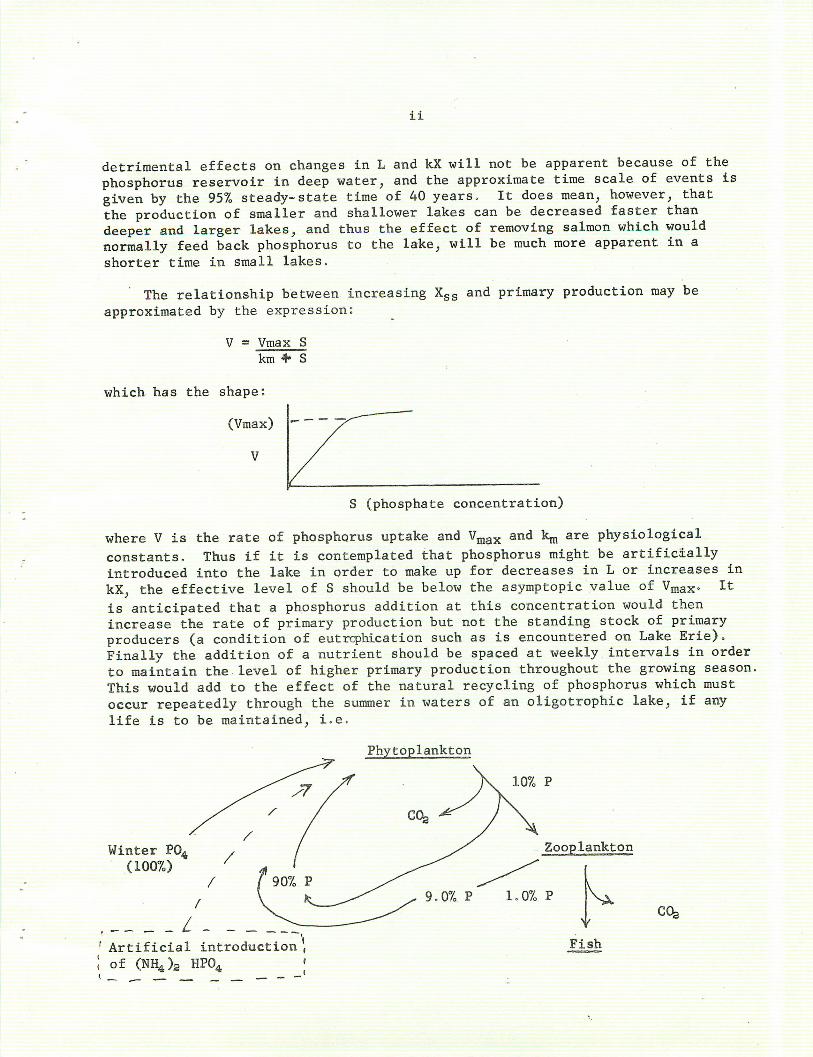
detrimental effects on changes in L and kX will not be apparent because of thephosphorus reservoir in deep water, and the approximate time scale of events isgiven by the 95% steady-state time of 40 years. It does mean, however, thatthe production of smaller and shallower lakes can be decreased faster thandeeper and larger lakes, and thus the effect of removing salmon which wouldnormally feed back phosphorus to the lake, will be much more apparent in ashorter time in small lakes.
The relationship between increasing Xss and primary production may beapproximated by the expression:
V « Vmax S
km ♦ S
which has the shape:
(Vmax)
V
S (phosphate concentration)
where V is the rate of phosphorus uptake and Vmax and 1^ are physiologicalconstants. Thus if it is contemplated that phosphorus might be artificiallyintroduced into the lake in order to make up for decreases in L or increases inkX, the effective level of S should be below the asymptopic value of Vmax. Itis anticipated that a phosphorus addition at this concentration would thenincrease the rate of primary production but not the standing stock of primaryproducers (a condition of eutrophication such as is encountered on Lake Erie).Finally the addition of a nutrient should be spaced at weekly intervals in orderto maintain the level of higher primary production throughout the growing season.This would add to the effect of the natural recycling of phosphorus which mustoccur repeatedly through the summer in waters of an oligotrophic lake, if anylife is to be maintained, i.e.
Winter PQ
(1007o)
!Artificial introduction ',Iof (NH4)2 HP04 J
Phytoplankton
COg
Fish

Annex II
Morphometry of Great Central Lake
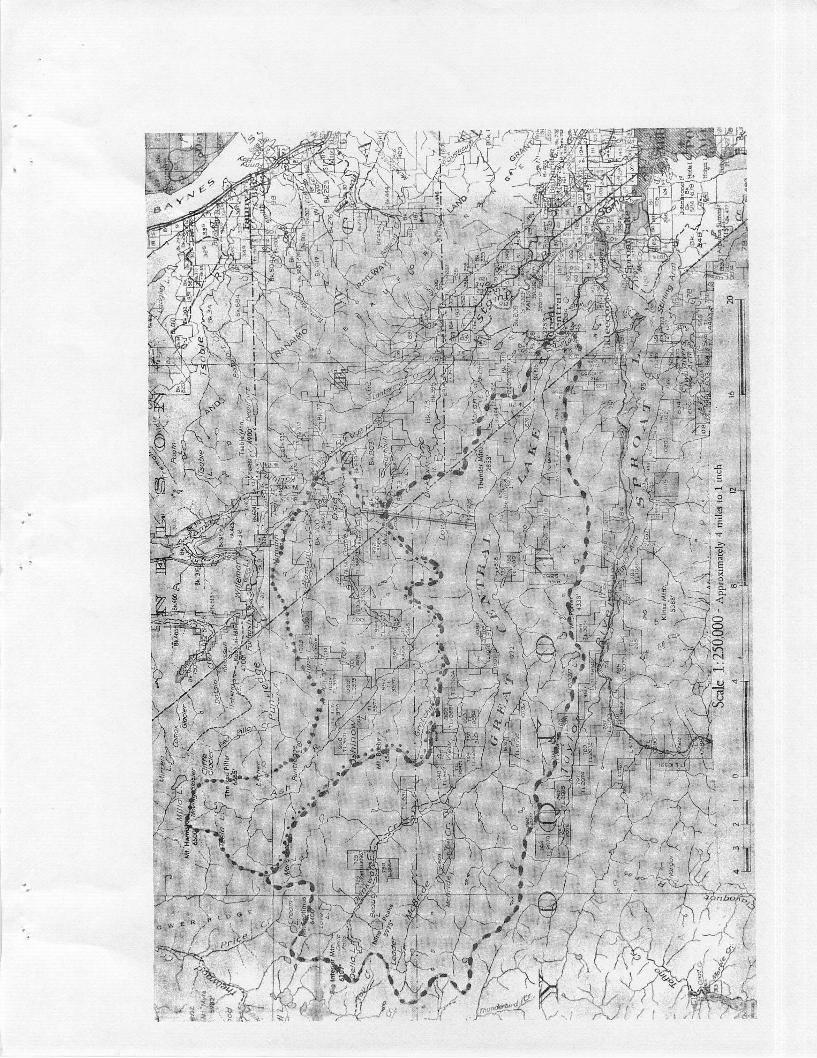
This annex presents preliminary morphometric data on Great Central Lakeon Vancouver Island, B.C. A map showing the location and drainage area nearthe head of Alberni Canal is attached. It is a long, narrow - 20 x 1 mile,steep-sided lake lying east and west. The outlet runs into the Stamp Riverto the east.
The elevation of the lake surface is 83 metres above sea-level. Thelake bottom is approximately 120 metres below sea-level.
A second map shows the land contours for the 500 foot and 1000 footcontours and the 200 metre depth contour extrapolated from them. Previousstudies of the period of the seiche indicate a mean depth of 200 metres,using Merion's formula for long, narrow lakes (Proudman, 1953). This issupported by a few soundings ranging from 212 to 228 metres in the centreof the lake.
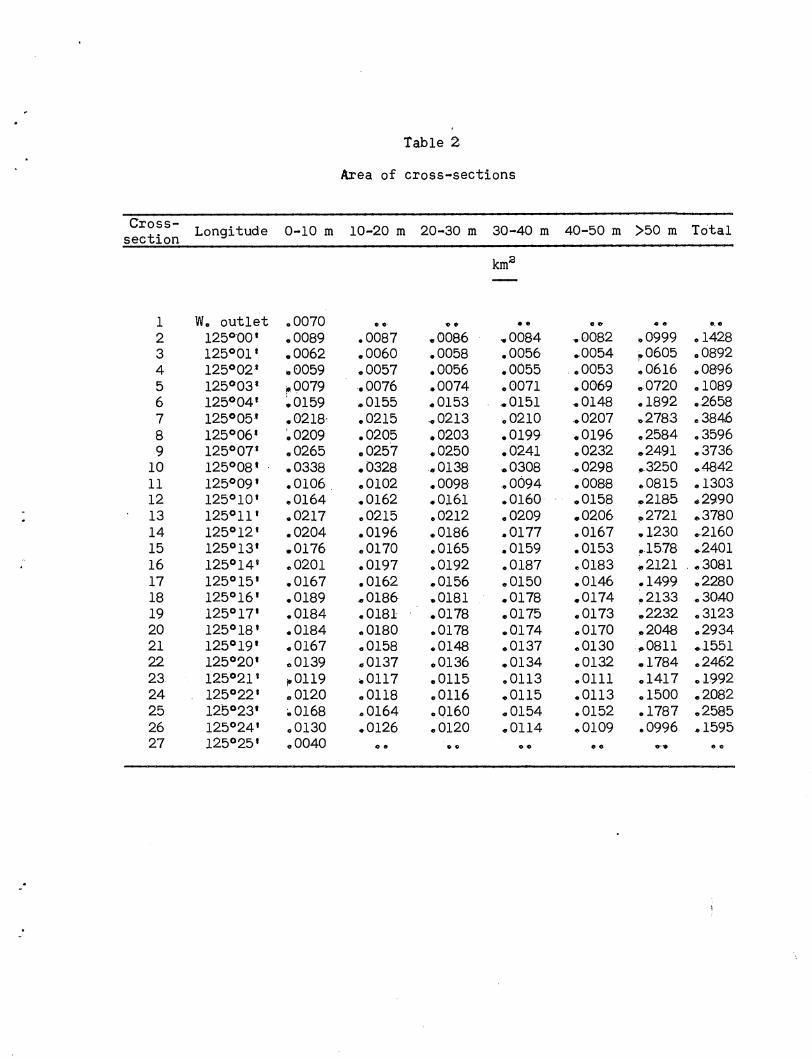
Table 1 presents standard morphometric data. Table 2 gives cross-sectional areas calculated from sections plotted at each minute of longitudealong the lake and Table 3 the volumes for standard depths and surface areasof the 26 sections of the lake. Table 4 presents discharge data from thelake and for comparison the long-term mean at a station farther downstream.Very high and very low discharges take place from the lake from October toMarch accompanied by quick rise and fall of the lake surface. In late summerthe near constant flow of 1.2 x l(fm3/day (500 c.fcS.) from the hydro-electricplant near the lake centre is a major part of the lake inflow.
References
Proudman, J. 1953. Dynamic Oceanography. Methuen 6c Co., London.
Department of Energy, Mines and Resources - Pacific Coast Drainage.
Department of Lands and Forests, British Columbia - National TopographicSeries Maps.

Table1
MorphometricdataforGreatCentralLake
Area
Volume
kiri3
Mean
depthm
Lengthkm
Shoreline%drainage**
Lakesectionskm2Miles11LengthDevelop.*
km
areainflow
Gt.Central51.0219.707.5120033.772*12.85100
SectionNo.26125°25'-24«
1.050.410.11001.340
Section26-11
125°25«-09*
32.1912.434.7120021.22*8577
Section10-1125°09*-outlet
18.837.272.8020012.52*8523
Shorelinelength
^Shorelinedevelopment-2^xArea
©no***Mostofinflowtolakewillbefromhydro-electricplantatlongitude125-09
atsection10underdroughtconditions.
roroioN>roN>roN>»-«i—h->\~*i->\-*\->\->^O^Oi^COfOHOvOOO>JONai^CON)H-'OvOCO-gaNCJi-^OOfOl-'
rotoiotok>tototorotororotok>rorotororotoroto10toroto(jicnoic^cj'Oioioioicnaiaiaiaioiu^oiaic^00000000000000000000060000K)|OION)tO|OHHHHHHHHHHOOOOOOOOOOcn^a)ivo^ovooo<i^ai4^coN5i^ovo(x>-goNOi4^coto^o
o
cr+I—•
0
46»0-«<»«••••««•*9••4•'•«•-»•«•4©
oooooooooooooooooooooooooooOHHHHHHHh,HHlOl-'N3[OHH(OfOION)l-'00000^CO(>N5l^CjO^OOOOCX)^O^Of--'ONOCA3C>OI-'Oi-^OiO^OO->IOOOOOvOvO^^^vO^HON^vl^ONOOOlvOOOvOvOvOfOvOO
06&4404»«96o4044*«
000000000000000 00000!--•I—•I—•
tOOH*On^00-q-sj
4444*
^^^^ooooo[OHpcoiororoh'Oooo
COCJiOOOOOOONvO^vOHO^OtOCJlOl-'Oi^OlOOO•OOOHC^fO^OOOiIOrOOOv]OlCJ1(JiO^-4O-sj
OOOOOOOOOOOOOOOOOOOOOOOOOMMMMHHHHHHHHHN)HOHIO|ON)HOOOO«
co£^^a)oivo^coi^^NOoocjio^aj^cji^a>« ^4->J00O*nOOn001—*v"*v*-'wwu1—u»*>jwvva>00(»h^0N|OOi^IOl--'CP00OCj00JCj0^0N000N OOONCJiOn
OOOOOOOOOOOOOOOOOOOOOOOOOMHHHHHHHHHPHHN)POWlS)HN)HOOOOi^U1HjI-^(a)CO^^^CJ100CJ1-s300nvOO-^.vOi-'01->J01(J1004^^0iC0^^4^CJiOOO->3vO-gvOO^OOi--'vOO^l-'OiON^
4464444444«44««4*444*444*
OOOOOOOOOOOOOOOOOOOOOOOOOh-«h-«I—•h-'HHHHHHHHHlOHOtOIOHlOHQOOp'OCJi^^COCAN^^^^OOCJiONOOiOOvOCOvOO^ONCnCJiOO^vOtOG3I^^OOCO^(>a3CO^(^OOOOOON>^^CD\000£>10
•4©o*
Of—l-*l-»h_•vO^CH-J^^OO^,-«"vOOOOHGOH^CO
ON^o-^^i-'Ooro
04'4"••"*'•«'**•'4.*4***•"#'«
ON)rON)H|OHHfO|OOWN)N)IOHOOOO-rOi-'4^h-'<JiK)->Ji-'00!O^C^-«>j00-^ONON\O
W\0|O^CON)00HCJiv00000\OlOHOv0QvOHOooHOioioH^cjorooo^uivo
444444444444444.4
h-iotoh-'toi-'roGoooiocoforocjofoi-'OiOlO^D^aivOHOfOO^l-JN]NOCOvOQPQOvDOnCJIOOIO^OOQOOOnOOvOO.__oiaiiONDiop^coooHHOoowrooo
$COWCOfOHOOP-JUIOOOO0D00^
Jn,Ca3vOJ^U100vOvO|0^—-ONOOvOONrooo
3M
cdQOHc+OH»0)O0)31
I-4oD
H«
aCD
oI
o
3
too
tooI
COo
COo
o
4^oI
01o
V(Jlo
HO.c+
CDQ>.
OHi
OHHo>Ocr0)H-
COCD1
0)toCDO
<+H»
O
P0)

Table 3
Volumes and surface areas of sections between minutes of longitude.
Sections 0-10 m 10-20 m 20-30 m 30-40 m 40-50 m >50 m
kmc
Surface Surface
area area
km* mi"
1 (east) .0047 4><4 « « 4 4 P 4 .0 4 .4800 0.19
2 .0092 .0089 .0088 .0085 *0083 ,*0-97£- .9299 0.36
3 .0073 .0071 .0069 .0067 .0065 .0744 .7470 0.29
4 .0084 .0081 .0079 .0077 .0074 .0814 .8537 0.33
5 .0145 .0141 .0138 .0135 .0132 .1593 1.4635 0.57
6 .0230 .0226 .0223 .0220 .0216 .2851 2.3172 0.89
7 .0260 .0256 .0254 .0249 .0246 .3273 2.6220 1.01
8 .0289 .0282 .0276 .0268 .0261 .3095 2.9270 1.13
9 .0367 .0357 .0347 ,0335 .0323 .3501 3.7349 1.44
10 .0270 .0262 .0254 .0245 .0236 .2479 2.7532 1.06
11 .0165 .0161 .0158 .0155 .0150 .2618 1.6708 0.65
12 .0232 .0230 .0227 .0225 .0222 .2992 2.3477 0.91
13 .0257 .0251 .0243 .0235 .0227 .2409 2.6221 1.01
14 .0232 .0223 .0214 .0205 .0195 .1712 2.3782 0.92
15 .0230 .0224 .0218 .0211 .0205 .2256 2.3477 0.91
16 .0224 .0219 .0212 .0205 .0201 .2207 2.2867 0.88
17 .0217 .0212 .0205 .0200 .0195 .2215 2.1952 0.85
18 .0227 .0223 .0219"' .0215 .0212 .2662 2.2867 0.88
19 .0225 .0220 .0217 .0213 .0209 .2610 2.2714 0.88
20 .0214 .0206 .0198 .0190 .0183 *1744 2.1780 0.84
21 .0186 .0180 .0173 .0165 .0160 .1582 1„8903 0.73
22 .0157 .0155 .0153 .0151 .0148 ^1952 1.5854 0.61
23 .0145 .0143 .0141 .0139 .0137 .1779 1.4630 0.56
24 .0175 .0172 .0168 .0164 .0162 ♦2004 1*7684 0.68
25 .0182 .0177 .0171 .0163 .0159 .1697. 1.8446 0.71
26 (west) .0104
.5029
o •
.4761
* * ••O"0 •«9"» 14-*- 1.0519 0.41
Totals .4645 .4517 .4401 5.1767

1962-1963
Mean*
Maximum
Minimum
1963-1964
Mean
Maximum
Minimum
1914-1942
Mean**
Stamp R.+ Ash R.
Table 4
Discharge from Great Central Lake in cubic feet per second
Oct. Nov. Dec. Jan. Feb. Mar. Apr. May Jun. Jul. Aug. Sep,
3640 3840 5420 2440 3960 1880 2010 1960 1490 1280 $39 10406800 6560 9180 6230 11000 3860 3200 3000 1660 1420 1110 \12301520 1220 3080 700 700 560 1400 1430 1230 1150 605 864
4110 4480 3780 3460 1930 1250 1240 2070 3200 2450 1190 15509380 6380 9160 6620 2670 1650 1560 2840 5530 5740 1570 2620910 3060 1590 1850 1360 880 940 1400 1440 1180 988 1030
2510 2780 3640 3220 2850 2250 2510 2920. 2730 1470 730 810
Minimum discharge - 160 c.f.s. or 0.39 x 10⁶ m3/day -Oct. 1916.Maximum discharge - 13,100 c.f.s. or 32.05 x 10s m3/day -Jan. 1961.Yearly mean discharge - approx. 6 x 10* m/3/day.
*Drainage area 180 square miles. Includes 500 crf.s. or 1.2 x 10s m3/ciay fromAsh R. hydro-electric plant.
** Drainage area 336 square miles.
=#/
rtrrt——•*— r
«l
©6y --Sis,
2Sf31I • • \ ' <. - - , ' •
,,!'• - : :, ... , i .< '. \: .•
' ' ^ r {
W7%Z \ i! ", •" •
CR * fg *fyg\ „> %*$< 2 • / x • -""s : t ma I w^WW *' J '•. |-.:H .!••,...•, ' ♦ "» I , V• <.A h '. - • j , * \%a^Crvi * r ^ —•• ••••'•••'*"-s«\*'T«i' o —-»\^ •
^te
l /•;"'_Xn
SiX
f'C>'
i A
1 /**
) V
*3j•]
UP (>. 4
' Hi i
'3
>*
' Pi ^nr
„-#
=*T5Pj| p $M?aT~B
i —5 * r^*»GW Hi
iSifi Xs-
#V J^
-*\ ' f)
:""-'y ,:
J .\ j ,- # ' ?
. «•-; ',1-
/) lN \ I/lie f'TA' »,,:!!?';!
jr
»//;
7 V/vi r
»i!,^% k-'5 <,..
L*£g
H
\k
3 IS H
::
s
e
m-\-j a.
\, <~f if.O} ofco-
,/r";1 o "*Tl1
/i-1 a
.1
^- ""-:.

oh
9«
I25°25'I25°0tf
49*2$49°25l
49^0'49*20*
GREATCENTRALLAKE
ttwar2FTyiTOtfI25W^

Annex III
Simulation of the effects of nutrient enrichment
A trial examination of the effects of fertilization was made using anexisting simulation model. An example of simulated sequences of zooplanktonbefore and after fertilization is shown in the accompanying figure.
For the unfertilized condition a phytoplankton doubling time of about 6.5days was assumed. The effect of nutrient enhancement was taken to approximatelydouble the plant growth rate. All other parameters were the same for the twosequences, including the fraction (seasonally varying) of zooplankton taken bypredators. The zooplankton grazing and physiological parameters were selectedarbitrarily from data on marine organisms. The initial stocks were selected togive unfertilized sequences of zooplankton similar to those presently observedin the lake, but otherwise no attempt was made to make the simulation consistentwith the foregoing calculation.
Fertilization (or rather, doubling the plant growth rate) increasedproduction and peak stocks by about an order of magnitude and resulted in afall bloom similar in size to the unfertilized peak bloom. Also prominent isthe effect of nutrient enhancement in giving peak stocks and production about40 days earlier than in the original condition. Earlier peaking could, in theextremes, either enhance the production of sockeye competitors, or benefit theemigrating fry, depending on the exact timing.
The marked shift in the time of maximum production is partly a consequenceof the assumption, in the model, that all enrichment occurred prior to thebeginning of the growth season, and because seasonal variations in mixing werenot taken into account. Incorporating the latter C**ot shown) delays the peakssomewhat.
The proposal is to space enrichment throughout the productive season inorder to avoid undesirable peaking, but ultimately equilibrium levels of ^ -*enrichment might be attained such that the simulated timing would occur.However, other simulations suggest that increasing the early predation on thezooplankton, as would occur with fry enhancement and increased fry size, hasthe effect of delaying the time of the peak zooplankton stock and spreadingits production more evenly through the season.
Simulation also suggests that even very small fluctuations below theoriginal rate of plant growth can have drastic effects on the production ofthe zooplankton.
Needless to say, the above simulation is necessarily largely speculativedue to the paucity of data and the fact that available observations do notappear to have been planned with the above type of applications in mind.Regular observation of primary production and chlorophyll^a (say at weekly or10-day intervals, even if at only one or 2 stations), continuance ofzooplankton observations, and better knowledge of seasonal distributions ofgrowth and mortality of the fish would, at the very least, permit more detailedspeculation on the likely course of salmon enhancement and fertilization. Theequally important need for physiological and other experimental work would beeasiest done within the operating radius of the Nanaimo Station.

F
APRIL MAY
HEAVY LINES-ZOOPLANKTON
LIGHT LINES-PHYTOPLANKTON
IJUNE JULY AUG.
Fig. A Simulated effect of nutrient additions. (Solid lines, originalstock sequence; dashed lines, sequence after doubling the plantgrowth rate by fertilization.)