Using Topological Data Analysis for diagnosis pulmonary ...
20
Using Topological Data Analysis for diagnosis pulmonary embolism Matteo Rucco *1 , Lorenzo Falsetti 2 , Damir Herman 3 , Tanya Petrossian 3 , Emanuela Merelli 1 , Cinzia Nitti 2 , Aldo Salvi 2 1 University of Camerino, School of Science and Technology, Computer Science Division, Camerino, IT 2 Internal and Subintensive Medicine of Ospedali Riuniti - Ancona, IT 3 Ayasdi, Inc. Palo Alto, CA Email: Matteo Rucco * - [email protected]; Lorenzo Falsetti - [email protected]; Damir Herman - [email protected]; Tanya Petrossian - [email protected]; Emanuela Merelli - [email protected]; Cinzia Nitti - [email protected]; Aldo Salvi - [email protected]; * Corresponding author Abstract Background Pulmonary Embolism (PE) is a common and potentially lethal condition. Most patients die within the first few hours from the event. Despite diagnostic advances, delays and underdiagnosis in PE are common. Moreover, many investigations pursued in the suspect of PE result negative and no more than 10% of the pulmonary angio- CT scan performed to confirm PE confirm the suspected diagnosis. To increase the diagnostic performance in PE, current diagnostic work-up of patients with suspected acute pulmonary embolism usually starts with the assessment of clinical pretest probability using plasma d-Dimer measurement and clinical prediction rules. One of the most validated and widely used clinical decision rules are the Wells and Geneva Revised scores. However, both indices have limitations. We aimed to develop a new clinical prediction rule (CPR) for PE based on a new approach for features selection based on topological concepts and artificial neural network. Results Filter or wrapper methods for features reduction cannot be applied to our dataset: the application of these algorithms can only be performed on datasets without missing data. Alternatively, eliminating rows with null 1 arXiv:1409.5020v1 [physics.med-ph] 17 Sep 2014
Transcript of Using Topological Data Analysis for diagnosis pulmonary ...
Using Topological Data Analysis for diagnosis pulmonaryembolism
Matteo Ruccolowast1 Lorenzo Falsetti2 Damir Herman3 Tanya Petrossian3 Emanuela Merelli1 Cinzia Nitti2 Aldo Salvi2
1University of Camerino School of Science and Technology Computer Science Division Camerino IT2Internal and Subintensive Medicine of Ospedali Riuniti - Ancona IT3Ayasdi Inc Palo Alto CA
Email Matteo Ruccolowast- matteoruccounicamit Lorenzo Falsetti - lorenzofalsettiospedaliriunitimarcheit Damir Herman -
damirayasdicom Tanya Petrossian - tanyaayasdicom Emanuela Merelli - emanuelamerelliunicamit Cinzia Nitti -
cnittiospedaliriunitimarcheit Aldo Salvi - asalviospedaliriunitimarcheit
lowastCorresponding author
Abstract
Background
Pulmonary Embolism (PE) is a common and potentially lethal condition Most patients die within the first few
hours from the event Despite diagnostic advances delays and underdiagnosis in PE are common Moreover
many investigations pursued in the suspect of PE result negative and no more than 10 of the pulmonary angio-
CT scan performed to confirm PE confirm the suspected diagnosis To increase the diagnostic performance in
PE current diagnostic work-up of patients with suspected acute pulmonary embolism usually starts with the
assessment of clinical pretest probability using plasma d-Dimer measurement and clinical prediction rules One
of the most validated and widely used clinical decision rules are the Wells and Geneva Revised scores However
both indices have limitations We aimed to develop a new clinical prediction rule (CPR) for PE based on a new
approach for features selection based on topological concepts and artificial neural network
Results
Filter or wrapper methods for features reduction cannot be applied to our dataset the application of these
algorithms can only be performed on datasets without missing data Alternatively eliminating rows with null
1
arX
iv1
409
5020
v1 [
phys
ics
med
-ph]
17
Sep
2014
values in the dataset would reduce the sample size significantly and result in a covariance matrix that is singular
Instead we applied Topological data analysis (TDA) to overcome the hurdle of processing datasets with null
values missing data A topological network was developed using the Iris software (Ayasdi Inc Palo Alto) The
PE patient topology identified two flares in the pathological group and hence two distinct clusters of PE patient
populations Additionally the topological netowrk detected several sub-groups among healthy patients that likely
are affected with non-PE diseases to be diagnosed properly even though they are not affected by PE in a next
study we will introduce also the survival curves for the patients TDA was further utilized to identify key features
which are best associated as diagnostic factors for PE and used this information to define the input space for a
back-propagation artificial neural network (BP-ANN) It is shown that the area under curve (AUC) of BP-ANN
is greater than the AUCs of the scores (Wells and revised Geneva) used among physicians
Conclusions
The results demonstrate topological data analysis and the BP-ANN when used in combination can produce
better predictive models than Wells or revised Geneva scores system for the analyzed cohort The new CPR can
help physicians to predict the probability of PE A web-version of the BP-ANN has been published and it can be
tested at the address httpcudaunicamit
Keywords
Clinical Prediction Rule (CPR) Pulmonary Embolism Topological Data Analysis Artificial Neural Network
(ANN) Computer Aided Detection CAD
BackgroundA novel computer-aided diagnosis for Pulmonary Embolism
Several statistical and machine learning techniques have been proposed in the literature to deal with output
of implicit or explicit rules and good classification performance [1 2] Most available techniques such as
linear discriminant approaches multilayer perceptrons or support vector machines are able to achieve a
good degree of provisional accuracy but these methods lack accuraccy sufficient for the implementation of
computer-aided diagnosis (CAD) for pulmonary embolism diagnosis Different studies have been developed
for CAD system predicting development of PE in patients Tang et al used data from the Shangai Xin Hua
Hospital Tourassi et al and Patil S used the data collected from the collaborative study of the Prospective
Investigation of Pulmonary Embolism Diagnosis (PIOPED) and built neural network [34] To improve the
2
performance of a CAD we built a new system based on topological data analysis and statistical approach
for features selection to define the input space for theartificial neural network The result of the CAD must
be interpreted as a new CPR that might be used to assign a probability of an occurrence of PE [5]
Pulmonary Embolism
Pulmonary embolism (PE) is a relatively common and potentially lethal condition affecting a proportion
between 004 and 009 of the general population [67] and ranging in most of the cohorts of outpatients
with suspected PE between 8 and 12 [89] Among patients who die of PE the largest part is observed
in the first few hours from the acute event [10] Despite diagnostic advances delays in PE diagnosis are
common and represent an important issue [11] As a cause of sudden death PE is second only to arrhythmic
death Among survivors recurrent embolism and death can be prevented with prompt diagnosis and therapy
Current clinical guidelines suggest to perform a first-level clinical stratification based upon patientrsquos history
clinical findings and in some cases physicianrsquos judgment For this purpose several clinical prediction
rulers (CPR) have been suggested and validated and are currently in use in common clinical practice
[8912] Subsequent management of the patient relies mainly on this stratification Patients at high-risk for
PE should immediately undergo a computed tomography pulmonary angiography (CTPA) while patients
with intermediate or low pretest probability should be tested for high-sensitive dDimer assay [12] Only
patients with increased dDimer levels should be further investigated with second level examinations CTPA
is currently the most widely accepted imaging method recommended to confirm a suspect diagnosis of PE
However increasing evidences and its direct and indirect costs suggest a limitation in its use CTPA has
been associated to increased risk of secondary cancer from radiation exposure [13] and contrast-induced
nephropathy [14] Another interesting point is that current use of 64-slices detectors has increased the
frequency of subsegmental PE diagnoses this finding in the absence of a documented deep vein thrombosis
(DVT) may cause clinical uncertainty and lead to unnecessary therapies [15] Echocardiography is currently
recommended for shocked patients with high suspect of PE For haemodinamically stable patients it is
currently recommended only to better stratify the prognosis by detecting right ventricle dysfunction (RVD)
[12] Biomarkers such as BNP and troponin are used to assess disease severity and associated to right
ventricle overload or damage but are currently not included in diagnostic algorithms
3
Clinical Prediction Rules
The extreme aspecificity and the variety of the clinical presentation and symptoms and the slenderness of
the clinical signs of PE are cause on a side of the proven underdiagnosis on the other of an excess of negative
examinations performed The positive CTPA rate is very low - less than 15 of the overall number of
exams performed for suspected acute PE [16] Recent studies have demonstrated the safety of rejecting
the diagnosis of PE by the combination of a low clinical probability assessed by a CPR and a normal
quantitative d-Dimer test result thereby decreasing the need for further diagnostic radiological imaging
in up to 30 of patients [17] The most widely used CPRs are the Wells rule (table on page 18) and
the Geneva Revised score [10] The Wells score has three different risk categories and more recently it has
been simplified assuming two risk categories with a cutoff set to 4 Perrier et al has been successful in
generating a model based solely on objective parameters using the Geneva Revised score [12] This CPR
is easily standardizable and has been validated internally and externally although less extensively than
the Wells rule Both scores appeared to have a comparable predictive value for PE Regardless of the rule
being performed the proportion of patients with PE is around 10 for low probability 30 for moderate
probability and 65 for high clinical probability category It is important to note that these scores have
severe limitations The Wells rule includes the physicianrsquos judgment of whether an alternative diagnosis
is more likely than PE [11 12] This criterion which carries a major weight in the score is subjective and
cannot be standardized Moreover it has been suggested that the predictive value of the Wells rule is derived
primarily from its subjective component [18] The Geneve Revised score is based on 13 entirely objective
variables requires a blood gas analysis while breathing room air Interestingly these parameters have only
been evaluated for patients in ED with a clinical performance result not superior to the Wells score
Topological data analysis
Topological Data Analysis (TDA) is a method to analyze multidimensional complex data primarily driven
by geometry TDA is a result of over a decade of research in applications of pure mathematics to practical
problems The main idea of this approach is that the shape of the data in an abstract multidimensional
space drives the analysis by exploring the parallelism of a large number of machine learning algorithms The
three fundamental concepts of TDA are independence of coordinate systems insensitivity to deformation
and compressed representation [19] A typical example of insensitivity to deformation would be writing in
a different font as long as the underlying meaning is preserved while compressed representation refers to
approximating a complex shape such that of a circle with a hexagon Using a mathematical concept of
4
lenses [20] data can be projected onto a subspace suitable for visualization The topological features of the
subspace are then inspected with traditional statistical approaches such as Kolmogorov-Smirnov or t-test
analysis We applied TDA to the clinical data of patients suspected of high risk of PE and used shapes of
the generated topological networks on page 16 to identify different subgroups of patients and features that
statistically significantly explain the observed differences We used the TDA-derived features as input into
artificial neural network analysis
Artificial Neural Network
A complex system may be decomposed into simpler elements in order to be able to understand it Also
simple elements may be gathered to produce a complex system in line with the approach divide et impera
Networks are one approach for achieving this There are a large number of different types of networks but
they all are characterized by the following components
bull a set of nodes
bull connections between nodes
The nodes can be treated as computational units They receive inputs and process them to obtain an
output The connections determine the information flow between nodes The interactions of nodes though
the connections lead to a global behavior of the network which cannot be observed in the elements of the
network This global behavior is said to be emergent meaning that the abilities of the network supersede
the ones of its elements Networks can be used as very powerful tool because many systems can be assembled
into a systems-like network space applications including proteins computers and communities One type
of network uses nodes as artificial neurons and an artificial neuron is a computational model inspired by the
natural neurons Natural neurons receive signals through synapses located on the dendrites or membrane
of the neuron When the signals received are strong enough (greater than a certain threshold) the neuron
is activated and emits a signal though the axon This can activate a cascade process The complexity of
real neurons is highly abstracted when modeling artificial neurons These basically consist of inputs which
are multiplied by weights and then computed by a mathematical function that determines the activation of
the neuron Another function computes the output of the artificial neuron (sometimes in dependence of a
certain threshold) Weights can also be negative so we can say that the signal is inhibited by the negative
weight Depending on the weights the computation of the neuron will be different By adjusting the weights
of an artificial neuron we can obtain the output we want for specific inputs If we scale an ANN to hundreds
5
or thousands of neurons it is both complicated and labor intensive to manually discover all the necessary
weights However by identifying algorithms to adjust the weights of the ANN in order to obtain the desired
output from the network This process of adjusting weights is called learning or training [3] [21] [22]The
number of ANN types and uses is very high hence there are hundreds of different models considered
as ANNs The differences among them can be related to functions the accepted values the topology of
network andor the learning algorithms etc We applied backpropagation algorithm to perform a layered
feed-forward ANNs This allows us to organize the artificial neurons in layers to send their signals ldquoforwardrdquo
and propagate errors backwards The network receives inputs by neurons in the input layer and the output
of the network is given by the neurons on an output layer There may be one or more intermediate hidden
layers The backpropagation algorithm uses supervised learning which means that we provide the algorithm
with examples of the inputs and outputs we want the network to compute and then the error (difference
between actual and expected results) is calculated The benefit of using backpropagation algorithm is that
this error is reduced until the ANN learns the training data The training begins with random weights and
the goal is to adjust them so that the error will be minimal Further mathematical explanations are detail
in [23] and [24]
Statistical conceptsKolmogorov-Smirnov Test
In statistics the KolmogorovndashSmirnov test (KndashS test) is a nonparametric test for the equality of contin-
uous one-dimensional probability distributions that can be used to compare a sample with a reference
probability distribution (one-sample KndashS test) or to compare two samples (two-sample KndashS test) The Kol-
mogorovndashSmirnov statistic quantifies a distance between the empirical distribution function of the sample
and the cumulative distribution function of the reference distribution or between the empirical distribution
functions of two samples The null distribution of this statistic is calculated under the null hypothesis that
the samples are drawn from the same distribution (in the two-sample case) or that the sample is drawn from
the reference distribution (in the one-sample case) In each case the distributions considered under the null
hypothesis are continuous distributions but are otherwise unrestricted The two-sample KS test is one of the
most useful and general nonparametric methods for comparing two samples as it is sensitive to differences
in both location and shape of the empirical cumulative distribution functions of the two samples [25]
6
Receiver Operating Characteristic
Both Artificial Neural Networks and the two scores (Wells and Revised Geneva) were evaluated by using
receiver-operating characteristic (ROC) analysis Medical tests play a vital role in modern medicine not only
for confirming the presence of a disease but also to rule out the disease in individual patient A test with
two outcome categories such as test + and test - is known as dichotomous whereas more than two categories
such as positive indeterminate and negative called polytomous test The validity of a dichotomous test
compared with the gold standard is determined by sensitivity and specificity [26] The Receiver Operating
Characteristic (ROC) curve is the plot that displays the full picture of trade-off between the sensitivity (true
positive rate) and (1-specificity) (false positive rate) across a series of inherent validity of a diagnostic test
This curve is useful in
bull evaluating the discriminatory ability of a test to correctly pick up diseased and non-diseased subjects
bull finding optimal cut-off point to least misclassify diseased and non-diseased subjects
bull comparing efficiency of two or more medical tests for assessing the same disease
bull comparing two or more observers measuring the same test
Total area under ROC curve is a single index for measuring the performance a test The larger AUC -
Area Under Curve - the better is overall performance of the medical test to correctly identify diseased and
non-diseased subjects Equal AUCs of two test represent similar overall performance of tests but this does
not necessariy mean that both the curves are identical [27]
Jaccard Similarity Coefficient
The Jaccard Similarity coefficient is a statistic used for comparing the similarity and diversity of sample
sets The Jaccard coefficient measures similarity between sample sets and it is defined as [28]
J =|DD capAD||DD cupAD|
(1)
where
bull Doctor diagnosis -DD
bull ANN diagnosis - AD
7
ResultsTopological data analysis results
Topologial data analysis was applied on the PE dataset to generate the network in figure (see on page 16)
using AYASDI-Iris (Ayasdi Inc Palo Alto) We color in red the pathological patients and in blue the healthy
group IRIS highlighted two flares and a longer tail in the pathological group From the comparison of the
two flares we selected a sub-set of features characterized with high Kolmogorov- Smirnov and low p-value
(see table on page 20) The information extracted from the comparison of the two flares is that there is a
sub-group of patients who is characterized by the recurrence risk to be affected by PE IRIS detected some
sub-groups among healthy patients which present other diseases to be diagnosed properly even though they
are not affected by PE
Comparison of AUC Wells Geneva and ANN
From the patientsrsquo dataset we random selected 152 patients 101 pathological and 51 healthy and we studied
the discriminatory ability of the system Tables 5 and 6 on page 20 show the performance of three classifier
Wells score revised Geneva score and the ANN model Any of the three AUC was statistically significant
different The comparative study of three AUCs has been made with the software MedCalc for Windows
version 9500 (MedCalc Software Mariakerke Belgium) [29] The AUCs of Revised Geneva and Wells score
obtained from the analysed dataset are directly comparable with the results previously published in literature
by other groups [30] Figure (see on page 16 and on page 17 ) showed the ROC curves of three classifiers
they were evaluated by leave-one-out method [31] The difference between the AUC of the new classifier
both with revised Genevarsquos AUC and Wellsrsquo AUC was statistically significant at the 95 confidence level
P minus value lt 00001 and P minus value = 00025 respectively Instead the difference between revised Genevarsquos
AUC and Wellsrsquo AUC is not statistically relevant P minus value = 01456 Thus the networkrsquos discriminant
power is significantly The Jaccard coefficient for the ANN is J = 088 as every informatics system also the
ANN-classifier is affected by the round problem ie the probability value of occurrence of PE in range [045
05) is rounded to 05 then the patient is classified as pathological At the state of the art we left to the
physician the final judgment over this situations [32ndash35]
Conclusions
The study derives a new CPR for pulmonary embolism and evaluating patientsrsquo cohort characteristic with
a topological approach The new CPR has been obtained training an artificial neural network on the input
8
formed by a set of features selected by Iris Iris extracted new knowledge from the patientsrsquo dataset by
the application of an innovative approach for data analysis Topological Data Analysis Our results show
that the feature selection strategy is beneficial for the performance improvement of an ANN trained on the
analyzed cohort A three-layer neural network can be trained to successfully perform the diagnostic task
In conclusion a system based on Iris and an ANN can form the basis of a CAD system to assist physicians
with the right stratification of patients A web-version of the BP-ANN has been published and it can be
tested at the address httpcudaunicamit In the future we will perform a validation of the system both
increasing the number of patients in the dataset and using different cohorts we will perform a comparison
study among artificial neural networks and other classification systems Our dataset allowed us to increase
the clinical performance of about 20
MethodsPatients and patientsrsquo dataset preparation
From a cohort of 1500 patients accepted in the department of Intensive and Subintesive medicine from 2009
to 2012 at Ospedali Riuniti di Ancona a total of 987 patients of average age 70 years were included The
inclusion criteria for this study were that the patients at least were recorded with Wells score Revised Geneva
score d-Dimer and blood gas PO2 the cutoff of d-Dimer was 230ngml For each patients 26 variables were
collected (see table on page 19) In these patients the diagnosis of PE and the exclusion of PE were made
by angio-CT Among these 793 had PE and 147 did not have PE Characteristics of the history objective
data from the physical examination and the outcome of d-Dimer analysis were tabulated for each patient To
improve the interpretability of our data the logarithm transformation has been applied to d-Dimer and WBC
(white blood count) In the present work we analyzed only outpatients The patientsrsquo dataset was processed
using topological data analysis with Ayasdi IRIS specifications Ayasdi IRIS-ready data files are composed
of rows and columns The calculations are performed on a row-by-row basis and the results elucidate the
columns (features) that best define and explain particular groups of rows The Ayasdi Iris data format is a
matrix with unique column headers and unique row identifiers Column headers must uniquely identify the
columns In contrast the column that uniquely identifies the rows may be in any column position it does
not have to be the first or the last column
9
Classical approaches for feature selection
Filter or wrapper methods for features reduction can not be applied to our dataset the application of
these algorithms can be done on a dataset without missing data The elimination of rows with null values
from our dataset would reduce extremily the number of samples and the covariance matrix is singular (ill
conditioned) [36]
Topological Data Analysis features selection
From the patientsrsquo dataset we selected only d-Dimer Revised Geneva score and Wells score for the analysis
and Variance Normalized Euclidean as metric function (equation 2) The Variance Normalized Euclidean
metric is utilized when data are comprised of disparate quantities that are not directly comparable The
filters were L-Infinity centrality which assigns to each point the distance to the point most distant from it
and final diagnosis L-infinity centrality is defined for a data point x to be the maximum distance from x
to any other data point in the set Large values of this function correspond to points that are far from the
center of the data set (equation 3) It is also useful to use some filters that are not geometric in that they
do depend on a coordinate representation such as coordinates in principal component or projection pursuit
analysis The parameters of the configuration were resolution 60 gain 30x equalized on (see figure on
page 16) [19]
D(h1 h2) =
radicradicradicradic dsumi=1
(h1(i)minus h2(i))2
σ2i
(2)
f(x) = maxyisinX
d(x y) (3)
Artificial Neural Network Architecture
The neural network used in our study had a three-layer feed-forward architecture and was trained by using
the back-propagation algorithm with the sigmoid activation function According to this learning scheme
the network tries to adjust its weights so that for every training input it can produce the desidered output
During the training phase the network is presented with pairs of input-output patterns supervised learning
It has been shown that this technique minimizes the mean squared error (MSE) between the decider and
the actual network output following an inteative gradient search technique The input of the network is a
subset of the patientrsquos dataset formed with all the patients but only with selected features by TDA (see
table on page 20) Specifically our network had a hidden layer with 3 nodes and an output layer with a
single decision node The network was trained to output 1 if PE was present and 0 if not In this study
10
the networkrsquos output was interpreted as the probability of PE being present In addition input data were
scaled to -1 and +1 The learning rate was selected to be 05 and the momentum coefficient to be 09 the
optimal number of iterations (epochs) have been found equal to 660 after the execution of 100 trials with
the permutations of rows in the patientsrsquo dataset
SoftwaresIRIS
Topological data analysis has been performed using the Iris software [37] properties of Ayasdi Inc Iris
uses the concepts of metric and lenses Metric is a distance or similarity measure between point Lenses
are mathematical functions through which you see the data points Different lenses emphasizing different
aspects of the dataset and different networks will be generated Lens executes the division of data points in
overlapping bins Through the bins the data are clustered Each cluster is represented by a node default
node size is proportional to the number of data points in the cluster IRIS connects nodes when corresponding
clusters have common data points During IRIS exploration there are two parameters attached to the lens
that allow you to control how the data is divided in the bins One of these is resolution which corresponds
to the number of bins is put into
bull low resolution coarse view of data
bull high resolution detailed view and possibly fragmented into singletons
Another lens parameter is gain Gain controls how much overlap there is between bins Increasing the gain
increases the number of edges in the output Oversampling highlights relationship within the data Finaly
the commands equalize distributes the data points in the bins so that each bin has an equal number of data
points
RULEX 20
The ANN has been implemented by the Rulex software suite [38] The Rulex software developed and
commercialized by Impara srl is an integrated suite for extracting knowledge from data through statistical
and machine learning techniques An intuitive graphical interface allows to easily apply standard and
advanced algorithms for analyzing any dataset of interest providing the solution to classification regression
and clustering problems To build classifiers we used a number of graphical components provided by Rulex
20 We utilized Visualization and editing components to visualize and export the confusion matrix the
11
training and validation sets the results of the classifier to access statistical data (eg Covering Error and
Relevance)
List of abbreviations
CPR clinical predictive rule CAD computer aided detection ANN artificial neural network TDA topo-
logical data analysis PE pulmonary embolism DVT deep venous thrombosis angio-CT angiography
computed tomography K-S or KS Kolmogorov-Smirnov test ROC receiver operating characteristic FP
false positive TN true negative FN false negative TP true positive DD doctor diagnosis AD artificial
neural network dianosis AUC area under curve WBC white blood count MSE mean sqared error
Competing interests
Damir Herman and Tanya Petrossian are employees of Ayasdi Inc and hold stock in the company The
authors declare that they have no competing interests
Authorrsquos contributions
Emanuela Merelli Aldo Salvi Lorenzo Falsetti and Cinzia Nitti andconceived the project supervised the
study Lorenzo Falsetti wrote the clinical background Matteo Rucco designed the experimental flowchart
performed the computer experiments and wrote the manuscript
Acknowledgements
We acknowledge the department of Internal and Subintensive medicine of Ospedali Riuniti di Ancona -
Torrette for the patientsrsquo dataset the financial support of the Future and Emerging Technologies (FET)
programme within the Seventh Framework Programme for Research of the European Commission under
the FET- Proactive grant agreement TOPDRIM (Topology-driven methods for multievel complex systems)
number FP7-ICT-31812 Francesco Vaccarino and Giovanni Petri from ISI foundation for their introduction
to algebraic topology and complex networks Impara srl and Ayasdi Inc for their software products A
special thanks is extendend to Damir Herman for his support during the TDA
12
References1 Cangelosi D Blengio F Versteeg R Eggert A Garaventa A Gambini C Conte M Eva A Muselli M Varesio L
Logic Learning Machine creates explicit and stable rules stratifying neuroblastoma patients BMCBioinformatics 2013 14(Suppl 7)S12
2 Kotsiantis SB Zaharakis ID Pintelas PE Machine learning a review of classification and combiningtechniques Artif Intell Rev 2006 26(3)159ndash190 [httpdxdoiorg101007s10462-007-9052-3]
3 Tourassi G Floyd C Sostman H Coleman R Acute pulmonary embolism artificial neural networkapproach for diagnosis Radiology 1993 189555ndash558
4 Patil S Neural network in the clinical diagnosis of acute pulmonary embolism Chest 1993 11685ndash1689
5 Tang L Wang L Pan S Su Y Chen Y A neural network to pulmonary embolism aided diagnosis witha feature selection approach In Biomedical Engineering and Informatics (BMEI) 2010 3rd InternationalConference on Volume 6 Oct2255ndash2260
6 Tagalakis V Patenaude V Kahn S S S Incidence of and Mortality from Venous Thromboembolismin a Real-world Population The Q-VTE Study Cohort Am J Med 2013 126(9)832e13ndash21 [Doi101016jamjmed201302024 Epub 2013 Jul 3 PubMed PMID 23830539]
7 Silverstein M Heit J Mohr D Petterson T OrsquoFallon W Melton Lr Trends in the incidence of deep veinthrombosis and pulmonary embolism a 25-year population-based study Arch Intern Med 1998158(6)585ndash93 [PubMed PMID 9521222]
8 Wells P Anderson D Rodger M Stiell I Dreyer J Barnes D Forgie M Kovacs G Ward J Kovacs M Excludingpulmonary embolism at the bedside without diagnostic imaging management of patients withsuspected pulmonary embolism presenting to the emergency department by using a simple clinicalmodel and d-dimer Ann Intern Med 2001 135(2)98ndash107 [PubMed PMID 11453709]
9 Wolf S McCubbin T Nordenholz K Naviaux N Haukoos J Assessment of the pulmonary embolism rule-out criteria rule for evaluation of suspected pulmonary embolism in the emergency departmentAm J Emerg Med 2008 26(2)181ndash5 [Doi 101016jajem200704026 PubMed PMID 18272098]
10 Wood K Major pulmonary embolism review of a pathophysiologic approach to the golden hourof hemodynamically significant pulmonary embolism Chest 2002 121(3)877ndash905
11 Kline J Hernandez-Nino J Jones A Rose G Norton H Camargo CJ Prospective study of the clinicalfeatures and outcomes of emergency department patients with delayed diagnosis of pulmonaryembolism Acad Emerg Med 2007 14(7)592ndash8
12 Torbicki A Perrier A Konstantinides S Agnelli G Galie N Pruszczyk P Bengel F Brady A Ferreira DJanssens U Klepetko W Mayer E Remy-Jardin M Bassand J ESC Committee for Practice Guidelines(CPG) Guidelines on the diagnosis and management of acute pulmonary embolism the TaskForce for the Diagnosis and Management of Acute Pulmonary Embolism of the European Societyof Cardiology (ESC) Eur Heart J 2008 29(18)2276ndash315 [Doi 101093eurheartjehn310 Epub 2008 Aug30 PubMed PMID 18757870]
13 Einstein A Henzlova M Rajagopalan S Estimating risk of cancer associated with radiation exposurefrom 64-slice computed tomography coronary angiography JAMA 2007 298317ndash323
14 Mitchell A Kline J Contrast nephropathy following computed tomography angiography of the chestfor pulmonary embolism in the emergency department J Thromb Haemost 2007 550ndash54
15 Brunot S Corneloup O Latrabe V Montaudon M Laurent F Reproducibility of multi-detector spiralcomputed tomography in detection of sub-segmental acute pulmonary embolism EurRadiol 2005152057ndash2063
16 Haap M Gatidis S Horger M Riessen R Lehnert H Haas C Computed tomography angiography inpatients with suspected pulmonary embolism-too often considered Am J Emerg Med 2012 30(2)325ndash30
17 Beck K Holzschuh J Schattauer GmbH - Verlag fur Medizin Naturwissenschaften - The Science of Nature2011
13
18 Sanchez O Trinquar L Caille V Couturaud F Pacouret G Meneveau N Verschuren F Roy P Parent FRighini M Perrier A Lorut C Tardy B Benoit M Chatellier G Meyer G Prognostic factors for pulmonaryembolism the prep study a prospective multicenter cohort study Am J Respir Crit Care Med 201015(181(2))168ndash73
19 Lum P Singh G Lehman A et al Extracting insights from the shape of complex data using topologyScientific Reports - Nature 2013 3561ndash577
20 Singh G Memoli F Carlsson G Topological Methods for the Analysis of High Dimensional Data Setsand 3D Object Recognition In Symposium on Point Based Graphics Edited by Botsch M Pajarola R ChenB Zwicker M Eurographics Association 200791ndash100
21 Lippmann R An introduction to computing with neural nets ASSP Magazine IEEE Apr 4(2)4ndash22
22 Rosenblatt F Principles of neurodynamics Perceptrons and the theory of brain mechanisms Washington Spar-tan Books 1962
23 Rojas R Neural Networks A Systematic Introduction 1996
24 Kauffman SA The Origins of Order Self-Organization and Selection in Evolution New York Oxford UniversityPress 1993
25 Kolmogorov-Smirnov test [httpwwwencyclopediaofmathorgindexphpKolmogorovOT1textendashSmirnov test]
26 Hanley J McNeil B The Meaning and Use of the Area under a Receiver Operating Characteristic(ROC) Curve Radiology 1982 14329ndash36
27 McClish DK Analyzing a Portion of the ROC Curve Medical Decision Making 1989 9190ndash195
28 Jaccard Coefficient [httpwwwstanfordedusimmaureenhqualshtmlmlnode68html]
29 MedCalc [httpwwwmedcalcorg]
30 Penaloza A Melot C Motte S Comparison of the Wells score with the simplified revised Geneva scorefor assessing pretest probability of pulmonary embolism Thromb Res 2011 127(2)81ndash4
31 Picard R Cook D Cross-Validation of Regression Models Journal of the American Statistical Association1984 79(387)575ndash583
32 DeLong E DeLong D Clarke-Pearson D Comparing the areas under two or more correlated receiveroperating characteristic curves a nonparametric approach Biometrics 1988 44837ndash845
33 Griner P Mayewski R Mushlin A Greenland P Selection and interpretation of diagnostic tests andprocedures Annals of Internal Medicine 1981 94555ndash600
34 Metz C Basic principles of ROC analysis Seminars in Nuclear Medicine Annals of Internal Medicine1978 8283ndash298
35 Zweig M Campbell G Receiver-operating characteristic (ROC) plots a fundamental evaluation toolin clinical medicine Clinical Chemistry 1993 39561ndash577
36 Lloyd NT Bau D NUMERICAL LINEAR ALGEBRA In Clinical Chemistry iii edition UK Society forIndustrial and Applied Mathematics 1997xii+361
37 Ayasdi-Iris [httpwwwayasdicom]
38 Rulex 20 [httpwwwimpara-aicom]
14
FiguresFigure 1 - Parallel plots and mean difference
Blu lines parallel plot for pathological patients Red lines parallel plot for healthy patients Green line
difference between mean values of the previous parallel plot only d-Dimer and WBC exhibit a relevant
difference between two classes but it is not enough to diagnose pulmonary embolism
15
Figure 2 - AYASDI-Iris Analysis
IRIS highlighted two flares in the pathological group That means there are two cluster of patients in the PE
population (red groups) also IRIS detected some sub-groups among healthy patients which present other
diseases to be diagnosed properly even though they are not affected by PE (blue groups)
Figure 3 - ANN
Comparison study of ROC curves the AUC obtained with the new classifier is greater then the AUCs from
16
the other two CPRs
Figure 4 - Revised Geneva
ROC curve of Revised Geneva score
Figure 5 - Score Wells
ROC curve of Wells score
17
TablesTable 1 - Revised Geneva Score
Variable PointsPredisposing factorsAge gt 65 years +1Previous Deep Vein Thrombosis (DVT) or Pulmonary Embolism (PE) +3Surgery or fracture within 1 month +2Active malignacy +2SymptonsUnilateral lower limb pain +3Haemoptysis +2Clinical signsHeart rate75-94 beatsmin +3ge 95 beatsmin +5Pain on lower limb deep vein at palpation an unilateral oedema +4Clinical probability TotalLow 0-3Intermediate 4-10High ge11
Table 2 - Wells ScoreVariable PointsPredisposing factorsPrevious Deep Vein Thrombosis (DVT) or Pulmonary Embolism (PE) +15Recent surgery or immobilization +15Cancer +1SymptonsHaemoptysis +1Clinical SignsHeart rate gt 100 beatsmin +15Clinical signs of DVT +3Clinical judgementAlternative diagnosis less likely than PE +3Clinical probability (3 levels) TotalLow 0 - 1Intermediate 2 - 6High ge 7Clinical probability (2 levels) TotalPE unlikely 0 - 4PE likely gt4
18
Table 3 - Dataset
Features Clinical Significance1 ID Patientrsquos identifier2 Age With the increase of the age increase the incidence3 Number Predictive
FactorsAbsolute number of predictive factors
4 Number Risk Fac-tors
Absolute number of risk factors
5 Previous DVT A previous DVT PE is a risk factor repeated infringement DVT PE
6 Palpitations Aspecific symptom If it implies a tachycardia could be associatedwith DVT PE
7 Coughs Symptom very nonspecific but frequently present in patients withDVT PE
8 d-Dimer A value of d-Dimer lt 230ngml is associated with a low risk absent of DVT PE A very high value is associated with a highrisk of DVT PE
9 Systolic Pressure(PAS)
A low PAS is present in patients with DVT PE and hemody-namic shock
10 Diastolic Pressure(PAD)
In cardiogenic shock with DVT PE is low sometimes unde-tectable By itself has no value despite of the PAS
11 Heart Rate (FC) In the patient with TVP EP tachycardia is often found12 Mean Pulmonary
Artery Pressure(PAPS)
It is one of the criteria of right ventricular dysfunction It can benormal in the case of EP low entity
13 White Blood CellsCounter (WBC)
The value increases with inflammatory forms (pneumonia etc )that can be confused with DVT PE
14 Cancer at diagnosis It is a risk factor for DVT EP recognized15 Troponin It is a marker of myocardial infarction or heart failure and can be
confused with DVT PE16 Shockindex It is the ratio between PAS and FC if it is greater than 1 is
indicative of shock17 Cancer It is a risk factor for DVT EP recognized18 Right Ventricular
Dsfunction (RVD)Right ventricular overload in the course of DVT PE
19 Score Wells20 Score Revised
Geneva21 Score Wicki22 Dyspnea Main symptom in DVT PE23 Chest pain Chest pain is present in myocardial infarction in pleural effusion
in the high DVT PE24 pCO2 Associated with low pO2 may be suggestive of DVT PE25 pO2 Associated with low pCO2 may be suggestive of DVT PE26 pH In DVT EP pH is usually normal27 Final Diagnosis Final physiciansrsquo diagnosis
19
Table 4 - Extracted Features
Features Clinical Significance1 Age With the increase of the age increase the incidence2 d-Dimer A value of d-Dimer lt 230ngml is associated with a
low risk absent of DVT PE A very high value isassociated with a high risk of DVT PE
3 SystolicPressure(PAS)
A low PAS is present in patients with DVT PE andhemodynamic shock
4 Heart Rate(FC)
In the patient with TVP EP tachycardia is oftenfound
5 Mean Pul-monaryArtery Pres-sure (PAPS)
It is one of the criteria of right ventricular dysfunc-tion It can be normal in the case of EP low entity
6 Shockindex It is the ratio between PAS and FC if it is greaterthan 1 is indicative of shock
7 Score Re-vised Geneva
8 Score Wells9 pO2 Associated with low pCO2 may be suggestive of DVT
PE
Table 5 - Performance of classifiersComparison of classifier
AUC Standard Error (SE) 95 Confidence IntervalANN 0891 00383 0838 to 0899
Revised Geneva 05533 00485 0420 to 0610Wells 07454 00473 0538 to 0753
Table 6 - Comparison of AUCsANN - GenevaDifference between areas 033795 Confidence Interval 0168 to 0386Significance level P lt 0 0001ANN - WellsDifference between areas 0145695 Confidence Interval 00565 to 0266Significance level P = 0 0025Revised Geneva - WellsDifference between areas 0192195 Confidence Interval 00421 to 0212Significance level P = 0 1456
20
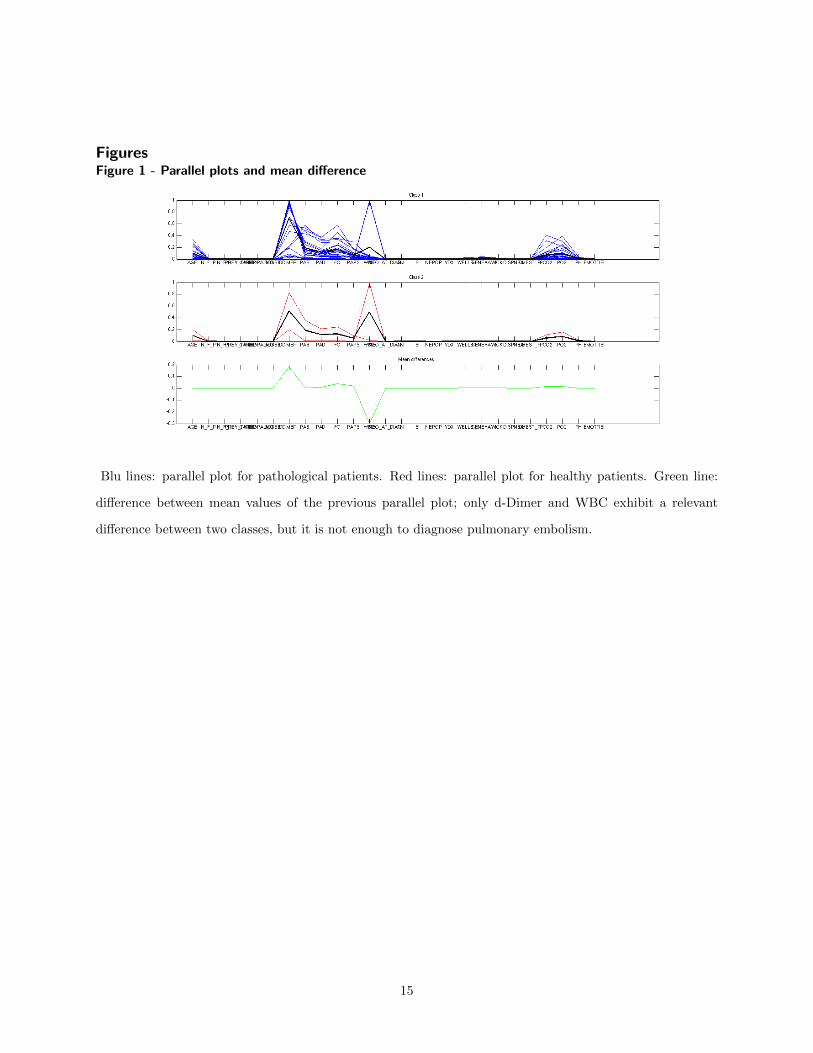
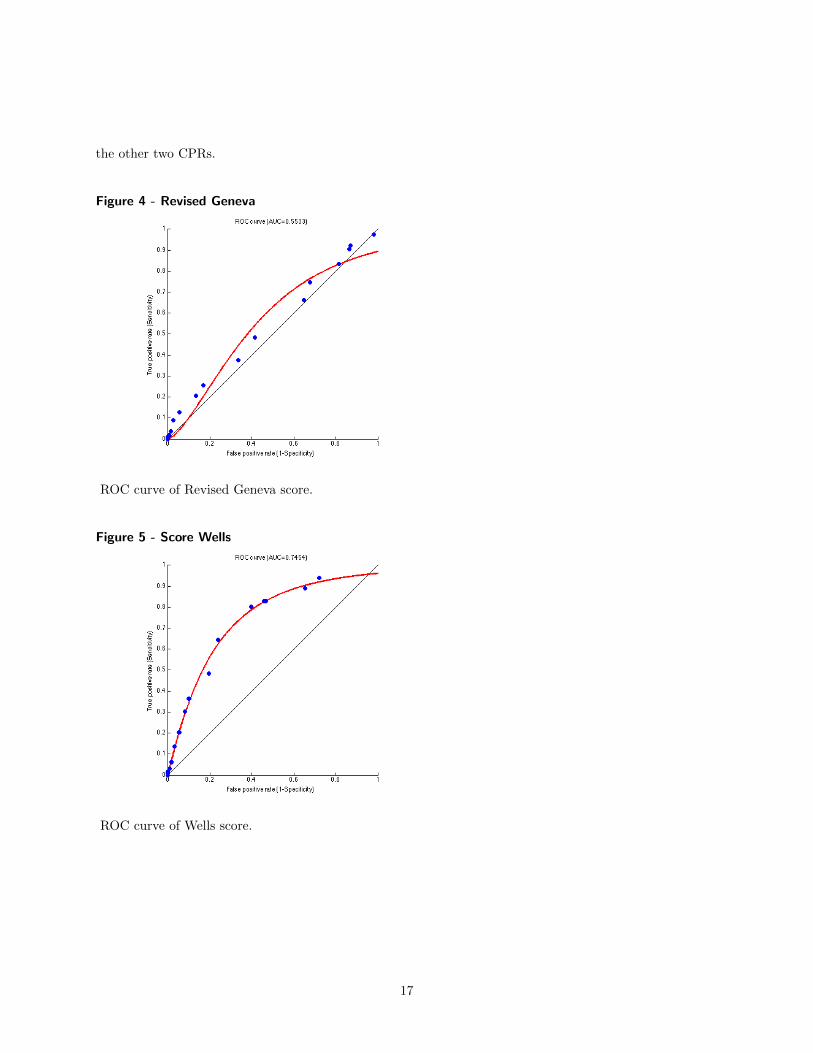