
Using the Three Stooges as a Data-Source for Motivation of Statistics Students Robert Davidson and...
68
Using the Three Stooges as a Data- Source for Motivation of Statistics Students Robert Davidson and Bob Gardner Department of Mathematics East Tennessee State University Online at: http://www.etsu.edu/math/gardner/stooges/stooges- statistics.htm
-
date post
22-Dec-2015 -
Category
Documents
-
view
213 -
download
0
Transcript of Using the Three Stooges as a Data-Source for Motivation of Statistics Students Robert Davidson and...

Using the Three Stooges as a Data-Source for Motivation
of Statistics Students Robert Davidson and Bob Gardner
Department of Mathematics
East Tennessee State University
Online at: http://www.etsu.edu/math/gardner/stooges/stooges-statistics.htm
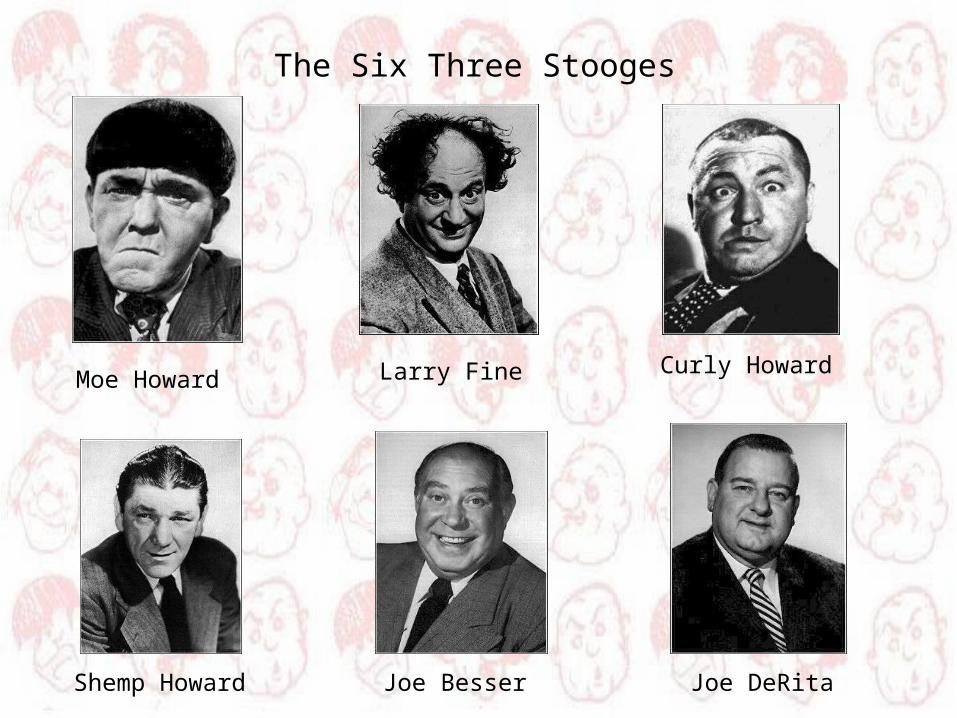
The Six Three Stooges
Moe Howard Larry Fine Curly Howard
Shemp Howard Joe Besser Joe DeRita
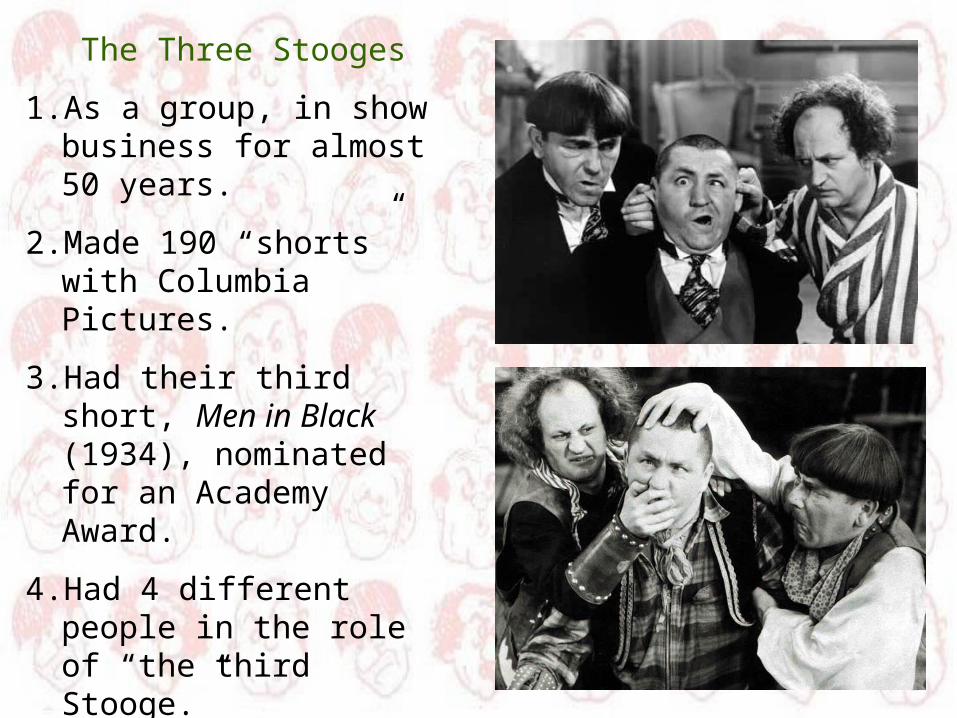
The Three Stooges
1. As a group, in show business for almost 50 years.
2. Made 190 “shorts” with Columbia Pictures.
3. Had their third short, Men in Black (1934), nominated for an Academy Award.
4. Had 4 different people in the role of “the third Stooge.”
5. Were the first to lampoon Adolph Hitler, in You Nazty Spy (1940).

A Brief History of the Three Stooges

Opening slide for the early Three Stooges films
From: http://www.idivimage.com/files/jwfzehyj2mmummdwn4mr.jpg
Larry, Moe and Curly: 97 shorts between 1934 and 1947.
THIS WILL BE ONE OF THE POPULATIONS FROM WHICH WE SAMPLE!!!

From: http://www.a-1video.com/talking.htm
Opening slide for the Three Stooges films from the Shemp era
Shemp, Larry, and Moe: 77 shorts between 1947 and 1956.
THIS WILL BE ONE OF THE POPULATIONS FROM WHICH WE SAMPLE!!!
From The Three Stooges Scrapbook.
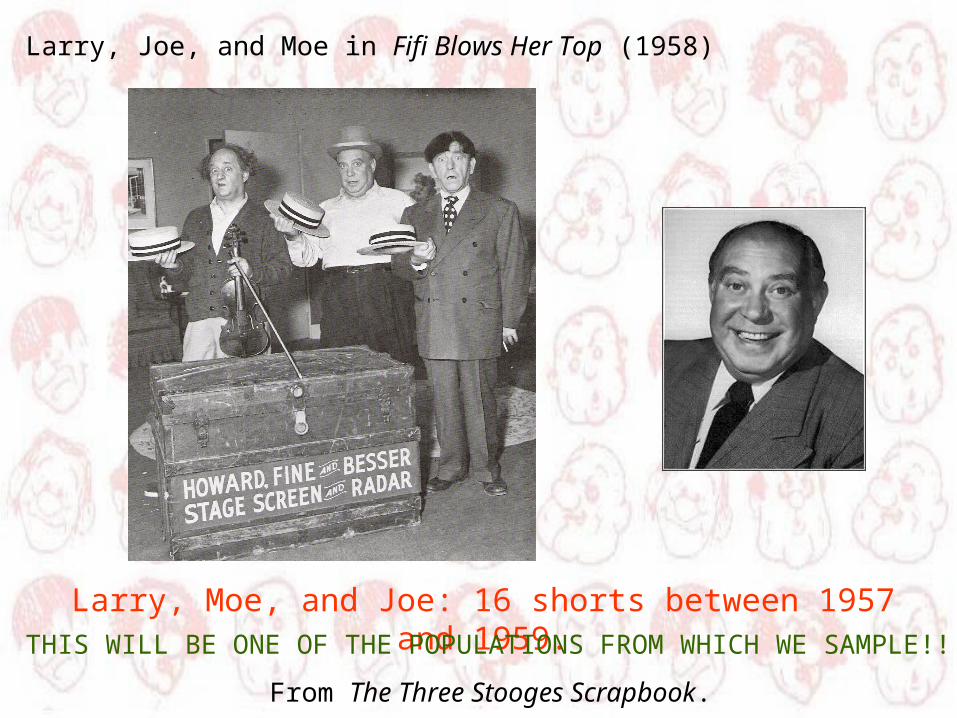
Larry, Joe, and Moe in Fifi Blows Her Top (1958)
Larry, Moe, and Joe: 16 shorts between 1957 and 1959.THIS WILL BE ONE OF THE POPULATIONS FROM WHICH WE SAMPLE!!!

From: http://www.threestooges.net/
Moe Howard(June 19, 1897 – May 4, 1975)
1. The Alpha Stooge.
2. Was the dominant and aggressive Stooge in the shorts.
3. His character on screen was completely difference from his off-screen character
4. He was an excellent businessman and tried hard to treat everyone fairly.
5. He called Curly “Babe” and tried to help him keep his financial and health issues in order.

From: http://www.threestooges.net/
Larry Fine(October 5, 1902 – January 24, 1975)
1. The most underrated Stooge.
2. Starred in the first Stooge short Woman Haters.
3. “The Stooge in the middle.”
4. He played a Marlon Brando caricature in Cuckoo on a Choo Choo.
5. One side of his face was calloused because of the constant barrage of slaps.
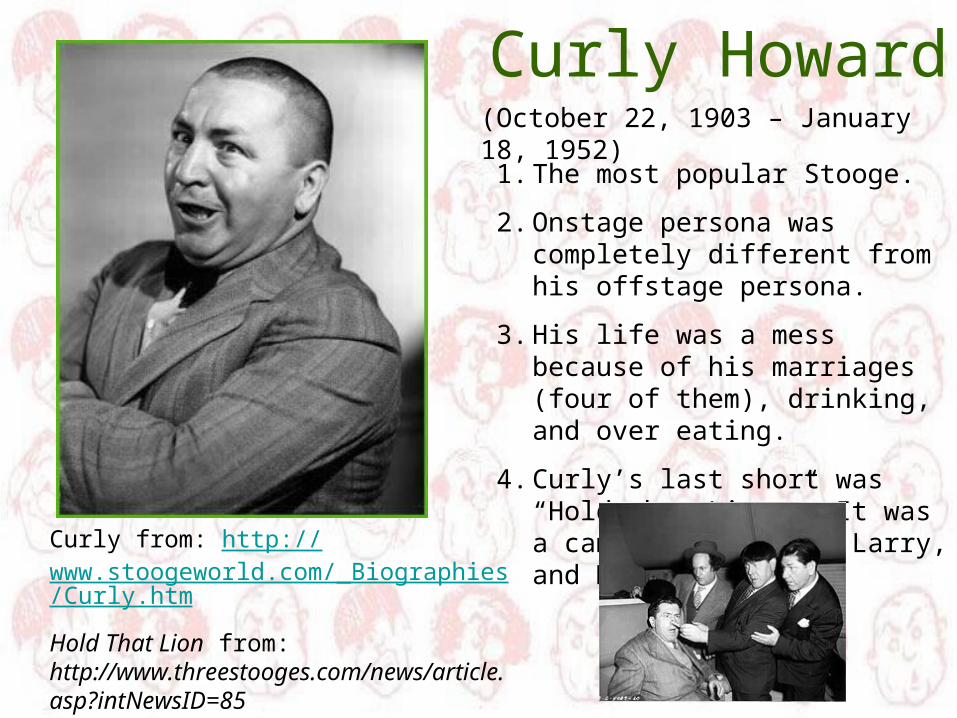
Curly Howard(October 22, 1903 – January 18, 1952)
1. The most popular Stooge.
2. Onstage persona was completely different from his offstage persona.
3. His life was a mess because of his marriages (four of them), drinking, and over eating.
4. Curly’s last short was “Hold that Lion.” It was a cameo with Shemp, Larry, and Moe.
Curly from: http://www.stoogeworld.com/_Biographies/Curly.htm
Hold That Lion from: http://www.threestooges.com/news/article.asp?intNewsID=85
From: http://www.threestooges.net/
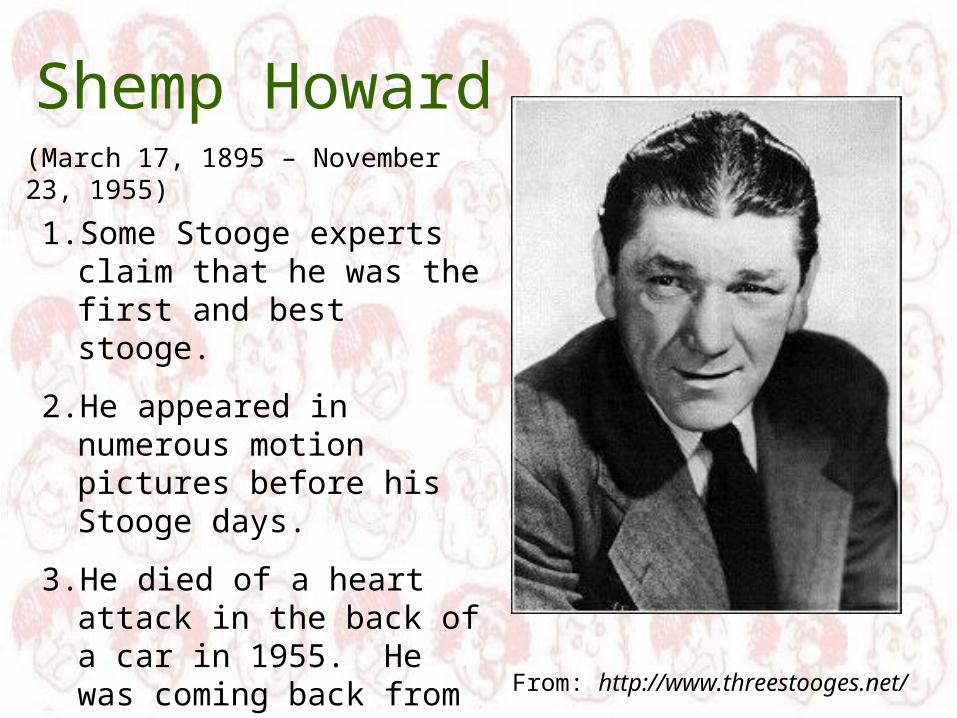
Shemp Howard(March 17, 1895 – November 23, 1955)
1. Some Stooge experts claim that he was the first and best stooge.
2. He appeared in numerous motion pictures before his Stooge days.
3. He died of a heart attack in the back of a car in 1955. He was coming back from a boxing match.
From: Wikipedia.
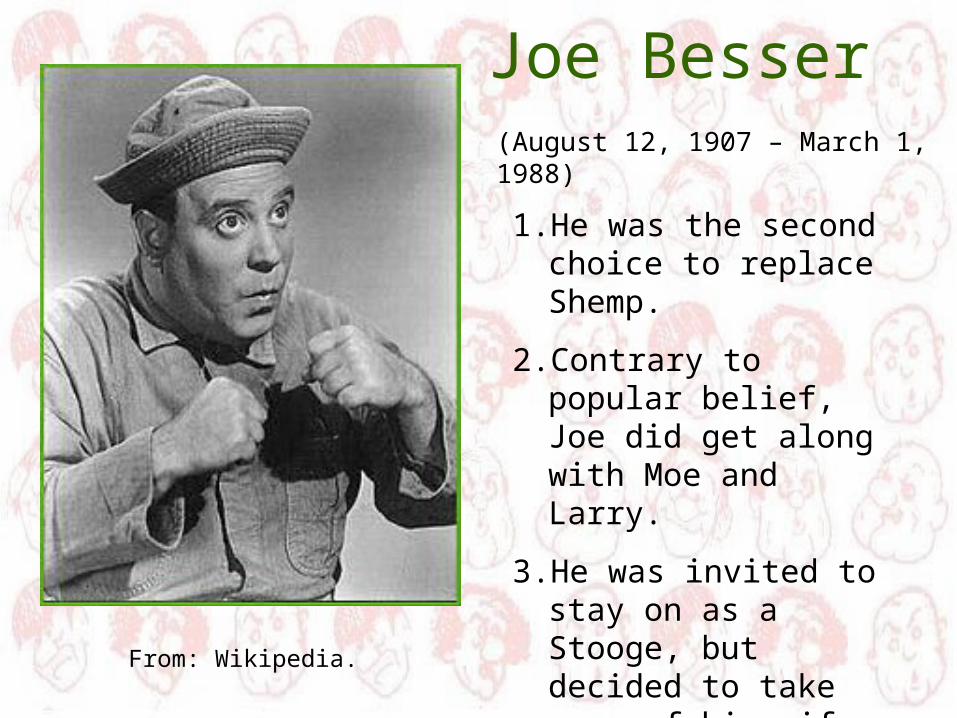
Joe Besser(August 12, 1907 – March 1, 1988)
1. He was the second choice to replace Shemp.
2. Contrary to popular belief, Joe did get along with Moe and Larry.
3. He was invited to stay on as a Stooge, but decided to take care of his wife instead.

An advertisement from the 1947 Johnson City Press-Times (Tennessee) for a personal appearance by the Three Stooges on
October 25, 1947.

Popular Culture as a Pedagogical Aid

“Educators are extremely interested in using popular culture to enhance the teaching and learning of mathematics. Large audiences attending related talks at national mathematics meetings and colleges across the nation, including some that are standing room-only, provide evidence of that claim.
…Capitalizing on student enjoyment of popular culture can alleviate math anxiety, energize shy and quiet students, and provide a creative introduction to an in-depth study of the related mathematics.”
Sarah Greenwald and Andrew Nestler, “Using Popular Culture in the Mathematics and Mathematics Education Classroom,” PRIMUS, 14(1), 1-4, 2004.
PRIMUS: Problems, Resources, and Issues in Mathematics Undergraduate Studies

Dr. Sarah Greenwald, Appalachian State
University, uses the Simpsons and
Futurama to motivate math students.
Images from Wikipedia, Sarah Greenwald’s webpages, and Andrew
Nestler’s webpages.
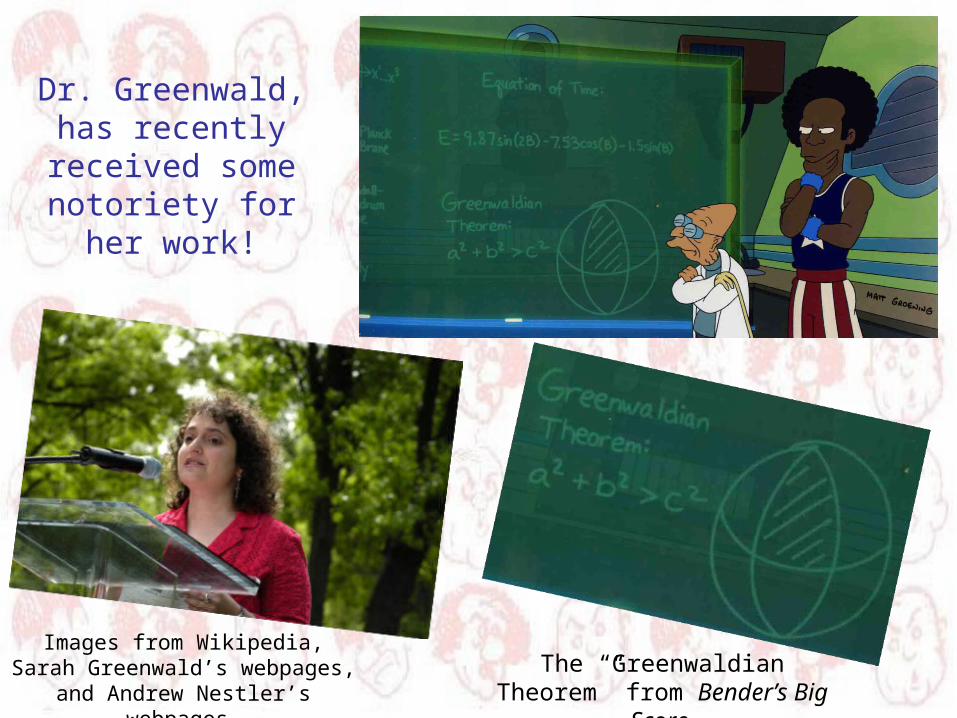
Dr. Greenwald, has recently received some notoriety for
her work!
The “Greenwaldian Theorem” from Bender’s Big Score.
Images from Wikipedia, Sarah Greenwald’s webpages, and Andrew
Nestler’s webpages.

From: http://lunkhead.net/stoogepics/stoogepics1.html
The Three Stooges: Who, by comparison, could suffer from any intellectual anxiety?

Are the Three Stooges Still Relevant?
“…the Three Stooges, whose popularity has continued relatively unabated since the early days of television. …This popularity has undoubtedly been greatest among the Baby Boomer generation, the first children raised with television.”
Quote from the preface of Stoogeology: Essays on the Three Stooges, edited by Peter Seely and Gail
Pieper. McFarland & Company, 2007.
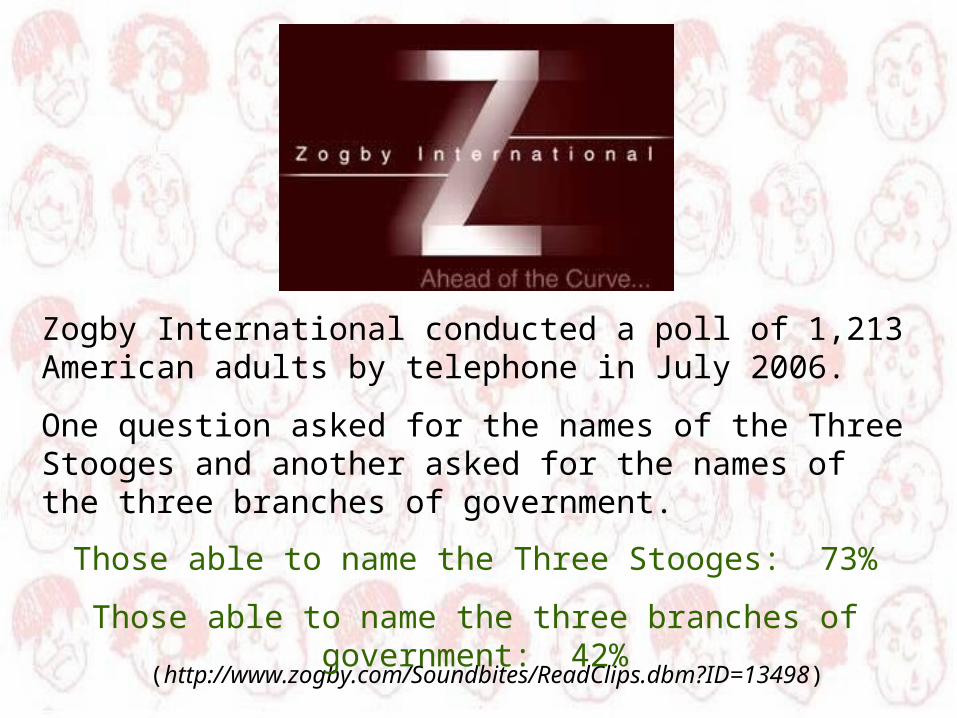
(http://www.zogby.com/Soundbites/ReadClips.dbm?ID=13498)
Zogby International conducted a poll of 1,213 American adults by telephone in July 2006.
One question asked for the names of the Three Stooges and another asked for the names of the three branches of government.
Those able to name the Three Stooges: 73%
Those able to name the three branches of government: 42%
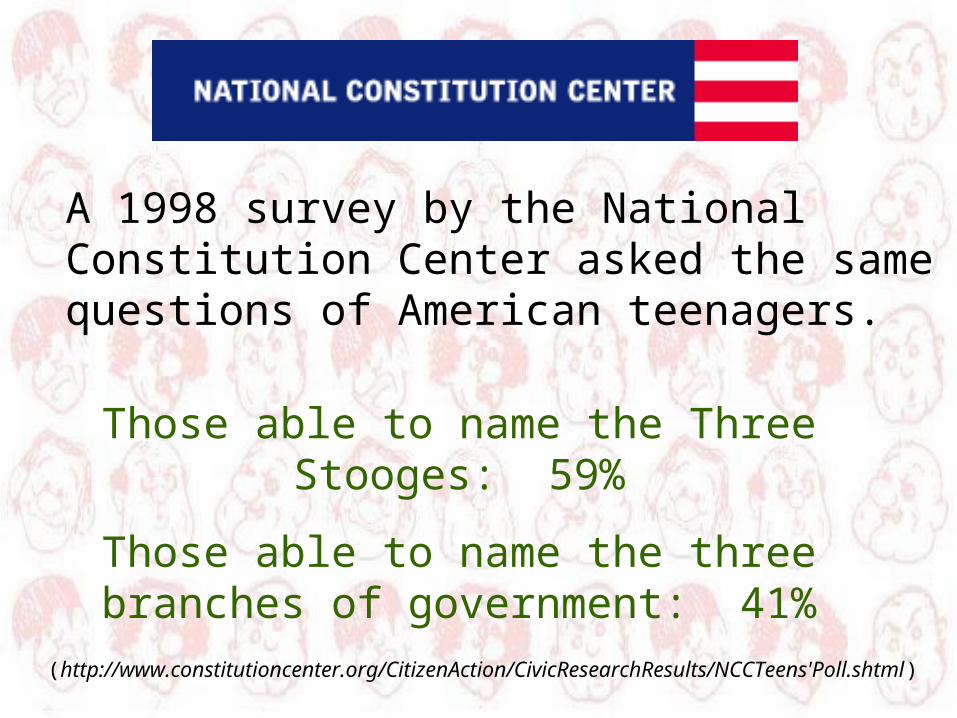
(http://www.constitutioncenter.org/CitizenAction/CivicResearchResults/NCCTeens'Poll.shtml)
A 1998 survey by the National Constitution Center asked the same questions of American teenagers.
Those able to name the Three Stooges: 59%
Those able to name the three branches of government: 41%

Sony Pictures released the first volume of Three
Stooges shorts on October 20, 2007.
The second volume will be released on
May 27,2008.

According to One Fine Stooge by Steve Cox and Jim Terry
(2006), the first time Moe, Larry, and Curly were officially labeled “The Three Stooges” was in a screenplay for an MGM Ted
Healy short Beer and Pretzels dated April 15, 1933 – 75 years
ago this week!
This week is very significant in “Three Stooges” history!!!

Are the Three Stooges worthy of consideration in an academic setting?

A flurry of academic research aimed at the Three Stooges occurred between 1990 and 1995 through the Popular Culture Association. Seventeen papers were presented at PCA conferences in this time interval. The papers were mostly cultural and addressed the art of comedy, World War II propaganda films, the use (and misuse) of language, and the roles of African Americans and women in Stooges’ films.

Jefferson, NC: McFarland & Co., Inc., Publishers: 2007.
“…this volume provides an in-depth look at their comedy and its impact on twentieth century art, culture and thought. The essays reveal new insights into the language, literary structure, politics, race, gender, ethnicity and even psychology of the classic shorts. …the elements of surrealism… The portrayal of women and minorities…”
Quote from the back cover of Stoogeology.

Statistical Tests
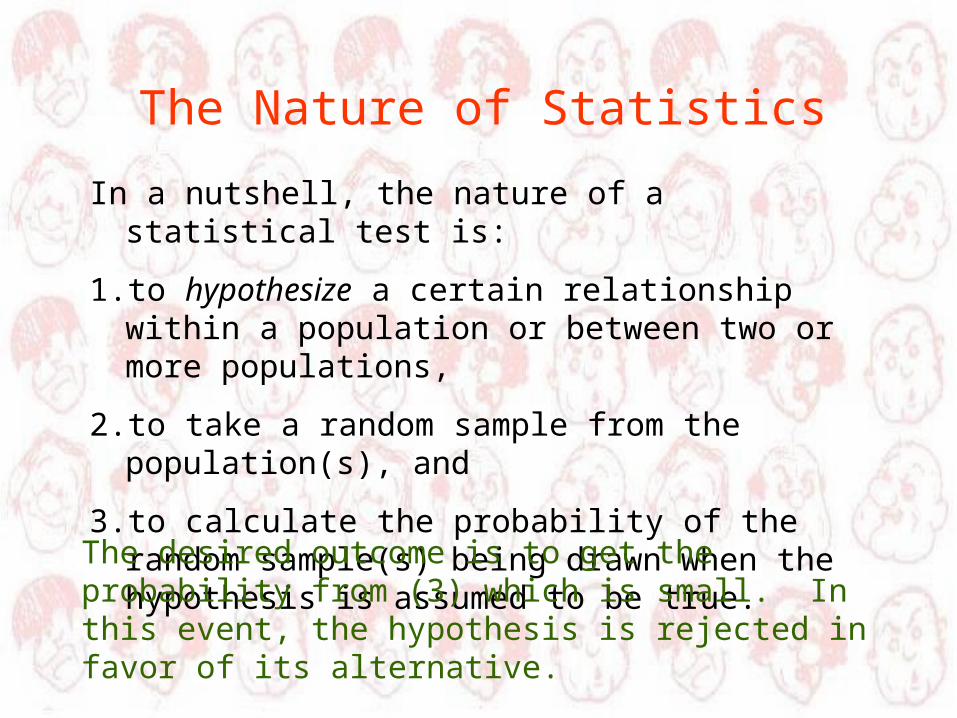
In a nutshell, the nature of a statistical test is:
1. to hypothesize a certain relationship within a population or between two or more populations,
2. to take a random sample from the population(s), and
3. to calculate the probability of the random sample(s) being drawn when the hypothesis is assumed to be true.
The desired outcome is to get the probability from (3) which is small. In this event, the hypothesis is rejected in favor of its alternative.
The Nature of Statistics

The Hypothesis

“To [Joe] Besser’s eternal shame, he had it written into his contract that he would not be subject to slapping or bodily harm.”
“Pure Slap Shtick” by Richard von Busack, Metro Santa Cruz, January 16-22, 1997. Available online at: http://www.ratical.org/ratville/3stooges75yrs.html
From: http://www.threestooges.net/

“Moe and Larry – they were the best. I enjoyed every minute of it with them. In fact, to show you how wonderful they were, I never liked to be hit with anything. And Larry used to say to me ‘don’t worry Joe, I’ll take it.’ Now that’s the kind of guys they were.”
From Stooges: The Men Behind the Mayhem, (DVD) Mackinac Media, 2004.

The null hypothesis is:
H0: "The average number of violent acts by Moe against Curly per episode is the same as the average number of violent acts by Moe against Joe."
The alternative hypothesis is:
Ha: "The average number of violent acts by Moe against Curly per episode is greater than the average number of violent acts by Moe against Joe."
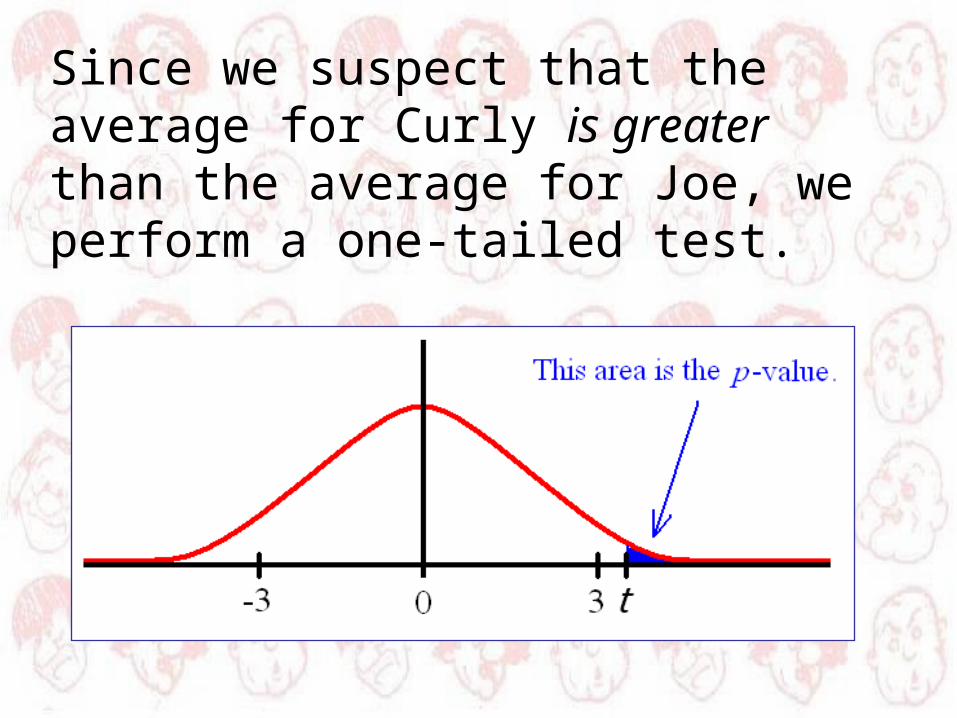
Since we suspect that the average for Curly is greater than the average for Joe, we perform a one-tailed test.

But First, an Example of a Statistical Test

We have no (stated) reason to suspect that there is a difference between the amount of Moe-instituted violence towards Curly versus the amount of Moe-instituted violence towards Shemp.
For the sake of illustration, we test a null hypothesis concerning this.
From:http://www.dvdbeaver.com/film2/DVDReviews33/3_stooges_collection_vol._1.htm
From:http://lunkhead.net/stoogepics/mls/stoogepics2.html

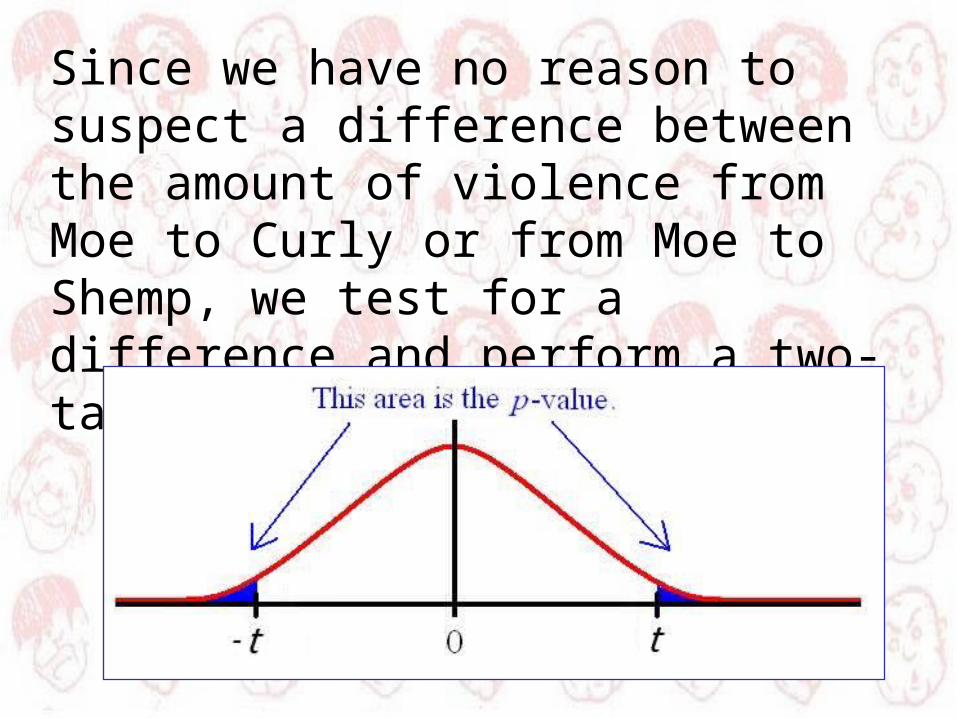
Since we have no reason to suspect a difference between the amount of violence from Moe to Curly or from Moe to Shemp, we test for a difference and perform a two-tailed test. This gives the following null and alternative hypotheses:
H0: "The average number of violent acts by Moe against Curly per episode is the same as the average number of violent acts by Moe against Shemp."
Ha: "The average number of violent acts by Moe against Curly per episode is different than the average number of violent acts by Moe against Shemp."

Since we have no reason to suspect a difference between the amount of violence from Moe to Curly or from Moe to Shemp, we test for a difference and perform a two-tailed test.
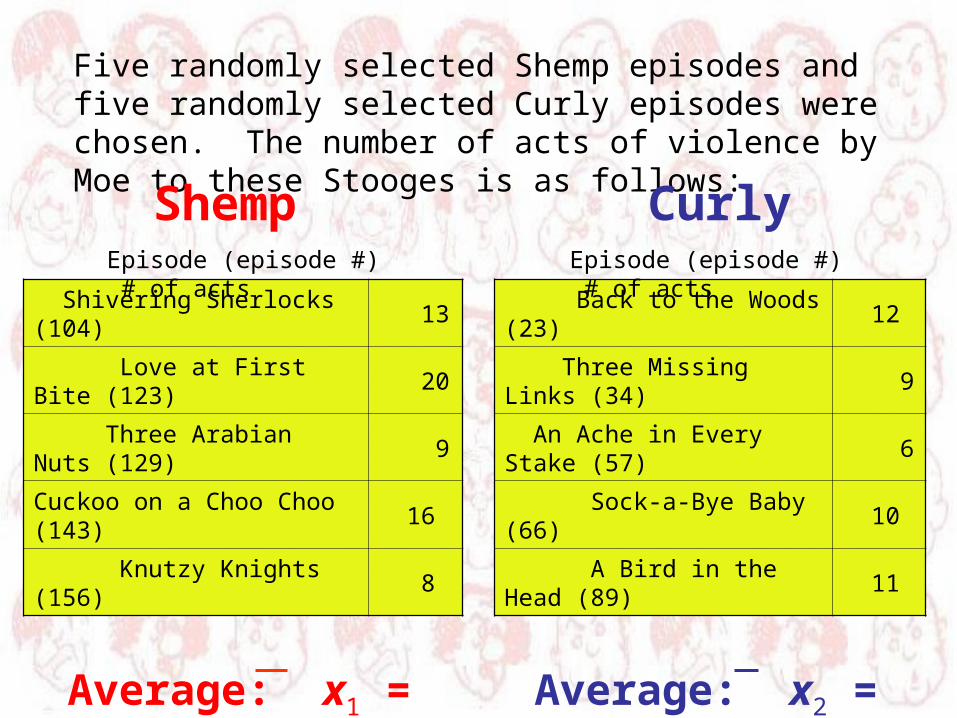
Five randomly selected Shemp episodes and five randomly selected Curly episodes were chosen. The number of acts of violence by Moe to these Stooges is as follows:
Shivering Sherlocks (104) 13
Love at First Bite (123) 20
Three Arabian Nuts (129) 9
Cuckoo on a Choo Choo (143) 16
Knutzy Knights (156) 8
Shemp Curly
Average: x1 = 13.2 Average: x2 = 9.6
Back to the Woods (23) 12
Three Missing Links (34) 9
An Ache in Every Stake (57) 6
Sock-a-Bye Baby (66) 10
A Bird in the Head (89) 11
Episode (episode #) # of acts Episode (episode #) # of acts

n
ii xx
ns
1
2)(1
1
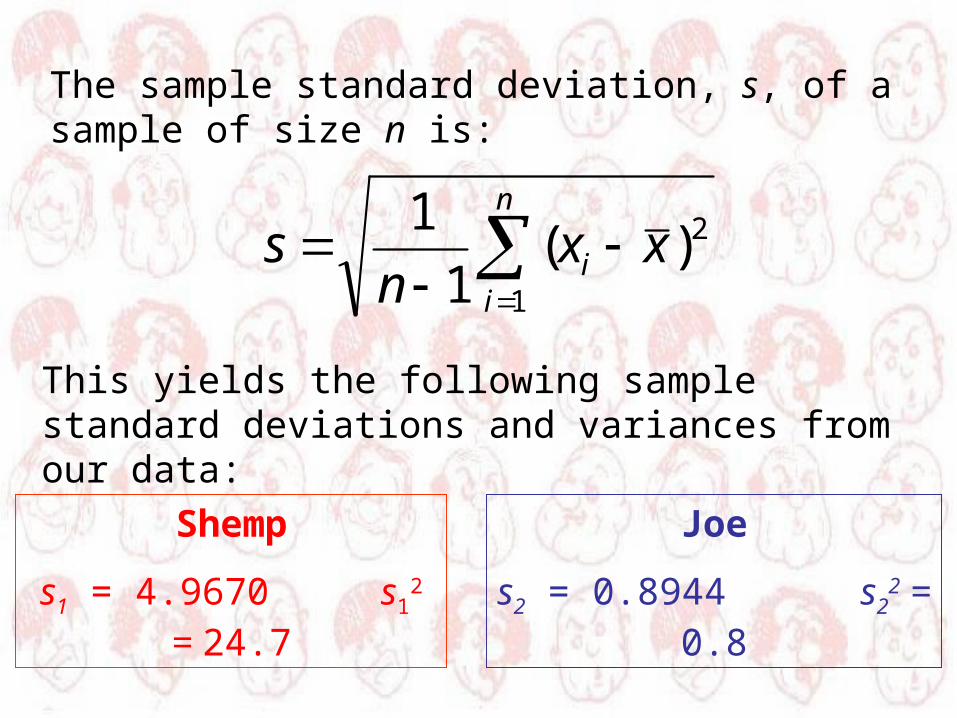
The sample standard deviation, s, of a sample of size n is:
This yields the following sample standard deviations and variances from our data:
Shemp
s1 = 4.9670 s12 = 24.7
Curly
s2 = 2.3022 s22 = 5.3
2
22
1
21
21
ns
ns
xxt
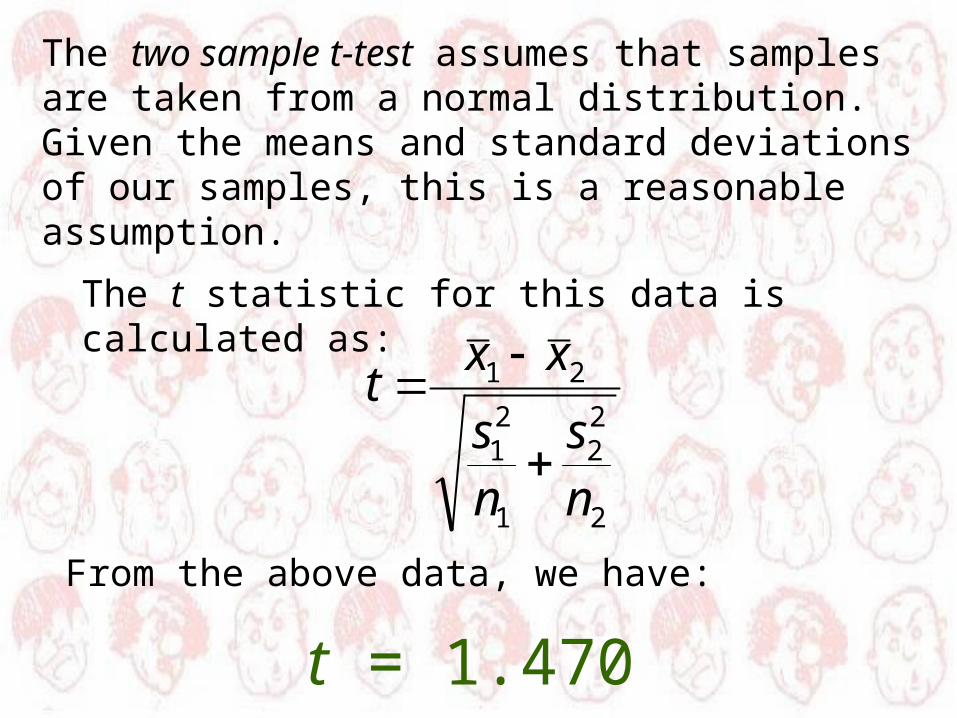
The t statistic for this data is calculated as:
From the above data, we have:
t = 1.470
The two sample t-test assumes that samples are taken from a normal distribution. Given the means and standard deviations of our samples, this is a reasonable assumption.
Since we have no reason to suspect a difference between the amount of violence from Moe to Curly or from Moe to Shemp, we test for a difference and perform a two-tailed test with t = 1.470.

Excel gives a p-value for this data of:
p = 0.1920.This means that we could reject the null hypothesis, but only with confidence
(1- p) x 100% = 80.80%.

A level of confidence of 81% is generally considered insufficient (with the “industry standard” level of confidence set at a minimum of 95%). This means that should fail to reject the null hypothesis that the means are the same. This does not mean that we accept the null hypothesis, but that we find the data insufficient to give a conclusive decision.
Conclusion?
From: http://www.nndb.com/people/972/000047831/

Now, You Gather the Data
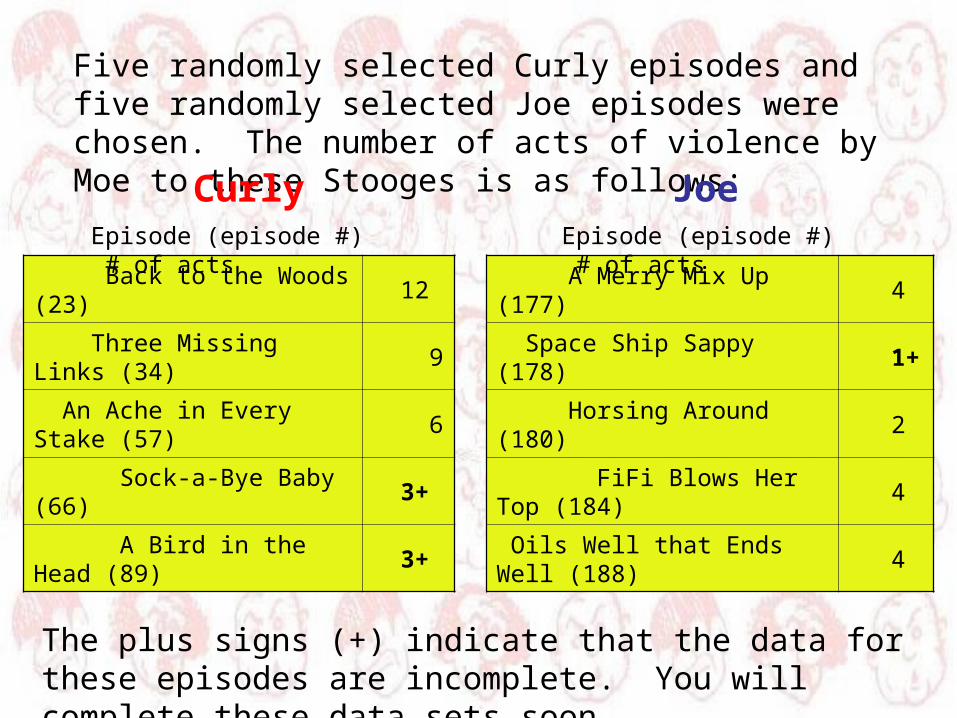
Five randomly selected Curly episodes and five randomly selected Joe episodes were chosen. The number of acts of violence by Moe to these Stooges is as follows:
Back to the Woods (23) 12
Three Missing Links (34) 9
An Ache in Every Stake (57) 6
Sock-a-Bye Baby (66) 3+
A Bird in the Head (89) 3+
A Merry Mix Up (177) 4
Space Ship Sappy (178) 1+
Horsing Around (180) 2
FiFi Blows Her Top (184) 4
Oils Well that Ends Well (188) 4
Curly Joe
The plus signs (+) indicate that the data for these episodes are incomplete. You will complete these data sets soon.
Episode (episode #) # of acts Episode (episode #) # of acts

This time, since we suspect that the average for Curly is greater than the average for Joe, we perform a one-tailed test.
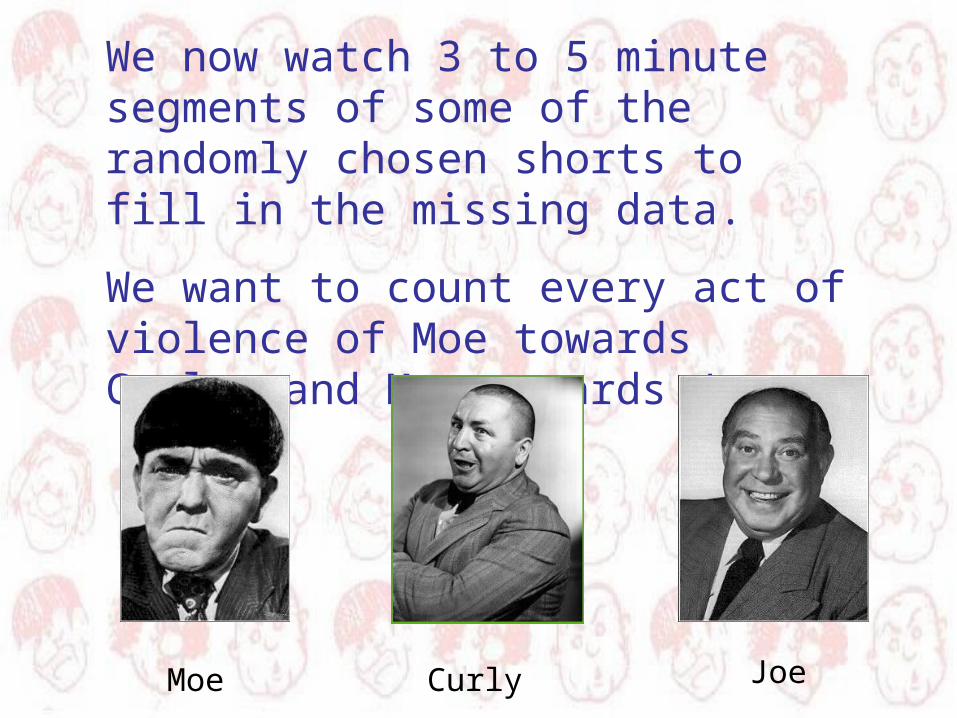
We now watch 3 to 5 minute segments of some of the randomly chosen shorts to fill in the missing data.
We want to count every act of violence of Moe towards Curly, and Moe towards Joe.
Moe Curly Joe
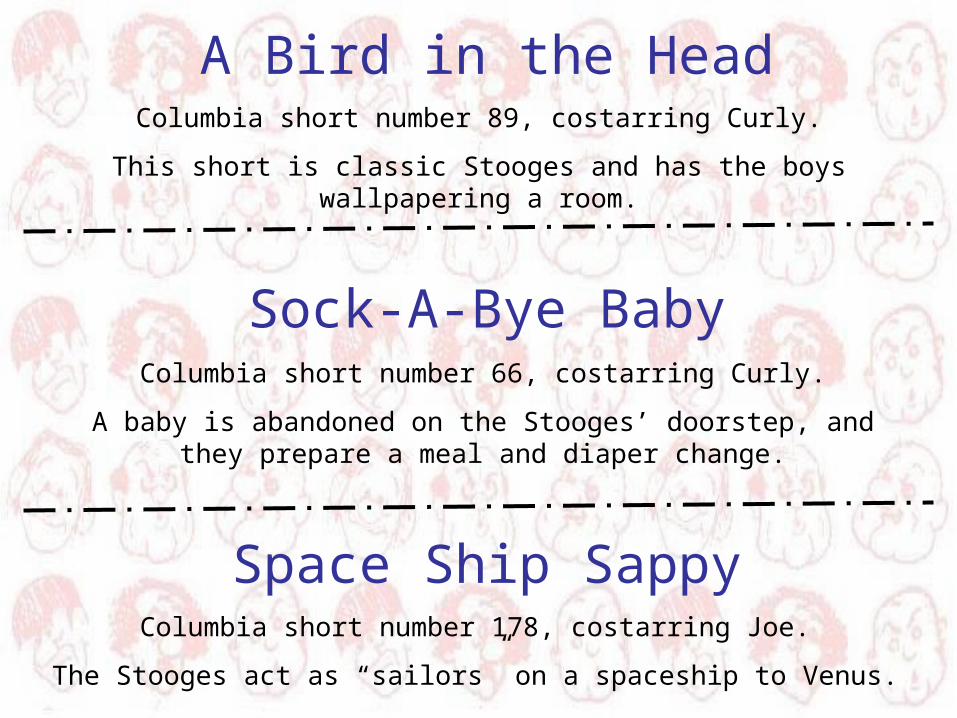
A Bird in the HeadColumbia short number 89, costarring Curly.
This short is classic Stooges and has the boys wallpapering a room.
Sock-A-Bye BabyColumbia short number 66, costarring Curly.
A baby is abandoned on the Stooges’ doorstep, and they prepare a meal and diaper change.
Space Ship SappyColumbia short number 178, costarring Joe.
The Stooges act as “sailors” on a spaceship to Venus.

We now use Excel to compute the mean, variance, t-statistic, and p-value for our collected data.
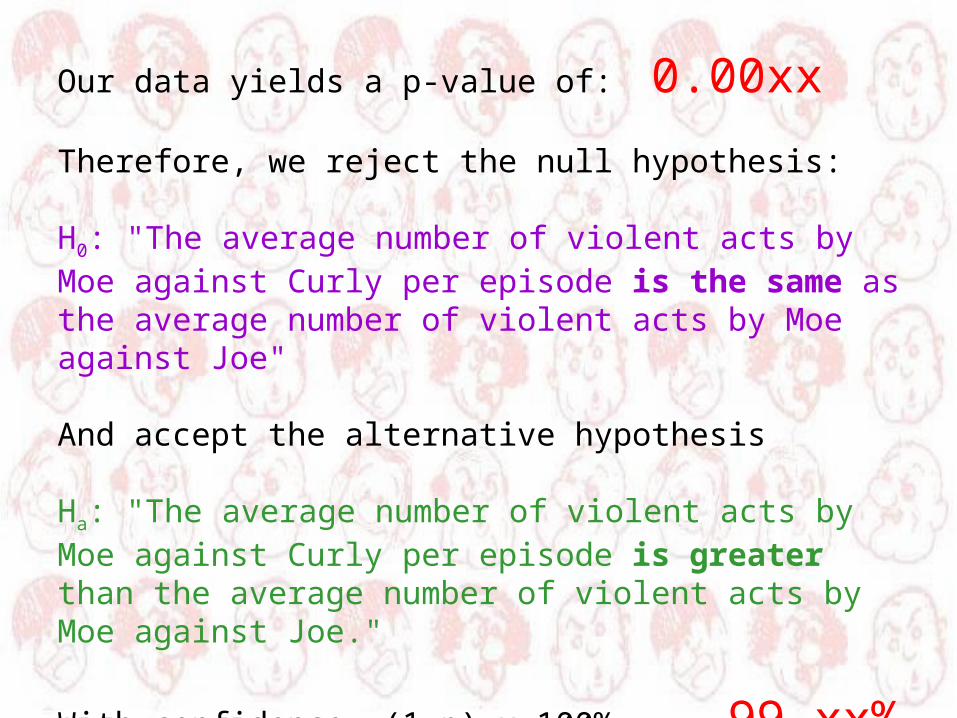
Our data yields a p-value of: 0.00xx
Therefore, we reject the null hypothesis:
H0: "The average number of violent acts by Moe against Curly per episode is the same as the average number of violent acts by Moe against Joe"
And accept the alternative hypothesis
Ha: "The average number of violent acts by Moe against Curly per episode is greater than the average number of violent acts by Moe against Joe."
With confidence (1-p) x 100% = 99.xx%
From:http://www.viewimages.com/Search.aspx?mid=51309234&epmid=3&partner=Google
Why, Soitenly!
Nice!
Other Stooge Applications
• Comparison of level of violence between different directors/writers• Amount of violence aimed at Larry – did he get more in the Joe episodes?• Time series analysis of the level of violence

Possible Problems• Technical difficulties (having the DVDs play properly)• The availability of the episodes in a random sample (especially the Joe Bessers)• Copyright issues
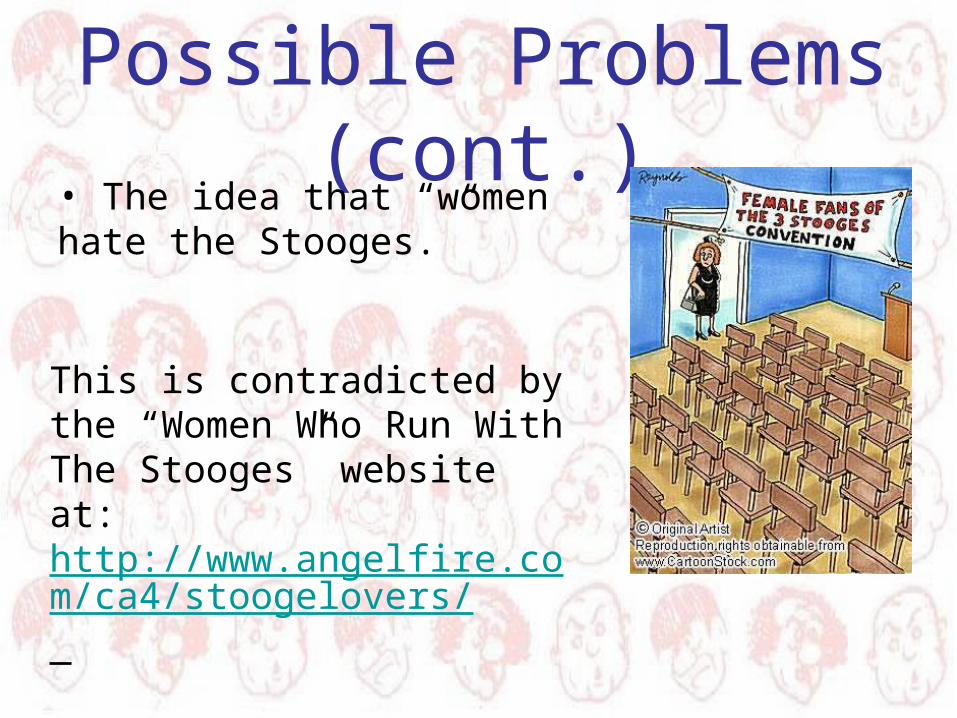
Possible Problems (cont.)
This is contradicted by the “Women Who Run With The Stooges” website at: http://www.angelfire.com/ca4/stoogelovers/
• The idea that “women hate the Stooges.”
Student Impressions following Presentation
in “Quantitative Methods II”
(ECON 2080)
0
5
10
15
20
25
1 2 3
Agree Strongly
Agree Moderately
Disagree Moderately
Disagree Strongly
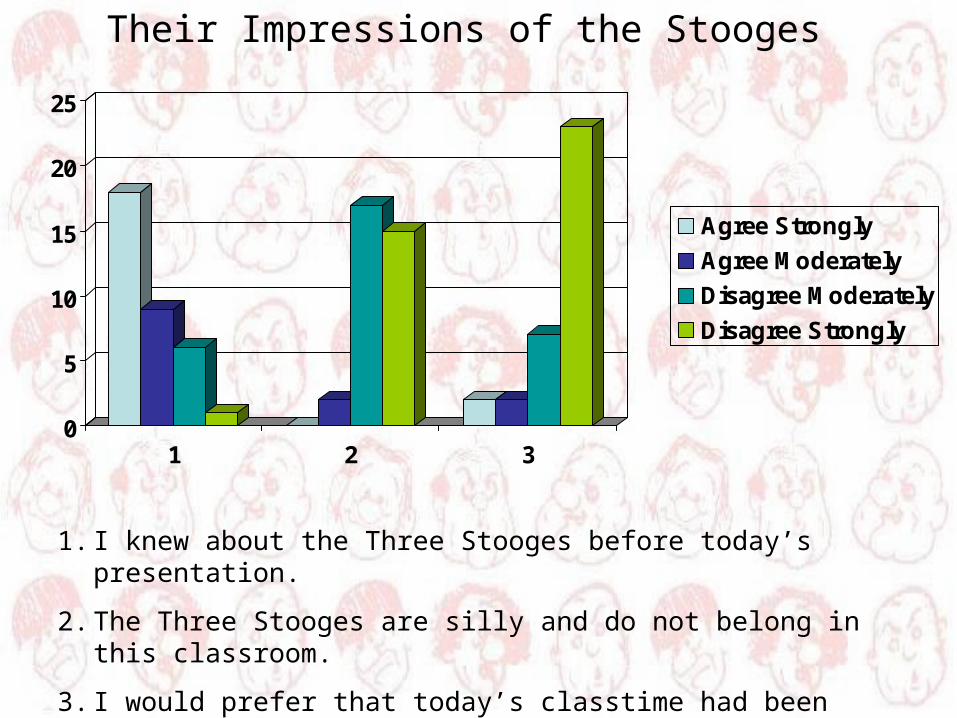
1. I knew about the Three Stooges before today’s presentation.
2. The Three Stooges are silly and do not belong in this classroom.
3. I would prefer that today’s classtime had been spent on a traditional lecture.
Their Impressions of the Stooges
0
5
10
15
20
25
4 5 6
Agree Strongly
Agree Moderately
Disagree Moderately
Disagree Strongly
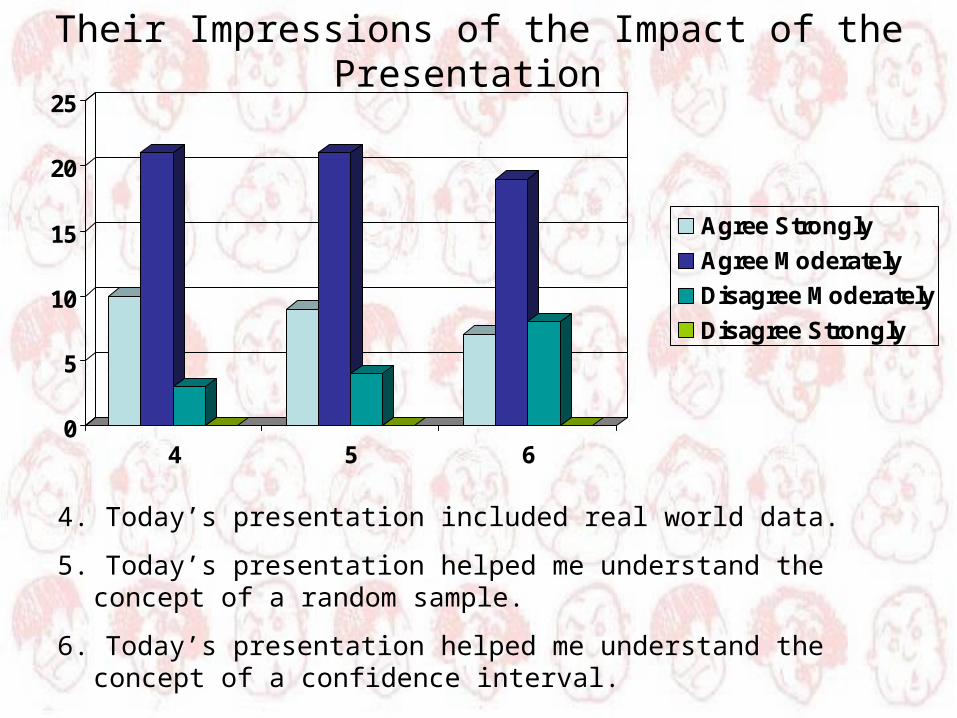
4. Today’s presentation included real world data.
5. Today’s presentation helped me understand the concept of a random sample.
6. Today’s presentation helped me understand the concept of a confidence interval.
Their Impressions of the Impact of the Presentation

0
5
10
15
20
25
7 8 9
Agree Strongly
Agree Moderately
Disagree Moderately
Disagree Strongly
7. Today’s presentation helped me understand the concept of a hypothesis test.
8. Today’s presentation helped me understand the concept of a p-value.
9. I can take the ideas presented today and extend them to other statistical applications.
Their Impressions of the Impact of the Presentation

Discussion
and
Questions
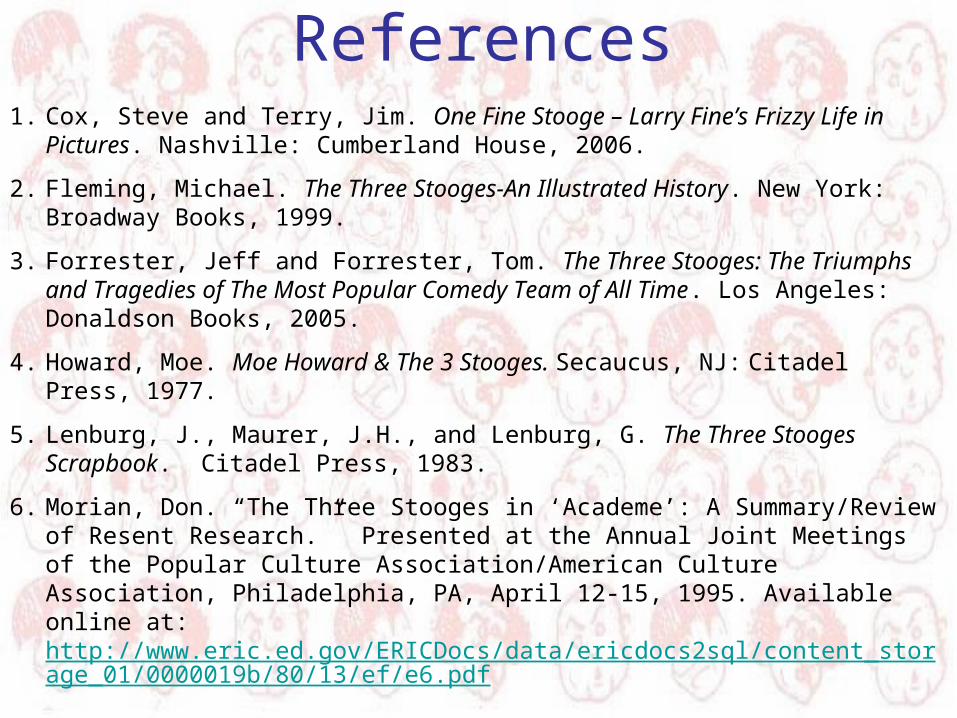
References1. Cox, Steve and Terry, Jim. One Fine Stooge – Larry Fine’s Frizzy Life in Pictures.
Nashville: Cumberland House, 2006.
2. Fleming, Michael. The Three Stooges-An Illustrated History. New York: Broadway Books, 1999.
3. Forrester, Jeff and Forrester, Tom. The Three Stooges: The Triumphs and Tragedies of The Most Popular Comedy Team of All Time. Los Angeles: Donaldson Books, 2005.
4. Howard, Moe. Moe Howard & The 3 Stooges. Secaucus, NJ: Citadel Press, 1977.
5. Lenburg, J., Maurer, J.H., and Lenburg, G. The Three Stooges Scrapbook. Citadel Press, 1983.
6. Morian, Don. “The Three Stooges in ‘Academe’: A Summary/Review of Resent Research.” Presented at the Annual Joint Meetings of the Popular Culture Association/American Culture Association, Philadelphia, PA, April 12-15, 1995. Available online at: http://www.eric.ed.gov/ERICDocs/data/ericdocs2sql/content_storage_01/0000019b/80/13/ef/e6.pdf
7. Seely, Peter and Pieper, Gail, editors. Stoogeology: Essays on the Three Stooges. Jefferson, NC: McFarland & Co., 2007.
From: http://www.lunkhead.net/
Special thanks to Rafie Baghozian for letting us infiltrate his classes!

What about Shemp versus Joe?

Five randomly selected Shemp episodes and five randomly selected Joe episodes were chosen. The number of acts of violence by Moe to these Stooges is as follows:
Shivering Sherlocks (104) 13
Love at First Bite (123) 20
Three Arabian Nuts (129) 9
Cuckoo on a Choo Choo (143) 16
Knutzy Knights (156) 8
Shemp Joe
Average: x1 = 13.2 Average: x2 = 3.6
A Merry Mix Up (177) 4
Space Ship Sappy (178) 4
Horsing Around (180) 2
FiFi Blows Her Top (184) 4
Oils Well that Ends Well (188) 4
Episode (episode #) # of acts Episode (episode #) # of acts
n
ii xx
ns
1
2)(1
1
The sample standard deviation, s, of a sample of size n is:
This yields the following sample standard deviations and variances from our data:
Shemp
s1 = 4.9670 s12 = 24.7
Joe
s2 = 0.8944 s22 = 0.8

2
22
1
21
21
ns
ns
xxt
The t statistic for this data is calculated as:
From the above data, Excel gives:
t = 4.251
The two sample t-test assumes that samples are taken from a normal distribution. Given the means and standard deviations of our samples, this is a reasonable assumption.

Excel give a p-value for this data of:
p = 0.0066.And so we can reject the null hypothesis with a confidence of
(1- p) x 100% = 99.34%.