Using the Rasch Rating Scale Model to Test thekdbrad2/MSLSS_AERA2006.pdf · MSLSS Scale 3 Using the...
21
MSLSS Scale 1 Running head: FIT AND FUNCTION OF MSLSS SCALE Using the Rasch Rating Scale Model to Test the Fit and Function of MSLSS Scale across Groups Kelly D. Bradley, Jessica D. Cunningham and Richard Gilman University of Kentucky
Transcript of Using the Rasch Rating Scale Model to Test thekdbrad2/MSLSS_AERA2006.pdf · MSLSS Scale 3 Using the...

MSLSS Scale 1
Running head: FIT AND FUNCTION OF MSLSS SCALE
Using the Rasch Rating Scale Model to Test the Fit and Function of MSLSS Scale across Groups
Kelly D. Bradley, Jessica D. Cunningham and Richard Gilman
University of Kentucky

MSLSS Scale 2
Concerns regarding construct bias in psychological assessment have been the subject of
ongoing research for a half century. Little research has investigated the psychometric
comparability of instruments designed to assess positive perceptions of individuals’ lives. The
Multidimensional Students’ Life Satisfaction Scale (MSLSS), is based on a hierarchical factor
structure that conceptualizes life satisfaction as an overall satisfaction that is subsumed by five
domains believed to be important in youths’ lives: Family, Friends, School, Living Environment,
and Self (Huebner, 1994). A Rasch model was applied to each domain to investigate
measurement properties and determine equivalence across groups at the item level.

MSLSS Scale 3
Using the Rasch Rating Scale Model to Test the Fit and Function of MSLSS Scale across Groups
The domains of the Multidimensional Students’ Life Satisfaction Scale (MSLSS) are
analyzed via a Rasch partial credit model (Huebner, 1994). The MSLSS scale was developed to
provide a multidimensional profile of children’s life satisfaction judgments. In addition to a
profile, the Rasch analysis can provide meaningful comparisons among life satisfaction profiles.
Rasch measurement allows for analyses of individual differences in response tendencies, as well
as an item’s discrimination (i.e., how well the item is able to discriminate between examinees
holding different levels of a latent construct) and difficulty. Considering life satisfaction, an
expectation of the model for an item is that the probability of endorsing the item in the keyed
direction increases as the amount of life satisfaction the individual holds increases. Both person
and item estimates allow researchers to determine how well an item measures a latent construct
(Smith, 2002). Rasch scaling procedures were used to determine equivalence at the item level,
and if differences were obtained, to determine the pattern of responding across groups. As
suggested by Bond and Fox (2001), here we consider if the rating scale has aided in the
collection of reliable data for persons and items, if the categories fit the model sufficiently well,
if the thresholds indicate a hierarchical pattern to the rating scale and if there are enough data in
each category to provide stable estimates.
Theoretical Framework
Given the role that psychological assessment plays in research and clinical assessment, as
well as the ongoing cultural and ethnic changes that are occurring in the United States (Allen &
Walsh, 2000), assessment of construct bias is a vital step towards ensuring that identical
constructs are being measured across groups of interest (Ozer & Reise, 1994; Smith, 2002).
MSLSS Scale 4
One of the more straightforward approaches to assessing construct bias, particularly for
rating scales (such as the MSLSS) is the Rasch model (Wright & Masters, 1982; Selner-
O’Hagan, Kindlon et al., 1998). As with all item response models, the Rasch model assumes that
an additive structure underlies the observed data, that both participants, and items can be arrayed
on a continuum, and that the items have equal discriminative power (Kan, Breteler, Van der Ven,
& Zitman, 1998). Thus, Rasch modeling can provide the difficulty of endorsing an item and
scale thresholds unique to each item, as well as the response patterns of the individuals
completing the survey and the amount of the attitude in the individual based on empirical
evidence (Andrich, 1988; Krueger & Finger, 2001; Santor & Ramsay, 1998). Using various
statistics and probability curves, parameters are estimated separately for each group to determine
if the underlying model fits the data. If the given indicators are equivalent across groups, item
bias is not supported (Little, 2000; Scheuneman & Bleistein, 1999).
As noted by Smith (2002), ignoring or excluding items that reveal differential responding
“may be to fail to do justice to the complexity of the construct” (p. 761). That is, extreme
responding to items may reveal difference in how items are interpreted by different cultures,
rather than fundamental differences at the construct level. For example, Clarke (2000) reported
significant differences in extreme responding across various racial/ethnic subcultures in the
United States, with African-Americans (as well as Hispanics) having a consistently higher level
of extreme responding than Caucasians. Thus, response style may be telling of aspects
individuals reared in a given culture (Little, 2000).
Methods
Response Frame

MSLSS Scale 5
Participants were obtained from 11 middle and high schools across three states in the
Southeastern region of the U.S., resulting in 965 responses to the MSLSS for the years 1999 –
2004. Comparison of mean scores and coefficient alphas for all variables of interest was not
statistically significant between schools or regions (p<.05), and thus the data reported will be
based on the entire response frame.
Instrumentation
The Multidimensional Students' Life Satisfaction Scale (MSLSS) is a 40-item self-report
instrument that assesses satisfaction across five specific life domains: Family, Friends, School,
Living Environment, and Self (Huebner, 1994) (see Appendix). While all items of the instrument
have been summed to derive a total satisfaction score, the domain was not assessed in this study.
Instead, each domain was analyzed as a separate construct. All questions on the MSLSS have
possible responses on a six-point Likert-type scale format (strongly disagree, moderately
disagree, mildly disagree, mildly agree, moderately agree, and strongly agree). Negatively
worded items were reverse-keyed so that a higher score is indicative of higher levels of
satisfaction with respect to the domain in question. The items have been categorized into five
domains as shown in Table 1.
Table 1
Items listed by Domain
Domain Items within Domain
Family 7, 8, 18, 19, 21, 28, 30 (7 items)
Friends 1, 4, 11, 12, 16, 23, 24, 29, 38 (9 items)
Self 2, 5, 10, 14, 17, 33, 35 (7 items)
School 3, 6, 9, 13, 20, 22, 25, 26 (8 items)

MSLSS Scale 6
Living 15, 27, 31, 32, 34, 36, 37, 39, 40 (9 items)
Data Analyses
Using WINSTEPS software, an overall partial credit model was applied beginning with
persons and items to test the overall fit of the data to the model. The partial credit model was
chosen due to the possibility that respondents may interpret the scale differently depending on
the item. The basic mathematical expression used for constructing measures through responses to
the partial credit model is log (P / P )/B n –D ik (Andrich, 1978) where P nik represents the
probability the person n when responding to item i would be observed in category k; similarly
P ; B is the attitude of person n; D ik is the difficult of item i with the impediment to being
observed in category k relative to k-1. Previous studies have used factor analyses to provide
support for the five domains as unique constructs (Gilman et al., 2000; Huebner et al., 1998).
The Rasch model was then extended to a separate analysis of each of the five domains (Family,
Friends, School, Living Environment, and Self) with race (African-American and Caucasian) as
a person label. The analysis considers the severity of ratings by respondents and the differential
item functioning across groups.
nik )1( −kni
)1( −kni n
The 965 returned survey responses were entered into the partial credit model in
WINSTEPS separately for each domain. In some cases, individuals responded to some, but not
all, of the items. When an individual had missing data, the data were treated as missing since it
was reasonable to believe respondents might not be able to answer all survey items with
integrity. Further, it was decided that imputing means or other substitutes for missing data would
be inappropriate since missing data are not problematic with the Rasch model, mute variability
within the data set, and result in data and information that was not truly reflective of the answers
provided by the respondents.

MSLSS Scale 7
Survey items and respondents that did not adequately fit the model requirements were
identified using the mean square scores, with a reasonable range determined to be 0.6 -1.4. While
there is not a specific rule defining the cutoff, the commonly accepted interpretation for a rating
scale are infit and outfit values greater than 1.4 or less than .6 (Wright & Linacre, 1994). The
guidelines outlined by Linacre (2004) were used to evaluate the rating scale category
effectiveness based on the responses. Point-biserial correlations were inspected to investigate the
orientation of the latent variable to ensure that the polarity of the items were of the same sign
(i.e. all point-biserial correlations were positive). The number of observations and distribution of
observations across categories were examined to describe the functioning of the rating scale
categories. Inspecting the outfit mean-squares provides evidence about the fit of the data to the
model. The infit mean-squares are used to determine the fit of the item within the construct.
Advancing average measures with each category and step calibrations ensure the rating scale
measure is stable and accurate. Probability curves were used to visually inspect the rating scale
category function.
Each person is accompanied with a person label indicating the race of the participant.
Differential item analysis within WINSTEPS was used to determine if there are statistically
significant differences in life satisfaction across the five domains depending on the race of the
student. A separate calibration t-test approach (Wright and Stone, 1979) was used to determine
differential responding across the two subpopulations of interest (African Americans and
Caucasians). While there is not a consensus on statistical significant differences, the t-statistic
estimates greater than 2 were highlighted for illustrating differential item responding across race.
MSLSS Scale 8
Results and Discussion
The Rasch model assumes that the items measure a common factor. Although such
analysis may suggest invariance at the item level, it may not necessarily imply construct
equivalence (Allen & Walsh, 2000). That is, item similarity across groups may reflect
similarities in item interpretation but the interpretation may be different than what the test
proposes to measure.
Overall analysis
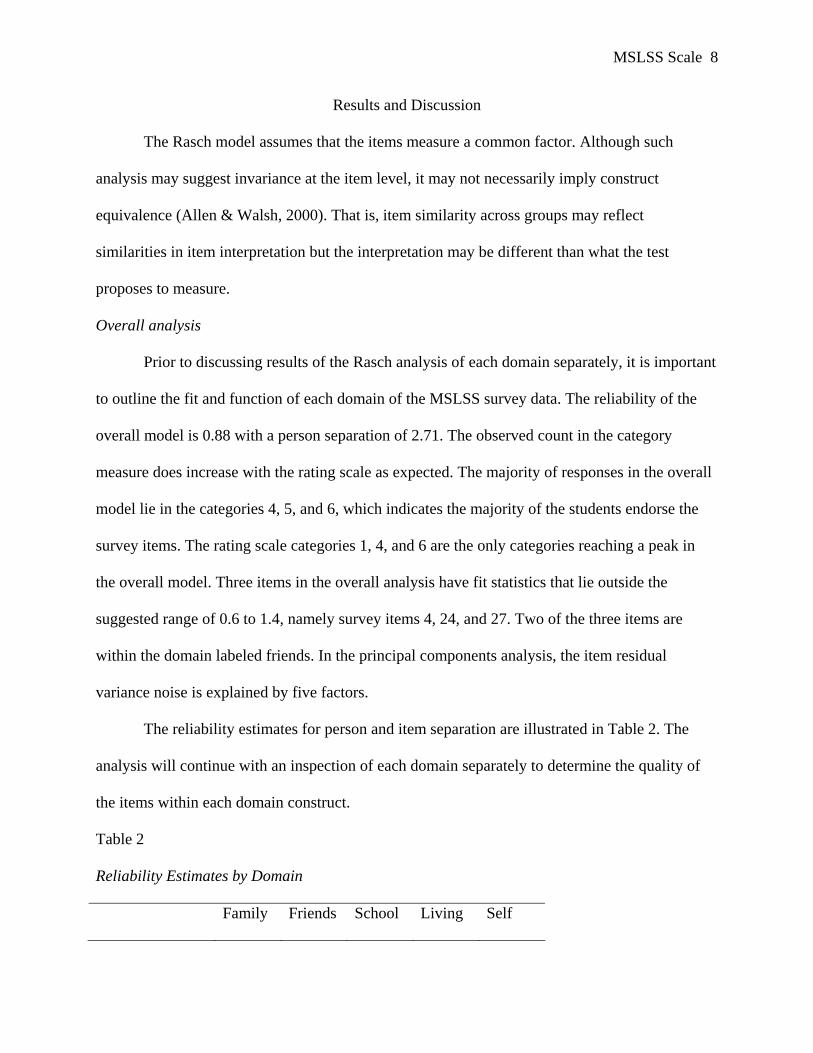
Prior to discussing results of the Rasch analysis of each domain separately, it is important
to outline the fit and function of each domain of the MSLSS survey data. The reliability of the
overall model is 0.88 with a person separation of 2.71. The observed count in the category
measure does increase with the rating scale as expected. The majority of responses in the overall
model lie in the categories 4, 5, and 6, which indicates the majority of the students endorse the
survey items. The rating scale categories 1, 4, and 6 are the only categories reaching a peak in
the overall model. Three items in the overall analysis have fit statistics that lie outside the
suggested range of 0.6 to 1.4, namely survey items 4, 24, and 27. Two of the three items are
within the domain labeled friends. In the principal components analysis, the item residual
variance noise is explained by five factors.
The reliability estimates for person and item separation are illustrated in Table 2. The
analysis will continue with an inspection of each domain separately to determine the quality of
the items within each domain construct.
Table 2
Reliability Estimates by Domain
Family Friends School Living Self

MSLSS Scale 9
Person
Separation
.78 .61 .79 .72 .62
Item Separation .98 .96 1.00 .99 .98
Analysis by domain
For this instrument, the responses correspond to 1 = strongly disagree, 2 = moderately
disagree, 3 = mildly disagree, 4 = mildly agree, 5 = moderately agree, and 6 = strongly agree.
The observed count indicates the number of times the category was selected (See Table 3). It
appears from the frequencies reported that respondents are not utilizing the full range of the six-
point scale, which was suspect in the overall analysis. The category measure is expected to
increase with category value, and it does; however, the steps are not similar in size. For each of
the domains Friends, Living and Self, Response 6 was chosen most often, followed by Response
5 and then 4. It is also important to note that responses are more distributed across the rating
scale in the domains School and Living. These domains have higher numbers of students
disagreeing with items.
Table 3
Category Counts and Percentages Overall and by Domain
Response
1 2 3 4 5 6
Family 463(7%) 438(7%) 672(11%) 1351(21%) 1753(28%) 1691(27%)
Friends 267(4%) 222(3%) 428(6%) 995(13%) 2208(29%) 3420(45%)
School 1180(16%) 726(10%) 1081(14%) 1622(21%) 1425(19%) 1556(20%)
Living 1339(16%) 725(8%) 1104(13%) 1438(17%) 1575(18%) 2366(28%)
MSLSS Scale 10
Self 165(3%) 147(2%) 254(4%) 951(16%) 1899(32%) 2512(42%)
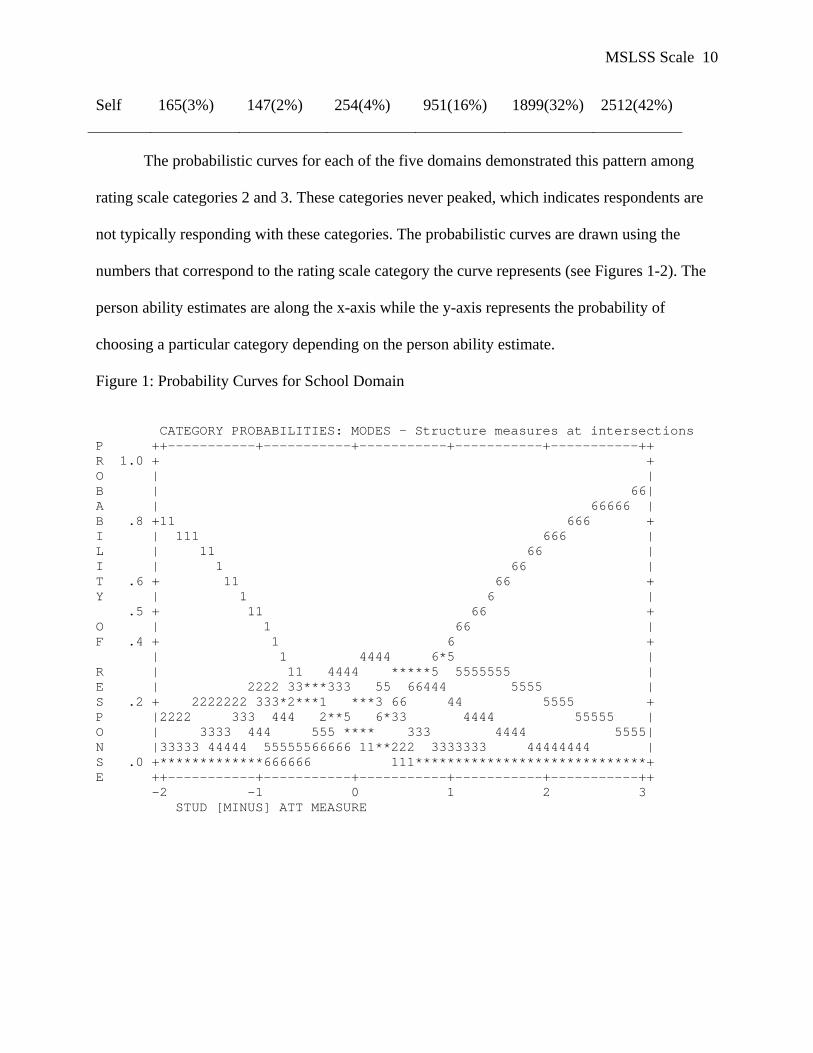
The probabilistic curves for each of the five domains demonstrated this pattern among
rating scale categories 2 and 3. These categories never peaked, which indicates respondents are
not typically responding with these categories. The probabilistic curves are drawn using the
numbers that correspond to the rating scale category the curve represents (see Figures 1-2). The
person ability estimates are along the x-axis while the y-axis represents the probability of
choosing a particular category depending on the person ability estimate.
Figure 1: Probability Curves for School Domain
CATEGORY PROBABILITIES: MODES - Structure measures at intersections P ++-----------+-----------+-----------+-----------+-----------++ R 1.0 + + O | | B | 66| A | 66666 | B .8 +11 666 + I | 111 666 | L | 11 66 | I | 1 66 | T .6 + 11 66 + Y | 1 6 | .5 + 11 66 + O | 1 66 | F .4 + 1 6 + | 1 4444 6*5 | R | 11 4444 *****5 5555555 | E | 2222 33***333 55 66444 5555 | S .2 + 2222222 333*2***1 ***3 66 44 5555 + P |2222 333 444 2**5 6*33 4444 55555 | O | 3333 444 555 **** 333 4444 5555| N |33333 44444 55555566666 11**222 3333333 44444444 | S .0 +*************666666 111*****************************+ E ++-----------+-----------+-----------+-----------+-----------++ -2 -1 0 1 2 3 STUD [MINUS] ATT MEASURE
MSLSS Scale 11
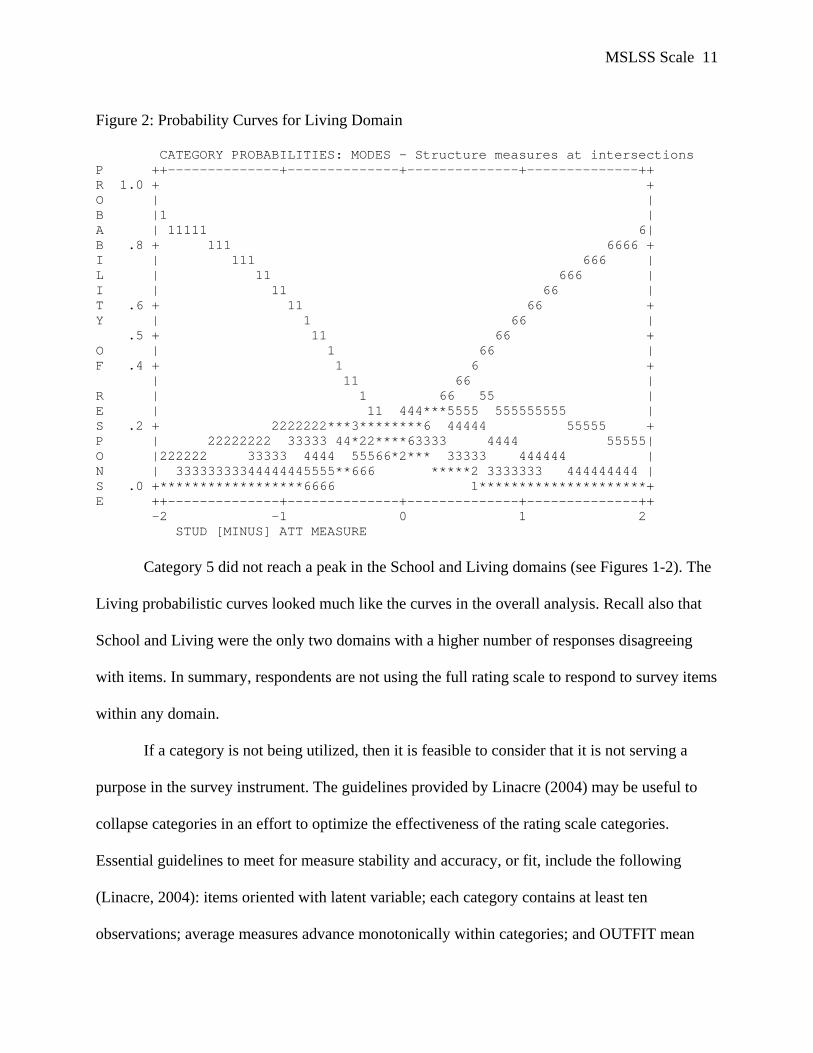
Figure 2: Probability Curves for Living Domain
CATEGORY PROBABILITIES: MODES - Structure measures at intersections P ++--------------+--------------+--------------+--------------++ R 1.0 + + O | | B |1 | A | 11111 6| B .8 + 111 6666 + I | 111 666 | L | 11 666 | I | 11 66 | T .6 + 11 66 + Y | 1 66 | .5 + 11 66 + O | 1 66 | F .4 + 1 6 + | 11 66 | R | 1 66 55 | E | 11 444***5555 555555555 | S .2 + 2222222***3********6 44444 55555 + P | 22222222 33333 44*22****63333 4444 55555| O |222222 33333 4444 55566*2*** 33333 444444 | N | 33333333344444445555**666 *****2 3333333 444444444 | S .0 +******************6666 1*********************+ E ++--------------+--------------+--------------+--------------++ -2 -1 0 1 2 STUD [MINUS] ATT MEASURE
Category 5 did not reach a peak in the School and Living domains (see Figures 1-2). The
Living probabilistic curves looked much like the curves in the overall analysis. Recall also that
School and Living were the only two domains with a higher number of responses disagreeing
with items. In summary, respondents are not using the full rating scale to respond to survey items
within any domain.
If a category is not being utilized, then it is feasible to consider that it is not serving a
purpose in the survey instrument. The guidelines provided by Linacre (2004) may be useful to
collapse categories in an effort to optimize the effectiveness of the rating scale categories.
Essential guidelines to meet for measure stability and accuracy, or fit, include the following
(Linacre, 2004): items oriented with latent variable; each category contains at least ten
observations; average measures advance monotonically within categories; and OUTFIT mean

MSLSS Scale 12
squares less than 2.0. Certain guidelines are helpful, but not necessary for stable and accurate
rating scale measures (Linacre, 2004): observations display a regular distribution; ratings imply
measures and measures imply ratings; and step difficulties advance by less than 5.0.
Inspection of the INFIT and OUTFIT MNSQ scores for the 40 items indicates that 9
items are outside the set cutoff of 0.6-1.4. Table 4 illustrates the fit statistics for items flagged as
poorly fitting by domain. Six items are above 1.4, signifying high variability of responses or
misfit to the model. Three of the items have INFIT or OUTFIT MNSQ scores of less than 0.6,
indicating less variability than is expected, or overfit, for the probabilistic model.
Table 4
Fit Statistics for Poorly Fitting Items by Domain
Item Domain INFIT MNSQ OUTFIT MNSQ
3 School 1.47 1.64
4 Friends 1.71 1.91
9 School 1.58 1.82
16 Friends 0.44 0.50
22 School 0.59 0.60
25 School 0.59 0.57
34 Living 1.27 1.54
35 Self 1.43 1.43
38 Friends 1.76 2.10
It is important to note that the Family domain’s items fit extremely well. Self and Living
also did very well in terms of fitting the probabilistic model, with only one item in each domain
identified slightly beyond the cutoff. The Self item stating “I like to try new things” (item 35) has
an INFIT MNSQ and OUTFIT MNSQ just above the 1.4 cutoff. “This town is filled with mean
people” (item 34) is the item within the Living domain that has an OUTFIT MNSQ above the 1.4

MSLSS Scale 13
cutoff. The domains of Friends and School did not fair as well. Notice from Table 4, three of the
9 items in Friends were flagged for review since the INFIT or OUTFIT statistics were outside the
set cutoff, along with 4 of the 8 in School. The two misfitting items within the Friends domain
are “I have a bad time with my friends” (item 4) and “I have enough friends” (item 38), while the
Friends domain has one overfitting item, “My friends treat me well” (item16). Of the items
flagged for review within the School domain, two items are misfitting the model, with two other
overfitting the model. The two misfitting items are “I feel bad at school” (item 3) and “There are
many things about school I don’t like” (item 9). The two overfitting items within the School
domain are “I like being in school” (item 22) and “School is interesting” (item 25). It is
important to note that all misfitting items except item 35 are negatively worded items while the
overfitting items are positive statements. The rating scale could be interpreted differently for
negatively worded items which would cause a misfit of these items.
A differential item function analysis within the Rasch model is used here to determine
whether the MSLSS survey is producing equivalent measures without discrimination in student
satisfaction across the five domains in African Americans and Caucasians in this study. The
analysis included 471 African American and 494 Caucasian respondents. Significant differential
responding occurred for each of the domains as listed in Table 5: 5 of 9 for Friends, 5 of 7 for
Family, 4 of 8 for School, 4 of 9 for Living, and 4 of 7 for Self. Nearly half the items on the
MSLSS survey demonstrated differential item functioning across race.
Table 5
DIF Analysis using differences in survey item estimates by race
Item African
Americans
Caucasians
DIF Measure
DIF Contrast Joint S.E. t-statistic

MSLSS Scale 14
6 (School) -0.86 -0.70 -0.16 0.06 -2.56
9 (School) 0.98 0.52 0.46 0.06 7.91
20 (School) -0.30 -0.08 -0.23 0.06 -4.03
26 (School) -0.81 -0.69 -0.13 0.06 -2.05
4 (Friends) -0.96 -1.36 0.40 0.07 5.52
11 (Friends) -0.94 -1.17 0.23 0.07 3.32
23 (Friends) -1.48 -1.26 -0.22 0.08 -2.77
29 (Friends) -1.37 -1.04 -0.33 0.07 -4.42
38 (Friends) -0.71 -0.44 -0.26 0.06 -4.47
7 (Family) -0.80 -0.58 -0.22 0.08 -2.92
18 (Family) -0.81 -0.62 -0.19 0.08 -2.40
19 (Family) -0.91 -0.75 -0.16 0.08 -2.01
28 (Family) -0.43 -0.64 0.21 0.07 2.85
30 (Family) -0.74 -0.93 0.19 0.08 2.36
32 (Living) -0.01 -0.14 0.13 0.05 2.71
36 (Living) -1.03 -0.75 -0.28 0.06 -4.68
37 (Living) -0.63 -0.43 -0.20 0.05 -3.89
39 (Living) 0.23 0.09 0.13 0.05 2.83
5 (Self) -1.15 -1.43 0.29 0.08 3.45
10 (Self) -0.86 -0.56 -0.29 0.07 -4.07
14 (Self) -2.01 -1.31 -0.80 0.11 -7.50
17 (Self) -0.67 -1.27 0.60 0.07 8.17
MSLSS Scale 15
The t-statistic is positive when the African American item difficulty measure is larger
than the estimate for Caucasians. Item numbers 4, 5, 9, 11, 17, 28, 30, 32, and 39 were more
difficult to endorse for African American respondents. Item numbers 6, 7, 10, 14, 18, 19, 20, 23,
26, 29, 36, 37, and 38 were more difficult to endorse for Caucasian respondents. Three of the
four differentially functioning items listed in the School domain are more likely to be endorsed
by the African American respondents. Of the differentially functioning items for the Friends
domain as well as Family, three of the five items were more likely to be endorsed by the African
American respondents. The items flagged for differential item functioning across race within the
Living and Self domains are split; in other words, two of the four items were more likely to be
endorsed by the African American respondents.
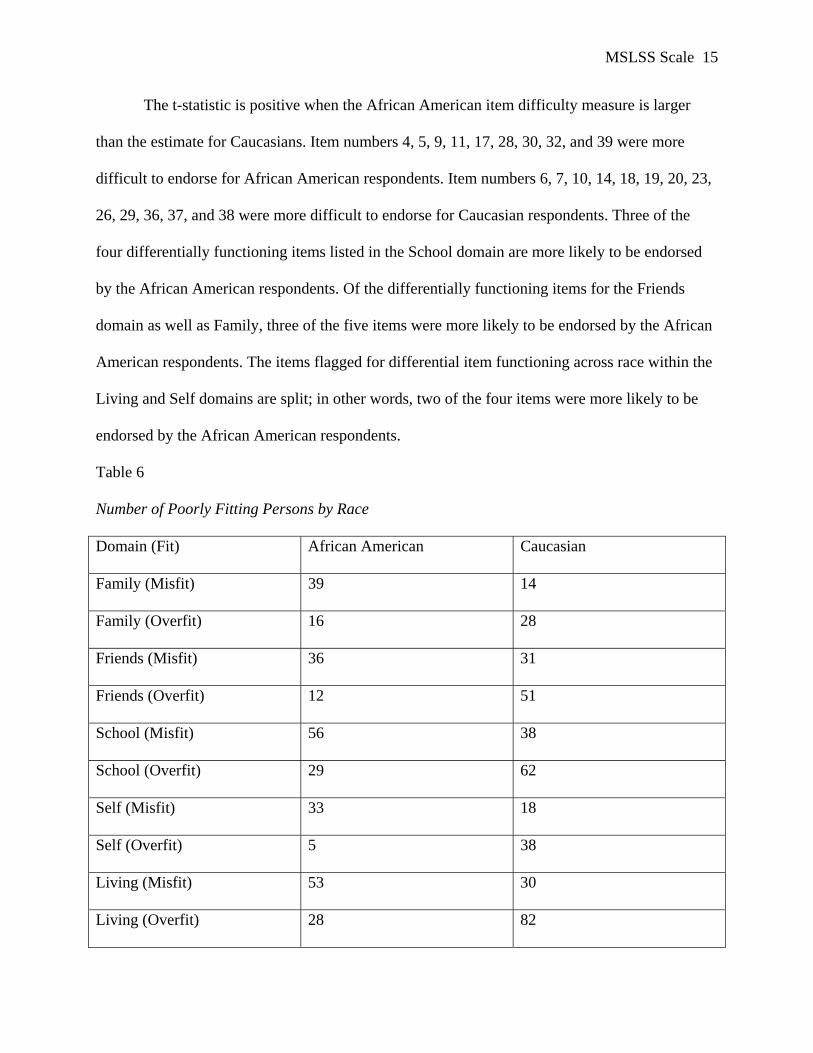
Table 6
Number of Poorly Fitting Persons by Race
Domain (Fit) African American Caucasian
Family (Misfit) 39 14
Family (Overfit) 16 28
Friends (Misfit) 36 31
Friends (Overfit) 12 51
School (Misfit) 56 38
School (Overfit) 29 62
Self (Misfit) 33 18
Self (Overfit) 5 38
Living (Misfit) 53 30
Living (Overfit) 28 82

MSLSS Scale 16
A higher number of African Americans, across all domains, were identified as poorly fitting
persons, while a higher number of Caucasians were identified as over fitting persons. This
finding indicates the survey instrument may not be accurately measuring life satisfaction across
race. Table 5 illustrates the numbers of respondents poorly fitting the model categorized by race.
School and Living have the highest number of persons misfitting and overfitting the model
which is consistent with School consisting of the more poorly fitting items than other domains.
Summary
This partial credit Rasch analysis of the MSLSS survey data has demonstrated several
key points. Rasch analysis is an effective and accurate way to analyze different dimensions of a
survey separately. The MSLSS survey fit the model fairly well, highlighting the domains with
the most poorly fitting items as School and Friends. The rating scale category effectiveness could
be improved to accurately measure the construct since it was shown that the respondents are not
using the full scale to respond to these items. This analysis has also demonstrated that 22 of the
40 survey items were flagged for differential item functioning across race. The suggestion would
be to proceed with caution in administering this survey in an effort to measure student life
satisfaction with a diverse group because this finding implies the measure might not mean the
same thing across race.
Concerns regarding construct bias in psychological assessment have been the subject of
ongoing research for a half century. Little research has investigated the psychometric
comparability of instruments designed to assess positive perceptions of individuals’ lives.
Assessment of life satisfaction is considered to be a key indicator of psychological well-being
among youth (Cowen, 1991; Kazden, 1993; Seligman, 1998). Studying the measurement

MSLSS Scale 17
properties of the MSLSS will aid in correct applications of the instrument and proper
interpretation of the scores reported.

MSLSS Scale 18
References
Allen, J., & Walsh, J. R. (2000). A construct-based approach to equivalence: Methodologies for
cross-cultural and multicultural personality assessment research. In R. Dana, Handbook
of multicultural/cross-cultural personality assessment. Mahwah, NJ: Lawrence Erlbaum
Associates.
Andrich, D. (1988). Rasch models for measurement. Sage University Paper Series on
Quantitative Applications in the Social Sciences, Series No. 07-068. Beverly
Hills: Sage Publications.
Bond, T., & Fox, C. (2001). Applying the Rasch model: Fundamental measurement in the
Human sciences. New Jersey: Lawrence Erlbaum Associates.
Clarke, I. (2000). Extreme response style in cross-cultural research: An empirical investigation.
Journal of Social Behavior and Personality, 15(1), 137-152.
Gilman, R., Huebner, E. S., & Laughlin, J. (2000). A first study of the Multidimensional
Students' Life Scale with adolescents. Social Indicators Research, 52, 135-160.
Huebner, E. S., Laughlin, J. E., Ash C., & Gilman, R. (1998). Further validation of the
Multidimensional Students' Life Satisfaction Scale. Journal of Psychological Assessment,
16, 118-134.
Huebner, E. S. (1994). Preliminary development and validation of a multidimensional life
satisfaction scale for children. Psychological Assessment, 6, 149-158.
Kan, C.C., Breteler, M.H.M., Van der Ven, A.H.G.S., & Zitman, F.G. (1998). An evaluation of
the DSM-III-R and ICD-10 Benzodiazepine Dependence Criteria using Rasch modeling.
Addiction, 93(3), 349-360.

MSLSS Scale 19
Krueger, R. F., & Finger, M. S. (2001). Using item response theory to understand comorbidity
among anxiety and unipolar mood disorders. Psychological Assessment, 13, 140-151.
Little, T. D. (1997). Mean and covariance structures (MACS) analyses of cross-cultural data:
Practical and theoretical issues. Multivariate Behavioral Research, 32, 53-76.
Ozer, D. J., & Reise, S. P. (1994). Personality Assessment. Annual Review of Psychology, 45,
357-388.
Santor, D. A., & Ramsay, J. O. (1998). Progress in the technology of measurement: applications
of item response models. Psychological Assessment, 10, 345-359.
Scheuneman, J. D., & Bleistein, C. A. (1999). Item Bias. In J. P. Keeves, J. P. And G. N. Masters
(Eds), Advances in Measurement in Educational Research and Assessment, 18. NY:
Pergamon.
Selner-O'Hagan, M. B., Kindlon, D. J., Buka, S. L., Raudenbush, S. W., & Earls, F. J. (1998).
Assessing exposure to violence in urban youth. Journal of Child Psychology and
Psychiatry. And Allied Discipline, 39(2), 215-224.
Wright, B. D., & Linacre, J. M. (1994). Reasonable mean-square fit values. Rasch Measurement
Transactions, 8(3), 370.
Wright, B. D., & Masters, G. N. (1982). Rating scale analysis. Chicago, IL: MESA Press.

MSLSS Scale 20
APPENDIX
MSLSS Survey Instrument (Huebner, 1994)
Circle 1 if you STONGLY DISAGREE with the sentence Circle 2 if you MODERATELY DISAGREE with the sentence Circle 3 if you MILDLY DISAGREE with the sentence Circle 4 if you MILDLY AGREE with the sentence Circle 5 if you MODERATELY AGREE with the sentence Circle 6 if you STRONGLY AGREE with the sentence
1. My friends are nice to me 1 2 3 4 5 6
2. I am fun to be around 1 2 3 4 5 6
3. I feel bad at school 1 2 3 4 5 6
4. I have a bad time with my friends 1 2 3 4 5 6
5. There are lots of things I can do well 1 2 3 4 5 6
6. I learn a lot at school 1 2 3 4 5 6
7. I like spending time with my parents 1 2 3 4 5 6
8. My family is better than most 1 2 3 4 5 6
9. There are many things about school I don't like 1 2 3 4 5 6
10. I think I am good looking 1 2 3 4 5 6
11. My friends are great 1 2 3 4 5 6
12. My friends will help me if I need it 1 2 3 4 5 6
13. I wish I didn't have to go to school 1 2 3 4 5 6
14. I like myself 1 2 3 4 5 6
15. There are lots of fun things to do where I live 1 2 3 4 5 6
16. My friends treat me well 1 2 3 4 5 6
17. Most people like me 1 2 3 4 5 6
18. I enjoy being at home with my family 1 2 3 4 5 6
19. My family gets along well together 1 2 3 4 5 6
20. I look forward to going to school 1 2 3 4 5 6
21. My parents treat me fairly 1 2 3 4 5 6

MSLSS Scale 21
Circle 1 if you STONGLY DISAGREE with the sentence Circle 2 if you MODERATELY DISAGREE with the sentence Circle 3 if you MILDLY DISAGREE with the sentence Circle 4 if you MILDLY AGREE with the sentence Circle 5 if you MODERATELY AGREE with the sentence Circle 6 if you STRONGLY AGREE with the sentence
22. I like being in school 1 2 3 4 5 6
23. My friends are mean to me 1 2 3 4 5 6
24. I wish I had different friends 1 2 3 4 5 6
25. School is interesting 1 2 3 4 5 6
26. I enjoy school activities 1 2 3 4 5 6
27. I wish I lived in a different house 1 2 3 4 5 6
28. Members of my family talk nicely to one another 1 2 3 4 5 6
29. I have a lot of fun with my friends 1 2 3 4 5 6
30. My parents and I do fun things together 1 2 3 4 5 6
31. I like my neighborhood 1 2 3 4 5 6
32. I wish I lived somewhere else 1 2 3 4 5 6
33. I am a nice person 1 2 3 4 5 6
34. This town is filled with mean people 1 2 3 4 5 6
35. I like to try new things 1 2 3 4 5 6
36. My family's house is nice 1 2 3 4 5 6
37. I like my neighbors 1 2 3 4 5 6
38. I have enough friends 1 2 3 4 5 6
39. I wish there were different people in my neighborhood 1 2 3 4 5 6
40. I like where I live 1 2 3 4 5 6