Using the PI System to Increase Throughput by Improving...
46
Presented by © Copyright 2013 OSIsoft, LLC. Using the PI System to Increase Throughput by Improving Process Stability & Capability Mike Jackson Nalco Industry Technical Consultant
-
Upload
dangkhuong -
Category
Documents
-
view
218 -
download
1
Transcript of Using the PI System to Increase Throughput by Improving...
Presented by
© Copyright 2013 OSIsoft, LLC.
Using the PI System to Increase Throughput by Improving Process Stability
& Capability
Mike Jackson Nalco Industry Technical Consultant

© Copyright 2013 OSIsoft, LLC.
• Nalco Company: Essential Expertise for Water, Energy, and AirSM
• World’s leading process improvement company
• 70,000 customers in more than 130 countries
• 75 years of experience in the hydrocarbon industries
2
© Copyright 2013 OSIsoft, LLC.
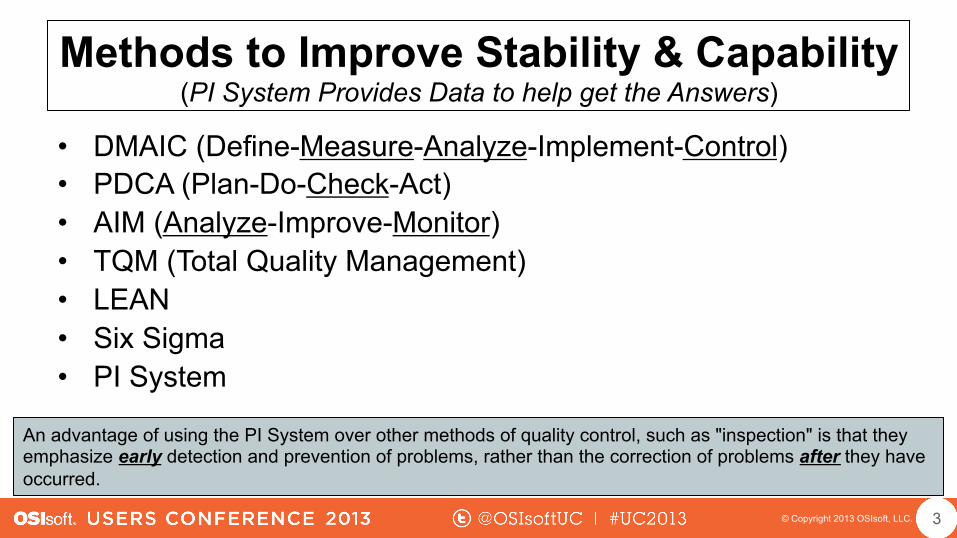
Methods to Improve Stability & Capability (PI System Provides Data to help get the Answers)
• DMAIC (Define-Measure-Analyze-Implement-Control) • PDCA (Plan-Do-Check-Act) • AIM (Analyze-Improve-Monitor) • TQM (Total Quality Management) • LEAN • Six Sigma • PI System
3
An advantage of using the PI System over other methods of quality control, such as "inspection" is that they emphasize early detection and prevention of problems, rather than the correction of problems after they have occurred.
© Copyright 2013 OSIsoft, LLC.
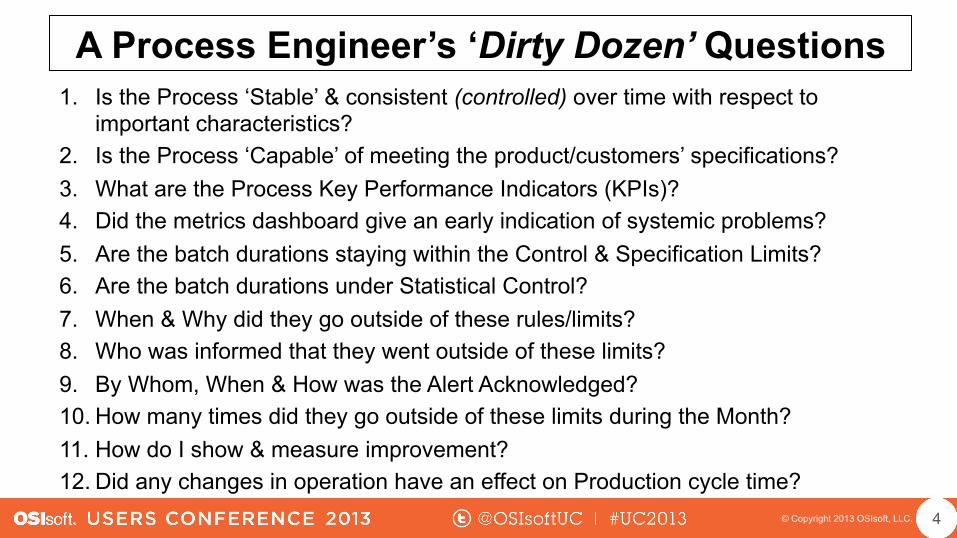
A Process Engineer’s ‘Dirty Dozen’ Questions
1. Is the Process ‘Stable’ & consistent (controlled) over time with respect to important characteristics?
2. Is the Process ‘Capable’ of meeting the product/customers’ specifications? 3. What are the Process Key Performance Indicators (KPIs)? 4. Did the metrics dashboard give an early indication of systemic problems? 5. Are the batch durations staying within the Control & Specification Limits? 6. Are the batch durations under Statistical Control? 7. When & Why did they go outside of these rules/limits? 8. Who was informed that they went outside of these limits? 9. By Whom, When & How was the Alert Acknowledged? 10. How many times did they go outside of these limits during the Month? 11. How do I show & measure improvement? 12. Did any changes in operation have an effect on Production cycle time?
4
© Copyright 2013 OSIsoft, LLC.
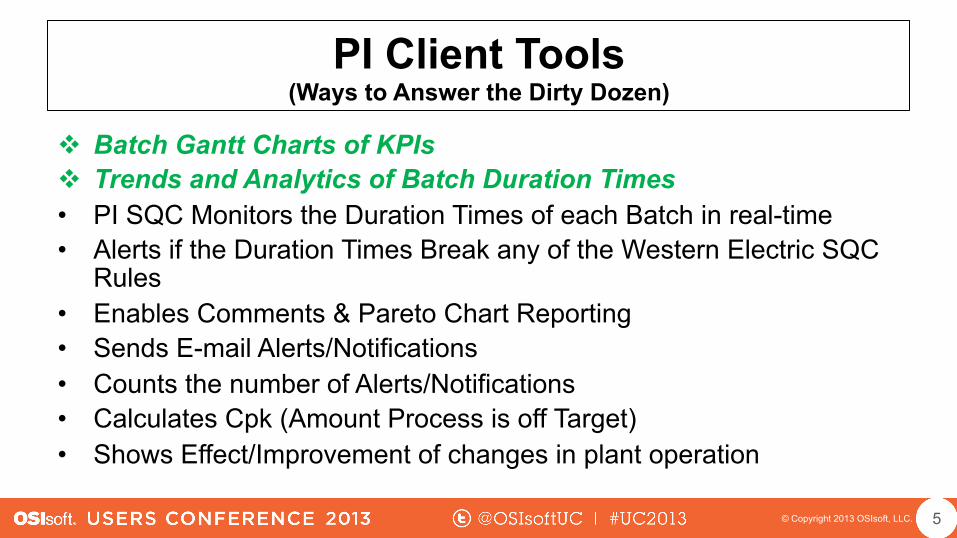
PI Client Tools (Ways to Answer the Dirty Dozen)
v Batch Gantt Charts of KPIs v Trends and Analytics of Batch Duration Times • PI SQC Monitors the Duration Times of each Batch in real-time • Alerts if the Duration Times Break any of the Western Electric SQC
Rules • Enables Comments & Pareto Chart Reporting • Sends E-mail Alerts/Notifications • Counts the number of Alerts/Notifications • Calculates Cpk (Amount Process is off Target) • Shows Effect/Improvement of changes in plant operation
5

© Copyright 2013 OSIsoft, LLC.
Process Engineer’s ‘OLD’ View of Process (How are Batches Comparing?)
ST ST ET ET
Batch A Batch B
• How did Batch A’s KPIs compare to Batch B’s? • When & Where did the differences occur??!!
6
© Copyright 2013 OSIsoft, LLC.
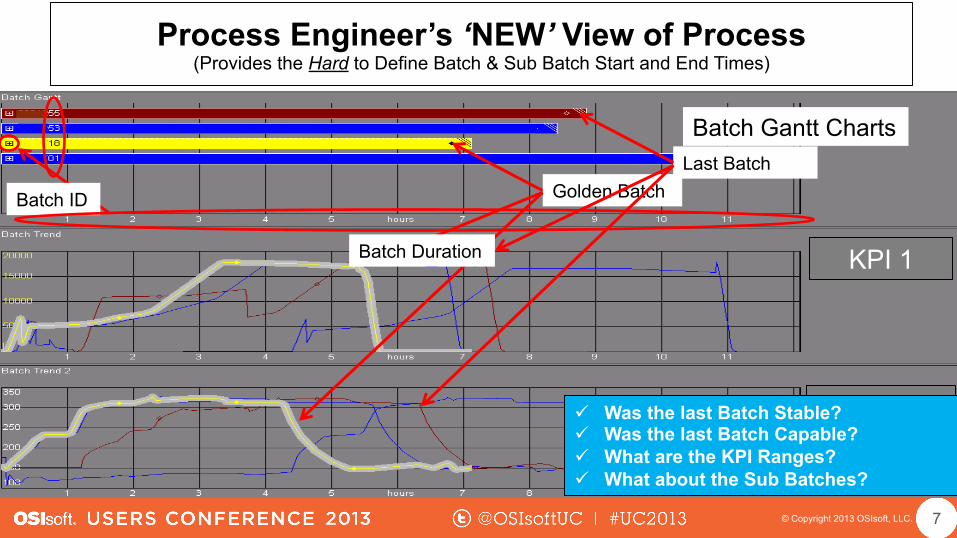
Process Engineer’s ‘NEW’ View of Process (Provides the Hard to Define Batch & Sub Batch Start and End Times)
7
Batch Gantt Charts
KPI 2
KPI 1
ü Was the last Batch Stable? ü Was the last Batch Capable? ü What are the KPI Ranges? ü What about the Sub Batches?
Golden Batch Batch ID
Batch Duration
Last Batch
© Copyright 2013 OSIsoft, LLC. 8
KPI 2
KPI 1
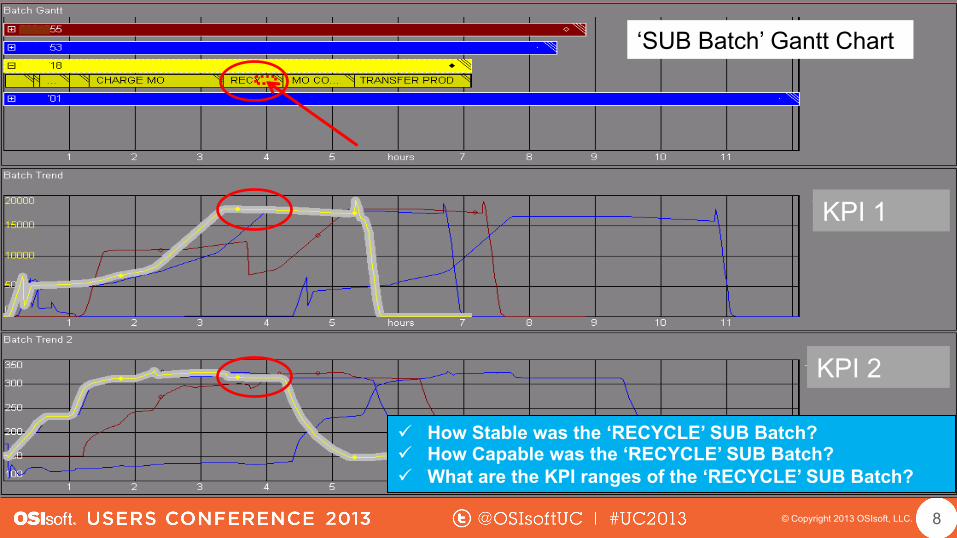
‘SUB Batch’ Gantt Chart
ü How Stable was the ‘RECYCLE’ SUB Batch? ü How Capable was the ‘RECYCLE’ SUB Batch? ü What are the KPI ranges of the ‘RECYCLE’ SUB Batch?

© Copyright 2013 OSIsoft, LLC. 9
KPI 2
KPI 1
All ‘RECYCLE’ SUB Batches Presented!
Right Click - Align

© Copyright 2013 OSIsoft, LLC. 10
KPI 2
KPI 1
All ‘RECYCLE’ SUB Batches Aligned!
ü How was this ‘RECYCLE’ SUB Batch Different?
© Copyright 2013 OSIsoft, LLC.
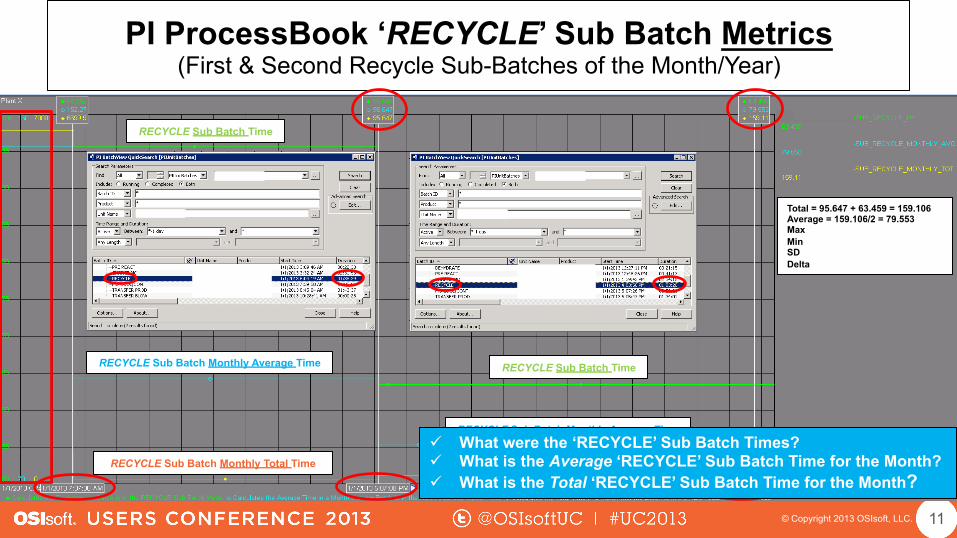
PI ProcessBook ‘RECYCLE’ Sub Batch Metrics (First & Second Recycle Sub-Batches of the Month/Year)
11
RECYCLE Sub Batch Time
RECYCLE Sub Batch Monthly Total Time
RECYCLE Sub Batch Monthly Average Time RECYCLE Sub Batch Time
RECYCLE Sub Batch Monthly Average Time
RECYCLE Sub Batch Monthly Total Time ü What were the ‘RECYCLE’ Sub Batch Times? ü What is the Average ‘RECYCLE’ Sub Batch Time for the Month? ü What is the Total ‘RECYCLE’ Sub Batch Time for the Month?
Total = 95.647 + 63.459 = 159.106 Average = 159.106/2 = 79.553 Max Min SD Delta
© Copyright 2013 OSIsoft, LLC.
Reactor
Product
BatchID
Batch Start Tim
e
Batch End Tim
e
Batch D
uration
Reactor D
own Tim
e
Monthly R
ecycle Average
Monthly R
ecycle Maxim
um
Monthly R
ecycle Minim
um
Monthly R
ecycle Total
Start Up
Ram
p
Agitate
Recycle
Cool Dow
n
Transfer
Idle Time
% Good
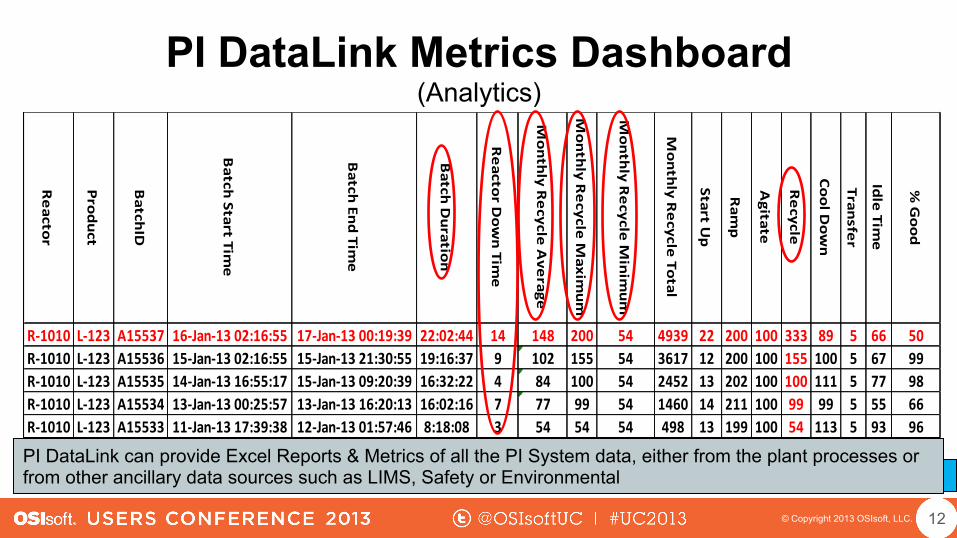
R-‐1010 L-‐123 A15537 16-‐Jan-‐13 02:16:55 17-‐Jan-‐13 00:19:39 22:02:44 14 148 200 54 4939 22 200 100 333 89 5 66 50R-‐1010 L-‐123 A15536 15-‐Jan-‐13 02:16:55 15-‐Jan-‐13 21:30:55 19:16:37 9 102 155 54 3617 12 200 100 155 100 5 67 99R-‐1010 L-‐123 A15535 14-‐Jan-‐13 16:55:17 15-‐Jan-‐13 09:20:39 16:32:22 4 84 100 54 2452 13 202 100 100 111 5 77 98R-‐1010 L-‐123 A15534 13-‐Jan-‐13 00:25:57 13-‐Jan-‐13 16:20:13 16:02:16 7 77 99 54 1460 14 211 100 99 99 5 55 66R-‐1010 L-‐123 A15533 11-‐Jan-‐13 17:39:38 12-‐Jan-‐13 01:57:46 8:18:08 3 54 54 54 498 13 199 100 54 113 5 93 96
PI DataLink Metrics Dashboard (Analytics)
12
ü Did the metrics dashboard give an early indication of systemic problems? PI DataLink can provide Excel Reports & Metrics of all the PI System data, either from the plant processes or from other ancillary data sources such as LIMS, Safety or Environmental
© Copyright 2013 OSIsoft, LLC.
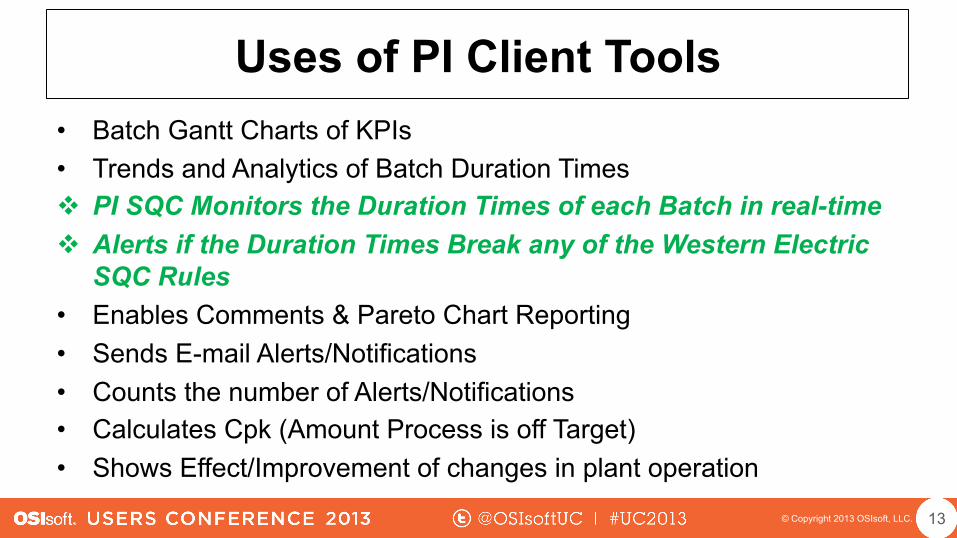
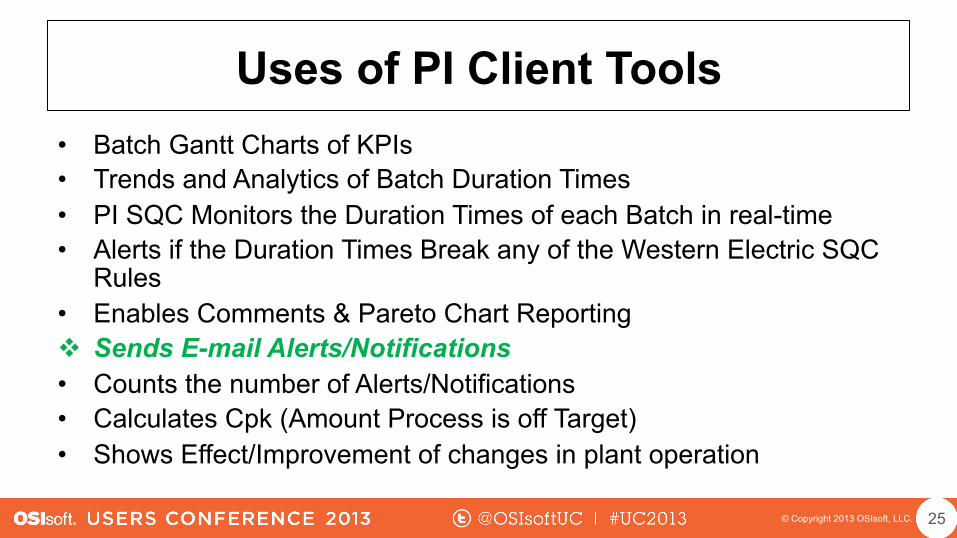
Uses of PI Client Tools • Batch Gantt Charts of KPIs • Trends and Analytics of Batch Duration Times v PI SQC Monitors the Duration Times of each Batch in real-time v Alerts if the Duration Times Break any of the Western Electric
SQC Rules • Enables Comments & Pareto Chart Reporting • Sends E-mail Alerts/Notifications • Counts the number of Alerts/Notifications • Calculates Cpk (Amount Process is off Target) • Shows Effect/Improvement of changes in plant operation
13

© Copyright 2013 OSIsoft, LLC.
All Recent ‘Product A’ Batch Durations
Is it Stable? Is it Capable?
Feed This Data Into an PI SQC Chart
14
© Copyright 2013 OSIsoft, LLC.
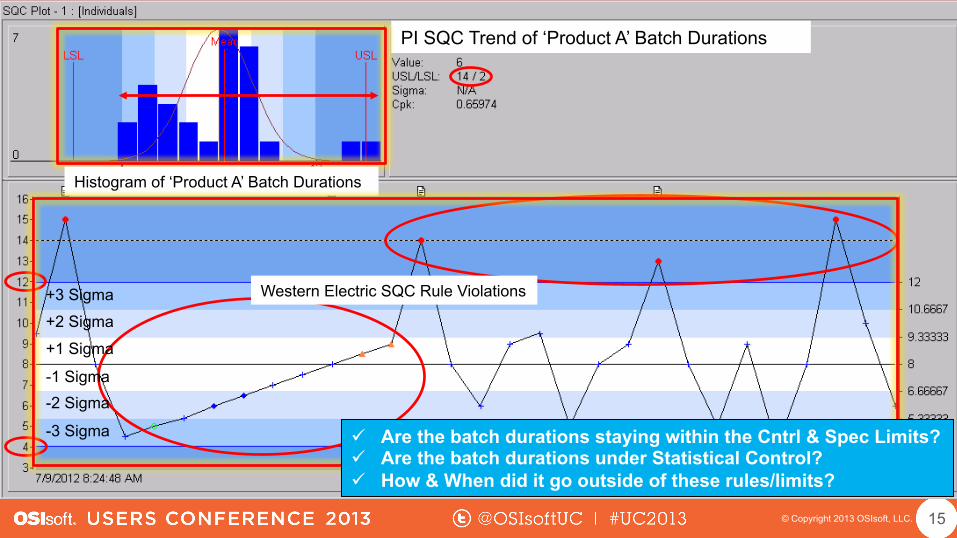
PI SQC Trend of ‘Product A’ Batch Durations
+3 Sigma
-3 Sigma
-2 Sigma -1 Sigma
+1 Sigma
+2 Sigma
Histogram of ‘Product A’ Batch Durations
Western Electric SQC Rule Violations
15
ü Are the batch durations staying within the Cntrl & Spec Limits? ü Are the batch durations under Statistical Control? ü How & When did it go outside of these rules/limits?

© Copyright 2013 OSIsoft, LLC.
PI SQC Uses the Western Electric SQC Rules
Decision rules for detecting out-of-control or non-random conditions on control charts
+3 Sigma
-3 Sigma
-2 Sigma
-1 Sigma
+1 Sigma +2 Sigma
16
© Copyright 2013 OSIsoft, LLC. 17
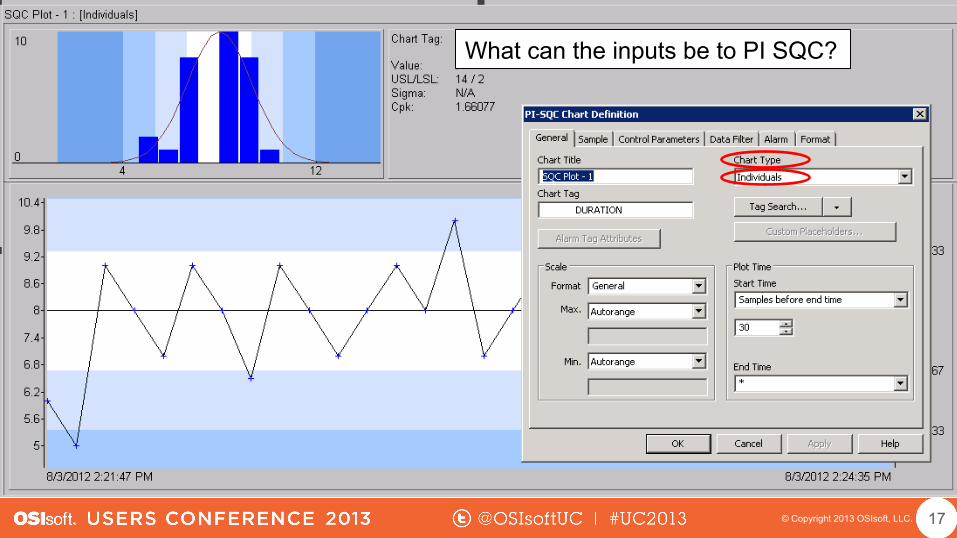
What can the inputs be to PI SQC?

© Copyright 2013 OSIsoft, LLC.
Possible PI SQC Chart Inputs • Types
– Individuals – X-Bar – Moving Average – EWMA (Exponentially-Weighted
Moving Average) – Standard Deviation – Moving Standard Deviation – Range – Moving Range
• Examples – Batch Time Durations – LIMS References/Results – Pump Flow Rates – Product Test Specifications – Environmental Testing
Limits – Maintenance Equipment
Monitoring – …
18

© Copyright 2013 OSIsoft, LLC.
Uses of PI Client Tools • Batch Gantt Charts of KPIs • Trends and Analytics of Batch Duration Times • PI SQC Monitors the Duration Times of each Batch in real-time • Alerts if the Duration Times Break any of the Western Electric SQC
Rules v Enables Comments & Pareto Chart Reporting • Sends E-mail Alerts/Notifications • Counts the number of Alerts/Notifications • Calculates Cpk (Amount Process is off Target) • Shows Effect/Improvement of changes in plant operation
19

© Copyright 2013 OSIsoft, LLC. 20
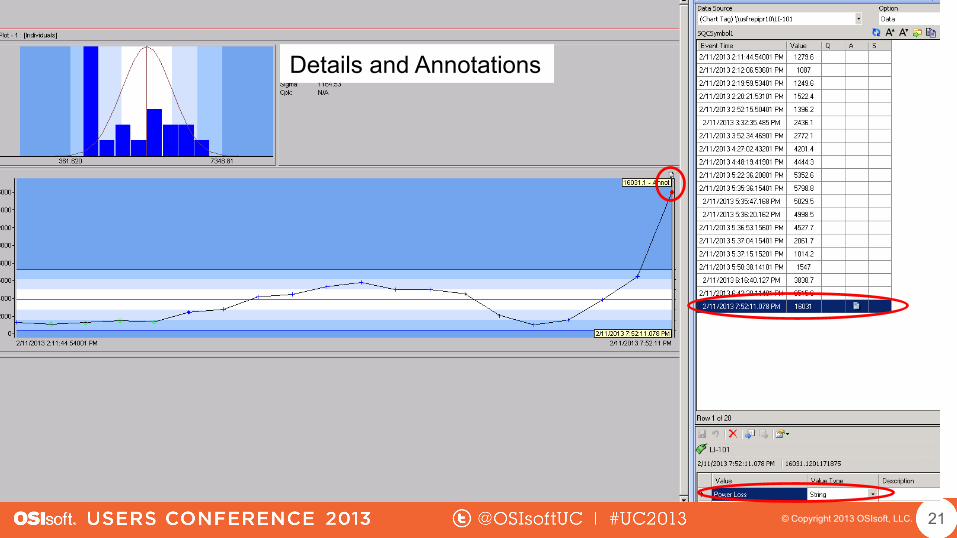
ü When & Why did it go outside of these rules/limits?
SQC Comments • Leaky Main Valve ü Power Loss • Ran out of Storage Tanks • Over Flowed Charging Tank • Dirty Water • Storms • Other
© Copyright 2013 OSIsoft, LLC. 21
Details and Annotations
© Copyright 2013 OSIsoft, LLC. 22
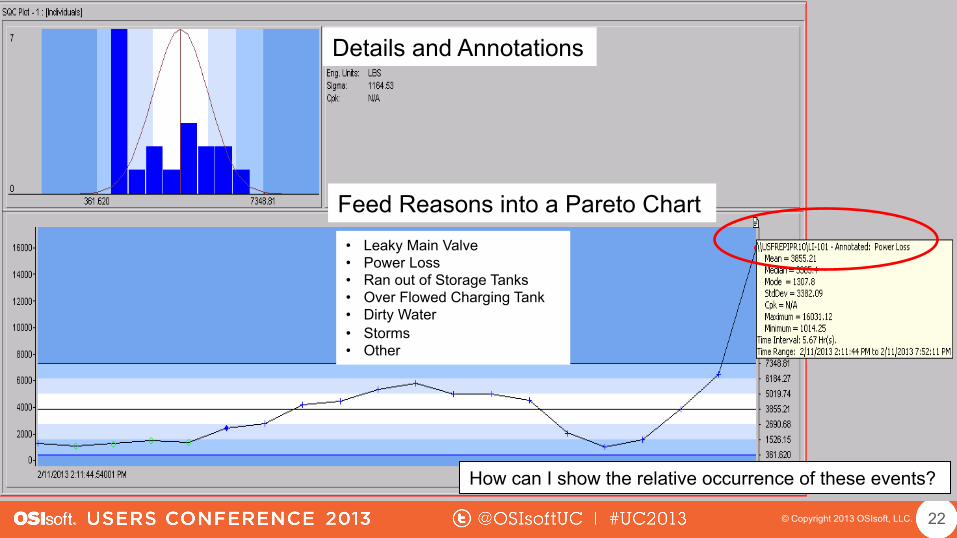
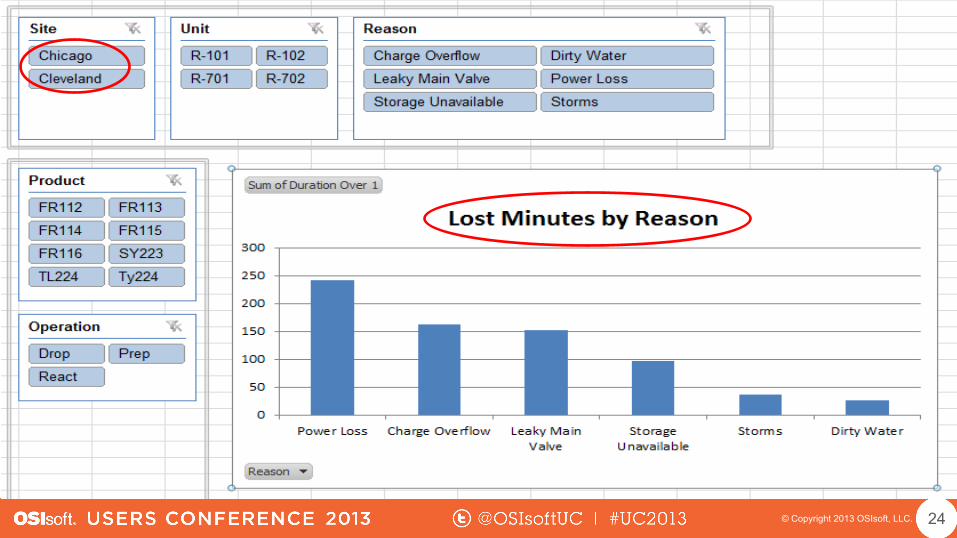
Feed Reasons into a Pareto Chart
How can I show the relative occurrence of these events?
• Leaky Main Valve • Power Loss • Ran out of Storage Tanks • Over Flowed Charging Tank • Dirty Water • Storms • Other
Details and Annotations

© Copyright 2013 OSIsoft, LLC. 23
ü Pareto Chart will show the relative occurrence of these events?
© Copyright 2013 OSIsoft, LLC. 24
© Copyright 2013 OSIsoft, LLC.
Uses of PI Client Tools • Batch Gantt Charts of KPIs • Trends and Analytics of Batch Duration Times • PI SQC Monitors the Duration Times of each Batch in real-time • Alerts if the Duration Times Break any of the Western Electric SQC
Rules • Enables Comments & Pareto Chart Reporting v Sends E-mail Alerts/Notifications • Counts the number of Alerts/Notifications • Calculates Cpk (Amount Process is off Target) • Shows Effect/Improvement of changes in plant operation
25

© Copyright 2013 OSIsoft, LLC.
1 of 1 Point Outside of 3 Sigma
ü Who was informed that it went outside of these limits?
26

© Copyright 2013 OSIsoft, LLC. 27
© Copyright 2013 OSIsoft, LLC.
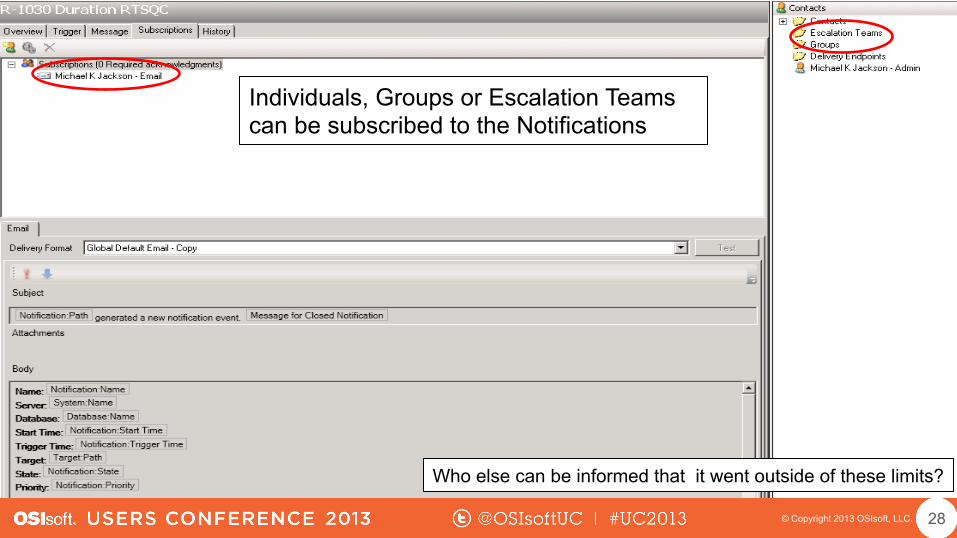
Individuals, Groups or Escalation Teams can be subscribed to the Notifications
28
Who else can be informed that it went outside of these limits?
© Copyright 2013 OSIsoft, LLC.
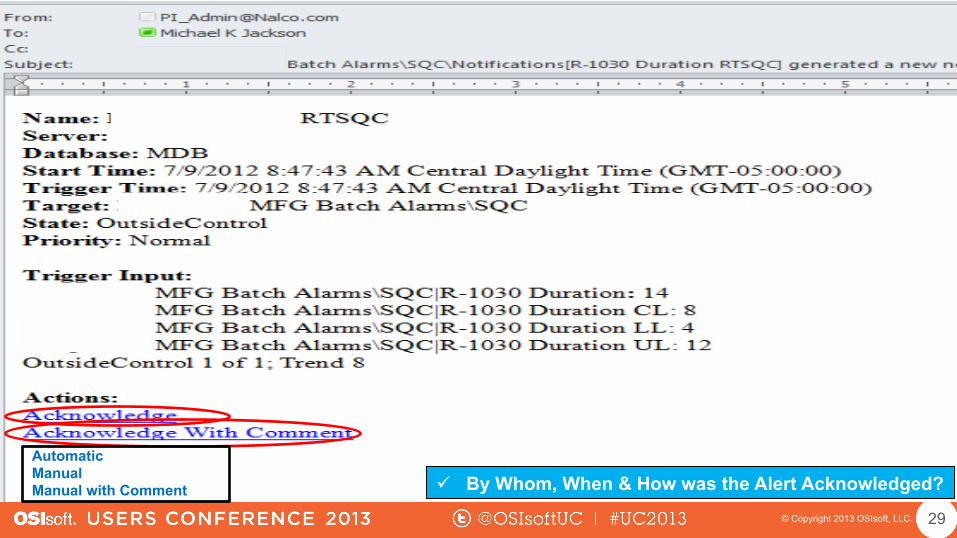
ü By Whom, When & How was the Alert Acknowledged? Automatic Manual Manual with Comment
29

© Copyright 2013 OSIsoft, LLC. 30
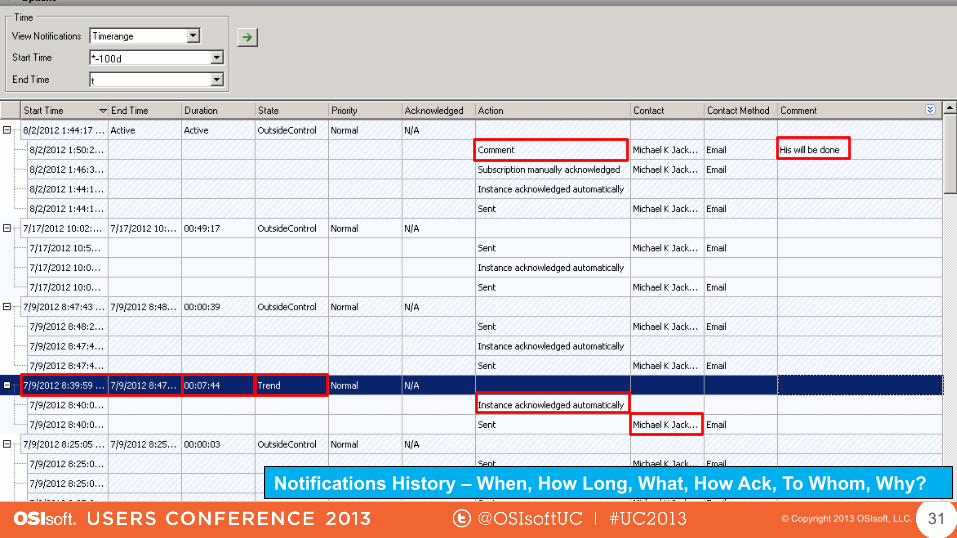
© Copyright 2013 OSIsoft, LLC. 31
Notifications History – When, How Long, What, How Ack, To Whom, Why?
© Copyright 2013 OSIsoft, LLC.
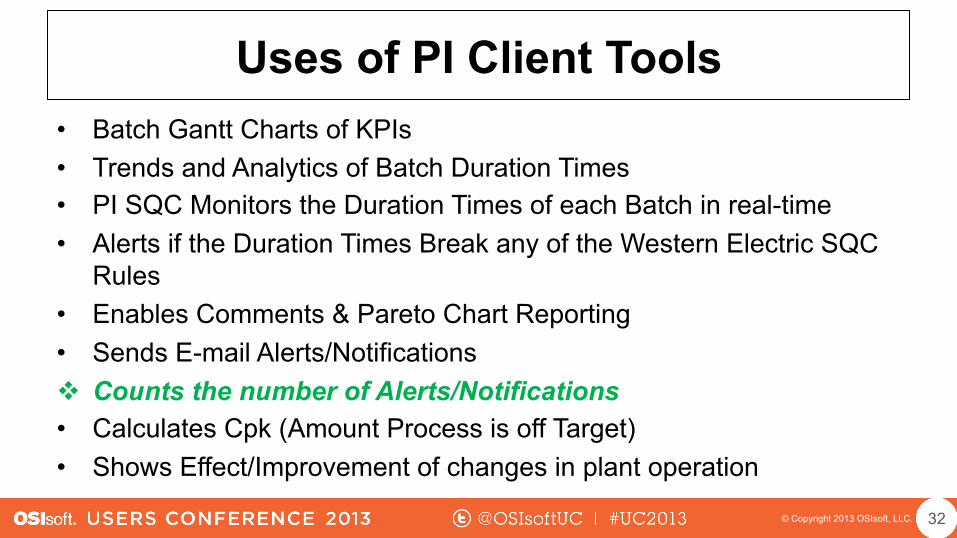
Uses of PI Client Tools • Batch Gantt Charts of KPIs • Trends and Analytics of Batch Duration Times • PI SQC Monitors the Duration Times of each Batch in real-time • Alerts if the Duration Times Break any of the Western Electric SQC
Rules • Enables Comments & Pareto Chart Reporting • Sends E-mail Alerts/Notifications v Counts the number of Alerts/Notifications • Calculates Cpk (Amount Process is off Target) • Shows Effect/Improvement of changes in plant operation
32
© Copyright 2013 OSIsoft, LLC.
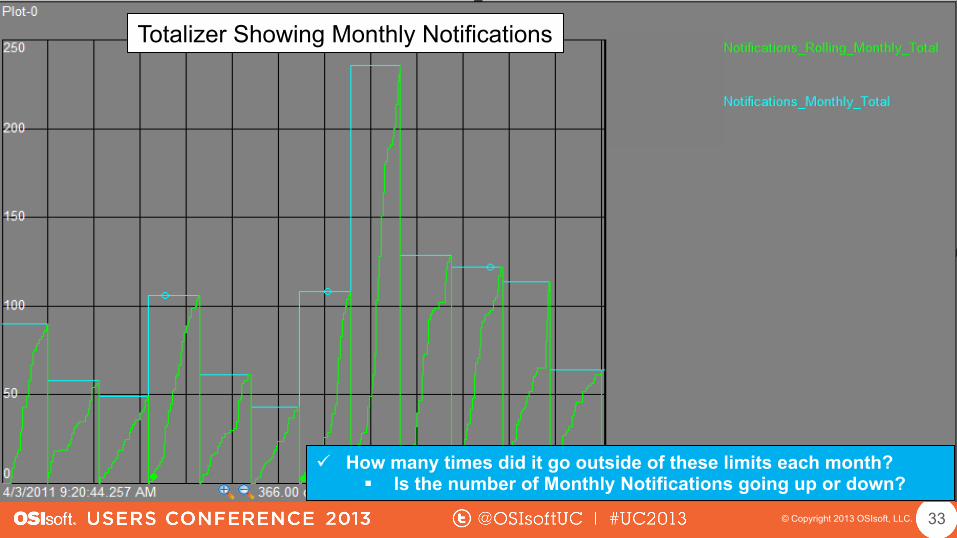
Totalizer Showing Monthly Notifications
ü How many times did it go outside of these limits each month? § Is the number of Monthly Notifications going up or down?
33
© Copyright 2013 OSIsoft, LLC. 34
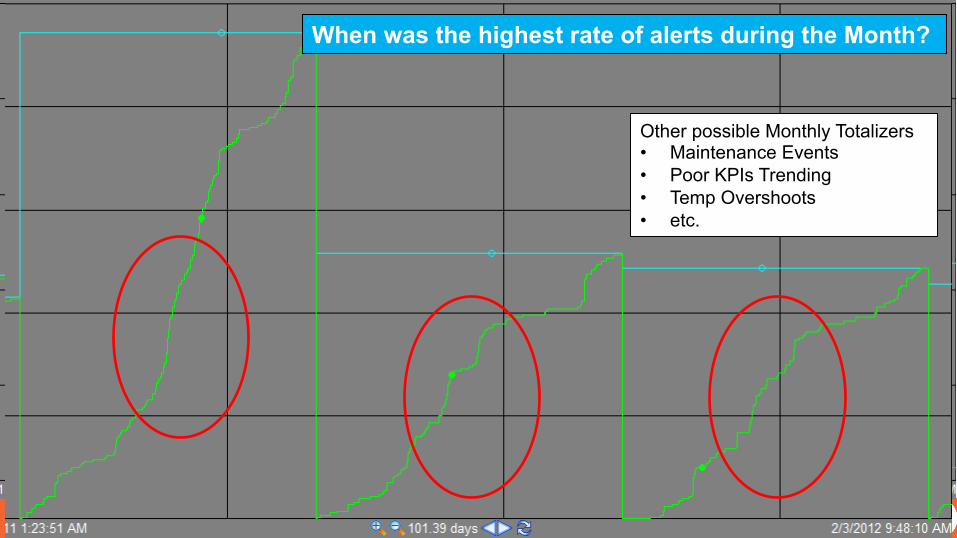
When was the highest rate of alerts during the Month?
Other possible Monthly Totalizers • Maintenance Events • Poor KPIs Trending • Temp Overshoots • etc.
© Copyright 2013 OSIsoft, LLC.
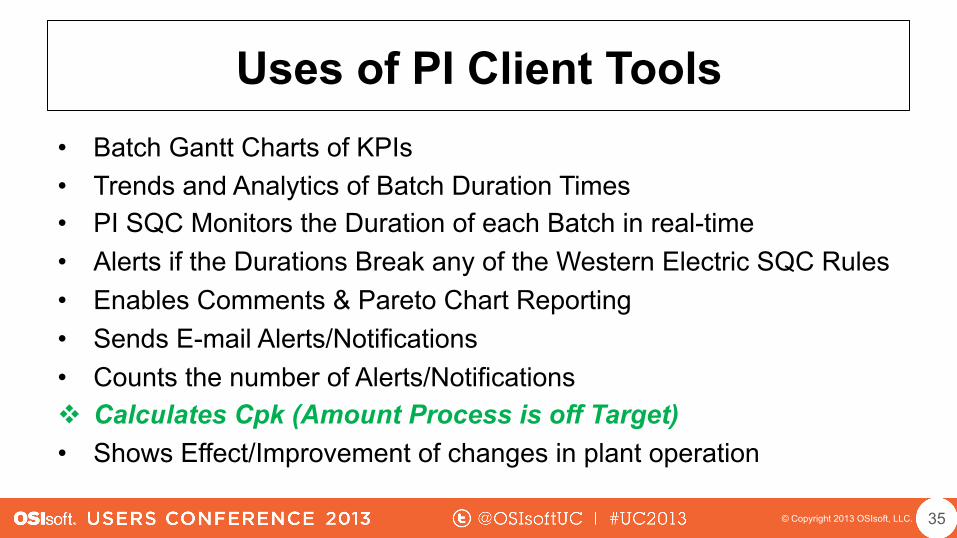
Uses of PI Client Tools • Batch Gantt Charts of KPIs • Trends and Analytics of Batch Duration Times • PI SQC Monitors the Duration of each Batch in real-time • Alerts if the Durations Break any of the Western Electric SQC Rules • Enables Comments & Pareto Chart Reporting • Sends E-mail Alerts/Notifications • Counts the number of Alerts/Notifications v Calculates Cpk (Amount Process is off Target) • Shows Effect/Improvement of changes in plant operation
35

© Copyright 2013 OSIsoft, LLC.
Cpk < 1, Means Poor Process Capability
+3 Sigma
-3 Sigma -2 Sigma
-1 Sigma
+1 Sigma
+2 Sigma
ü How do I show & measure improvement?
36
Cpk <1, Means Poor Process Capability
© Copyright 2013 OSIsoft, LLC.
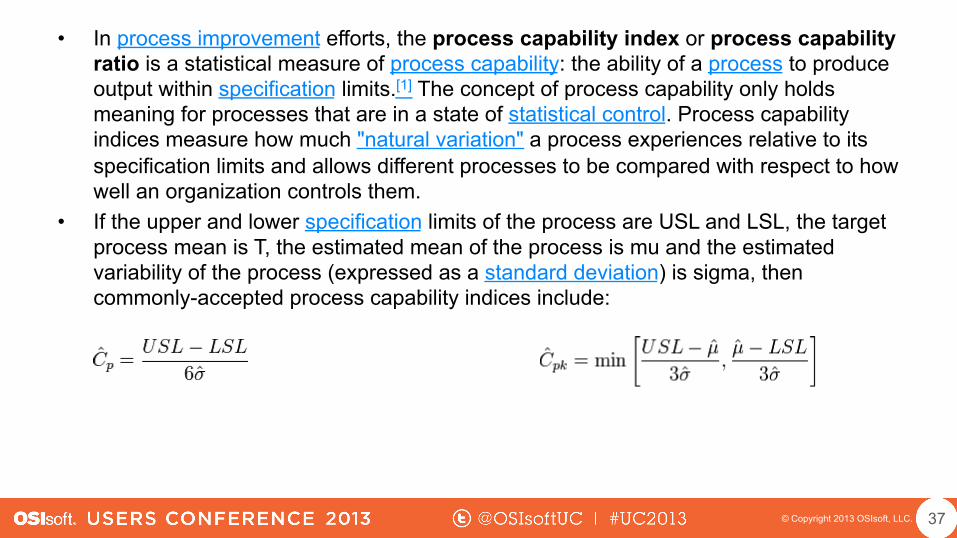
• In process improvement efforts, the process capability index or process capability ratio is a statistical measure of process capability: the ability of a process to produce output within specification limits.[1] The concept of process capability only holds meaning for processes that are in a state of statistical control. Process capability indices measure how much "natural variation" a process experiences relative to its specification limits and allows different processes to be compared with respect to how well an organization controls them.
• If the upper and lower specification limits of the process are USL and LSL, the target process mean is T, the estimated mean of the process is mu and the estimated variability of the process (expressed as a standard deviation) is sigma, then commonly-accepted process capability indices include:
37

© Copyright 2013 OSIsoft, LLC.
-2 Sigma
-1 Sigma
+1 Sigma
+2 Sigma
38
Cpk >=1, Means Excellent Process Capability
ü Is the Process ‘Capable’ of meeting the product/customers’ specifications?

© Copyright 2013 OSIsoft, LLC.
Uses of PI Client Tools • Batch Gantt Charts of KPIs • Trends and Analytics of Batch Duration Times • PI SQC Monitors the Duration Times of each Batch in real-time • Alerts if the Duration Times Break any of the Western Electric SQC
Rules • Enables Comments & Pareto Chart Reporting • Sends E-mail Alerts/Notifications • Counts the number of Alerts/Notifications • Calculates Cpk (Amount Process is off Target) v Shows Effect/Improvement of changes in plant operation
39
© Copyright 2013 OSIsoft, LLC. 40
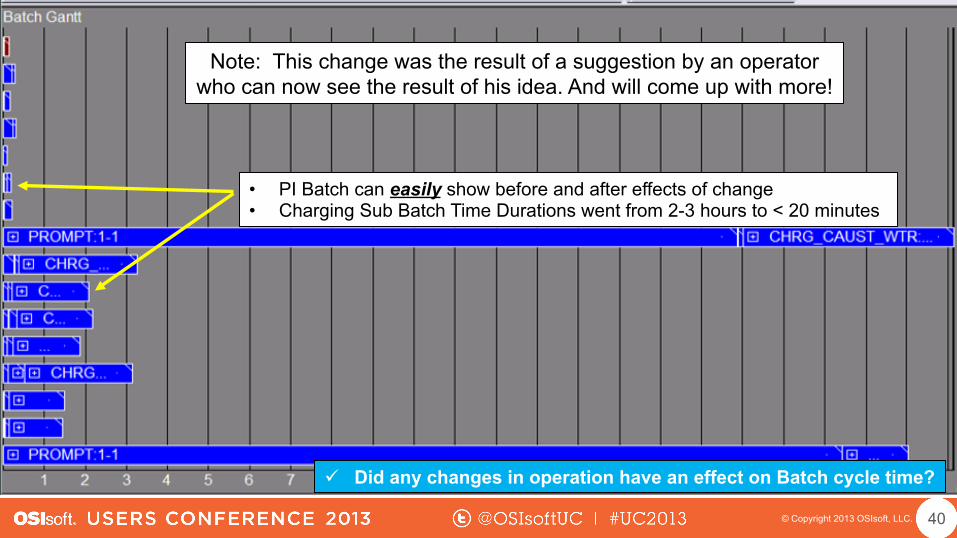
ü Did any changes in operation have an effect on Batch cycle time?
• PI Batch can easily show before and after effects of change • Charging Sub Batch Time Durations went from 2-3 hours to < 20 minutes
Note: This change was the result of a suggestion by an operator who can now see the result of his idea. And will come up with more!
© Copyright 2013 OSIsoft, LLC.
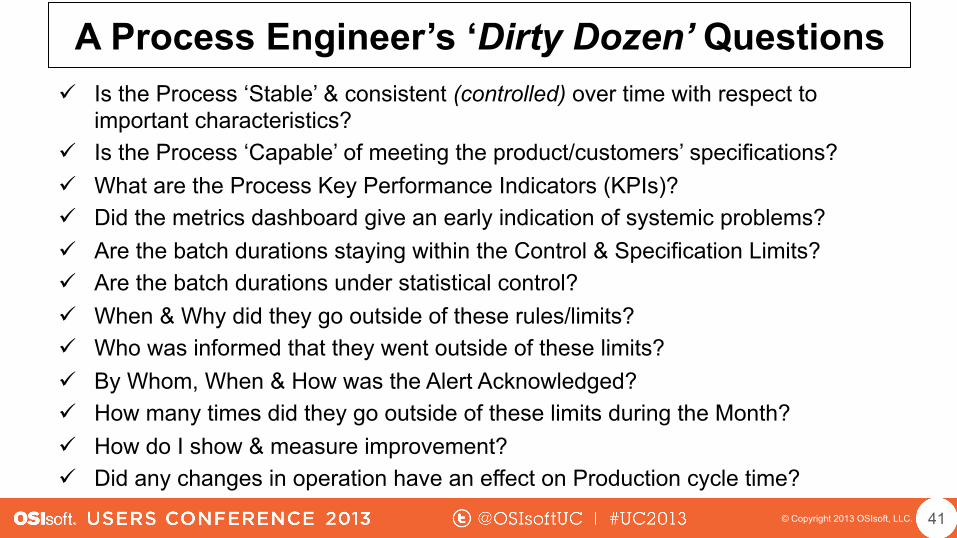
A Process Engineer’s ‘Dirty Dozen’ Questions
ü Is the Process ‘Stable’ & consistent (controlled) over time with respect to important characteristics?
ü Is the Process ‘Capable’ of meeting the product/customers’ specifications? ü What are the Process Key Performance Indicators (KPIs)? ü Did the metrics dashboard give an early indication of systemic problems? ü Are the batch durations staying within the Control & Specification Limits? ü Are the batch durations under statistical control? ü When & Why did they go outside of these rules/limits? ü Who was informed that they went outside of these limits? ü By Whom, When & How was the Alert Acknowledged? ü How many times did they go outside of these limits during the Month? ü How do I show & measure improvement? ü Did any changes in operation have an effect on Production cycle time?
41

© Copyright 2013 OSIsoft, LLC.
Knowing Process Stability & Capability can...
• Predict the percent of time that the process will fail to operate as required – defects, downgrades or rework
• Set the performance baseline from which to measure any improvements made
• Establish a benchmark against which we can compare other equipment, other plants, etc.
• Justify new technology if current process is incapable • Forecast the probability of missing a performance characteristic
– Cash flow – On-time delivery
42

© Copyright 2013 OSIsoft, LLC.
Results In… (More Stuff – More Better)
• Increased Quality • Increased Throughput • Reduced Waste • Reduced Rework • Reduced Staff Attrition • Less Discounted Off-Spec Batches • Increased Customer Loyalty
43
© Copyright 2013 OSIsoft, LLC.
“By Improving Process Stability and Capability, Harley Davison went from a manufacturer of
inferior and poor selling motorcycles to the worlds’ premier seller of top quality
bikes.”
Harley Owners' Group
Harley Davidson Believes in Improving Process Stability & Capability & So Does ‘REPO MAN’
As for Repo Man: • No Oil on His Garage Floor • REPO Man not left on the side of the
road • Thinks Harley Davidson would do
even better if THEY had the PI System too!
44
Associate

Presented by
© Copyright 2013 OSIsoft, LLC.
Q&A

Brought to you by
© Copyright 2013 OSIsoft, LLC.