
Using the normalcdf function on the...
16
Using the normalcdf function on the TI-84
-
Upload
duongquynh -
Category
Documents
-
view
221 -
download
1
Transcript of Using the normalcdf function on the...

Using the normalcdf function on the TI-84
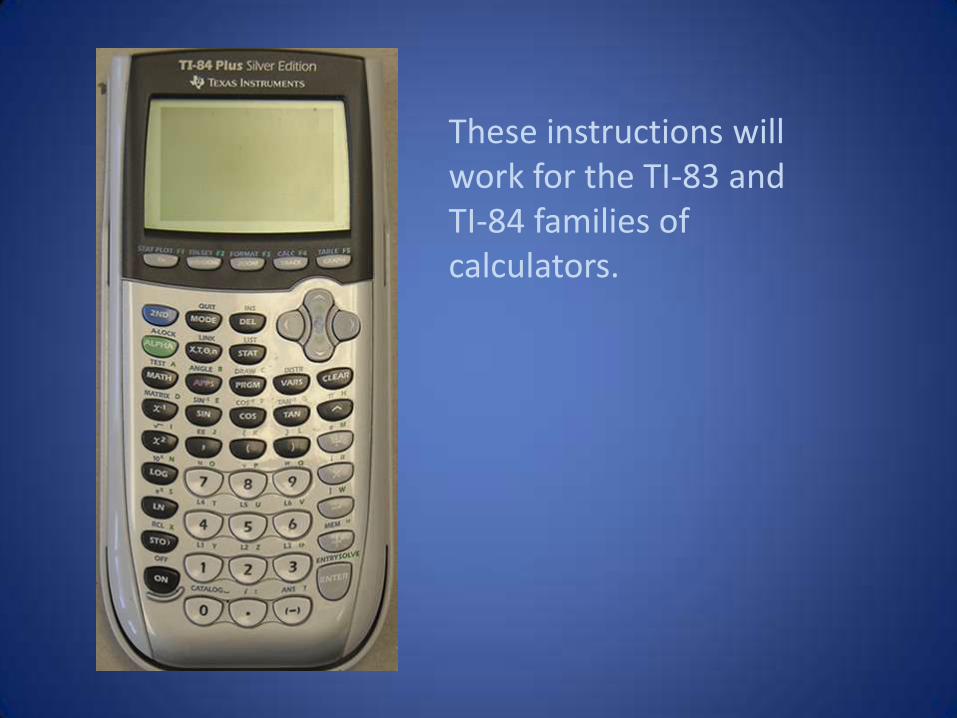
These instructions will work for the TI-83 and TI-84 families of calculators.

Read the problem carefully:
Consider the weights of 18 month old boys in the U.S. According to published growth charts, the average weight is approximately 11.8 kg with standard deviation of 1.28 kg. Calculate the percentage of 18 month old boys in the U.S. who weigh between 10.5 kg and 14.4 kg.

Draw a picture illustrating the problem and identify the important numbers.
Consider the weights of 18 month old boys in the U.S. According to published growth charts, the average weight is approximately 11.8 kg with standard deviation of 1.28 kg. Calculate the percentage of 18 month old boys in the U.S. who weigh between 10.5 kg and 14.4 kg.
First, identify the average.

Draw a picture illustrating the problem and identify the important numbers.
Consider the weights of 18 month old boys in the U.S. According to published growth charts, the average weight is approximately 11.8 kg with standard deviation of 1.28 kg. Calculate the percentage of 18 month old boys in the U.S. who weigh between 10.5 kg and 14.4 kg.
Next, identify the standard deviation.

Draw a picture illustrating the problem and identify the important numbers.
Consider the weights of 18 month old boys in the U.S. According to published growth charts, the average weight is approximately 11.8 kg with standard deviation of 1.28 kg. Calculate the percentage of 18 month old boys in the U.S. who weigh between 10.5 kg and 14.4 kg.
Now, identify the lower and upper boundary of the area you want.

Now you just need to enter the important numbers into the calculator in order. The rule is:First: Lower boundary = 10.5Second: Upper boundary = 14.4Third: Average = 11.8Fourth: Standard Deviation = 1.28
We’ll go through this keystroke by keystroke.

Access the normalcdffunction on the calculator by pressing 2nd.

Then press VARS to access the DISTR menu.

IMPORTANT!!You must choose the normalcdffunction, not the normalpdf. Do not ever use normalpdf!!
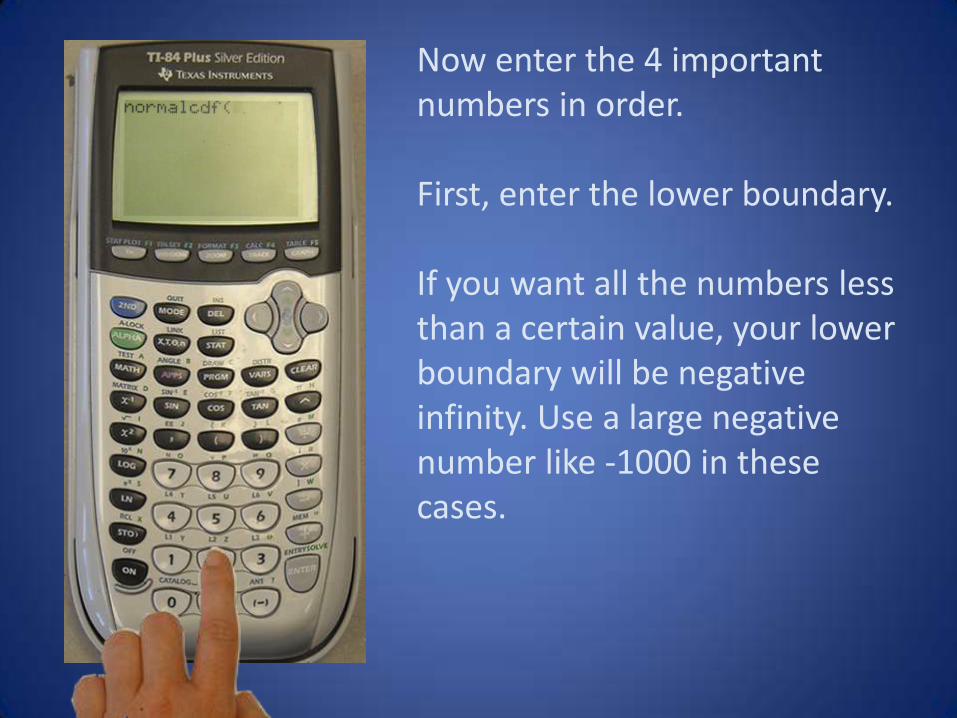
Now enter the 4 important numbers in order.
First, enter the lower boundary.
If you want all the numbers less than a certain value, your lower boundary will be negative infinity. Use a large negative number like -1000 in these cases.

Enter the lower boundary, 10.5, and then press the comma key.

Next, enter the upper boundary, 14.4, and then press the comma key again.
If you want all the numbers more than a certain value, your upper boundary will be positive infinity. Use a large positive number like 1000 in these cases.

Enter the average, 11.8, and then press the comma key.

Enter the standard deviation, 1.28, and then press the end parentheses key.
When you are interested in values under the standardnormal curve, enter 0,1 for the average and standard deviation.

Press Enter to get your answer.
Your answer will be a decimal, the proportion or fraction of the area under the normal curve. You may want to convert this number to a percentage.
Our answer is 82.4%