Using TCP/IP traffic shaping to achieve iSCSI service ...
159
UNIVERSITY OF OSLO Department of Informatics Using TCP/IP traffic shaping to achieve iSCSI service predictability Master thesis Jarle Bjørgeengen Oslo University College Oslo University/USIT May 26, 2010
Transcript of Using TCP/IP traffic shaping to achieve iSCSI service ...

UNIVERSITY OF OSLODepartment of Informatics
Using TCP/IP trafficshaping to achieve iSCSIservice predictability
Master thesis
Jarle BjørgeengenOslo University CollegeOslo University/USIT
May 26, 2010


Abstract
This thesis reproduces the properties of load interference common in manystorage devices using resource sharing for flexibility and maximum hardwareutilization. The nature of resource sharing and load is studied and comparedto assumptions and models used in previous work. The results are used to de-sign a method for throttling iSCSI initiators, attached to an iSCSI target server,using a packet delay module in Linux Traffic Control. The packet delay throttleenables close-to-linear rate reduction for both read and write operations. Ipt-ables and Ipset are used to add dynamic packet matching needed for rapidlychanging throttling values. All throttling is achieved without triggering TCPretransmit timeout and subsequent slow start caused by packet loss. A controlmechanism for dynamically adapting throttling values to rapidly changingworkloads is implemented using a modified proportional integral derivative(PID) controller. Using experiments, control engineering filtering techniquesand results from previous research, a suitable per resource saturation indicatorwas found. The indicator is an exponential moving average of the wait time ofactive resource consumers. It is used as input value to the PID controller man-aging the packet rates of resource consumers, creating a closed control loopmanaged by the PID controller. Finally a prototype of an autonomic resourceprioritization framework is designed. The framework identifies and maintainsinformation about resources, their consumers, their average wait time for ac-tive consumers and their set of throttleable consumers. The information iskept in shared memory and a PID controller is spawned for each resource,thus safeguarding read response times by throttling writers on a per-resourcebasis. The framework is exposed to extreme workload changes and demon-strates high ability to keep read response time below a predefined threshold.Using moderate tuning efforts the framework exhibits low overhead and re-source consumption, promising suitability for large scale operation in produc-tion environments.

Acknowledgements
I would like to express my gratitude to the following people:
• Management at the University of Oslo’s Central IT Department (USIT)for having the guts and ability to make long term investment in increasedcompetency, and for being a great place to work.
• Kjetil Kirkebø for advocating the arrangement with my employer, andfor flexible work arrangements during studies.
• Mark Burgess for initiating this master program, and for support andencouragement through a tedious and bureaucratic application process.
• Walter Martin Tveter, Bard Jakobsen, and Petter Reinholdtsen for sup-port and advice during the before mentioned application process.
• The master program committee for their positive attitude and supportduring the application process.
• The appeal committee at the Faculty of Mathematics and Natural Sci-ences at the University of Oslo, for reversing the decision to reject myapplication for the master program.
• Harek Haugerud for good advice during thesis writing and for his calmand empathic way of conveying knowledge to students.
• AEleen Frisch for thorough feedback on language and structure in thethesis.
• Kyrre Begnum for very useful thesis seminars, support through the progressand his profession oriented, enthusiastic and excellent teaching.
• Hugo Hammer for advice about statistical methods.
• The other teachers at Oslo university College for friendly and attentiveattitude when asked for help.
• My colleagues at the University of Oslo / USIT for general advice andbeing a massive source of professional knowledge.
• My classmates for fruitful discussions during the course of the masterprogram.
• My lovely wife and my family for their patience through the studies.

Contents
1 Introduction 71.1 Motivation . . . . . . . . . . . . . . . . . . . . . . . . . . . . . . . 71.2 Problem statement . . . . . . . . . . . . . . . . . . . . . . . . . . 9
2 Background material and previous work 112.1 About resource sharing . . . . . . . . . . . . . . . . . . . . . . . 112.2 SAN history . . . . . . . . . . . . . . . . . . . . . . . . . . . . . . 13
2.2.1 The early days . . . . . . . . . . . . . . . . . . . . . . . . . 132.2.2 SAN technologies . . . . . . . . . . . . . . . . . . . . . . . 14
2.3 Aspects of storage consolidation . . . . . . . . . . . . . . . . . . 152.4 Traffic shaping (TS) and Quality of Service (QoS) . . . . . . . . . 17
2.4.1 QoS core models . . . . . . . . . . . . . . . . . . . . . . . 182.5 Linux and QoS . . . . . . . . . . . . . . . . . . . . . . . . . . . . . 18
2.5.1 The network layer . . . . . . . . . . . . . . . . . . . . . . . 182.5.2 The block layer . . . . . . . . . . . . . . . . . . . . . . . . 20
2.6 SCSI . . . . . . . . . . . . . . . . . . . . . . . . . . . . . . . . . . . 212.7 iSCSI . . . . . . . . . . . . . . . . . . . . . . . . . . . . . . . . . . 22
2.7.1 Performance of iSCSI . . . . . . . . . . . . . . . . . . . . . 222.7.2 QoS and iSCSI . . . . . . . . . . . . . . . . . . . . . . . . . 242.7.3 iSCSI stability and enterprise readiness . . . . . . . . . . 24
2.8 QoS in SAN/NAS . . . . . . . . . . . . . . . . . . . . . . . . . . . 252.8.1 Stonehenge . . . . . . . . . . . . . . . . . . . . . . . . . . . 262.8.2 Cello . . . . . . . . . . . . . . . . . . . . . . . . . . . . . . 282.8.3 Facade . . . . . . . . . . . . . . . . . . . . . . . . . . . . . 282.8.4 Triage . . . . . . . . . . . . . . . . . . . . . . . . . . . . . . 292.8.5 Argon . . . . . . . . . . . . . . . . . . . . . . . . . . . . . . 292.8.6 Chameleon . . . . . . . . . . . . . . . . . . . . . . . . . . . 302.8.7 SARC/AVATAR . . . . . . . . . . . . . . . . . . . . . . . . 302.8.8 AQUA . . . . . . . . . . . . . . . . . . . . . . . . . . . . . 302.8.9 Four-tag SFQ . . . . . . . . . . . . . . . . . . . . . . . . . 332.8.10 Modeling iSCSI delay bounds . . . . . . . . . . . . . . . . 332.8.11 Adaptive SFQ . . . . . . . . . . . . . . . . . . . . . . . . . 342.8.12 Modeling RAIDs . . . . . . . . . . . . . . . . . . . . . . . 34
2

CONTENTS
2.9 Summary . . . . . . . . . . . . . . . . . . . . . . . . . . . . . . . . 35
3 Methodology 373.1 System model . . . . . . . . . . . . . . . . . . . . . . . . . . . . . 373.2 Tools and equipment . . . . . . . . . . . . . . . . . . . . . . . . . 38
3.2.1 Generating workload . . . . . . . . . . . . . . . . . . . . . 383.2.2 Measuring system behavior . . . . . . . . . . . . . . . . . 403.2.3 Hardware specifications . . . . . . . . . . . . . . . . . . . 433.2.4 Monitoring the network connection . . . . . . . . . . . . 433.2.5 Getting persistent device names . . . . . . . . . . . . . . . 453.2.6 Setting up bandwidth limitation . . . . . . . . . . . . . . 463.2.7 Delay limitation . . . . . . . . . . . . . . . . . . . . . . . . 483.2.8 Using Iptables and Ipset to classify traffic . . . . . . . . . 483.2.9 Argus usage . . . . . . . . . . . . . . . . . . . . . . . . . . 50
3.3 Challenges . . . . . . . . . . . . . . . . . . . . . . . . . . . . . . . 533.3.1 Network instability . . . . . . . . . . . . . . . . . . . . . . 533.3.2 LVM instability . . . . . . . . . . . . . . . . . . . . . . . . 53
4 System design 554.1 Choosing a throttling method . . . . . . . . . . . . . . . . . . . . 554.2 Discussion of the delay method . . . . . . . . . . . . . . . . . . . 58
4.2.1 Risks . . . . . . . . . . . . . . . . . . . . . . . . . . . . . . 584.2.2 Advantages . . . . . . . . . . . . . . . . . . . . . . . . . . 60
4.3 Bottleneck location . . . . . . . . . . . . . . . . . . . . . . . . . . 604.4 Throttling decision . . . . . . . . . . . . . . . . . . . . . . . . . . 61
4.4.1 Input signal . . . . . . . . . . . . . . . . . . . . . . . . . . 614.4.2 Output signal . . . . . . . . . . . . . . . . . . . . . . . . . 634.4.3 Tuning of the PID controller . . . . . . . . . . . . . . . . . 65
4.5 Automated operation . . . . . . . . . . . . . . . . . . . . . . . . . 674.5.1 Automatic population of throttling sets . . . . . . . . . . 694.5.2 Automatic determination of saturation monitors . . . . . 694.5.3 Per resource PID control . . . . . . . . . . . . . . . . . . . 70
5 Results 715.1 Without throttling . . . . . . . . . . . . . . . . . . . . . . . . . . . 715.2 Throttling by bandwidth limitation . . . . . . . . . . . . . . . . . 725.3 Throttling by packet delay . . . . . . . . . . . . . . . . . . . . . . 755.4 Introduced delay vs throughput . . . . . . . . . . . . . . . . . . . 775.5 Interference between loads demonstrated . . . . . . . . . . . . . 795.6 Effect of throttling on wait time . . . . . . . . . . . . . . . . . . . 805.7 PID control of response time . . . . . . . . . . . . . . . . . . . . . 815.8 Measuring overhead . . . . . . . . . . . . . . . . . . . . . . . . . 835.9 Automated PID control approach . . . . . . . . . . . . . . . . . . 84
3

6 Discussion and conclusion 896.1 Approach review . . . . . . . . . . . . . . . . . . . . . . . . . . . 896.2 Tools used . . . . . . . . . . . . . . . . . . . . . . . . . . . . . . . 906.3 Identification of resource utilization . . . . . . . . . . . . . . . . 916.4 Effect of interference . . . . . . . . . . . . . . . . . . . . . . . . . 916.5 Effects of throttling . . . . . . . . . . . . . . . . . . . . . . . . . . 926.6 Throttling decision . . . . . . . . . . . . . . . . . . . . . . . . . . 936.7 An automated framework . . . . . . . . . . . . . . . . . . . . . . 946.8 Throttling overhead . . . . . . . . . . . . . . . . . . . . . . . . . . 956.9 Future work and suggested improvements . . . . . . . . . . . . 966.10 Conclusion . . . . . . . . . . . . . . . . . . . . . . . . . . . . . . . 98
A I/O Throttlers 109
B Interface queueing setup 123
C Other scripts 127
D Collection of fio job definitions 149
E Collection of commands 151
List of Figures
1.1 General example of resource saturation vs. response time . . . . 9
3.1 Concept sketch of the lab setup . . . . . . . . . . . . . . . . . . . 383.2 Experiment automated workflow. The workflow and collected
data is the same for all experiments, except those in chapter 5.4. 393.3 Graph depicting the egress queues used for bandwidth outgo-
ing limitations . . . . . . . . . . . . . . . . . . . . . . . . . . . . . 473.4 Graph depicting the egress queues used for packet delay in both
directions . . . . . . . . . . . . . . . . . . . . . . . . . . . . . . . . 493.5 Comparison between initiator, network and target-logical-volume
rates when reading . . . . . . . . . . . . . . . . . . . . . . . . . . 513.6 Comparison between initiator, network and target-logical-volume
rates when writing . . . . . . . . . . . . . . . . . . . . . . . . . . 52
4.1 Principle of throttling by delaying packets . . . . . . . . . . . . . 58
4

LIST OF FIGURES
4.2 Comparison of average wait time of the iSCSI block device andthe logical volume servicing it on the target server, when run-ning 6 interfering write threads from 3 other machines . . . . . . 61
4.3 Finding a reasonable moving average. Blue is actual samplesfrom small job. The green plot shows the moving median withwsize=6. The red plot shows the EWMA with α = 0.15. . . . . . 63
4.4 Block diagram of a PID controller. Created by [101]. Licensedunder the terms of Creative Commons Attribution 2.5 Generic. . 66
4.5 Automated controller framework overview . . . . . . . . . . . . 68
5.1 Equal sequential read load from four identically equipped bladeservers without throttling . . . . . . . . . . . . . . . . . . . . . . 72
5.2 Throttling of initiator’s sequential read activity using Hierarchi-cal Token Bucket bandwidth (HTB) limitation in tc(1). Two in-dependent runs are stacked on top of each other for verificationof result repeatability. . . . . . . . . . . . . . . . . . . . . . . . . 74
5.3 Throttling of initiator’s sequential read activity using delayedACK packets in tc(1) (See Figure 3.2.7 ). . . . . . . . . . . . . . . 76
5.4 Throttling of initiator’s sequential write activity using delayedACK packets in tc(1) (See Figure 3.2.7 ). . . . . . . . . . . . . . . 76
5.5 Repeated measurements of the time used to read 200 MB withstepwise increase in artificial delay of outgoing packets from tar-get server. . . . . . . . . . . . . . . . . . . . . . . . . . . . . . . . . 78
5.6 Repeated measurements of the time used to write 200 MB withstepwise increase in artificial delay of outgoing packets (ACKpackets) from target server. . . . . . . . . . . . . . . . . . . . . . . 78
5.7 The effect on average wait time for smalljob on b2 with interfer-ing write activity from 1 and 3 other machines respectively. . . 80
5.8 The effect on small job’s wait time when throttling interferingloads with delays of 4.6 ms and 9.6 ms respectively. . . . . . . . 81
5.9 The average wait time of a rate limited (256kB/s) random readjob interfered by 12 write threads started simultaneously and re-peated with 5 seconds pause in between. The black plot showsthe effect with free resource competition. The colored plots showhow the PID regulator keeps different response time thresholdsby regulating interfering workloads. . . . . . . . . . . . . . . . . 82
5.10 The aggregated throughput caused by throttling to keep laten-cies at the set thresholds in Figure 5.9. . . . . . . . . . . . . . . . 83
5

5.11 The average wait time of a rate limited (256kB/s) random readjob interfered by 12 write threads started simultaneously and re-peated with 5 seconds pause in between. The black plot showsthe effect with free resource competition. The colored plots showhow the PID regulator keeps different response time thresholdsby regulating interfering workloads. In this plot, the resourcesaturation indicator and the set of throttleable host are main-tained automatically. . . . . . . . . . . . . . . . . . . . . . . . . . 85
5.12 The aggregated throughput caused by throttling to keep laten-cies at the set thresholds in Figure 5.11 . . . . . . . . . . . . . . . 86
5.13 The resource average wait time, the throttling delay and the ag-gregated write rate with a set resource-wait-time-threshold of15ms . . . . . . . . . . . . . . . . . . . . . . . . . . . . . . . . . . 87
6.1 Illustration of how the framework could be utilized as an inde-pendent black box with limited array knowledge. . . . . . . . . 97
List of Tables
3.1 IBM blade server specifications . . . . . . . . . . . . . . . . . . . 433.2 Dell iSCSI server specifications . . . . . . . . . . . . . . . . . . . 443.3 IBM Bladecenter switch specifications . . . . . . . . . . . . . . . 45
6

Chapter 1
Introduction
1.1 Motivation
Consolidation of server and storage resources is an ongoing trend in the ITbusiness, driven by economy-of-scale benefits [1, 2]. Consolidation of diskresources into SANs has been going on for 10 - 15 years, and centralized poolsof storage resources are now the rule rather than the exception.
The University of Oslo is no exception to the trend, and has a growing numberof centralized storage pools based on Storage Area Network (SAN) technolo-gies from different vendors. On several occasions the lack of predictability ofthese devices’ service availability has been suprising. The total performancebenefit of spreading a workload across large physical resource pools is accom-panied by a major cost with respect to load interference. Several times it wasexperienced that a few storage consumers’ activity adversely affected a largeamount of other consumers’ ability to meet their performance requirements.
In order to utilize centralized storage pools, mechanisms for dividing a pool’sresources into suitable chunks is needed. These mechanisms usually involvesome kind of virtualization technology. Virtualization provides the elasticityand adaptability required to make consolidation feasible.
Early SAN technology exclusively utilized dedicated fibrechannel (FC) net-works. Such networks use special purpose HBAs (Host Bus Adapters), switchesand storage arrays. The cost of acquiring and operating such solutions was ini-tially very expensive, but has become less expensive with increased adoption.FC SANs represented the only technology that could provide sufficient perfor-mance and capacity for the enterprise data storage purpose.
7

CHAPTER 1. INTRODUCTION
This is about to change. As the performance of standard Ethernet equipmentis increasing, with its cost remaining low due to production volume and com-petition, new methods for accessing SAN storage have evolved. A recent andgrowing trend is to utilize standard Ethernet network equipment for transportof SCSI (Small Computer System Interface) commands. The most widely, andincreasingly, used protocol for this purpose is the iSCSI (internetSCSI) proto-col. Predictions from several storage analysts [3, 4] forecast that the market foriSCSI based storage solutions has definitely entered the mainstream adoptionphase.
To achieve performance, optimal hardware resource utilization and flexible re-source allocation, all SAN solutions imply some kind of resource sharing. Thisresource sharing is vital for the benefits mentioned, but there is a flip side tothis ”resource sharing model”: storage consumers’ behavior will impact avail-able capacity for other consumers unless there is a prioritization mechanism inplace and when utilization of a resource approaches 100% of its capacity, newconsumer requests’ response time increases dramatically.
The University of Oslo utilizes HP Storageworks EVA8000 SAN disk-arrays forstoring large amounts of important application data. Despite many years of re-search within QoS for Storage, these storage devices illustrate how the abilityto prioritize storage performance for consumers’ disparate needs is still notan available option (See chap 2.8), even for expensive disk systems like the HPStorageworks EVA. At the University of Oslo there are several examples wheresingle applications on single computers are able to monopolize all storage re-sources. This is particularly true for consumers sharing EVA disk-groups. Thelack of ability to prioritize loads increases response time uncertainty for nu-merous important applications, a situation that potentially leads to downtimefor a large number of users (See illustration in figure 1.1). At the time of writ-ing, the previously mentioned disk systems does not come with efficient toolsto discover which storage consumer is the culprit in such situations withoutexpert knowledge.
Resource sharing is good for enabling large scale consolidation with the economy-of-scale benefits, but it also adds a cost: reduced predictability of service avail-ability for any storage consumer sharing resources with others. Service LevelAgreements (SLAs) presupposes predictability in service delivery (see alsosection 2.3). Lower predictability is caused by the lack of prioritization func-tionality in storage devices. This condition makes it hard, or impossible, tomake keepable promises in the form of Service Level Agreements, and ulti-mately increases the risk for SLA violations.
8

1.2. PROBLEM STATEMENT
120 1 2 3 4 5 6 7 8 9 10 11
0
2
4
6
8
10
12
14
16
18
Resource consumption
Resp
oins
e tim
e Total capacity
System response time SLA broken => slow
System availability SLA broken => unavailable
Figure 1.1: General example of resource saturation vs. response time
1.2 Problem statement
Motivated by chapter 1.1, this project explores novel methods of utilizing wellknown and trusted tools as a means to mend the reduced predictability intro-duced by resource sharing in iSCSI storage devices.
Even though most FC SAN storage appliances do not have mechanisms forprioritization, and implementing such mechanisms in FC SANs is hard, theemergence of IP-based SANs, with iSCSI as the most widely used variant, in-creases the solution space for implementing such mechanisms. Qualified spec-ulations may suggest that the overhead introduced by allowing I/O requeststo traverse an extra layer of abstraction, namely the TCP network layer, makesiSCSI unsuitable in high performance SAN environments. These speculationsis analyzed and partly refuted in chapter 2. But what is just as interesting, isthe opportunity to utilize well known QoS tools from the networking world tocreate a unified QoS picture including both storage and network resources.
Difficulties in trusting prioritization mechanisms to do the right thing, in amission critical environment, can be an inhibitor for adopting them [5]. Manyof the current approaches to storage QoS involve intrusive techniques (see
9

CHAPTER 1. INTRODUCTION
chap 2), imposing a new mechanism in between the client and the server. In-trusive approaches like this, and those which depend on client side schedul-ing/throttling, face a higher need for reasoning to convince users to trust themechanisms. Also, the obvious disadvantage of needing to modify clients isthe uncertainty about whether some clients have not been modified, since fail-ure to do so let these clients bypass the QoS framework. The advantage ofusing TCP traffic shaping is that the same effect can be achieved by throttlingthe TCP traffic so that the client rates is adapted without the need to installextra software or drivers on clients.
The following problem statement guides the direction and experimental de-cisions in the thesis. The sole purpose of thesis is to answer these researchquestions with high confidence.
Formulate a non-intrusive approach for doing load prioritization in iSCSI SAN ap-pliances utilizing multiple metrics and Linux traffic control for I/O throttling using alimited scope prototype.
1. Identify a suitable approach to use Linux Traffic Control as the throttlingmechanism for iSCSI initiators.
2. Identify metrics for various resources of a Linux based iSCSI appliancein order to obtain continuous knowledge of their utilization.
3. Verify the anticipated effects of workload interference.
4. Verify the anticipated effects of workload throttling.
5. Design mechanisms for using this data to make prioritization decisions,including dynamic prioritization, when contention occurs.
6. Formulate an approach for making automatic policy decisions based onworkload behavior.
7. Investigate any overhead of the TCP traffic shaping mechanism.
10

Chapter 2
Background material and previouswork
This chapter introduces the reader to the concept of resource sharing, Qualityof Services (QoS) relevant history of storage evolution and attempts of QoS instorage devices.
2.1 About resource sharing
In its most fundamental form, a resource can be thought of as collection ofassets of some particular type. What characterizes any resource is its utilityand limited availability. The limitation of it might be the total amount or therate at which it is available (amount/time unit). We usually call this limit thecapacity or capability of the resource.
Resources is closely tied to its consumers. If resource don’t have any con-sumers it could hardly be called a resource, since it is lacking the core charac-teristic of utility. Consumers utilize resources and more often than not there areseveral consumers of any resource. Very often the consumers themselves offersome kind of utility to other consumers, which in turn is utilized as a higherlevel resource. For example, the power-supply of a computer utilizes the alter-nating current (AC) resource available from the power distribution networkin order to supply the internal components (CPU/disks/memory, etc.) of thecomputer with direct current (DC) at suitable voltage levels. The CPU utilizesits DC power resources to provide computation resources to the operating sys-tem. The operating system provides available system calls to applications, andthe applications usually provide some kind of utility to their users.
11

CHAPTER 2. BACKGROUND MATERIAL AND PREVIOUS WORK
These levels can be thought of as abstraction levels because they each ab-stract their underlying resource from their own consumers. A chain reactionof change in resource consumption at all levels of abstraction happens whenthe top level changes its resource consumption due to utility-producing activ-ity. Any such consumers/resource chain has a weakest link: a place wheresaturation first occurs. This place is called the bottleneck for obvious reasons.If we mend a bottleneck by increasing its available resources (by upgrading oradding components for instance), another bottleneck might appear in anotherplace. The location of the bottleneck also varies with different workload typesand usage patterns of the consumer at the top level.
Now, what is the relation between resources and performance? In computerscience the terms capacity and performance are often used interchangeably,in particular when benchmarking and comparing different alternatives. Oftenthe concept of efficiency is forgotten in this picture. Efficiency is the quantityof resources consumed in the process of creating the next level of utility. If thecapacity of resources were infinite, it would be just a question of adding moreresources in any necessary level to keep application performance high. Unfor-tunately, resources are finite. This means that any resource can be fully utilizedin the sense that there is no more capacity left. This situation is called satura-tion. Finite capacity is a core characteristic of a resource. Therefore efficiencymatters for performance, at least in the long term. The focus of this thesis,however, is not the efficiency of resource consumers, but the management (orlack thereof) of available resources. Thus, it is just acknowledged that the sumof resource consumption from a consumer is influenced by its efficiency beforethe the objectives of this project is pursued.
As previously stated, resources normally have several consumers. Also, theconsumers of a resource may have differing ability (power) and need to con-sume the available capacity. A powerful consumer might be able to fully sat-urate a resource if it wants to. Processes like backups, report generation anddata-movement or copying are typical examples of consumers that will take allavailable resources for a period of time. If the consumers are powerful enough,they will typically saturate available resources at the expense of all consumers.However, the nature of such jobs makes themselves suffer less from saturationthan the other consumers they affect since the only thing they care about isgetting the job done as fast as possible and not the response time of singlerequests. Other consumers might require access, with certain response timerequirements to the same resource. In this case, the response time-sensitiveapplication will not meet its requirements due to the resource saturation. If itwas possible to say that a job should not be able to saturate more than a certainpercentage of all resources, the response time sensitive application would notsuffer, and the other job would merely take a bit longer time.
12

2.2. SAN HISTORY
2.2 SAN history
2.2.1 The early days
Historically, data storage has been directly attached to the computers utilizingit. As the demand for storage capacity, performance and availability increased,new solutions emerged. A major and commonly utilized technique is the ab-straction of resources from their providing hardware. The idea of abstractingstorage resources from the actual hardware that provides it is a desirable fea-ture that all consumers of storage want, and all suppliers of storage solutionsstrive to offer. This abstraction is the basis for achieving scalability, flexibilityand availability in computer data storage. It is often implemented by somekind of virtualization technology. The term virtualization here means a gen-eral principle in a broader sense than just mechanisms for abstracting serverresources.
Abstraction can be done on many different levels. For example it is possi-ble to abstract filesystems and their actual block level layout using a volumemanager like LVM (Logical Volume Manager) [6]. This way, even DAS (DirectAttached Storage) can be abstracted using software methods inside the hostoperating system. Another method involves virtualization inside a RAID (Re-dundant Array of Independent Disks) controller, where the attached physicaldisks are grouped into different redundancy groups and the device presentslogical drives of suitable sizes to the operating system. The operating systemsees the logical drives as single physical drives, while in reality even a smalllogical drive could be spread and mirrored over a number of physical disks.
It is increasingly common to place virtualization of physical storage media in-side a dedicated storage array that can be accessed simultaneously by severalhosts and is able to present tiered virtual disks from a larger pool of disk re-sources, allowing the actual storage to be closely adapted to the applicationcapacity and availability needs. Thus, the application obtains the needed stor-age properties at the lowest possible cost. Also, when needs change (typicallyincreases), abstraction makes migration of data between tiers possible. Accessto such virtualized storage arrays is done through some kind of networking in-frastructure. A collect term for such networks of storage arrays, the hosts uti-lizing them and the interconnecting infrastructure is Storage Area Networks,or just SANs.
Network Attached Storage (NAS) is a related term that is used for network-based storage technologies. NAS is also about accessing storage across thenetwork. Although the two technologies have moved closer to one another
13

CHAPTER 2. BACKGROUND MATERIAL AND PREVIOUS WORK
with the introduction of IP based SANs, there is a difference between them inthe level at which the storage devices present the storage chunks. SAN devicespresent storage at the block device level while NAS devices present storage atthe network filesystem level.
2.2.2 SAN technologies
At first, SAN technologies were almost exclusively used by large corporationsfor consolidating computing resources into large data centers. Such SANswere characterized by high price, reliability and performance. They were im-plemented as part of high availability clustering environments for core busi-ness applications with many simultaneous users. SANs made large scale hostclustering possible with performance equal or exceeding the fastest direct at-tached storage (DAS) solutions at the time.
Over time, the prices of SAN equipment have decreased. Over the same time,the demand for storage capacity, availability requirements and performancehas dramatically increased as most organizations run the majority of theirbusiness on some kind of computer based equipment today.
The most widely-used protocol for accessing storage is the SCSI protocol [7, 8].The broad adoption of parallel SCSI as a standard for connecting DAS in areliable way encouraged evolution of the well known SCSI command set tosupport other underlying interconnects [9], such as is the FC [10, 7] networkingtechnology and common TCP/IP networks.
During the last few decades, an increasing amount of businesses’ operationalinfrastructure has been migrated from manual, paper-based systems to IT in-frastructure based on databases and applications. This move has increased thedemand for application availability since unavailable operational applicationscan directly affect business revenue [1, 11].
As the demand for application availability increased, solutions offering failoverclustering became popular for obtaining server hardware redundancy. A re-quirement of all such clusters is the ability to access the applications data fromall nodes participating in the cluster. SANs fulfill this requirement, and is amajor reason why SANs became so popular.
Today, most organizations utilize SANs in some form. The ongoing trend ofdata center consolidation is tightly woven in with the evolving SAN and servervirtualization technologies; they reinforce and depend on each other. The flex-ibility of server virtualization seen today, would not be possible without theunderlying SAN technologies which enabled simultaneous storage access. The
14

2.3. ASPECTS OF STORAGE CONSOLIDATION
drive for consolidation enabled by virtualization further increases the need forhigher performing, flexible and reliable shared storage solutions.
Back in the late 1990s, when SANs became a reality for production environ-ments, FC networks were the only viable alternative to achieve the requiredperformance and availability. However, the recent development of higher per-forming common Ethernet equipment makes it possible for low cost commonly-available equipment to compete with FC solutions also with respect to perfor-mance [12, 13].
One of the most widely used technologies enabling storage attachment usingcommon ethernet equipment is iSCSI [4, 3, 14]. It utilizes TCP/IP protocol forbundling SCSI commands. The advantages utilizing iSCSI are: the equipmentcarries a low cost because of the volume and competition between vendors, itit easy to recruit staff with knowledge of standard TCP/IP networking tech-nologies, contrary to specialized FC technology. The only reason for not utiliz-ing iSCSI has been performance requirements, but this is now changing. WithTCP/IP being a long distance routable protocol, it is also possible to accessstorage across the Internet. Of course, such transport is different from the con-cept of local high performing SANs and brings major challenges with respectto security and performance, however, it adds some interesting opportunitiesto utilize a single common technology for a vast amount of different purposes.One example is the ability to do backup and recovery operations over largegeographic distances [13].
2.3 Aspects of storage consolidation
Large scale consolidation makes promises about lower total cost and the abilityto closely tie the cost of resource consumption to the income of the business.This concept is exploited by businesses offering outsourcing services. Theirbusiness model is to run their customers’ IT infrastructure as IT professionals,utilizing virtualization and flexible provisioning mechanisms to offer highlyadaptable services to end customers, and let customers focus on their corebusiness. The SAN solutions’ contribution to this adaptability makes thema core component of any outsourcing company.
What makes the flexibility and adaptability properties of consolidation pos-sible is the ability to share resources between their consumers. However, re-source sharing benefits come with additional challenges with respect to re-duced predictability of available capacity. The main problem with capacitystarvation is the increased service times for all consumers utilizing a given re-source. In a resource sharing environment with no control of who consumes
15

CHAPTER 2. BACKGROUND MATERIAL AND PREVIOUS WORK
what, the result is highly unpredictable performance for any given consumerof that resource.
Surprisingly few SAN Storage arrays includes mechanisms for prioritizingconsumers, or capping resource consumption, to prevent resource starvationas illustrated in Figure 1.1. Resource starvation increases the response timeof all consumers dramatically. In [5] Wilkes is looking back in retrospect on10 years of storage QoS research, reasoning that lack of real implementationscould be caused by failure to build the needed trust that QoS will behave asexpected.
To outsourcing companies and their customers, standardized agreements ofservice delivery are crucial. The most widely used standard for such servicedelivery is the ISO 20000 [15] standard. It formulates best practices for IT ser-vice delivery and support, and is used by most outsourcing companies andlarge organizations. A common method to specify deliverables between ser-vice providers and their customer, in ISO20000 and other standards, are servicelevel agreements (SLAs): a set of agreements that define what services will bedelivered, their quality and the consequences of non-compliances. To fulfillSLAs, the service provider needs predictable performance in the underlyinginfrastructure. They need to specify service level objectives (SLOs) for perfor-mance parameters like response time and throughput. To reduce the cost ofproviding services, the service provider also wants to maximize the utiliza-tion of their infrastructure (i.e. minimize over provisioning), hence increasingcompetition between workloads. Increased competition means increased riskthat workloads interfere with each other, and the need for QoS mechanismsincrease [16]. The requirements of utilization to keep cost down, and QoSguarantees to fulfill SLOs are contradictory in terms. Previous research showsthat both requirements are seldom completely fulfilled [17].
The scope of SLAs varies greatly, and outsourcing companies tend to offer eas-ily achievable and measurable deliverables in their contract templates. Theinherent risk of consumers affecting each others’ available resources of I/O ca-pacity is seldom part of any agreement, making the customer the bearer of therisk introduced with the incentive of cost savings by the outsourcing provider.This again leads to unexpected and unacceptable situations for outsourcingcustomers, and ultimately lost business for outsourcing providers in the longrun.
16

2.4. TRAFFIC SHAPING (TS) AND QUALITY OF SERVICE (QOS)
2.4 Traffic shaping (TS) and Quality of Service (QoS)
The QoS and traffic shaping terms is mainly known from the networking field,and they are closely related to each other. We can think of traffic shaping asthe method used to achieve QoS. In its fundamental form, QoS means the abil-ity to apply different priorities to to different entities like applications, usersor data flows [18]. Traffic shaping is the tool that is used to to ensure that allentities gets the promised resource allocations. The promised resource alloca-tions can be applied using traffic shaping policies by either limiting (capping)lower prioritized entities or raising the priority of other entities so they getprocessed first. By limiting lower prioritized entities, we indirectly make surethe prioritized entities have enough resources.
Before shaping can take place, decisions about prioritization must be made.It can be human value decision directly imposing differentiation, or it can besome kind of scheduling mechanism that automatically raises the priority oflow consuming entities. An example of this is the flow based weighted fairqueueing (WFQ) scheduler in Cisco IOS. WFQ and similar methods providean easy way of ensuring consistent response times for heavy and light networktraffic.
Traditionally, packet switched networks, such as the Internet in the early days,used a best effort service where no guarantees were made about packet deliv-ery at all, and the communication parties had to be able to cope with packetloss and out of order delivery. Applications like e-mail and web browsingwork well with the best effort model. They just wait until a complete messageis transferred, and it can be further processed as a complete piece. Real timecommunication like telephony and video conferencing are examples where thebest effort service delivery comes short. The increased utilization of the Inter-net to transport audio, video and other real-time-critical data introduced theneed for more predictable delivery of IP packets, leading to QoS and traffictechnologies [19].
Since QoS was introduced as a method of enabling transportation of suchservices, much research has gone into finding a best way of implementing it[20, 21, 19, 22, 23]. The research, and the amount of proposals, is so vast thatthe need for for a survey for getting a global overview became apparent. Gui-tart and coworkers offer a global perspective on previous research in this field[24].
17

CHAPTER 2. BACKGROUND MATERIAL AND PREVIOUS WORK
2.4.1 QoS core models
The two major major core models for QoS found in the networking layer in-clude differentiated services (DiffServ) [25] and integrated services (IS) [26].DiffServ is a coarse grained mechanism for traffic management where individ-ual packets are placed into different traffic classes. Routers along the travelpath of the packets differentiate packet handling based on traffic class mem-bership. Classification of packets normally happens on the ingress to a Diff-Serv domain: a collection of routers that implement commonly defined Diff-Serv policies. The classification is carried out by encoding the DSCP (Differ-entiated Services Code Point) into the lower six bits of the eight bit DS (Dif-ferentiated Services) field of the IP header, also known as the TOS byte. [27].The disadvantage of DiffServ is that individual flows cannot be differentiatedand that the classification processing adds delay to the packet travel time [28],the advantage is its simplicity and ability to work without other means thanpacket inspection along the network path.
Integrated services (IS) [26] is a more fine grained and predictable method thanDiffserv when implemented along the whole packet path. The purpose of ISis that applications can make guaranteed resource reservations in the setupphase of a conversation. IS has a dedicated protocol, the Resource ReSerVa-tion Protocol (RSVP), for signaling flow specifications across the network [29].However, the amount of resources needed for keeping track of reservationsin the routers along the path makes it scale poorly for large backbone routershandling many connections. This makes it less likely to find a complete IS sup-ported path when traversing the Internet than relying on the less predictable,but easier to implement DiffServ [28].
There are other models as well. All of these models has led to tools for con-trolling almost any aspect of IP traffic based on any almost any properties ofIP packets. This previous work will be useful in the following investigation onhow to ensure SLA compliance in iSCSI based SANs.
2.5 Linux and QoS
2.5.1 The network layer
There exist many networking products offering QoS functionality in some wayor the other. Often these are special purpose built components with a highprice tag. A compelling alternative to such products is a computer running
18

2.5. LINUX AND QOS
GNU/Linux. The Linux kernel has advanced features for implementing QoSat different levels.
Iproute2 [30] is the part of the kernel dealing with many aspects for control ofthe network stack. Setting up QoS policies is one of the many things iproute2is capable of. The user space utility for doing so is called tc, short for traf-fic control. tc has a range of different queueing disciplines (qdiscs) available.Some of them support classes, and can be used to build advanced decisiontrees about how to handle all kinds of traffic. The flexibility surpasses mostof the available proprietary hardware based network products, with a surpris-ingly low overhead cost [31, 32].
Linux traffic control can be used to prioritize and control traffic based on avast number of selection criteria. It is possible to limit bandwidth, introducedelay and make high priority traffic pass before others in the queue. The possi-bility of marking and/or classifying packets with Iptables prior to Iproute2
processing comprises a powerful combination and extends the capabilities ofLinux as a QoS machine further [31, 32].
tc can control NIC traffic in both directions, but controlling outgoing traffic ismost easily done. Since the kernel is in control of what happens prior to theenqueuing of outbound packets on a NIC, it can control most aspects of howit is done and at which rate.
Controlling incoming traffic is more involved, and sometimes not possible atall. When we talk about single packets, it is not possible to shape incomingtraffic. A packet arrived is a packet arrived; one cannot un-arrive it. However,it is possible to utilize the TCP protocol’s flow control and its ability to adjustthe senders’ speed by the senders’ observation of the receivers’ capabilities. Inthe TCP protocol the receiver controls the sender by announcing its capabilitiesto the sender [33]. Thus it is possible to make the sender throttle down to adesired rate by dropping packets when the rate is above some limit set on theclient. This can be accomplished using tc, and is called ingress policing [31].(See also section 4.2 which discusses the approach more in-depth)
Another option for controlling inbound traffic is to use a virtual device towhich incoming traffic is redirected enabling the whole toolbox of outboundqdiscs and classes to be utilized on the outbound side of the virtual device. Theintermediate queueing device (IMQ) [31, 34] is often used for this purpose, asis its successor the intermediate functional block device (IFB) [35].
One objection against such methods of shaping incoming traffic is that they donot prevent inappropriate behavior by misbehaving and malevolent senders.Another problematic case occurs when there are large amounts of data alreadyin flight and queued for delivery at an Internet Service Provider (ISP), and
19

CHAPTER 2. BACKGROUND MATERIAL AND PREVIOUS WORK
the senders’ sensing of the receivers capabilities might be delayed causing un-wanted behavior.
These techniques of shaping can nevertheless be interesting in the context ofan iSCSI SAN. An iSCSI SAN is a much more controlled and shielded environ-ment than the Internet. To have any chance of being competitive against FCSANs, a dedicated iSCSI network is required. In this situation, the sender isclose to the receiver and is able to immediately respond and adapt to changedsituations. In contrast, for traffic traveling long distances over the Internet, thebuffering and queueing along the packet path delays signaling between senderand receiver, introducing more uncertainty in the amount of packet loss andsmoothness of throttling.
The best option is of course no packet loss. Methods for doing this is investi-gated as a part of this project.
2.5.2 The block layer
There is ongoing discussion about implementing improved QoS in the blocklayer of the Linux kernel [36] and the best approach for doing fair schedulingthere.
The most important considerations are:
• Kernel invasiveness: the amount of kernel code touched by the change.
• Scope of control: should only user space processes be affected or kernelthreads as well ?
• Consistency with I/O scheduler prioritization: can QoS mechanism de-feat scheduler priority.
• Ability to influence the submitting process by letting it sleep for a while.
There are different patch-sets available for different approaches of QoS in theblock layer. These include dm-ioband, io-throttle and io-controller.
Dm-ioband is located in the virtual block driver layer; hence one must usedevice-mapper to utilize it. It needs the blkio-cgroup patch to form controlgroups (groups of processes to operate on) and implements a best effort wayof ensuring that each group get a certain percentage of the bandwidth.
20

2.6. SCSI
Io-throttle is able to enforce absolute bandwidth limitations onto controlgroups. The advantage of io-throttle is that it is located on the top of block-layer where requests are issued and is able to signal processes that it wants tothrottle down to sleep rather than letting it fill up the queues in memory.
Unfortunately, neither dm-ioband nor io-throttle are integrated with the lowerlevel I/O scheduler, a design that makes it possible to defeat the scheduler’spolicies.
The only current alternative that is consistent with scheduler policies and is ca-pable of applying bandwidth limitations at the same time is the io-controllerpatch-set. A consensus was reached that the right place to implement suchfunctionality is in the I/O scheduler level [37]. Version one of io-controllerwas implemented for the completely fair queueing (CFQ) scheduler and in-cluded in kernel version 2.6.33 released on February 24, 2010.
2.6 SCSI
SCSI, which originated from Selector Channel in IBM-360 computers, becamean ANSI standard in 1986. Originally it was both a hardware specification forparallel interfaces and a command set [38].
The main purpose of SCSI was to make devices connected to computers speakthe same language and thereby achieve interoperability between different ven-dor products . The common language and interface specifications enabledmodularity and reusability of the common communication layer, thereby re-ducing the development effort for writing new device drivers by not havingto design and implement a full stack every time [38].
There are two kinds of devices in SCSI: targets and initiators. Initiators startan I/O process and targets responds to them in much the same way as clientsand servers. In this sense, the initiator is analogous to the client and the targetis analogous to the server. Targets and initiators are called endpoints, and thecommunication taking place between them is called a SCSI transport [38, 39].
All communication starts by the initiator sending the target a command de-scriptor block (CDB). The target then processes it and sends back the appro-priate response. Each target can further be subdivided into logical unit num-bers (LUNs) [38, 39]. The mechanism of logical block addressing (LBA) makesit possible to have a uniform way of dividing devices into logical chunks ofdata storage, without knowing the cylinder/sector/heads layout of the de-
21

CHAPTER 2. BACKGROUND MATERIAL AND PREVIOUS WORK
vices . The target takes care of finding the correct location by translating LBAaddresses into cylinder/head/sector addresses internally [38].
2.7 iSCSI
iSCSI is a protocol for SCSI targets and initiators to utilize standard TCP net-work connections for transportation of SCSI CDBs. iSCSI packages CDBs intoprotocol data units (PDUs), before handing them to the TCP layer [14]. A PDUadds the necessary wrapping for a SCSI CDB to be handed over to TCP.
2.7.1 Performance of iSCSI
The main weakness of iSCSI based SAN solutions have been their weaker per-formance in comparison with the more established fibre channel (FC) tech-nology. However, past research demonstrates that these differences can bereduced, and in some cases iSCSI can even outperform FC SANs [12].
Intuitively, the most likely source of the performance degradation from uti-lizing TCP/IP is the added latency due to computation of checksums and re-assembly of packages. This is supported by experiments done by Aiken andcoworkers [12]. Their comparison of iSCSI and FC shows decreasing through-put differences as block size of operations increases. The performance differsmost, in favor of FC, on workloads where there are many small I/O operations.
Just like ordinary SCSI, iSCSI also utilizes targets and initiators as endpointsforming a SCSI transport over TCP. iSCSI initiator implementation varies a lotbut can divided into two main categories: software based and hardware based.The hardware based iSCSI initiator presents itself to the operating system di-rectly as a SCSI adapter, and its function is implemented in the adapter hard-ware. The software-based iSCSI initiator is implemented as a kernel driverbetween the block layer and the network layer, and presents itself as a vir-tual SCSI adapter. When it comes to performance many would argue thatfunctionality implemented in hardware is always performing better. Aikenand coworkers [12] demonstrates that for larger block sizes the software basediSCSI initiator significantly outperforms the hardware based iSCSI initiator,refuting the conventional wisdom that hardware always performs better thansoftware based implementations in the case of iSCSI initiators, a somewhatunexpected result.
22

2.7. ISCSI
Implementing iSCSI in software also has the benefit of being maintainable andflexible in conjunction with the operating system. It scales better with CPUclock speeds and increased number of processing units, and it has no need forspecialized hardware. When using a TCP offloading engine (TOE) and/or thefull iSCSI stack implemented in hardware, throughput can be excellent but atthe expense of smaller requests of smaller size [13].
The motivation for using TOE is to speed up Cyclic Redundancy Check (CRC)which improves performance. Performance can also be improved by lookingat where processing cost occurs and alleviating this in software. CRC genera-tion and data copying have been identified by Joglekar and coworkers [13] as aprimary bottleneck in iSCSI processing. They suggests replacing the industrystandard CRC [40] with a new slicing-by-8 algorithm. The new algorithm is 3times faster than the industry standard CRC algorithm, and yields significantperformance improvement [13].
Caches play an important role in enhancing performance of storage systems.Performance of iSCSI attached storage no exception to this rule. Both the localbuffer cache in the operating system and the storage device controller cachewill help by enabling delayed merged writes and read ahead for sequentialread access, but there exists additional approaches to caching. An interestingapproach to caching in an iSCSI environment is proposed by He and cowork-ers [41]. A SCSI-to-IP cache for storage area networks (STICS) is an intermedi-ate cache that caches data traveling in both directions. The cache device speaksSCSI on the host side and can be implemented in software or as separate plug-in card. On the other side, it speaks to another STICS instance over the IPnetwork, effectively converting SCSI protocol to be transported across the net-work, thereby bridging the protocol and speed disparities between SCSI andIP. Techniques found in log file structured file systems are used for cachingdata in both directions. The main benefit of using STICS over using ordinaryiSCSI lies in the caching mechanism that is smoothing out the traffic in simi-lar manner to what CPU cache does for CPU memory accesses. Comparisonsusing I/O benchmark tools like PostMark, IOzone and vxBench [42, 43, 44]shows a performance increase by a factor of 2 to 4 using STICS compared topure iSCSI [41]. Most of the write performance gain can be explained by thewrite requests being acknowledged as soon as they reach the local log NVRAMstorage instead of having to travel across the net. Read requests that are notsatisfied locally must be fetched from remote storage in any case, and any dif-ferences are likely to be caused by differing pre-fetch techniques for predictingwhat data is to be read next. If prediction fails, there is little to be gained fromread caching.
23

CHAPTER 2. BACKGROUND MATERIAL AND PREVIOUS WORK
2.7.2 QoS and iSCSI
In section 2.4, QoS is seen from from a global Internet perspective, where it istightly bound to the routers’ handling of packets. In the context of SANs, how-ever, routing is normally not involved at all. Most high performance IP basedSANs are dedicated, relatively small networks with no IP routing between ini-tiators and targets for minimum overhead and maximum throughput. Thisthesis the focuses on QoS within limited unrouted iSCSI SANs. Previous workrelated to QoS and storage, including iSCSI, is discussed in section 2.8 below.
2.7.3 iSCSI stability and enterprise readiness
At the core, iSCSI is an application level Internet protocol. Just like other popu-lar application level protocols, like SMTP and HTTP, the widespread adoptionof it, and many implementations, are what make it increasingly interesting.The maturation and adoption of new technologies often involves rapid de-velopment efforts in free software projects, the Linux kernel project being themost prominent example. Together with interest from IT industry, companieswhich implements their own products, and/or sponsor free software projectswith commercially exploitable aspect, exercises strong influence on the direc-tion of technology emergence. The amount of companies involved in free soft-ware iSCSI projects is increasing. This is a signaling the relevance of iSCSI tothe industry.
Customers are attracted by utilizing commodity network equipment for func-tionality that was previously only possible with expensive equipment requir-ing special knowledge, following the same reasoning for moving away fromexpensive mainframe and proprietary Unix solutions during the last decade.By building resilient software solutions that account for failures and limita-tions in the underlying infrastructure, cheaper commodity hardware can besubstituted for more costly special purpose hardware, driving costs down.
There are several competing free iSCSI software stacks available for free oper-ating systems like GNU/Linux [45, 46] and ones based on Berkeley SoftwareDistribution [47]. Among the examples are the iSCSI Enterprise Target (IET)[48], the Generic SCSI Target Subsystem (SCST) [49] and the Linux SCSI targetframework [50]. The latter two also implement SCSI targets for other underly-ing transports like FC, infiniband (IB) and FibreChannel over Ethernet (FCoE),and are mostly implemented in user space. At the moment, it is SCST whichis included in the official Linux kernel.
The Linux-iSCSI project is slightly different from these [51]. It is a free project
24

2.8. QOS IN SAN/NAS
but is entirely developed by the company Rising Tide Systems [52]. The com-pany’s vision is to outperform FC SANs completely by combining the highlyscalable and stable iSCSI target stack utilizing specialized 10GB ethernet adaptersfrom Neterion [53] with QoS features particularly directed towards virtual-ized/cloud computing environments.
When it comes to client side, the initiator, there are many options that rangefrom purpose made iSCSI cards with the whole initiator stack implemented inthe hardware to free, pure software implementations that layer on top of anyNIC. There used to be two competing free iSCSI initiator implementations,open-iSCSI [54] and Linux iSCSI [55], until they joined forces and became thenew Open-iSCSI project [56]. At the time of this writing it seems that Open-iSCSI is not a part of the official kernel, but several popular distributions in-clude its modules and user space tools, RedHat Enterprise Linux is an exampleof such.
All these loosely knit iSCSI free software projects plays a role in further de-velopment of new features and stable operation for enterprise usage. Manyideas and elements from these projects make their way to commercial or semi-commercial products, and experiences from utilizing them are fed back intofurther improvements of the software and products. Several commerciallysuccessful companies has emerged offering enterprise level iSCSI solutionswith competitive price and performance. It is interesting to see that large FCSAN vendors like HP and Dell are buying companies producing low cost en-terprise iSCSI storage arrays, further acknowledging and promoting their en-terprise readiness. Hewlett Packard Company announced their acquisition ofLeftHand Networks [57] , a company producing mid range scalable iSCSI stor-age appliances, nine months after Dell announced the acquisition of a similarcompany, EqualLogic [58]. Such moves by large storage vendors increases ex-pectation that iSCSI based storage is on the rise, thus making it an interestingand relevant research subject.
2.8 QoS in SAN/NAS
Research about QoS in SAN and NAS (Network attached Storage) devices isan ongoing effort, and there has been numerous approaches to design of suchsystems [59, 60, 61, 2, 62, 63, 64, 65, 66, 67, 68, 69, 70]. They all start out by ac-knowledging, in more or less detail, the same challenges about resource shar-ing, and the need for mechanisms for mending them, as mentioned in sections2.3 and 2.1, namely the interference between storage consumers and conse-quently the lack of predictability that comes with it. Popescu and Ghanbari
25

CHAPTER 2. BACKGROUND MATERIAL AND PREVIOUS WORK
has made a thorough comparison of performance isolation approaches in [17].This section will summarize the most relevant of these.
2.8.1 Stonehenge
Stonehenge is the name of a comprehensive project running over several years[59, 60, 62]. It comprises a high performance storage cluster able to makepromises about QoS for the presented storage chunks. It is motivated by op-portunities presented by previous research, such as Chuang and Sirbu [71]whose work serves as a starting point for community discussion about storageQoS, and Raniwala with coworkers [72, 73] who designed and implementeda prototype for a fault tolerant cluster whose main QoS feature is maintainingthe same level of QoS during failure as it is when no failure is present. Stone-henge takes one step further by introducing a mapping scheme that takes bothcapacity and QoS requirements as input. It further utilizes measurement basedvirtual disk admission control and includes a real time disk scheduling algo-rithm.
Three classes of service is supported: guaranteed service, predictive serviceand best effort service. For guaranteed service, all requests have to be servicedwithin their deadline which is specified during virtual disk setup. The predic-tive service class takes an additional parameter that specify the percentage ofrequests that must be within the deadline over time, and the best effort serviceutilizes remaining capacity to service the least important consumers.
Stonehenge utilizes storage objects as intermediate means to allocate neededdisk blocks with the needed QoS requirements for virtual disks. Given thatQoS for the virtual disk is done at create/registration time, the achievement ofService Agreement Objectives is obtained through allocation of the servicingstorage objects onto physical disk groups with sufficient amount of stripingand redundancy level. The QoS guarantee then is fulfilled by the virtual diskas result of its allocation. There can be several users with different prioritiessharing the same virtual disk, and each user can have several applications eachwith different QoS requirements within the bounds of the virtual disk. Appli-cation level granularity of QoS objectives requires application integration withthe Stonehenge API.
Given that all virtual disks have static service level objectives that need to bemet simultaneously (if necessary), it is reasonable to think that this is achievedby dedicating static pieces of underlying hardware resources in the cluster tothe virtual disks. The storage manager maintains global overview of availablecapacity and accepts or rejects virtual disk creation requests based on their
26

2.8. QOS IN SAN/NAS
wanted constraints and available resources in the cluster. The scheduling dy-namic lies in making sure that QoS objectives are met by tagging requests withdeadline time stamps and making sure there is always enough capacity forstorage servers to fulfill requests within the deadline.
The central scheduler, in the management server, is responsible for taggingI/O requests with deadline time stamps before forwarding them to appropri-ate storage servers. The real time storage servers are responsible for servicingI/O requests within the deadline time stamps, answering requests directly tostorage clients.
The suggested implementation of [60] implies a front end target driver (FETD)that presents an iSCSI port at the client side. The main objection against suchapproach is the need for client side modifications. Also, FETD lies in the datapath of disk request scheduling, managing all aspects of disk communication.The handling of I/O requests in FETD necessarily adds overhead compared toregular iSCSI connections.
It is proposed by [60] to more aggressively share spare disk bandwidth by ad-mitting more virtual disks utilizing more of the underlying capacity. It is likelythat this will have an effect of decreasing the likelihood of 100% compliance ofall QoS objectives by this overcommitting.
Hang and Peng [59] present a Stonehenge prototyp and their evaluation of ofit, as well as some design improvements. The main design improvement isthe introduction of a dual queue real time disk scheduler for maximizing uti-lization at the same time as complying with QoS guarantees for virtual disks.The difficulty of quantifying available disk bandwidth is pointed out, togetherwith the effect this has on service level objectives regarding latency of I/O re-quests. To address this, the Stonehenge implementation implies extensive runtime measurements as a basis for disk service time predictions. Also, the dualqueue real time scheduler is a means to fulfill request deadlines even if onequeue is filled with requests, hence increasing likelihood of latency objectivesalso being met. Tests shows that for three types of load traces replayed, QoSlatency objectives are met 97% of the time for the improved Stonehenge im-plementation, but only 75% with the initial Stonehenge design. The improveddesign adapts better to burstiness of workloads, fulfilling the latency objec-tives better than the initial design.
Further enhancements to Stonehenge has been made by Peng in [62], addingimproved fairness in QoS guarantees to storage users. An improved algorithmthat better caters for differences in I/O patterns is proposed to prevent inten-sive head-moving workloads jeopardizing workloads with high data locality.
27

CHAPTER 2. BACKGROUND MATERIAL AND PREVIOUS WORK
2.8.2 Cello
Shenoy and coworkers present Cello, an operating system disk schedulingframework, in [74]. Cello comprises a two level disk scheduling architecture:a class independent scheduler for coarse grained bandwidth allocation to ap-plication classes and an interleaving, class specific scheduler for fine grainedrequest control to align application requirements to the service provided. Thecore concept is proportional sharing of bandwidth combined with weightingof applications. Idle bandwidth is reassigned to the best effort class whennot needed by higher priority classes, thus, improving utilization of resources(work conservation).
The prototype used for measuring the scheduler overhead was integrated intoa filesystem driver on in SUN Solaris. Experiments demonstrates an overhead<2ms by interposing Cello.
Comparison between Cello and other algorithms were done using simulations.
The main outcome of the work, is a proposal for an algorithm utilized inapplication-QoS aware disk schedulers of subsequent operating system ver-sions. Simulations shows that Cello gives better response time for interactiverequests, when interfered with large sequential access, than algorithms thatdon’t take differing application requirements into consideration.
2.8.3 Facade
Facade [75] is a throttling mechanisms sitting between a storage device andits consumers. A primary goals is performance isolation between consumers:the performance perceived from one consumer must not suffer from activ-ity caused by other consumers. Performance isolation between workloads isachieved by throttling down consumers in order to shorten queue lengths ofthe physical drives servicing requests with tight latency service level objec-tives (SLOs). The implementation of SLOs is done through a combination ofreal-time scheduling and feedback-based control of the storage device queue.Control is based on simple assumptions of the storage device: reducing thelength of the device queue reduces the latency at the device and increasingthe device queue increases the throughput. Facade does not have admissioncontrol to make sure the total workloads presented actually can be serviced.Additional capacity planning tools is needed for this purpose.
The Facade prototype is implemented as a software layer between the work-load generator and the storage devices. It could also be implemented as a
28

2.8. QOS IN SAN/NAS
shim box, a thin controller that sits between the consumers and the storage de-vice. Experimental evaluation demonstrates negligible overhead by introduc-ing Facade. Also, it exhibits high probability of meeting SLOs, thus demon-strating its usefulness for performance isolation between consumers, sharingthe same underlying resources, by the use of throttling.
2.8.4 Triage
Triage [2] is a solution that ensures predictable performance for storage access.It uses a control-theoretic approach, utilizing a feedback loop, and sees thestorage devices as a black box with no prior knowledge about it. At the corelies the general assumption that increased throughput results in increased la-tency, similar to assumptions described in Facade [75]. The throttling of loadsis the means to achieve performance goals also in Triage. It utilizes an adaptivecontroller approach which infers the model used for decisions solely based onstorage device behavior as seen from the outside.
The workload throttling is done on the client side. For the experiments, aLustre clustered filesystem is used. Each client node is running a modifiedIOZone [42] with built in throttling capabilities, taking signals about throttlingfrom the controller that makes throttling decisions.
Experiments show that adaption speed of Triage is close to models specifi-cally designed for certain operation points, i.e. they contain knowledge aboutthe device and workloads. Triage adapts, with the same speed, without thisknowledge.
2.8.5 Argon
Argon [64] is a QoS aware storage server, part of the Ursa Minor [76] basedstorage distributed cluster system. It focuses on efficiency by avoiding cacheinterference between applications, by aggressive prefetching and cache par-titioning, to obtain amortization. This is mainly done to avoid unnecessaryhead movement in competing workloads where one of them is sequential andwill benefit from not moving the head away. Fair sharing is obtained such thatno user get less than T
n (where T=total resources and n=number of users) butallows users to borrow capacity when there is no contention.
29

CHAPTER 2. BACKGROUND MATERIAL AND PREVIOUS WORK
2.8.6 Chameleon
Chameleon [63] utilizes a combination of performance models, incrementalfeedback and constrained optimization. It mends broken SLAs by throttlingdown competing clients (with lower or no SLA) to free up enough resourcesto rectify the broken ones. Chameleon reacts to workload changes and mini-mizes the number of QoS violations. A balance between maximum utilizationand no QoS violation is achieved by continuos monitoring and throttling /un-throttling of loads. Dynamic internal performance models are built usingperformance samples. A reasoning engine computes throttling values withstatistical confidence based on internally generated black box models. Prede-fined policies serve as a fallback applying coarse grained arbitration when thegenerated models falls short. That is when confidence of statistical calculationsare below a certain threshold.
2.8.7 SARC/AVATAR
Zhang and coworkers use an interposed scheduler that services all incomingrequests, in a similar manner as [61, 2, 75]. It takes a black box approach to thestorage device and uses monitoring to obtain knowledge about device state.The higher level of the architecture implements a rate controller called SARC.SARC controls workloads to meet rate requirements and isolation of work-loads. AVATAR is the lower level of the architecture, and controls the flowof requests between two queues. It carries out work conservation by utilizingspare bandwidth to aggressively serve throughput requests. AVATAR moni-tors ”spareness” and balances high priority latency bound requests with ser-vicing the higher level SARC for maximizing bandwidth consumption. Simu-lation based verification of operation, that assumes Poisson distributed requestarrivals, is used for verification, an approach that idealizes the actual situationartificially [17].
2.8.8 AQUA
Aqua is the QoS component of the CEPH petabyte-scale high performancestorage cluster [68, 69]. The workers of the CEPH cluster are the object basedstorage devices (OSDs). AQuA makes OSDs QoS-aware and able to makebandwidth reservations based on client requests. Requests are grouped intoQoS classes of different priorities by tagging them on the client side. The OSDsprioritize their scheduling based on the requests’ QoS-tags, similar to DiffServin networks [25].
30

2.8. QOS IN SAN/NAS
The QoS requirements of CEPH are different from other storage clusters in theway that relatively small amounts of data can be spread across many OSDs.Hence, its QoS knowledge needs to be global and equally enforced on allOSDs.
This work points out the inherent challenges of proportional sharing mech-anisms for bandwidth allocation: disk bandwidth is not constant. Rather, itvaries with its load and access pattern because access times vary not only withdata location on disk but also the current location of the disk head, a compo-nent of access time that is workload dependent and highly unpredictable.
Because of the highly unpredictable data locations for incoming requests, AQuAhas chosen to implement a distributed adaptive throttling approach for solv-ing the QoS task at hand. The fundamental augmentation AQuA provides toCEPH is the throttling ability of OSDs. Each OSDs simply makes individualthrottling decisions to support the higher level QoS goals.
A Hierarchical Token Bucket filter (HTB) is used to slice up the disks’ totalbandwidth, thus creating bandwidth classes that are able to borrow band-width from each other while still enforcing capping in case of contention. Thecalculation of total bandwidth is based on profiling disks according to a certainworkload type. The workload type from which total disk bandwidth should beprofiled is centrally configurable. This semi-dynamic adaption of total band-width makes the underlying assumptions of the HTB creation more accurateby directly influencing the total token rate of each HTB.
Small scale experiments illustrates intended behavior of the new throttling-augmented OSD disk scheduler. Performance isolation is achieved betweencompeting workloads on a single-OSD level. The experiments only considerQoS of throughput.
VMware research on storage QoS
Gulati and Ahmad [65] propose using I/O request latency on the consumerside as a measure of disk array contention. Their idea is inspired by the lossprobability calculation of packets in TCP. The latency measure is used to de-cide the throttling of local outgoing I/O requests, thereby influencing the sat-uration level at the storage array. If all consumers abide to the same throttlingscheme, this approach ultimately would prevent array saturation. However,there is nothing that prevents a machine that doesn’t participate from monop-olizing all resources. In fact, it would make it easier for a non-abiding host tomonopolize resources because any abusive behavior would drive up the arraylatency. While the abuser doesn’t care, the throttlers will detect high latency
31

CHAPTER 2. BACKGROUND MATERIAL AND PREVIOUS WORK
caused by the abuser and throttle themselves down, thereby freeing even moreresources for consumption by the abuser.
The method is targeted towards host computers running VMware virtual ma-chines, and fairness is calculated by aggregating virtual machine weights foreach host computer. The outgoing queue length is determined by a moving av-erage of request latencies, calculated using the Exponentially Weighted Mov-ing Average (EWMA), an upper limit and a threshold triggering change. Thethreshold is the limit describing the intersection between normal array opera-tion and array overload.
Initial investigations carried out in the research show it is possible to distin-guish between the latency due to an array’s normal workload and the higherlatencies caused by array overload.
In [67], Gulati and coworkers present a QoS framework for VMware ESX server:proportional allocation of resources for distributed storage access (PARDA).PARDA is a software system that implements the basic ideas from [65] withsome enhancements. Testing the findings more thoroughly, [65] found thatvirtual disks sharing the same underlying disk-group exhibited differing per-formance running the same load. The differing locally measured latencies leadto throttling that made the environment diverge, creating a persistent perfor-mance gap between otherwise equal hosts. Thus, a measure of average latencyfrom all hosts was used as input signal. This was done by aggregating valuesthrough interconnects between the hosts utilizing the same storage system.Experiments show that the system is able to keep close to the set latency value,describing the saturation point, hence avoiding array saturation altogether.PARDA seems to make significant overall QoS improvement for a dedicatedVMware environment sharing a storage array.
Furthermore Gulati and coworkers present a storage resource scheduler [66]for deciding what virtual disks are a suitable storage location for differentloads. It does this by profiling workloads and available virtual disks to findsuitable storage performance for workloads. Locations of workloads are movedby the means of VMware’s VMotion storage product. Workloads are char-acterized at the hypervisor level by having lightweight probes reporting onindividual request properties, such as seek distance, I/O sizes, read-write ra-tio and average number of outstanding I/O operations. A rather simplisticapproach was taken for modeling virtual disks performance: a performancefactor based on the constant linear relation between rate and latency. In spe-cial cases where a single disk-group has only one virtual disk utilizing it, thisis likely an adequate representation of the performance. However, once shar-ing of the underlying resource with other virtual disks begins, this assumptioncan’t be made. Basing storage relocation on such a model could lead to wrong
32

2.8. QOS IN SAN/NAS
decisions.
2.8.9 Four-tag SFQ
Jin and coworkers [61] propose an interposed request scheduler in the networkpath between clients and server. It uses a modified start time first Queueing(SFQ), called Four-tag Start-time Fair Queuing or FSFQ, and its main focus ison improving the scheduling algorithm by using FSFQ over SFQ and otherprevious algorithms.
The experimental evaluation utilizes a modified NFS proxy that maintains perclient queues that implements SFQ and FSFQ for comparing their fairness. Thetest is synthetic, utilizing on/off constant rate and Poisson arrival rates.
The weakness of the study seems to be that it assumes constant rate-capacity ofthe storage server as the base measure for dividing resources between clients(constant cost prediction). Other studies demonstrate that this assumption isincorrect [17, 69, 70]. Remaining capacity, and hence distance from saturation,is just as much influenced by the nature of the workload (read/write mix andrandomness, for example) as the rate. Basing scheduling decisions merely onrate could result in wrong decisions.
2.8.10 Modeling iSCSI delay bounds
Ramaswamy [39] proposes an analytical model to estimate maximum delaybounds for iSCSI requests. While the ideas underlying the model are excellent,unfortunately the assumptions made in the model design are insufficient forreal life usage, including the following:
• Schedulers have negligible servicing time.
• Schedulers can be characterized as systems in a steady state where thenumber of departed requests equals the number of the requests arrivinginto the system: requests are rearranged and merged unless the NOOPscheduler is used.
• Steady state operation of the network.
• Resources are able to accommodate aggregate traffic classes.
The model presented is not verified by experiments, and, with the insufficientassumptions made, the model is likely to misrepresent real situations.
33

CHAPTER 2. BACKGROUND MATERIAL AND PREVIOUS WORK
2.8.11 Adaptive SFQ
Jin and Buyya [70] recently presented a modified SFQ algorithm that adaptsthe fairness calculations to the performance of the underlying resources byutilizing a performance monitor. The objective of the performance monitor isto detect unfairness between flows. This is done by comparing each flow’s ratewith its SLO, which is a reasonable foundation for deciding throttling. Also, itattempts to relate storage object location to performance level, given that datalocations have different I/O capacity. For example, blocks located on the outeredge of the disk plates have faster access than inner locations, due to differ-ent rotational speeds. An assumption that previous measurements of blocklocation performance can predict future performance of the same block loca-tion could be flawed however. The case or a virtual disk sharing underlyingresources that constantly has its data blocks redistributed to optimize overallperformance would be an example where such an assumption is too simple.Hence, it remains to be seen whether the unfairness calculations based on de-vice profiling will work as expected in such environments.
2.8.12 Modeling RAIDs
As pointed out by previous work [17, 63], the complexity of RAID systemsmakes it difficult to model their behavior when loaded with different kinds ofworkload patterns that interact with the underlying resources and influenceeach other. The most successful approaches seem to be the ones that take ablack box approach and don’t try to make detailed assumptions about behav-ior.
However, Lebrecht and coworkers present a response time distribution modelfor zoned RAID [77]. The model implies modeling of single disk drive’s prop-erties and combines these into queueing networks that represents their RAIDsetup. High accuracy is demonstrated in experimental verifications carried outas part of the work.
This work is a first step in the process of creating a model that takes into con-sideration caching mechanisms at different levels and workload arrival pat-terns other than the Markovian arrivals used in their experiments. It remainsto be seen, though, whether it will be possible to extend the model to predictindividual virtual disk behavior when a number of consumers are sharing theunderlying RAID resource.
34

2.9. SUMMARY
2.9 Summary
Previous research includes a vast amount of approaches to the problem of stor-age QoS, and the amount of work is descriptive of this problem. Previous workvaries from full blown storage clusters with QoS as a part of the storage provi-sioning [60] to simple feedback based control loop approaches. All approachesinvolve some kind of interposed throttling or scheduling functions. Some in-volve feedback from storage devices as a means to make scheduling/throttlingdecisions, and some try to use a predefined model of behavior instead. Manyof the experiments done, using close to real world workloads, indicate thatrelying on a predefined model behavior is not sufficient. Chameleon uses aninteresting approach that utilizes dynamically generated models of behaviorfrom measurement observations if able, and uses ordinary feedback with sta-tistical confidence as a fallback for making throttling decisions. Gulati andAhmad [65] present an interesting and simple approach to resource saturationdetection by measuring request response-times.
Other important aspects of the research are work conservation vs. isolationof workloads. These are contradictory in terms, and previous research showsthat it is hard to combine the two. In their comparison of different perfor-mance isolation approaches [17], Popescu and Ghanbari conclude that non-work-conserving approaches are better choices for isolation of workloads shar-ing the same physical storage.
All of these approaches utilizes some kind of workload generation. The prob-lem is that they use different workloads and different tools for generating it.Many also lack a detailed specification of how the workload is generated andreasoning about why the particular workload is chosen. This impression issupported by Traeger and coworkers [78], a thorough survey of papers uti-lizing I/O benchmarks, commenting on their approaches and suggesting im-provements.
The ability to specify service level objectives (response time and bandwidth),among other data management features, has been the subject of a decade longresearch at HP Labs Storage Systems department. Looking back in retrospect,Wilkes [5] points out the challenges of incorporating the research results intoreal production implementations. The challenge is to persuade users to trustthe systems to do the right thing. This is a human challenge, one perhapsrooted in general healthy skepticism to new technology and bad experiencesfrom earlier implementations that turned out to not fully take all real life pa-rameters into account. Wilkes points out the need to remember that systemsare built to serve people, and the success of technical accomplishments is dic-tated by how comfortable people ultimately are with them [5].
35

CHAPTER 2. BACKGROUND MATERIAL AND PREVIOUS WORK
Despite all the research done in the field, specifications regarding QoS func-tionality are seldom found in the specification sheets of storage devices.
iSCSI based storage devices are the major competitor to FC based storage de-vices at the moment. With its lower cost, easier configuration and maintenanceand increasingly competitive performance, iSCSI seems to be the enabler oflarge scale adoption of IP based SAN devices. The introduction of IP as atransportation layer introduces an additional, well known and well trustedtoolbox for enforcing policy and fairness amongst storage consumers. Toolsfor traffic shaping in the TCP/IP layer have been around for many years. Thecombination of well known and trustworthy throttling mechanisms and an ex-tended knowledge about storage system internals makes an appealing prag-matic and non-intrusive approach to the problem of QoS in storage systems.Instead of introducing the need to build trust towards interposed schedulingalgorithms, bound to add uncertainty and overhead, this project suggests uti-lization of previously known and trusted tools to obtain workload prioritiza-tion in case of resource saturation. Lumb and coworkers point out the lack of atraffic shaper in storage systems [75] (presumably FC based storage systems).However, when utilizing TCP/IP as transport mechanisms, traffic shapers areavailable.
36

Chapter 3
Methodology
This chapter will introduce the reader to the methods, tools and equipmentused in this project.
3.1 System model
Figure 3.1 shows the conceptual overview of the lab setup. Five machines areinvolved in the execution of the experiment: four IBM blade servers actingas iSCSI initiators and one Dell 6650 acting as iSCSI target. The iSCSI targetserver has 10 external SCSI disks connected via a parallel SCSI connection.Physically all five servers are connected via their eth1 interface to the bladecenter switch described in Table 3.3. The Iperf [79] utility was used to verifysimultaneous gigabit link speeds in all directions with TCP traffic betweenall servers before experiment’s start. The logical volumes serve as back endstorage for iSCSI target devices. The iSCSI target software makes the mappingbetween LUNs presented on TCP port 3260 and the logical volumes that storesthe data. To simulate resource sharing, the logical volumes are striped acrossthe ten physical disks with a stripe size of 64 KB. Hence I/O traffic (of sufficientsize ) to any of the logical volumes will effectively be spread across all tendisks, equally sharing the collective back end I/O capacity of physical disks.
37

CHAPTER 3. METHODOLOGY
b
HP SC1010 x 36GB 10k
vg_perc
lv_b2
lv_b3
lv_b4
lv_b5
b2
b4
b5
b3
iSCSI target(iet)
TCP Connections
TCP/IP Layer
Striped logical volumes. 64KB
stripe size across 10 disks
/dev/iscsi_0
iqn.iscsilab:perc_b2
iqn.iscsilab:perc_b3
iqn.iscsilab:perc_b4
iqn.iscsilab:perc_b5
Block Layer Block Layer
bm
b1Argus
Figure 3.1: Concept sketch of the lab setup
3.2 Tools and equipment
3.2.1 Generating workload
Flexible I/O tool (fio) [80] is a versatile tool for generating a wide varietyof workload mixes. The tool is written by Jens Axboe [81], who is the currentmaintainer of the Linux block layer, as a facility to aid the development work ofit. Fio was the tool used to produce the workload that broke through the 1 Mil-lon IOPS barrier in an experiment done by HP and Fusion IO [82, 83, 84]. Sim-ple configuration files are used for setting up any number of worker threadsfor generating simultaneous workload of a wide variety. A generated work-load is reproducible using the same configuration files. While the main task offio is to produce workloads, it can also produce latency and bandwidth tracesfor every single I/O request it issues. This is useful to the get an overview ofI/O subsystem behavior without having to add any external monitoring. Ina real system, I/O requests would be caused by applications running on theiSCSI initiator machines. In the experiment I/O requests will be syntheticallygenerated using fio.
38

3.2. TOOLS AND EQUIPMENT
Start
Enter at(1)- job at time T
T==NOW No
----- b2 ------blktrace &collectl &fio $jobkill blktraceblkparsebtt -I btt -qrm traces
Yes
----- b5 ------blktrace &collectlfio $jobkill blktraceblkparsebtt -I btt -qrm traces
----- b3 ------blktrace &collectl &fio $jobkill blktraceblkparsebtt -I btt -qrm traces
----- b4 ------blktrace &collectl &fio $jobkill blktraceblkparsebtt -I btt -qrm traces
-- bm ---collectl &collectd\restart
All jobs done No
----- bm ------kill dstat tc-graph.plcollectd_extrsend mail
Completion
Yes
-- Personal laptop--rsync all dataextract relevant vectorscreate plots and reports
-- b1 ---argus
----- b1 ------kill argus
Figure 3.2: Experiment automated workflow. The workflow and collected datais the same for all experiments, except those in chapter 5.4.
39

CHAPTER 3. METHODOLOGY
3.2.2 Measuring system behavior
To characterize system behavior during experiments, a number of differenttools are utilized. The most important task is monitoring metrics about theI/O requests traveling through the system. Some important measuring pointsinclude:
• The iSCSI block device on the initiator machines.
• The I/O subsystem on the iSCSI target machine.
• The network subsystem on the iSCSI target, including the different QoSmechanisms.
Different performance tools collect various aspects of system behavior duringexperiment execution. The data collection is started, stopped, post-processedand collected using shell and perl scripts. The concept of this orchestration isdepicted in Figure 3.2.
The following data is collected on the iSCSI initiator nodes:
• Total elapsed runtime of the load, using the /usr/bin/time command.
• Iostat-like time stamped data, using btt -I option.
• Trace of the queue-to-completions (q2c) latencies, using btt -q option.
• Btreplay files, created using btrecord.
• A one second interval data file, containing various performance data,produced by collectl.
The following data is collected on the iSCSI target node:
• A copy of the script collection during the run.
• A graph representing the tc setup during the run.
• An extract of queueing discipline and class statistics, produced by col-lectd.
• A one second interval data file, containing various performance data,produced by collectl.
40

3.2. TOOLS AND EQUIPMENT
The intention of the data collection is to automate a large amount of sensorsproducing as much data as possible without affecting the produced results inany noticeable way. Earlier experience with lab experiments has shown thatunexpected results can call for additional data to explain them. If the extradata is already collected in advance there is no need to redo the experiment.
Preliminary tests were used to get an impression of resource consumption andeffect of different measurement approaches. An example of measurementsthat noticeably affected results was the attempt to run blktrace on all tenSCSI disks serving the striped logical volumes. These measurements madethroughput drop by more than 10% . The tools and techniques described herewere found to be as much data as could be gathered on general basis withoutaffecting the system’s performance.
To exactly measure how I/O requests are being serviced, as seen from the iSCSIinitiator side, blktrace [85] is used to record all there is to know about requestspassed to the iSCSI initiator device. The blktrace framework consists of threemajor parts: the kernel event logging interfaces, the blktrace user space utilityto access and store the in-kernel events and utilities for parsing and viewingrecorded data. The framework also includes utilities to create playback filesthat can be used to re-play an exact sequence of the traced I/O requests at alater point in time: btrecord and btreplay
Blktrace produces per CPU trace files, so the first part of post processing is torun blkparse on the separate traces gathering them into one file. This file canbe used for extracting various pieces of information using the btt tool. In theexperiments, the resource consumption impact by monitoring is minimized byextracting data after the workload has finished running.
Although I/O requests can be examined in great detail from blktrace files,two types of information are most relevant to this experiment: rates and laten-cies of I/O requests (read and write). Btt produces output similar to iostat
using the -I option. All measurements of iSCSI initiator devices on the bladeservers are extracted from this file.
In the experiments all workloads are started simultaneously on all blade serversusing at(1). Ntpd is running as a client on all machines to ensure correct time.The scripts that start the workloads first start blktrace on the iSCSI device,tracing the behavior of all I/O requests passed to it during workload appli-cation. When the workload has finished, the tracing process is killed, andautomatic post processing of the trace files is carried out before the traces aredeleted for space conservation.
Collectl [86] is a very useful tool with its capability to log performance datainto compressed text files. The compressed files can be replayed later to ex-
41

CHAPTER 3. METHODOLOGY
tract different metrics as needed. Most of the disk and network data fromthe target server comes from files collected by collectl. Collectl supports themeasurement strategy of this project very well: low overhead collection withvast amount of information available for extraction at later points in time. Thisstrategy was beneficial when double-checking packet loss, using collectl’s TCPstatistics, since Argus turned lost some capture data (See section 3.2.9). Col-lectl was run in record mode on all machines during experiments from theexperiment in section 5.4) and onwards.
The tool collectd [87] is used for gathering statistics about data flowing throughthe tc queueing disciplines (qdiscs). Collectd is a lightweight plug-in baseddata collection tool. The netlink plugin of collectd was the only pre-madecollection facility found for collecting qdisc statistics (except from tc -s ). Allplugins other than the netlink plugin were disabled, the sample interval wasdecreased to 1 second, and only the CSV output plugin was enabled. To cap-ture only the relevant data for the experiment period, all collectd files weredeleted at the start of each experiment run, and collectd was restarted so thatoutput CSV files reflect the actual qdisc and class setup active in that particu-lar experiment. As a part of the experiment post processing on the iSCSI targetserver, a script collects these files and places them in the results folder. Thisscript is found in appendix C.8.
The job_template.sh script starts monitoring, runs the I/O load and doespost processing on all blade servers. The script is designed to be reused withdifferent I/O loads just by creating symbolic links named jobname.sh whichpoint to the script. The job name matches the fio job definition file in thejobdefs subdirectory. The last part of the fio job definition (after the un-derscore) defines which host the job definition will be run on. This way thejob_template.sh script can be reused with different I/O loads just by creatingsymbolic links and creating a set of fio jobs that match the script name and thehost it is supposed to run on, ensuring that all monitoring and post processingis done consistently.
The job scripts are run by at(1), and scheduled by the scheduler.pl script.Together with b1-mon.sh,bm-mon postproc.sh, these scripts comprise the work-flow of all experiments which is conceptually depicted in Figure 3.2. Thescripts are found in listings C.15, C.6, C.14, C.13 and C.12 respectively.
The Plot [88] tool is used for creating all plots except for Figure 4.3 which iscreated using Mathematica, and Figures 5.5 and 5.6 which are created using R.
42

3.2. TOOLS AND EQUIPMENT
Item Specifcationhostnames b2,b3,b4 and b5Machinemodel
IBM HS20 Blade server , Type: 8843, Model E8G
CPU amountand type
2 X Intel(R) Xeon(TM) CPU 2.80GHz Cache:2MB, Fam-ily:15, Model:4, Stepping:3, 32bit
Memory 2 X 512MBOperatingsystem
CentOS release 5.4 with package-sets @core @base@development-tools
Network in-terface Card
Broadcom NetXtreme BCM5704S GBit, driver:tg3 (kernel-provided), driver version: 3.96-1, tcp-segment-offlod-(tso)=off, flow-control=(rx=off,tx=off)
Kernel ver-sion
2.6.18-164.11.1.el5
iSCSI initator CentOS provided package iscsi-initiator-utils-6.2.0.871-0.10.el5 (iscsid version 2.0-871)
iSCSI logincommand
iscsiadm –mode node –targetnameiqn.iscsilab:vgname ‘hostname‘ bm:3260 –login
Table 3.1: IBM blade server specifications
3.2.3 Hardware specifications
Tables 3.1, 3.2 and 3.3 list the specifications of the Blade servers, the iSCSItarget server and the interconnecting switch, respectively.
3.2.4 Monitoring the network connection
Access to all the network traffic is essential in order to detect the effect of trafficshaping on the network link. The BNT blade center switch, used to intercon-nect the experiment servers, has an option to mirror port traffic. Port INT1 waschosen as the port for monitoring because the server connected to it (host b1)is running any workload in the experiments leaving host b1 to concentrate onthe capturing process. It was decided to mirror ingress traffic of ports INT2-INT5 (hosts b1-b5) and EXT1 (host bm) onto port INT1 (host b1). The setup ofport mirroring was done according to the Alteon OS application guide [89].
Next, a tool for capturing network statistics on the mirror port was needed.The first tool considered was tcpdump [90], and tcptrace [91] for plotting vari-ous aspects of the TCP communication. However, it turned out that tcpdumpis unable to keep up with the traffic rate between the five machines during
43

CHAPTER 3. METHODOLOGY
Item Specifcationhostname bmMachinemodel
Dell 6650
CPU amountand type
4 X Intel(R) Xeon(TM) MP CPU 2.50GHz Cache:1MB, Fam-ily:15, Model:2, Stepping:5, 32bit
Memory 8 X 1024MB physical, 4GB UtilizedNetwork in-terface card
Broadcom NetXtreme BCM5700 Gigabit, driver:tg3,driver-version:3.92.1, tcp-segment-offlod-(tso):off, flow-control:(rx=off,tx=off)
Operatingsystem
Debian Lenny minimal install
SCSI HBAexternaldisks
Dell PERC 4/DC Ultra 320 SCSI external port (Used up tosection 5.4)
SCSI HBAexternaldisks
Adaptec AHA-2940U/UW/D / AIC-7881U (Used in sec-tion 5.4) and onwards
Externaldiskshelf
HP SC10 Shelf with 10x36GB 10k rpm disks
OS version Debian Lenny with kernel 2.26.2 (Used up to section 5.4)OS version Cent OS 5.4 with kernel 2.6.18-164.15.1.el5 (Used in section
5.4 and onwards)iSCSI target Debian provided package iscsi-target (ietd version 0.4.16)
(Used up to section 5.4)iSCSI target IET version iscsitarget-1.4.19 from [48] (Used in section 5.4
and onwards)ipset version ipset v4.2, protocol version 4, kernel module protocol ver-
sion 4iptables ver-sion
1.4.6
Table 3.2: Dell iSCSI server specifications
44

3.2. TOOLS AND EQUIPMENT
Item SpecifcationSwitchmodel
BNT Layer 2/3 Copper Gigabit Ethernet Switch Module forIBM BladeCenter
Firmwareversions
Boot kernel: v1.5.9, software image version:1.5.9
Flow control Turned off on all portsPort mirror-ing
Ports INT2,3,4,5 and EXT1 mirrored to Port INT1
Table 3.3: IBM Bladecenter switch specifications
iSCSI workload. Tcpdump kept losing packets, hence, it did not capture a fullpicture of what was going on. Tcptrace is very useful for generating detailedplots and statistics from reading tcpdump files. Plot files are generated in aformat called xpl and can be plotted with the special purpose xplot program.However, the plot files generated from tcptrace were rather large, and whentrying use gnuplot to plot files generated with xpl2gpl [92] (which took about5 minutes), all 4GBs of memory were consumed on the laptop and no plotswere produced.
Obviously, a more lightweight solution was needed. Argus [93] seemed to fitthe purpose. Argus is connection oriented and is geared towards security au-dit trails but it also captures various performance related metrics which areadequate for the purpose of this project. Argus is run as part of the exper-iment orchestration shown in Figure 3.2, on host b1. Host b1 does not takepart in the experiment, it only monitors the mirrored port of the switch duringexperiment execution.
During experiments, it was discovered that Argus too was loosing packetshence not representing a full picture of the network traffic. See section 3.2.9 forfurther discussion about this.
3.2.5 Getting persistent device names
Most Linux distributions now use udev [94] to dynamically populate the /dev
directory with the correct contents. Unfortunately the default device namingscheme of SCSI disks still is the old sda,sdb,sdc and so on, which contain nopersistent binding to target and LUN numbers.
Since blade server b3 has an additional internal disk, compared with the oth-ers, the device naming of iSCSI disks was not consistent across all four blade
45

CHAPTER 3. METHODOLOGY
servers. To alleviate this, a small udev trick was enabled. The following cus-tom udev rule creates iSCSI device files that is persistent with LUN numbers(/dev/iscsi #).� �BUS==" scsi", SYSFS{vendor }==" IET", SYSFS{model }=="
VIRTUAL -DISK", KERNEL =="sd*", PROGRAM ="/lib/udev/
getlun.sh $id", NAME=" iscsi_%c%n"� �The program /lib/udev/getlun.sh returns the LUN number, and its output issubstituted for %c in the name of the device.
The getlun.sh script:� �#!/bin/bash
echo $1 | awk -F":" ’{print $NF}’� �Since all LUNs have LUN number 0, and no partitions is used, the device torun I/O-load towards is named /dev/iscs 0 on all blade servers.
3.2.6 Setting up bandwidth limitation
Linux Traffic Control has many built-in modules for traffic shaping. The Hier-archical Token Bucket (HTB) queueing discipline (qdisc) can be used to set upa complex hierarchy of bandwidth classes. This project utilizes the HTB qdiscas a means to create the bandwidth classes for iSCSI read throttling seen infigure 5.2. Figure 3.3 shows a graph depicting the class hierarchy of which theiSCSI interface is divided into. In order to keep a small size of the figure, onlythe two first classes is shown. The next class indicates the pattern of furtherclasses.
In order to enforce any bandwidth limitations, packets need to be placed in thedesired bandwidth class. Packet classifications is done with filters. In tc thefw filter module is used to match packets with marks (a hexdecimal number)placed by Iptables. Thus, the class hierarchy can be set up once, and Iptables
used to dynamically select bandwidth by its powerful matching capabilities.
Filters are attached to the root qdisc, in order to inspect all outgoing traffic. Theblue lines in figure 3.3 depicts the filter with their associated fw mark-matchalong the lines.
The script for setting up the bandwidth hierarchy, depicted in figure 3.3, islocated in listing A.4.
46

3.2. TOOLS AND EQUIPMENT
1:htbroot
r2q 10default 1
direct_packets_stat 4665509ver 3.17
1:1htb
rate 1000Mbitceil 1000Mbit
burst 130875b/8mpu 0b
overhead 0bcburst 130875b/8
mpu 0boverhead 0b
level 7
1:3htb
prio 0quantum 200000rate 900000Kbitceil 900000Kbitburst 453262b/8
mpu 0boverhead 0b
cburst 453262b/8mpu 0b
overhead 0blevel 0
1:2htb
prio 0quantum 200000rate 950000Kbitceil 950000Kbitburst 478325b/8
mpu 0boverhead 0b
cburst 478325b/8mpu 0b
overhead 0blevel 0
1:nhtb
prio 0quantum 62500rate -=50Mbitceil -=50Mbit
burst xxxmpu 0b
overhead 0bcburst xxx
mpu 0boverhead 0b
level 0
(2)(1) (n-1)
Figure 3.3: Graph depicting the egress queues used for bandwidth outgoinglimitations
47

CHAPTER 3. METHODOLOGY
3.2.7 Delay limitation
The concept of the delay class hierarchy is similar to the bandwidth class hier-archy; a set of classes that covers the needed throttling scope in a sufficientlygranular manner. The netem module of tc is used to enforce artificial packetdelay. The HTB qdisc is used to create the hierarchy, but rather than HTBbandwidth limiters as leaf qdiscs, netem qdiscs with predefined delay is usedinstead. Figure 3.2.7 shows what this class hierarchy looks like. Filters areattached to the root qdisc in order to inspect all traffic. Upon mark match,packets are sent to the corresponding delay class.
The script that sets up the packet delay hierarchy depicted by figure 3.2.7 islocated in listing A.5.
3.2.8 Using Iptables and Ipset to classify traffic
Iptables has more powerful and dynamic matching capabilities than tc. Thisproject utilizes a set of static tc delay classes with filters only checking packetsfor marks placed by Iptables (see section 3.2.7). This way, the packet classifi-cation task is carried out by Iptables by utilizing tc classes for applying thedelay. The scripts wanting to utilize packet throttling need to know the validrange of marks with corresponding tc delay filters. The scripts then have ameans to throttle iSCSI initiators within the pre-configured delay classes in tc
by altering Iptables rules. The script used to demonstrate throttling effecton throughput uses this altering of Iptables rules to throttle individual iSCSIinitiator IP addresses (Figures 5.2,5.3, 5.4 and Listing A.1).
While throttling of individual consumers is sufficient for demonstrating theeffect, more matching capabilities are needed for the next step: a dynamicallymaintained list of consumers that are deemed throttleable. Ideally Iptables
should be able to match against this list directly, and apply marks if a con-sumer is found in the list. Iptables does not have built-in capabilities formatching against lists, however, the Ipset patch-set enables this feature [95].The PID controller program (Listing A.2) utilizes Ipset in order to have onlyone Iptables rule to change when packet marks needs altering. The Iptables
rule always match against the set of throttleable consumers while this set alsocan be dynamically updated.
48

3.2. TOOLS AND EQUIPMENT
12:netem
parent 1:2limit 1000
delay 99us
12:1netem
13:netem
parent 1:3limit 1000
delay 598us
13:1netem
1n:netem
parent 1:nlimit 1000
delay +=0.5ms
14:1netem
1:htbroot
r2q 10default 1
direct_packets_stat 1747544ver 3.17
1:2htb
prio 0quantum 200000
rate 8000Mbitceil 8000Mbit
burst 0b/8mpu 0b
overhead 0bcburst 0b/8
mpu 0boverhead 0b
level 0
1:3htb
prio 0quantum 200000
rate 8000Mbitceil 8000Mbit
burst 0b/8mpu 0b
overhead 0bcburst 0b/8
mpu 0boverhead 0b
level 0
1:nhtb
prio 0quantum 200000
rate 8000Mbitceil 8000Mbit
burst 0b/8mpu 0b
overhead 0bcburst 0b/8
mpu 0boverhead 0b
level 0
(1) (2)
(n-1)
Figure 3.4: Graph depicting the egress queues used for packet delay in bothdirections
49

CHAPTER 3. METHODOLOGY
3.2.9 Argus usage
Argus captures a lot of useful information that can be queried afterwards, thus,it also support the collection strategy of the project. However, it turned outArgus suffered from packet loss. This was discovered when comparison ofsender and receiver rates did not match the rate of the network in between.In Figures 3.5 and 3.6 the blktrace plots of the initiator devices on the bladeservers (in figure 5.3 and 5.4 ) is split and overlaid with network traffic loggedby Argus and the respective traffic from logical volumes on the iSCSI targetserver.
There is the expected close correlation between the read rates on the iSCSIinitiator device (blktrace) and the logical volume it is tied to on the iSCSI target.What is not expected, is that Argus-logged traffic is correlating only partly. Thelikely cause of this is that Argus, or the mirror port in the switch, has failed tocapture some packets. If the traffic did not travel safely across the networkthere would be differences between sender and receiver rates; however, this isnot be the case.
The consequence of this packet loss is less confidence in the correctness ofthe test for packet loss in listing E.8. Therefore, additional steps were takento verify the absence of packet loss during experiments. Collectl was runduring experiments and both target and receiver TCP data from collectl wasqueried for packet loss. No packet loss was seen using this approach either(See listing E.3).
The Argus plots for Figure 3.5 is generated by the commands in listing E.4, andthe logical volumes is created by the commands in listing E.5. The plots forwrites were generated in the same way, but then the plot.pl script is pickingout the argus sload rather than dload column, and write kB/s to the logicalvolume rather than read kB/s.
50
3.2. TOOLS AND EQUIPMENT
0 50 100 150 200 250 300Time (s)
0
5000
10000
15000
20000
Read
(kB/
s)
b2 blktraceb2 network/dev/vg_perc/lv_b2
(a) Blade server b2
0 50 100 150 200 250 300Time (s)
0
5000
10000
15000
20000
Read
(kB/
s)
b3 blktraceb3 network/dev/vg_perc/lv_b3
(b) Blade server b3
0 50 100 150 200 250 300Time (s)
0
5000
10000
15000
20000
Read
(kB/
s)
b4 blktraceb4 network/dev/vg_perc/lv_b4
(c) Blade server b4
0 50 100 150 200 250 300Time (s)
0
5000
10000
15000
20000
Read
(kB/
s)
b5 blktraceb5 network/dev/vg_perc/lv_b5
(d) Blade server b5
Figure 3.5: Comparison between initiator, network and target-logical-volumerates when reading
51

CHAPTER 3. METHODOLOGY
0 50 100 150 200 250 300Time (s)
0
2000
4000
6000
8000
10000
12000
14000
16000
18000
Writ
e (k
B/s)
b2 blktraceb2 network/dev/vg_perc/lv_b2
(a) Blade server b2
0 50 100 150 200 250 300Time (s)
0
2000
4000
6000
8000
10000
12000
14000
16000
18000
Writ
e (k
B/s)
b3 blktraceb3 network/dev/vg_perc/lv_b3
(b) Blade server b3
0 50 100 150 200 250 300Time (s)
0
2000
4000
6000
8000
10000
12000
14000
16000
18000
Writ
e (k
B/s)
b4 blktraceb4 network/dev/vg_perc/lv_b4
(c) Blade server b4
0 50 100 150 200 250 300Time (s)
0
2000
4000
6000
8000
10000
12000
14000
16000
18000
Writ
e (k
B/s)
b5 blktraceb5 network/dev/vg_perc/lv_b5
(d) Blade server b5
Figure 3.6: Comparison between initiator, network and target-logical-volumerates when writing
52

3.3. CHALLENGES
3.3 Challenges
3.3.1 Network instability
In the beginning, some instability in the network connections was experiencedduring heavy I/O loading over the iSCSI protocol. The Ethernet link betweeniSCSI initiator servers and the Dell iSCSI target server would freeze completelyon random occasions. Bringing the iSCSI NIC of the iSCSI target machinedown and up again would temporarily solve the problem. After upgradingswitch firmware, turning off TCP segmentation offload and flow control onthe switch ports and all host NICs, the problem was not seen again.
3.3.2 LVM instability
Some instability was experienced in the LVM layer. When I/O continued fora time, suddenly the LVM layer introduced delays causing the throughput tological volumes to drop dramatically, from 30-40 MB/s aggregated throughputtowards logical volumes to a rate of 512kB/s . The problem was confirmed tobe in the LVM layer by testing throughput with I/O directly to logical vol-umes locally on the iSCSI target server when the problem exhibited itself andcomparing it with direct I/O to the same underlying disks serving the logicalvolumes. Access to the underlying disks showed expected throughput. Accessto the same disks through LVM was stuck until next reboot.
Attempts to debug the problem was done using SystemTap [96] and blktrace
[85]. However none of the prerequisite kernel hooks were present in the 2.6.26kernel of Debian Lenny. Attempts were made using slabtop to look at anoma-lies in the kernel buffer structures when problem occurred. However, the focusof the project is not debugging the block/LVM layer of the Linux kernel, bututilizing a working LVM to illustrate some points about resource sharing. Forthis reason it was decided to find a workaround rather than proceeding withtime consuming troubleshooting. Installing CentOS 5.4 as operating system onthe iSCSI target server, seemed to be the solution for a while, but the problemappeared again after some time. Since CentOS 5.4 was better equipped withtracing tools, an attempt to log data and get help from linux-lvm mailing listwas made, but no responses were received.
The Dell server has a built in aic7xxx-based SCSI adapter in addition to the(supposedly) more powerful PERC RAID controller. To leave no option untested,the disks were hooked up to this controller, and this time there was no anoma-lies. Using this setup the performance anomaly was not seen again. The initial
53
CHAPTER 3. METHODOLOGY
experiments seen in figures 5.1, 5.3 5.2 and 5.4 was already done using De-bian Lenny and had short enough duration to not exhibit this problem. Allother experiments are done using CentOS 5 with the same disks attached tothe aic7xx controller.
A common performance problem with such set-ups is related to block/re-quest alignment. LVM metadata consuming space at the starting blocks ofthe physical drives could be causing such misalignment. However, one wouldexpect such problem to be persistent. This one was just intermittent and un-predictable. This behavior remains unexplained, but somehow the problemmust lie in the instability of the combination: PERC RAID controller accessedby LVM with striped logical volumes.
54

Chapter 4
System design
This chapter describes the design considerations aiming for the final goal, aworking prioritization framework containing throttling, measurements anddecision making. The chapter has emerged during the experimentation phaseand it is influenced by the results exhibited. Thus, this chapter is tightly con-nected with the progress of chapter 5.
4.1 Choosing a throttling method
The main idea of this project is the utilization of common tools in novel waysin order to obtain more predictable service availability of storage devices. Theobjective is to demonstrate ability to mend adverse effects of interference be-tween loads using a throttling mechanism for reducing resource contention,thereby improving service availability for important consumers. iSCSI utilizesTCP for transportation and Linux Traffic Control (tc) has advanced featuresfor network traffic shaping, hence, the decision to use tc for the purpose ofthrottling was easy.
The amount of consumers that need to be throttled could become large. Also,workloads may rapidly change. Thus, a method to rapidly adapt throttlingschemes is a necessary requirement. Traditionally, TCP traffic shaping withLinux Traffic Control is used with static rules targeted only at the network it-self. This project should utilize feedback from resources outside of the networklayer in order to adapt rules in the networking layer.
In order to have sufficient control of the consumers’ resource utilization, bothread and write requests must be throttled. As stated in 2.5.1, controlling in-
55

CHAPTER 4. SYSTEM DESIGN
bound traffic is a challenge. Inbound traffic translates to iSCSI write activ-ity. Different approaches for dealing with the shaping of inbound traffic areknown. The easiest method to achieve this is ingress policing. The conceptof ingress policing is to drop packets from the sender when a certain band-width threshold is crossed. The congestion control mechanisms of TCP willthen adjust the sender rate to a level that can be maintained without packetdrops (Further described in 4.2). There are clearly disadvantages to this ap-proach. The most obvious one is packet loss, which leads to inefficient net-work link utilization due to packet retransmits. Another problem is the time ittakes for the sender to adapt when the receiver decides to change the allowedbandwidth. During the adaptation process packet loss will occur due to thenature of the policing. This might be sufficient for a small number of sendersand seldom changes in the receivers’ accepted bandwidth. However, the abil-ity to change bandwidth limitations is needed for rapid adaption to work-load changes. When the number of consumers and bandwidth limits changesrapidly, this method does not scale, but adapts slowly and inefficiently. An-other problem with ingress policing in Linux is the order of packet process-ing in the kernel; ingress policing happens before packets enter any Iptables
chains. Hence, it is impossible to select packets to be policed using Iptables,and failure to do so makes it impossible to utilize the dynamic packet matchingcapabilities of Iptables described later on.
A feature called Intermediate Queueing Device (IMQ) can be added to theLinux kernel by applying a patch. The IMQ patch enables a virtual networkinterface which incoming traffic can be redirected to. Since IMQ is Iptables-aware, packets entering the IMQ device can be marked for later matching bytc’s filters before packets are passed back to the incoming interface. An al-ternative to the IMQ device is present in the official kernel: the IntermediateFunctional Block (IFB). However, IFB is not Iptables-aware because it is locatedbefore Iptables chains for incoming traffic. Hence, incoming packets markedwith Iptables have already passed the IFB device, and filters attached to it areobviously unable to detect them. This behavior disables usage of tc’s fw filter.
Both IFB and IMQ suffers from the following: the input buffer of the incominginterface is finite, and iSCSI traffic is typically heavy data traffic that quickly fillup even large buffers, thus, tail dropping of requests will occur. This comprisesa similar situation as with ingress policing.
This project suggests a novel method of throttling designed to address the lim-itations just described. The method implies introducing a variable additionaldelay to packets sent back to initiators. Write requests are throttled by delay-ing outbound ACK packets, and read requests are throttled by delaying alloutbound packets except ACK packets (data packets). The principle of delay-ing ACK packets is illustrated in Figure 4.1. The actual delay is obtained using
56

4.1. CHOOSING A THROTTLING METHOD
the netem module of Linux Traffic Control, and packets get different delaysbased on Iptables marks.
As previously argued, the need for a dynamic selection method for throttlingpackets is needed. Iptables provides this dynamic behavior with its manyavailable criteria for matching packets. Combined with the mark target, whichcan be detected by the use of tc’s fw filters, it is possible to set up a predefinedset of delays that covers the needed throttling range with sufficient granularity.
The entities that consume resources in this context are the iSCSI initiators. Theentity that provides the resources of interest to the initiators is the iSCSI tar-get. Both initiators and targets have IP addresses. IP addresses can be used forthrottling selections. The IP address of the iSCSI initiator will be chosen as theentity to which throttling will apply. Differing priorities for consumers willtranslate into different throttling schemes of those consumers’ IP addresses.The underlying idea is to apply throttling to less important requests in orderfor important requests to have enough resources available to meet their re-quirements.
Packet delay throttling makes it possible to influence rates in both directionson a per initiator basis. In production environments the amount of initiatorsto keep track of quickly become overwhelming if throttling is based on indi-vidual consumer basis. Moreover, it is likely that the same throttling decisionsshould be applied to large groups of initiator IP addresses. Applying the samerules, over and over again, on lists of IP addresses is inefficient. To avoid thisinefficiency the Ipset tool is needed [95]. It is a patch to the Linux kernelthat enables creation of sets, and a companion patch to Iptables that makesIptables able to match against those sets. This is a fast and efficient methodof matching large groups of IP addresses in a single Iptables rule: the set ofthrottleable initiator IP addresses.
57

CHAPTER 4. SYSTEM DESIGN
SYNSYN+ACK
Initiator Target
ACK
Write
Timeline without delay
ACK
WriteACK
WriteACK
WriteACK
Time
SYNSYN+ACK
Initiator Target
ACK
Write
ACK
Write
ACK
Write
ACK
Write
ACK
Timeline with delay
Throttling delay
Figure 4.1: Principle of throttling by delaying packets
4.2 Discussion of the delay method
4.2.1 Risks
TCP implementations contain intelligent algorithms to avoid congestion andto be efficient in transportation of packets. One of these mechanisms is thedynamically applied retransmission timeout (RTO) which is calculated froma smoothed roundtrip time (SRTT) and its variation (RTTVAR) bounded bysome fixed limits.
The RFCs defining how TCP should be implemented specify how RTO mustbe calculated and implemented [97]. They also specify how congestion con-trol should be implemented [98]. Artificially manipulating TCP packets at onepoint in the network can affect network traffic in unexpected ways. It is reason-able to speculate that there is a limit to what extent traffic can be manipulatedbefore congestion control and retransmit algorithms activate, causing unex-pected and unwanted behavior. This is something that needs to be qualified inorder to find reasonable boundaries for traffic manipulation.
It is clearly stated in [97] that RTO should not be less than one second. How-ever, the RFC takes into consideration that future developments of networkequipment might justify a lower value. Existing implementations of TCP, in-cluding the Linux Kernel, have a lower RTO minimum value than the RFC
58

4.2. DISCUSSION OF THE DELAY METHOD
recommendation. The default value of TCP_RTO_MIN (in ms) in the 2.6 Linuxkernel is related to clock granularity and is defined as 200ms as shown in list-ing E.9. It is also possible to extract the active value from Linux using themethod shown in listing E.6.
The results shown in Figure 5.4 have a maximum introduced delay of 10 ms,which is << 200ms. Hence with typical transmission rates in an IP SAN envi-ronment (or faster), introducing delays of a few milliseconds has an immediaterate reducing effect without being close to affecting the TCP_RTO_MIN values.
When the sender decides how much data it can send before receiving an ACKpacket from the receiver, there are two pieces of information to consider: thereceive window which equals available buffer space at the receiving end, andthe congestion window, which is influenced by events along the network path.The receive buffer is always announced by the receiver in the ACK packets sentback to the sender. The congestion window is initially low, then increased andbalanced to a point where the network can cope with the traffic. The sendermust always use the lowest of the two values for determining how much datato be sent before receiving an ACK packet and more data can be sent.
Congestion control is about sizing of the congestion window (cwnd). It is com-prised by three phases: slow start, congestion avoidance and congestion de-tection. During connection establishment, the maximum segment size (MSS)is negotiated. In the slow start phase, the sender starts with a congestion win-dow beginning at one MSS and it is increased by one MSS until the slow-startthreshold (sstresh) is reached. Then the congestion avoidance phase starts. Itcontinues increasing the rate, but with an additive rate-increase, rather thanan exponential increase like the slow start phase. The increase in cwnd con-tinues, and if the rwnd is big enough, the data rate will continue to increaseuntil a point where there are signs of congestion in the path. Signs of conges-tion are detected by the sender when the need to retransmit occurs as a resultof RTO expiry, or if the receiver sends three duplicate ACK packets signalingretransmit of minor chunks of data [33].
The retransmit caused by RTO expiry causes a stronger reaction than a retrans-mit resulting from three duplicate ACK packets. When retransmits due to RTOexpiry occur, the sstresh is set to one half of the active value when the retrans-mit occurs, cwnd is set to the size of one segment, and the slow-start phase isinitiated again.
If ingress policing was used as a means to throttle iSCSI write activity, this isthe mechanism that makes the rate adapt to the bandwidth limit. The drop-ping of packets when bandwidth limitations are enforced causes RTO expirieson the sender side, which causes the cwnd to shrink over time in order to find
59

CHAPTER 4. SYSTEM DESIGN
a balance where no packet drops occur. This process is harsh and introducesinefficiency by knowingly having to retransmit some packets to enforce band-width limitations.
As stated in chapter 3.2.4, all traffic between initiators and the target is mir-rored to the port of host b1. On b1, Argus[93] captures key information aboutnetwork activity during the execution of each experiment. From the captureddata, the amount of packet loss and retransmits during experiments can beinspected. The command racluster is used to read captured binary data andaggregate metrics. Listing E.7 and E.8 shows that there is no lost or retransmit-ted packets during artificial delays of up to 10ms. Since Argus was not able tocapture a complete data set for the experiment (see section 3.2.9), packet losswere inspected by extracting TCP data collected by collectl (see listing E.3).This method also reported no packet loss during experiments.
4.2.2 Advantages
In addition to the obvious advantage of being able to throttle iSCSI write ac-tivity without introducing packet loss, there is another aspect: this type ofthrottling does not need to find out what the existing throughput is in order tohave an effect. The writing process in figure 5.6 has a slower rate than the read-ing process (figure 5.5) when no throttling is in effect. If the underlying sharedresource is the bottleneck, it means that resources is saturated, and that all con-sumers of that resource suffer high response times. This is one example thatcapacity differs depending of workload type. When throttling is started withonly 0.1 ms additional delay, the effect is immediate on the data flow causingsaturation. It is instantly reduced. Hence, relieving the underlying resource ofpressure regardless of what the rates were before throttling started. If band-width shaping was used, there would be an extra step to identify what ratethe consumer should be throttled to in order to achieve the same result: first ameasurement of the existing rate, then a calculation of a suitable bandwidth tomake the rate decrease sufficiently.
4.3 Bottleneck location
In this lab setup, the disks clearly are the main bottleneck. This is best indi-cated by identification of where I/O requests spend most of the time duringtheir flight. A comparison was made between the wait-time of the local iSCSIblock device and the wait time of the logical volume servicing it (on the tar-get server). Figure 4.2 shows these wait times of the random read job while
60

4.4. THROTTLING DECISION
0 100 200 300 400 5000
10
20
30
40AVWAIT /dev/iscsi_0 on b2AVWAIT for the servicing device on target.
Figure 4.2: Comparison of average wait time of the iSCSI block device andthe logical volume servicing it on the target server, when running 6 interferingwrite threads from 3 other machines
writing with six interfering threads against the shared volume-group. The dif-ference between them is negligible, confirming the assumption that most ofthe total iSCSI wait time is spent waiting for disk service at the target server.In other cases the bottleneck might be in the network link or other places. It isreasonable to hypothesize that packet delay throttling will have a similar slow-ing effect even if the bottleneck is elsewhere, but in order to detect contentionthe response time probe must be moved outside of the bottleneck.
4.4 Throttling decision
4.4.1 Input signal
As pointed out by previous research, remaining capacity is not constant, it isdependent on both rate, direction and pattern of the workloads. Hence, anexact measure of remaining capacity is hard to maintain. However, it is pos-sible to indirectly relate how close the resource is to saturation by measuringindividual consumer response times without any knowledge about the cause.
61

CHAPTER 4. SYSTEM DESIGN
Experiments in chapter 5 seek to verify the validity of this assumption, anddetermine to what extent this metric can be used for throttling decisions.
Previous research has successfully utilized virtual disk response time as satu-ration level measure [65, 67, 66]. This project will use a similar approach. In or-der to use the disk response time for throttling decisions, it must be smoothedto represent the general trend for the variable. Different algorithms exist forthis purpose. Gulati and coworkers obtained good results using EWMA forsmoothing [65]; thus, EWMA shall be a considered method. The other methodconsidered is the moving median algorithm. Both EWMA and moving me-dian require little computational power to maintain, and the description oftheir characteristics makes promises about spike resistance and close-to-trendrepresentation. The standard moving averages will not be considered becauseof their susceptibility for spikes in the data, short term spikes known to existin the average wait time. It is not desirable to trigger large throttling impactscaused by transient spikes in the average wait time. Throttling should onlyoccur as a result of persistent problems.
In order to compare the two algorithms, plots of them were stacked on topof the actual measured wait time that they average. The actual wait time, ofwhich the smoothing algorithms were tested, was taken from the experimentwhere twelve other threads were interfering with a small random read job, andtimed packet-delay-throttling (using 4.6 and 9.6 ms delay) was carried out (seeFigure 5.8). Mathematica was used to plot the time series of the logged waittime, an EWMA and a moving median of that data. Using dynamic variablesfor the α parameter of EWMA and the window-size parameter of moving me-dian a visual best fit was found for both (see listing C.16 for the Mathematicacode). For EWMA, an α = 0.15 gave the best fit, and for the moving median, awindow-size of 6 gave the best fit. Figure 4.3 shows the three plots with thesevalues set.
It was decided to use the EWMA as input signal for throttling decision becauseit seems to follow the trend more closely and looks smoother than the movingmedian. Also, EWMA is widely adopted as a successful method in the processcontrol field for smoothing sensor input signals. In the process control field,this filter is commonly named a time constant low pass filter. The formulaused for applying the filter is shown in the following equation, where L(t) isthe smoothed/filtered value in time t and l is the measured value in time t.
L(t) = l(t) × α + L(t−1) × (1− α)
The smoothing parameter effects the level of smoothing, or the bandwidth, ofthe low pass filter. It is defined by α ∈ [0, 1]. A small α gives more smooth-
62

4.4. THROTTLING DECISION
100 200 300 400 500TimeHsL
20
40
60
80
100
Wait HmsL
Figure 4.3: Finding a reasonable moving average. Blue is actual samples fromsmall job. The green plot shows the moving median with wsize=6. The redplot shows the EWMA with α = 0.15.
ing (lower filter bandwidth), and a large α gives less smoothing (higher filterbandwidth). A low value of α gives smooth output, but it also gives a highphase shift (delayed response) compared to the input trend. The best valueof α is when there is an optimal balance between smoothness and phase shift.The visual inspection done in Mathematica suggests that α = 0.15 representssuch fair balance for the data used in the test (see Figure 4.3).
4.4.2 Output signal
During examination of the project’s experimental results, the nature of re-source saturation, load interference and throttling effects became clearer, anunderstanding that led the attention to cybernetics and control engineering. Acommonly used concept in this field is the PID controller [99, 100]. The prob-lem investigated in this project is similar to a process control problem solvedby PID controllers. Experiments documented in section 5.6 demonstrate theinstant rate reducing throttling effect freeing capacity, which again influencesread response time. Section 5.4 describes a stepwise close-to-linear relation-ship similar to what a PID controller needs in order to work. Figure 4.4 showsthe concept of a PID controller. PID controllers can be implemented in soft-ware using a numerical approximation method. This project uses a numericalimplementation of the PID controller with virtual disk wait-time as input sig-nal and packet delay as output signal.
63

CHAPTER 4. SYSTEM DESIGN
The purpose of the PID regulator is to control throttling such that the outputvalue stays as close as possible to a set value when the set value changes andthe environment tries to change the output value. Changing the environmentwould be analogous to changing load interference in the case of storage QoS.The set value of maximum response time for storage resources is likely to beconstant. However there is nothing that prevents implementation of dynami-cally adjustable thresholds. The main purpose of the controller in this projectis to keep response time of important requests from violating this set thresh-old in spite of rapidly changing amounts of interference from less importantrequests.
The packet delay throttle is implemented as a range of integers representinga stepwise proportional throttling mechanism. Let this proportional throttlebe named pThrottle from now on. Each integer step represents an increasedpacket delay, thus, a decreased rate. Figures 5.5 and 5.6 suggest that stepsof 0.5ms is a suitable granularity. At 0.5ms granularity, the amount of stepsis determined from maximum allowed artificial packet delay: i.e. zero ratereduction plus 21 increasing steps of rate reduction with a maximum delay of20ms giving pThrottle ∈ [0, 21]
u(t) = Kpe(t)︸ ︷︷ ︸Proportional
+Kp
Ti
t∫0
e(τ)dτ
︸ ︷︷ ︸Integral
+ KpTde′(t)︸ ︷︷ ︸Derivative
(4.1)
Equation 4.1 represents the continuous function for outputting throttling amountas a function of set-point error: the difference between the set value (threshold)and real value. Hence, the PID controller is called an error driven controller.The proportional part (P part) is the first part of the function and is parame-terized by the proportional gain Kp. The second part is the integral part. Itis proportional to both the error and the duration of it and is parameterizedby the integral time Ti. The purpose of the integrating part is to eliminate theresidual steady state error that occurs with a proportional-only controller. Thethird part of the equation is the differential part. It is parameterized by thederivative gain tuning parameter Td. The purpose of the derivative part is toslow down the rate of change of the controller output, thereby reducing themagnitude of overshoot created by the integral part.
When computer based controllers replaced older analogue PID controllers, thePID function was discretized using Euler’s backward method and became thebasic discrete function shown in equation 4.2. The function is used as the basisfor most discrete PID controllers in the industry [99, 100]. This paper imple-ments a variation of equation 4.2 that takes the distance above preset response
64

4.4. THROTTLING DECISION
time threshold as input error signal and computes an output throttling value.The modified algorithm is named a single sided PID controller because it onlythrottles when the error is positive: when the real value is higher than the setthreshold.
The average wait time during the interval is captured by reading the accumu-lated wait time divided by the number of requests during the interval fromthe /proc/diskstats file, the same method as the iostat command uses forcalculating the AVWAIT value:
AVWAIT =Accumulated− number − o f −ms− spent− doing− I/O
Number − o f − reads + Number − o f − writes
Filtering of the AVWAIT value is applied using the EWMA algorithm withα = 0.25. In order to achieve rapid response of the PID controller, the valueof α had to be increased compared to the smoother signal demonstrated usingMathematica and α = 0.15 (Figure 4.3). See also the discussion about PIDtuning in section 4.4.3.
The PID control algorithm is a direct implementation of equation 4.2 belowwith two exceptions: the negative throttling value is capped to the maximumthrottling step corresponding to the integer value of the packet delay classwith the highest delay, and the positive throttling value capped to zero. Thisis done to prevent integral windup: the integral part accumulating too highvalues that takes a long time to wind down again, and to disable throttlingcompletely when the error is negative: real value is below the threshold. Theoutput value of the PID controller is rounded up to the next integer value, andthat integer becomes the Iptables mark to apply to all outgoing ACK packetsmatching destination addresses of the iSCSI initiator IP addresses in the set ofthrottleable consumers. The program is what causes results the exhibited inFigures 5.9 and 5.10 and is listed in listing A.2.
uk = uk−1 + Kp(1 +TTi
) + Kpek−1 +KpTd
T(ek − 2ek−1 + ek−2) (4.2)
4.4.3 Tuning of the PID controller
The PID controller must be tuned for optimal control of the process. In con-trol engineering, the best operation of the controller is when the actual valuealways is stable and equal to the set point no matter how fast the set pointchanges or environmental forces influence the actual value. This ideal behav-ior is never achievable in real world applications of the PID controller: there
65

CHAPTER 4. SYSTEM DESIGN
Figure 4.4: Block diagram of a PID controller. Created by [101]. Licensed underthe terms of Creative Commons Attribution 2.5 Generic.
are always physical limitations that makes the ideal case a theoretical utopia.The tuning process’ concern is finding the parameters to the controller thatmakes it behave as close to the theoretical ideal as possible. There are severalknown methods to tune PID controllers. The Ziegler-Nichols method, the im-proved Astrøm-Hagglund method and the Skogestad method are some widelyused methods in control engineering [99]. These methods have not been con-sidered during this project since a few iterative experiments and according pa-rameter adjustments yielded stable and good controller performance in shorttime. Thus, the process in this project is easy to tune compared to many indus-trial processes. However, thorough tuning efforts is likely to produce similarcontroller efficiency with less less resource usage of the controller loop.
In addition to the PID parameters, the sample interval influences loop stabilityand tuning. Generally, the discrete PID controller approaches the behavior of acontinuous PID controller when the sample interval goes to zero. The reason tokeep sample interval short is increased stability and the reason for increasingthe sample interval is minimizing resources utilized by the controller. Thesample interval used in this project was found by experimenting with valuesand observing CPU usage. A sample interval of 100ms yielded very stablecontroller behavior and CPU utilization of approximately 1%.
However, lowering the sample frequency more may be possible without sacri-ficing stability. Another benefit of lowering the sampling frequency is calmeroperation of the throttle. It may not be necessary to move the throttled IP ad-dresses around as agilely as in the experiments, but it must be agile enough tocapture rapid workload interference changes. The interval of 100ms seems to
66

4.5. AUTOMATED OPERATION
be a fair balance between controller resource consumption and agility.
4.5 Automated operation
Most I/O schedulers, and those parts of an entity responsible for servicingapplication I/O requests, generally have a preference for satisfaction of readrequests over write requests. This is because waiting for read requests is block-ing applications from continuing their work. Usually, write requests are writ-ten to cache, at several levels in the I/O path, for later de-staging to permanentstorage without blocking the application from further operation. Hence, throt-tling write requests can be done to a certain limit without affecting applicationperformance. Nevertheless, it has been demonstrated through earlier experi-mental results that write requests are able to adversely influence the more im-portant read requests. The design goal of the final prototype is the utilizationof earlier results to automatically prevent write requests from adversely im-pacting read requests, thus contributing to improved application service pre-dictability without the need for user input.
The previous prototype version needed to be informed about a set of prede-fined important consumers to monitor average wait time for, and a predefinedset of consumers to throttle in order to influence the wait time of the importantconsumers (see section 4.4 and 5.7). Section 2.1 points out the relation betweenthe finite capacity of a resource and the effect of saturation on its consumers:load interference. Based on these assumptions, this section will describe thedesign of a prototype that completely automates the detection of saturationlevel and the identification of throttleable consumers, on a per resource basis.Instead of previous prototype’s reliance on user determined list of importantconsumers, this prototype uses the read-over-write prioritization to automat-ically find out what to monitor and which consumers are eligible for writethrottling.
In most storage devices, the disk group from which virtual disks are allocated,is bound to become the resource first saturated. This is the reason that LVMwas chosen to reproduce a similar environment in the lab setup. In the labsetup, volume groups represent the shared resource that logical volumes arestriped across. The objective of the prototype is to control the saturation levelcaused by write activity on a per-resource basis, thereby indirectly controllingthe read response time of the resource. This translates to per volume groupin the lab setup. In order to achieve this in the lab prototype, the followingrequirements will be met:
67

CHAPTER 4. SYSTEM DESIGN
ISCSIMAP
set_maintaner.pl
Create
/proc/net/iet/sessions
/proc/net/iet/volumes
IP-sets
Create & maintain members
Read
ewma_maintainer.pl AVEWMAS
Read
Create and maintain values
/proc/diskstats
Read
pid_reg.pl
Read
pid_threads
Read
Spawn($resource,$thresh)
Throttles
Files Shared memory ProcessesLegend:
lvs Run
Command Dependency
Read output
Figure 4.5: Automated controller framework overview
• An entity that maintains sets of IP addresses that are known to be doingwrite activity at a certain level: eligible throttlers.
– Each set should have name of the resource of which its members areconsumers.
– Each set should be immediately throttleable by using its name.
• An entity that maintains a value representing the saturation level on aper-resource basis.
• An entity that spawns a PID controller for each resource and:
– Uses the resource’ saturation level as input .
– Throttles the set of throttleable consumers for that particular re-source so that the saturation level is kept below a set threshold.
The requirements are fulfilled by three perl programs working together withIptables, Ipset and Traffic Control, utilizing shared memory for informa-tion exchange and perl threads for spawning parallel PID controllers. Figure4.5 illustrates the concept of the framework implemented by the three scripts.
68

4.5. AUTOMATED OPERATION
4.5.1 Automatic population of throttling sets
The set_maintainer.pl reads information about active iSCSI connections from/proc/net/iet/* (see listing C.2), where information about each iSCSI tar-get id is found: the connected consumer IP and servicing device. For all ac-tive iSCSI sessions, the device-mapper (dm) name and consumer IP address isrecorded. The lvs command is used to to record the logical volume name andvolume group membership of each device-mapper device detected to partici-pate in an active iSCSI session. The information found for each of the device-mapper device is recorded in a data structure and mapped into a shared mem-ory segment with the key ISCSIMAP. For each of the volume groups involvedin active iSCSI sessions, an empty IP-set is created with the same name as thevolume group. When iSCSI device maps are exported to shared memory andthe necessary IP-sets are created, the program enters maintenance mode. Thisis a loop that continuously monitors exponentially weighted averages (EW-MAs) of the write sector rates of all dm devices involved in active iSCSI ses-sions. For each of the previously created IP-sets, it then determines the set ofconsumers that have a write sector rate exceeding a preset configurable thresh-old. The generated set is used as target for converging the previously createdin-kernel IP-set used as match target by Iptables to match the list members.The IP-sets are converged once every second, yielding continuously updatedper resource IP-sets known to contain consumers exhibiting write activity atcertain level. These sets are immediately throttleable by Iptables matchingagainst them.
4.5.2 Automatic determination of saturation monitors
The ewma_maintainer.pl program reads the shared memory information ex-ported by the set_maintainer.pl program (see listing C.3), and creates resource-to-consumer mappings from it. For each resource, it continuously calculatesan exponentially moving average of the read response time using informationobtained from /proc/diskstats. Only consumers having read activity are in-cluded in the calculation. The data structure containing the resources’ readresponse time EWMAs is tied to a shared memory segment with key AVEW-MAS and updated every 100ms. The read response time EWMAs serve as perresource saturation indicators which will be used as input values to the subse-quently described PID controller threads.
69

CHAPTER 4. SYSTEM DESIGN
4.5.3 Per resource PID control
The pid_control.pl program attaches to the shared memory segment withthe key AVEWMAS (see listing A.3), and reads the saturation indicators main-tained by the ewma_maintainer.pl program. For each of the resources foundin the AVEWMAS shared memory segment, a PID controller thread is cre-ated with the resource name and its accepted read response time thresholdas parameters. Each PID control thread monitors the saturation level of itsdesignated resource and directly controls the delay throttle of the set contain-ing current consumers exhibiting write activity towards that resource. Thepid_control.pl then detaches from the worker threads and enters an infinitesleep loop, letting the workers control resource saturation levels in paralleluntil a SIGINT signal is received.
70

Chapter 5
Results
This chapter describes the experiments and their results. To make a clear sepa-ration between results and the incremental experiment design, the design con-siderations were put in the separate system design chapter: chapter 4. Resultsare chronologically ordered, and they influence the progress of subsequentexperiments, the system design chapter and ultimately the direction of theproject.
The expected basic effect of throttling down one or more initiators is to freeresources for the remaining initiators in order to improve their resource avail-ability. It is expected that the improved resource availability will improve theremaining initiators’ response time and/or throughput depending on the na-ture of the load running on them. Furthermore it is expected that request wait-times of individual virtual disks (logical volumes) can be used as indirect sat-uration level metric of the underlying shared resource. Last, it is expected tobe possible to create a closed-loop regulator which is able to keep request re-sponse times and data rates of important consumers within certain boundariesby the use of the described throttling methods.
5.1 Without throttling
When there is no throttling mechanism in place, there is free competition foravailable resources. Figure 5.1 shows how four equal read loads, run on eachof the equally powerful blade servers, share the total bandwidth of the disk re-sources, serving each of the logical volumes to which the blade servers’ iSCSIblock devices are attached. The plotted read rates show what each of the con-suming blade servers achieve individually.
71
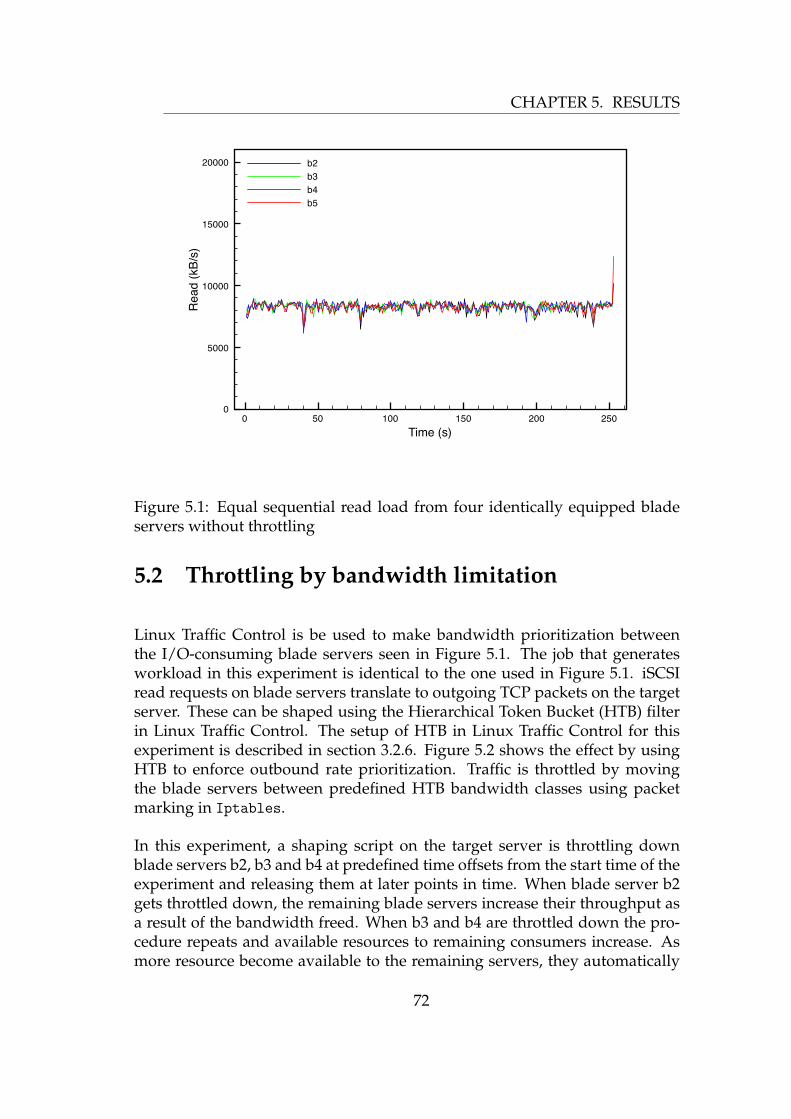
CHAPTER 5. RESULTS
0 50 100 150 200 250Time (s)
0
5000
10000
15000
20000
Read
(kB/
s)
b2b3b4b5
Figure 5.1: Equal sequential read load from four identically equipped bladeservers without throttling
5.2 Throttling by bandwidth limitation
Linux Traffic Control is be used to make bandwidth prioritization betweenthe I/O-consuming blade servers seen in Figure 5.1. The job that generatesworkload in this experiment is identical to the one used in Figure 5.1. iSCSIread requests on blade servers translate to outgoing TCP packets on the targetserver. These can be shaped using the Hierarchical Token Bucket (HTB) filterin Linux Traffic Control. The setup of HTB in Linux Traffic Control for thisexperiment is described in section 3.2.6. Figure 5.2 shows the effect by usingHTB to enforce outbound rate prioritization. Traffic is throttled by movingthe blade servers between predefined HTB bandwidth classes using packetmarking in Iptables.
In this experiment, a shaping script on the target server is throttling downblade servers b2, b3 and b4 at predefined time offsets from the start time of theexperiment and releasing them at later points in time. When blade server b2gets throttled down, the remaining blade servers increase their throughput asa result of the bandwidth freed. When b3 and b4 are throttled down the pro-cedure repeats and available resources to remaining consumers increase. Asmore resource become available to the remaining servers, they automatically
72

5.2. THROTTLING BY BANDWIDTH LIMITATION
utilize these resources to increase their own throughput. When b2 is freed fromits bandwidth limitations, b5 once again must share resources with b2, andboth consumers stabilize at a rate of approximately 13 MB/s. Then b3 is freedfrom its bandwidth limitations, and b2, b3 and b5 must share the remainingbandwidth. They stabilize at approximately 10 MB/s each, 30 MB/s in total.b4 is freed and all 4 blade servers equally share bandwidth for a short perioduntil b5 finishes its job. When b5 is finished, there are only three consumersleft to share the total resources and they all get a bit more throughput. Whenb4 finishes the job, there are two servers left to share, and when b3 finishes b2,will receive all available resources and achieve a throughput of approximately19 MB/s towards the end.
There is a drop in bandwidth of all consumers, including the unthrottled bladeserver b2, at the start time of the throttling phase of each blade server. Thereason for this could be processing overhead introduced by Iptables duringrapid modifications of its chains. Another possible explanation is that paral-lel read jobs experience some synergy benefits from each other when runningequally fast and started at the same time, thus accessing areas on the disk withcloser locations, and that this benefit is reduced when some jobs get throttleddown.
To suggest that the plots are not pure coincidence, the job was run twice, andthe results from the second run were stacked on top of the plots from the firstrun.
Section 3.2.6 describes the division of the interface into different bandwidthclasses in detail. Section 3.2.8 describes how Iptables is used to dynamicallymove blades between bandwidth classes.
The idea of using traffic policing as bandwidth control for iSCSI writes wasabandoned due to inefficient operation and lack of Iptables support. Detailedarguments for this decision are found in section 4.1.
73

CHAPTER 5. RESULTS
0 50 100 150 200 250Time (s)
0
5000
10000
15000
20000
Read
(kB/
s)
b2 1stb3 1stb4 1stb5 1stb2 2ndb3 2ndb3 2ndb5 2nd
Figure 5.2: Throttling of initiator’s sequential read activity using HierarchicalToken Bucket bandwidth (HTB) limitation in tc(1). Two independent runs arestacked on top of each other for verification of result repeatability.
74

5.3. THROTTLING BY PACKET DELAY
5.3 Throttling by packet delay
Both iSCSI read requests and write requests can be throttled using artificialpacket delay. This experiment shows that it is possible to achieve similar re-sults as with bandwidth throttling by introducing minor additional packet de-lays to individual consumers. The concept of packet delay is illustrated inFigure 4.1 and explained in section 4.1. The experiment shows that it is pos-sible to throttle write and read activity using the same set of delay queueingdisciplines (qdiscs) in Linux Traffic Control (tc). For writes, the ACK packetsto the consumers are delayed, and for reads all packets except ACK packetsare delayed.
Figure 5.3 shows the effect of packet delay based throttling on the same work-load as in figures 3.3 and 5.1, and figure 5.4 shows the effect when writing thesame load that was previously read.
The shaping is done in a similar manner as in section 5.2, using Iptables’
packet marking abilities to place packets from individual consumers in dif-ferent predefined delay qdiscs at different points in time. Throttling of bladeserver b2 frees up resources to the remaining consumers. Next, throttling ofb3 and b4 gives increased resources to the remaining consumers. When b2 isfreed, b5 is already done with its job, and most resources are available to b2which increases its throughput dramatically. When b3 is freed, b2 and b3 sharethe resources again and stabilize at approximately 14 MB/s each. Finally b4is freed, and b2, b3 and b4 share the resources, each having a throughput ofca. 10 MB/s. When b4 finishes its job, there are two machines left to share theresources, and when b3 finishes, only b2 is left to consume all resources.
The drop in throughput for un-throttled consumers, when throttling starts, ispresent also with the delay shaping method, but the effect seems to be some-what smaller. Additional research is necessary to identify if there are signifi-cant differences and to identify the cause of the drop.
75

CHAPTER 5. RESULTS
0 50 100 150 200 250 300Time (s)
0
5000
10000
15000
20000
Read
(kB/
s)
b2b3b4b5
Figure 5.3: Throttling of initiator’s sequential read activity using delayed ACKpackets in tc(1) (See Figure 3.2.7 ).
0 50 100 150 200 250 300Time (s)
0
5000
10000
15000
20000
Writ
e (k
B/s)
b2b3b4b5
Figure 5.4: Throttling of initiator’s sequential write activity using delayedACK packets in tc(1) (See Figure 3.2.7 ).
76

5.4. INTRODUCED DELAY VS THROUGHPUT
5.4 Introduced delay vs throughput
Previous results suggest that the method of introducing artificial delay to out-going packets could be an efficient way of throttling iSCSI initiators in orderto decrease the pressure on shared resources like disk groups. To find out thepredictability of throttling as an effect of artificial delay, 200 MB of data was re-peatedly read and written from the iSCSI initiator device of one blade server,measuring the time it took to complete each job. Each job were repeated 20times for each value of artificial delay. Figures 5.6 and 5.5 show the resultswith error indicators, representing the standard error, on top of the bars. Theprecision of the means is so high that it is hard to see the error indicators at all.
The plots show that variation of artificial delay between 0 and 9.6 ms is consis-tently able to throttle reads between 22 MB/s and 5 MB/s and writes between15 MB/s and 2.5 MB/s. There is no absolute relationship between artificial de-lay and throughput. Rather, the introduced delay has an immediate rate reduc-ing effect regardless of what the throughput was when throttling started. Fig-ures 5.6 and 5.5 suggests that there is a close-to-linear functional relationshipbetween introduced delay, the start rate and the resulting rate after throttling.It is also reasonable to suggest that NIC buffer size and usage of jumbo framesin the network are variables in the equation. This is because they control thepacket frequency hence indirectly how often the artificial delay is applied dur-ing a particular amount of transferred data. However, further research wouldbe necessary to establish a model for such a relationship, and as demonstratedlater, such a model is not necessary in order to utilize the method in a closedloop controller.
See listings E.1, C.1 in appendix D for details about data and plot generation.
77

CHAPTER 5. RESULTS
0 0.6 1.6 2.6 3.6 4.6 5.6 6.6 7.6 8.6 9.6
Introduced delay (ms)
Tim
e to
rea
d 20
0MB
of d
ata
(s)
010
2030
40
Figure 5.5: Repeated measurements of the time used to read 200 MB with step-wise increase in artificial delay of outgoing packets from target server.
0 0.6 1.6 2.6 3.6 4.6 5.6 6.6 7.6 8.6 9.6
Introduced delay (ms)
Tim
e to
writ
e 20
0MB
of d
ata
(s)
020
4060
80
Figure 5.6: Repeated measurements of the time used to write 200 MB withstepwise increase in artificial delay of outgoing packets (ACK packets) fromtarget server.
78

5.5. INTERFERENCE BETWEEN LOADS DEMONSTRATED
5.5 Interference between loads demonstrated
This experiment was set up to demonstrate how loads sharing the same un-derlying resource affect each other. A job named smalljob was run on b2, per-forming random read of 8kB request size with one thread and a total data sizeof 128 MB. The purpose of smalljob was to mimic an interactive workload thathas demand for low response times and requests I/O in a relaxed manner.Thus, it was rate limited to 256kB/s. Figure 5.7 shows how the average waittime of smalljob gets influenced by an increasing amount of interference fromother hosts writing to their own virtual disks. The plots are from four differentruns, each having a different amount of interference started 60 seconds aftersmalljob is started. The black line depicts smalljob’s average wait time when noother activity occurs. The green line shows the next run stacked on top, anddepicts how smalljob’s response time is more than doubled at 60 seconds, whenan interfering single threaded write job executes unlimited sequential writestoward its own virtual disk. At approximately 125 seconds, the interferingthread stops and the response time of smalljob drops to the same value it wasbefore interference started. The blue and red plots are subsequent runs of thesame jobs, but with three and twelve threads interfering write threads respec-tively. Clearly the average wait time of smalljob increases with an increasingamount of interfering threads that operate on their own virtual disks. Withtwelve interfering threads, spread across three hosts, the average wait timeof smalljob varies between 30ms and 120ms. The cause of smalljob’s increasedresponse time lies not in the activity of smalljob, but in the activity of other con-sumers saturating the capacity of the underlying resource. If the smalljob wasan application highly dependent on response time it would have been five tosix times slower when write interference occurs. In reality, a single machinewith multiple CPU’s, and an application capable of parallelizing a lot of I/O,can easily saturate the request queues of a storage device, thus adversely af-fecting response time of all consumers sharing that resource.
Jobs with increasing amounts of threads take longer due to the increased to-tal amount of data to write (the same amount of data for each thread). Thejob definition of smalljob is shown in listing D.2 and the job definition of eachinterfering thread in listing D.3.
79

CHAPTER 5. RESULTS
0 100 200 300 400 500Time (s)
0
20
40
60
80
100
120
Wai
t tim
e (m
s)
No interference 1 thread (1 machines)3 threads (3 machines)12 threads (3 machines)
Figure 5.7: The effect on average wait time for smalljob on b2 with interferingwrite activity from 1 and 3 other machines respectively.
5.6 Effect of throttling on wait time
In the previous experiment, the effect on consumer response time, caused byother consumers’ activity was examined. In this experiment, the effect on con-sumer response time by throttling the interfering consumers’ activity is ex-amined. Expected behavior is that the throttling of demanding consumerswill free up capacity for the unthrottled important consumers, thus improvingtheir perceived performance. Figure 5.7 shows that writing activity of othermachines increases the average wait time of a smalljob doing random reads.The objective is to ameliorate this situation by throttling the activity of the in-terfering loads.
Figure 5.8 shows the effect on the smalljob’s average wait time when throt-tling the 12 interfering sequential writers. Packet delay throttling is done inthe periods 100ms − 190s and 280s − 370s, using 4.6ms and 9.6ms packet de-lay respectively. Clearly the throttling of interference contributes to wait timeimprovement. The magnitude of improvement is higher if the wait time ishigh before throttling (i.e. level of saturation is high). It means that the throt-tling cost for improving response time from terrible to acceptable can be veryvery low, but the cost of throttling increases as the response time improves
80

5.7. PID CONTROL OF RESPONSE TIME
0 100 200 300 400 500Time (s)
0
20
40
60
80W
ait t
ime
(ms)
010000
2000030000
4000050000
Aggr
egat
ed in
terfe
renc
e (k
B/s)
Small job average wait time (Left)Interference aggregated throughput (Right). Throttling period with 4.6 ms delayThrottling period with 9.6 ms delay
Figure 5.8: The effect on small job’s wait time when throttling interfering loadswith delays of 4.6 ms and 9.6 ms respectively.
(decreases).
5.7 PID control of response time
Previous experiments demonstrated that the packet-delay throttling methodworks well for instantly slowing the rate of less important consumers, and do-ing so improves important consumers’ response time. The rate-reduction isachieved by adding a variable packet delay, typically 0.5− 20ms, that instanta-neously reduces the current rate of the consumer it is applied to. The next stepis to automate the throttling decision: the decision about which delay shouldbe put on which packets. The ideas and design of this automation involvesthe usage of a proportional integrating derivate (PID) controller. Detailed ar-guments for this design decision is found in section 4.4.
Experimental results from testing the controller’s adaptability to rapidly chang-ing workloads is shown in Figures 5.9 and 5.10. The black plot in Figure 5.10shows the aggregated throughput of 12 sequential write threads spread across3 blade servers, and Figure 5.9 shows the effect they cause on a rate-limitedrandom read job running on a different machine when no regulation occurs.
81

CHAPTER 5. RESULTS
0 100 200 300 400 500Time (s)
0
20
40
60
80
100
Aver
age
wait
time
(ms)
No regulation20 ms treshold15 ms threshold10 ms threshold
Figure 5.9: The average wait time of a rate limited (256kB/s) random readjob interfered by 12 write threads started simultaneously and repeated with 5seconds pause in between. The black plot shows the effect with free resourcecompetition. The colored plots show how the PID regulator keeps differentresponse time thresholds by regulating interfering workloads.
All write threads are turned on synchronously and repeated with five secondsleep in between, thus creating relatively large and rapid impacts on the ran-dom read job’s response time. The colored plots show the effect of the sameinterfering workloads with the PID regulator enabled having thresholds setto 20, 15 and 10 ms respectively. Figure 5.10 shows the throttling effect onthe corresponding interfering workloads (aggregated throughput). Notable isthe relatively higher response time improvement for the random read job bythrottling aggregate write throughput from its maximum of 39MB/s down to33MB/s, yielding an improvement of 25 ms lower response time. Taking theresponse time down another five milliseconds costs another 7MB/s of throt-tling to achieve. Clearly the throttling cost for each step of improved responsetime increases as response time improves. Looking at it another way, if theset threshold is close to the saturation point, the cost of avoiding saturation isminimal.
82

5.8. MEASURING OVERHEAD
0 100 200 300 400 500Time (s)
0
10000
20000
30000
40000
50000
Aggr
egat
e W
rite
(kB/
s)No regulation20 ms threshold (smoothed)15 ms threshold (smoothed)10 ms threshold (smoothed)
Figure 5.10: The aggregated throughput caused by throttling to keep latenciesat the set thresholds in Figure 5.9.
5.8 Measuring overhead
By adding the throttling feature there is a risk of adding extra overhead com-pared to the same setup with no throttling. Experiments done so far indicatelittle or no overhead, but this shall be further examined in the following exper-iment.
Overhead when no throttling occurs is unwanted. Since no Iptables rules areactive when no throttling occurs, there is no overhead introduced by Iptables.The only possible source of overhead in this situation is the static tc queueingdisciplines (qdiscs) and/or the static filters attached to the root qdisc. All out-going packets are checked for marks by the static filters and there is a risk thatthis checking introduce overhead. To investigate if the existence of static de-lay queues and their filters add overhead, the difference in throughput wasmeasured with static qdiscs present and absent. Also, to maximize any impactcaused by tc packet checking, the logical volume servicing the iSCSI initia-tor was interchanged with a RAM-disk. The fast speed of the RAM-disk en-sures that any overhead introduced by packet checking in the network layerbecomes visible. The test was carried out by reading/writing 512MB from/tothe RAM-disk based iSCSI target from one of the blade servers (b2), first with-
83

CHAPTER 5. RESULTS
out any tc qdiscs and filters enabled and then with 20 delay classes with fil-ters attached. Each job were repeated 20 times, yielding four vectors of twentynumbers. The two pairs of vectors, with and without qdiscs/filters, were com-pared using student’s t-tests in R.
The following command were used, on host b2, for capturing the times (sec-onds) of each read and write operation:� �/usr/bin/time -f %e /usr/local/bin/fio --minimal \
--output /dev/null $fio -jobdef� �The $fio-jobdef file defined a 64Kb request size, a total data amount 512MBand direct I/O using the synchronous I/O engine. The target for the job wasthe /dev/iscsi_0 device bound to the RAM-disk on the target server, and therw parameter were varied to create read and write direction of the job respec-tively.
The 99% confidence interval of the t-test difference between the two read jobsis CIread = 0.011s < t < 0.035s, and mean difference is 0.023s. The 99% con-fidence interval of the t.test difference between the two write jobs is CIwrite =0.069s < t < 0.155s, and mean difference is 0.112s. Hence, the worst caseoverhead, with 99% confidence is 0.035s/0.155s for reads/writes respectively.
The average read rate with no qdiscs is 512MB7.188s = 71.2MB/s, and the average
write rate with no qdiscs is 512MB8.731 = 58.6MB/s. The read rate with worst
case overhead is 512MB7.188s+0.035s = 70.9MB/s, yielding a read rate difference of 0.3
MB/s, a worst case overhead of 0.42% relative to the rate without qdiscs. Theaverage write rate with worst case overhead is 512MB
8.731s+0.155s = 57.6MB/s, yield-ing a write rate difference of 1MB/s, a worst case overhead of 1.7% relative tothe rate without qdiscs.
5.9 Automated PID control approach
The design of a fully automated per-resource read-response-time-controller isdescribed in section 4.5. This section describes experimental results when theautomated framework is exposed to the same loads as in section 5.7. In thisexperiment, information about resources and per resource throttleable con-sumers are automatically inferred by the framework.
Figure 5.11 shows that the results with per resource saturation level auto-detection, and dynamically maintained throttleable consumer sets, is close tothe results in section 5.7 when defining throttleable consumers and response
84

5.9. AUTOMATED PID CONTROL APPROACH
0 100 200 300 400 500Time (s)
0
20
40
60
80
100
Reso
urce
vg_
aic
aver
age
read
wai
t tim
e (m
s) No regulationAutomatic regulation, thresh=20msAutomatic regulation, thresh=15msAutomatic regulation, thresh=10ms
Figure 5.11: The average wait time of a rate limited (256kB/s) random readjob interfered by 12 write threads started simultaneously and repeated with 5seconds pause in between. The black plot shows the effect with free resourcecompetition. The colored plots show how the PID regulator keeps differentresponse time thresholds by regulating interfering workloads. In this plot, theresource saturation indicator and the set of throttleable host are maintainedautomatically.
time monitors manually. Figure 5.12 shows the resulting aggregated writerates as a consequence of the automated throttling carried out to keep readresponse time below the set thresholds in 5.11. Again, the black plot depictsresponse-time/write-rate without regulation, and the colored ones depicts thesame but with regulation at different threshold values.
The results shows that the automated per resource PID control framework isable to closely reproduce the results in section 5.7 where throttleable consumersets and resource saturation indicators were manually given as parameters tothe PID regulators.
There is a slight delay in the throttle response compared to section 5.7, giving aslightly larger magnitude and duration of the overshoot created by the simul-taneous starting of 12 interfering threads. It is reasonable to speculate that thisis caused by the additional time required to populate the sets of throttleableconsumers.
85

CHAPTER 5. RESULTS
0 100 200 300 400 500Time (s)
0
10000
20000
30000
40000
50000
Reso
urec
vg_
aic
aggr
. writ
e th
roug
hput
(kB/
s) No regulationAutomatic regulation, thresh=20msAutomatic regulation, thresh=15msAutomatic regulation, thresh=10ms
Figure 5.12: The aggregated throughput caused by throttling to keep latenciesat the set thresholds in Figure 5.11
During experiment execution, the OUTPUT chain of the Netfilter mangle tablewas monitored with the command watch iptables -L OUTPUT -t mangle. Asexpected, the rule that marks the outbound ACK packets of all consumersin the set of throttleable consumers appeared as soon as the response timethreshold was violated. Further observation revealed rapid increase of themark value as the write interference increased in magnitude, thus directly in-hibiting write activity to a level that does not cause threshold violation. Thecommand watch ipset -L was used to observe that an empty set with thesame name as the active resources (the vg aic volumgroup) were created uponstartup of the set_maintainer.pl program. Furthermore, the set was popu-lated with the correct IP addresses as the write activity of consumers violatedthe set threshold, and the IP addresses were removed from the set when con-sumers ceased/reduced write activity.
Before creating the workload used in this experiment, various smaller work-loads were tested while plotting average wait time in realtime during experi-ments. By applying various increasing and decreasing write interference, thePID controller’s behavior was observed in real time. The controller exhibitedremarkable stability when gradually increasing interference. Hence, it was de-cided to produce the most extreme workload variation possible for the plottedresults by turning on and off 12 writer threads (powered by three machines)
86

5.9. AUTOMATED PID CONTROL APPROACH
0 50 100 150 200Time (s)
0
10
20
30
40
50
(ms)
010000
2000030000
40000
(kB/
s)
vg_aic read wait time with automatic regulation, thresh=15msPacket delay introduced to writersAggregated write rate
Figure 5.13: The resource average wait time, the throttling delay and the ag-gregated write rate with a set resource-wait-time-threshold of 15ms
simultaneously.
It is interesting to examine how the throttle-produced packet delay changesas the the PID controller decides throttle values. Thus, the experiment usedin 5.9 and 5.7 were run again, capturing the packet delay applied to the setof throttleable hosts along the duration of the experiment. Figure 5.13 showsthe monitored resource’s (vg aic) actual wait time, the throttle value (packetdelay) produced by the PID controller and the actual resource’s aggregatedwrite rate. The 12 writer threads want as much I/O bandwidth as they can get(37 MB/s without regulation), however, they get throttled by introducing thepacket delay seen in the red plot. The decreased write rate caused by packetdelay prevents resource saturation, which again prevents read response timeof the resource from exceeding the set threshold of 15 ms.
87

CHAPTER 5. RESULTS
88

Chapter 6
Discussion and conclusion
This chapter discusses the methods and design used, the choices made duringthe process and the results exhibited together with their implications.
6.1 Approach review
Approaches of previous work vary from pure model design to thorough ex-periments based on simple assumptions. The difficulty of modeling the dy-namic and complex behavior of disc arrays’ performance, in the cases whereresource-sharing is used extensively, has been pointed out by a large part ofthe previous research. Those works which relied on extensive model designwere either tested using simulations only, or failed to capture the complexitywhen tested in realistic experiments. Approaches using simple assumptionsand close-to-real-world experiments seemed to get the most applicable results.Thus, a similar approach was used in this project. Given the results exhibited,that seems to be have been a fruitful decision.
The approach of this project is highly influenced by real-world problems expe-rienced by the author, introduced by the resource sharing mechanisms seen inmany networked storage devices. These challenges would have been reduced,or completely avoided, by having a simple two level prioritization mechanism:important and less-important. Hence, a major motivation of this project hasbeen to address this incompleteness within the available scope of the chosentechnology, namely iSCSI based disk arrays. This approach requires a man-ual value decision about what virtual disks are important and response timesensitive and what virtual disks can tolerate being rate-reduced in order to
89

CHAPTER 6. DISCUSSION AND CONCLUSION
avoid resource saturation. An initial prototype was created with this specificproblem in mind.
The subsequent prototype tries to make more general assumptions about whatoperations are important, and automatically makes prioritization decisionsbased on them. This prototype exchanges fine grained manual control withautomatic decisions based the general assumption that read requests are moreimportant than write requests (see section 4.5 for assumption discussion). Theprototypes demonstrate how the basic elements studied in this project can beutilized for various kinds of prioritization systems with differing properties.
Of course, none of the prototypes offer a magic method to increase the amountof total resources. If a virtual disk consumer deemed important by policy (au-tomated or not) decides to saturate all resources, it will be allowed to do so.This is the intended behavior though, since the objective of the project is todesign methods preventing less-important activity from adversely affectingimportant activity. As seen in the two prototypes, what is considered impor-tant is not a universal truth. If activity deemed important by policy saturatesall resources, either the policy is flawed or the total capacity of the resources isinsufficient.
This project is characterized by a broad approach, a thorough evaluation ofexisting research, and cross-disciplinary and practically oriented thinking inthe application of solutions. By combining ideas from the networking andcontrol engineering fields it was possible to create two working prototypes byutilizing the ideas in novel ways.
6.2 Tools used
Choice of tools is important in order to build confidence in the results exhib-ited. Tools are used to measure behavior and create workload. It is essentialthat measuring tools are well known and accurate, and that the tool used forworkload generation is producing exactly what it is instructed to in a repro-ducible way.
This project utilizes scripts extensively, together with ntp, at and ssh, to syn-chronize events between several hosts. The scripts make sure that the tim-ing, order of execution, data collection and post processing are identical forjob setups that compare similar aspects. The scripts call well known toolslike blktrace, collectl, argus, collectd, dstat, gnu-time and fio thatmonitor the execution of the experiments and generate the desired workloads
90

6.3. IDENTIFICATION OF RESOURCE UTILIZATION
at predetermined points in time. Using the same tools and scripts for executingthem, the results in this project can easily be reproduced.
6.3 Identification of resource utilization
The assumptions stated in section 2.1, section 1.1 and previous work [65] sug-gested a reliable relation between average consumer response times and sat-uration level of their underlying resource. The resource saturation level, orconversely the remaining capacity, is determined by the aggregate workloadutilizing the resource. Magnitude, direction, randomness, and request sizes ofthe aggregate workload are only some of the variables determining remainingcapacity. The other part of this equation is comprised by RAID level, stripesizes, stripe lengths, disk access times, bus speeds, head position of disks, con-troller CPU capacity, speed and amount of cache in various levels of the datapath, internal algorithms for cache management, dynamic redistribution ofdata and the like. Attempts to modeling the remaining capacity as a functionof all these parameters remains a difficult outstanding problem. Therefore,this project chose to use the best means now available as an indirect measureof remaining resources capacity: the response time of currently active resourceconsumers. Measuring this value is simple and the measurement consumes anegligible amount of resources. The usability of average consumer responsetime as a saturation level measure is underlined by all response time relatedexperiments carried out in this project, and further confirmed by the success-ful operation of the two PID controller prototypes described in sections 4.4 and4.5.
6.4 Effect of interference
Interference between loads sharing a common resource causes consumers toexperience varying performance which is not caused by their own activity. Itis caused by the previously mentioned remaining capacity, which varies in ahighly unpredictable manner, and is a consequence of the resource’s aggre-gate workload and its hardware setup. The ultimate goal of this project is toincrease individual consumers’ predictability with respect to the performancethey perceive. The latter is directly related to the previously mentioned con-sumer average response time. In order to make this performance more pre-dictable, it was necessary to study the effects of load interference. Section 5.5demonstrates clearly how varying amounts of write activity influence the read
91

CHAPTER 6. DISCUSSION AND CONCLUSION
response time of a consumer that produces little workload by itself. While thisis not the only aspect of load interference, it is an important one. Generallyread request response times are most critical for application operation. Forthese particular experiments the effect of writing activity on other consumersread response time were chosen to illustrate the problem of load interference,but clearly any kind of consumer workload is able influence all consumers’available capacity by executing any kind of workload towards its own virtualdisks. It is just a matter of how much power is driving the resource hoggingworkloads.
6.5 Effects of throttling
Throttling of workloads has been utilized as a means to influence remainingcapacity by many previous works, and it is normally carried out by some kindof rate limitation applied to the workloads. Utilization of the iSCSI proto-col comes with the additional benefit of utilizing TCP traffic shaping tools toenforce rate limitation. In order to examine the effects on consumers by throt-tling taking place in the TCP layer, a number of experiments were executed.The first throttling approach involved bandwidth limitations by using hierar-chical token bucket filters (HTB). The expected effect of throttling individualconsumers was achieved, but the pure bandwidth throttler had a few prac-tical limitations: the need for constantly calculating the bandwidth to be ap-plied and, more important, the inefficient way of controlling write requests.Controlling write rates was not possible without packet loss, resulting in slowand inefficient convergence towards bandwidth target. This is thoroughly dis-cussed in section 4.1.
The shortcomings of the bandwidth shaping method inspired the idea of us-ing packet delay for throttling. The netem module of Linux Traffic control wasused to add delay to packets in a dynamic way using Iptables packet marks.The concept is to add a small wait time to outgoing ACK packets, thus slowingdown the packet rate of the sender: the iSCSI writer. This concept, with its prosand cons, is thoroughly discussed in sections 4.2 and 4.1. The main outcomeof the design and subsequent experiments is an efficient way of throttling in-dividual iSCSI consumers’ traffic in both directions, with close-to-linear ratereduction and without packet loss (see section 5.4). To our knowledge, thisapproach has not been used to apply throttling in this way before.
The packet delay throttle is a tool by itself with its capabilities to throttle traf-fic in both directions. This tool is ready to be used as a means to execute thethrottling part in any kind of iSCSI/TCP based automated framework for pri-
92

6.6. THROTTLING DECISION
oritization. In the experiments, writing activity was chosen as interferencebecause it yielded the most violent interference. Therefore it served the pur-pose of demonstrating the concept of load interference in the best possible wayfor this setup. Other situations may call for the need to throttle read interfer-ence too, and there is nothing preventing the packet delay throttle to be usedin this scenario. It is has been demonstrated to work equally well as for writeinterference (see section 5.4).
The usefulness of the packet delay throttle is also demonstrated by its efficientmeans to execute PID controller throttling decisions in the two prototypes sub-sequently developed.
6.6 Throttling decision
Design and experiments up to this point yielded an efficient method of man-ually specifying a rate-limiting throttle value on a per consumer and per di-rection (read/write) basis: the packet delay throttle. However, having to man-ually control groups of individual consumers is clearly not sufficient in orderto make keepable promises about individual consumers’ performance. Stati-cally set rate limitations quickly become invalid as the aggregated workloadof the resource is changing. The blackbox approach taken in this project neces-sarily implies no prediction of workload changes, but relies on measuring theeffect of them. Having just a manual knob to control throttling is clearly notsufficient when interfering workloads rapidly change. Previous experimentsshows that the response time of a resource is a sufficient measure of remainingcapacity regardless of workload pattern. The decision to use this response timeas input to the throttling decision engine should therefore not be particularlycontroversial.
The purpose of the decision engine is to throttle loads deemed less impor-tant in order to keep more important loads to be adversely affected. What isdeemed important will vary between different situations. It can be read overwrite prioritization, fair sharing with weights, manually defined sets of impor-tant consumers or any combination of these. The first approach of this projectis manually defined sets of important and less important consumers. Due tothe choice of workloads this approach implies read over write prioritization,however, if the workloads changed the set of prioritized consumers wouldstill be the same and whatever workload they would run would be throttledaccordingly.
The idea of using a PID controller as decision engine emerged from the obser-vations of the relation between interfering workloads, the interference by other
93

CHAPTER 6. DISCUSSION AND CONCLUSION
consumers and the efficient operation of the packet delay throttle. This behav-ior is similar to the control organs used to control industrial processes operatedby PID controllers in the field of control engineering. Preliminary experimentsusing the PID controller algorithm exhibited promising behavior with respectto the problem: keeping consumer response time below a certain threshold inspite of massive interference. Thus, more extensive and synchronized experi-ments were designed to further confirm the PID controller’s suitability for thepurpose.
The experiments in section 5.7 shows the results when the PID controller op-erates on predefined sets of important and less important consumers. Theyclearly verify the suitability of the PID controller for this purpose. The PIDcontroller exhibits remarkable ability to keep response time at the predefinedthresholds, in spite of violently changing workload interference. If the re-sponse time threshold is reasonably set, the rate reduction needed for inter-fering workloads is small. For lower thresholds the controller loop also keepsa stable value, but at a much cost in the form of further rate reduction of inter-fering workloads.
6.7 An automated framework
In order to take one step further with respect to autonomous operation, anapproach using read over write prioritization was designed 4.5. While this ap-proach does not cover all possible needs for various prioritization schemes, itfurther emphasizes the suitability of the packet delay throttle and the PID con-troller as basic building blocks of an example scheme. Furthermore, additionaltechniques are demonstrated to automate resource/consumer mappings, perresource saturation monitors and autonomic maintenance of throttleable con-sumers. Using these basic building blocks, it should be easy to build any kindof prioritization scheme or combinations of such.
The approach for automatically deciding what to include in the calculationof resource saturation level, and the means to influence it, has demonstratedequally good results compared with experiments where this information ex-plicitly was given. Hence, the automated per resource PID regulation is a stepforward with respect to generalization of the framework into per resource in-dividually maintained controller loops.
The results of the autonomous framework shows a slight increase in magni-tude and duration of the read response time threshold-overshoot comparedto the controller loop utilizing predefined consumers sets. It is reasonable to
94

6.8. THROTTLING OVERHEAD
speculate that this is caused by the additional time to populate the set of throt-tleable consumers before throttling influences the rate. Increasing the currentone second convergence rate of the throttleable sets will probably make thisovershoot less. This is a value decision considering how much CPU resourcesis spent checking for potential set members, compared to the acceptable over-shoot. However, the magnitude and duration of the overshoot is consideredto be within acceptable limits, given the nature of the interference workload.
The workloads are designed to create maximum variation in interference bysimultaneously switching on and off 12 threads spread across three machines.The impact of this interference, when there is no control loop active, is clearlyshown by the black plots in Figures 5.11 and 5.9. Wait time of the impactedrandom read workload peaks at > 80 ms when there is no control loop. Ap-plying the control loop stabilizes the wait time of the random read job at theset threshold with remarkable stability. This is managed by the framework inan autonomous way on a per resource basis, comprising a solution to problemstated in section 1.2.
The modular design of the programs comprising the two prototypes makes ittrivial to reimplement the framework in similar environments. Moreover, theyare easily used as building blocks to achieve different prioritization schemesthan those demonstrated in this project or they can be used as components ina bridged packet throttle.
6.8 Throttling overhead
When examining alternatives, the overhead term is commonly related to thedifference in overhead between alternatives. This project introduces new fea-tures to prioritize workloads sharing a common resource. It is timely to ask ifthis new feature comes with an added overhead. Experiments in section 5.8indicates a worst case overhead of 1.7% for writes and 0.3% for reads whenaccessing an iSCSI target device serviced by a RAM disk. Clearly, having thestatic filters ready to be used for delay throttling adds some overhead. Whilethe the overall overhead is small, it is still much larger for writes than reads.The reason for this is not clear, but some of the difference can be explainedby the worst case calculation being impacted by a larger confidence interval(more variation) for the writes. If the difference in means were used for thecalculation, the write jobs would have a difference of 0.7MB/s or 1.2%. Forreads, it would have been 0.2MB/s or 0.28%. One hypothesis suggested wasthat writes generated more outbound packets than reads. Hence, the numberof packets to check per data amount would be higher for writes. However, this
95

CHAPTER 6. DISCUSSION AND CONCLUSION
hypothesis was refuted by looking at the actual outgoing packet rates from thetarget server during the experiment. Reads generated higher outbound packetrates than writes. This was also expected behavior, since the most of the out-bound packets was the ACK packets back to the initiator. Hence, this behaviorremains unexplained.
Experiments in section 5.8 suggest that the introduced overhead is related tothe amount of static tc filters attached to the root qdisc of the iSCSI interface.This is reasonable since all packets must be checked for a particular mark byeach filter. This could be greatly improved by having one filter checking ifpackets are marked or not, and then send packets that are marked for furtherchecking by subsequent filters. Packets that are not marked would not needfurther checking. It is expected that implementation of this method will nearlyremove the no-throttling-overhead, while the additional delay introduced bysubsequent packet inspection for packets with marks is negligible comparedto the added delay they will end up with.
The concept of throttling implies inducing overhead to a set of consumers onpurpose. Thus, this kind of overhead is not considered harmful or unwanted.However, if throttling of some consumers induces overhead to other unthrot-tled consumers it is unwanted behavior. This behavior observed in Figures5.2, 5.4 and 5.3, when the rate of the unthrottled consumer is affected by thethrottling of other consumers. However, the effect is not necessarily causedby throttling overhead. When all consumers read or write sequentially fromstriped logical volumes, it is possible that there is some synergy effect be-tween jobs due to read-ahead or consolidated operations in the block layer.When some consumers get throttled down, this synergy effect is reduced, andit could explain the temporary throughput reduction seen by the unthrottledconsumers.
6.9 Future work and suggested improvements
This project opens several interesting paths for further research and applica-tions. By using the fundamental ideas explored, it should be possible to cre-ate QoS modules to be used as external bridges in front of iSCSI appliancesor integrated into Linux based iSCSI appliances similar to the lab prototype.By utilizing the ideas from this project, system administrators and vendorscan offer QoS for iSCSI storage. Hence, they can offer differentiated SLAs tostorage consumers with a confidence previously very difficult to achieve andcontribute their share to overall application SLAs.
96

6.9. FUTURE WORK AND SUGGESTED IMPROVEMENTS
iSCSI disk array Ethernet sw.
QoS bridgeQoS bridge
QoS bridgeQoS bridge
QoS bridgeConsumers
QoS bridge
Resource/consumer mapsVirtual disk latencies
Array specific pluginSNMPGET
Figure 6.1: Illustration of how the framework could be utilized as an indepen-dent black box with limited array knowledge.
Figure 6.1 illustrates an approach for moving the controller to an externalbridge. Information about consumer/resource mapping and virtual disk readlatencies would be necessary in order to directly utilize the techniques demon-strated here. In the figure, usage of SNMP GET requests towards the array issuggested as an easy method for this purpose. However, the ultimate blackbox approach would be to infer this information from packet inspection. Ifachievable, this approach could serve as a self contained, non-intrusive, iSCSIQoS machine applicable to all iSCSI solutions regardless of their make andthe feedback loop to the storage device would not be necessary. But it is un-likely that the actual consumer/resource mapping can be detected by packetinspection since this is internal storage device knowledge. However, it couldbe indirectly inferred by using a predefined initiator naming convention thatcontain resource membership.
Even with high sampling rate, and convergence rate of throttleable consumersets, the PID controller framework consumes little resources. Small resourceconsumption and overhead are important attributes to enable high scalabil-ity. The small resource consumption and overhead seen in the lab prototype,makes it reasonable to project high scalability in a production environmentwith large amounts of resources and consumers per resource. Combined withthe suggested PID controller tuning and rearrangement of tc filters an evensmaller footprint can be achieved.
Like mentioned in section 4.3, the measuring point where virtual disk responsetime is measured must be moved in order to detect bottlenecks that occur be-fore the local disks of the target server. An approach using agents on iSCSIinitiators would be the best way of considering all bottlenecks along the datapath by providing the initiator-experienced wait time to the throttling bridge.The advantage of this approach is its simplicity, and how efficiently it will cap-ture all bottlenecks along the iSCSI data path. The disadvantage is its relianceon initiator host modifications. A viable approach could be to use the attribute
97

CHAPTER 6. DISCUSSION AND CONCLUSION
has agent installed to infer relative higher importance to the set of initiator thathas agents, and automatically use the set of consumers not having agents as afirst attempt of throttling before resorting to prioritization between initiatorswith agents installed. Using this approach, the action of installing an agentserves both the purpose of making performance metrics available to the con-troller and telling about the membership in the set of important hosts.
Previously developed algorithms other than the PID algorithm can be com-bined with the throttling techniques from this project to create even moreefficient and/or general purpose QoS mechanisms for iSCSI or even otherIP/Ethernet based storage technologies. Furthermore, the PID control algo-rithm could be evaluated as a means to create stability and predictability inother infrastructure components than just iSCSI devices. It is likely that theproblem of controlling iSCSI consumers is not the only one where a PID con-troller can contribute.
There is always a persistent and large interest in workload classification/mod-eling techniques in various research areas, not only in the storage field. To-gether with the ever-evolving efforts to model storage devices, this researchcan be combined with the ideas and results in this thesis in order to add im-proved and even more generalized frameworks. Response time measurementscan still serve as a fallback when model generation fails or is too inaccurate,while improved operation is achieved in the cases where workload predictionworks.
6.10 Conclusion
Resource sharing is widely used in storage devices for the purpose of flexibilityand maximum utilization of the underlying hardware. Sharing resources likethis introduces a considerable risk of violating application service level agree-ments caused by the unpredictable amount of I/O capacity available to indi-vidual storage consumers. The difficulties experienced by system administra-tors in making keepable promise about storage performance and the amountof previous research in the storage QoS field clearly emphasizes the need forpractical and real-world-usable QoS mechanisms for storage systems.
iSCSI based storage solutions are capturing increased market share from FCbased storage solutions due to increased performance and low cost. Thus,iSCSI is an interesting target technology for devolpment of QoS mechanismsfor wide industry and system administrator adoption. The fact that iSCSI uti-lizes TCP for transportation makes it possible, and very interesting, to adapt
98

6.10. CONCLUSION
well known network traffic shaping tools for the purpose of QoS in iSCSI en-vironments.
This project reproduces and demonstrates the nature of resource sharing, theeffect of resource saturation on throughput and consumer response time, andthe resulting interference caused by load interaction. Using a Linux basediSCSI storage appliance, experiments reproduce the varying performance ofindividual consumers caused by other consumers’ activity. The lab environ-ment, verified to exhibit similar properties to problematic real-world storagesolutions, is then used to design methods to solve some relevant aspects ofload interference. The methods involve using a network packet delay method,available in the netem module of Linux Traffic Control, in novel ways and amodified proportional integral derivative (PID) controller. By combining thefeatures of the netem module with Iptables’ ability to dynamically mark pack-ets, an efficient bidirectional mechanism for throttling individual iSCSI initia-tors consumers is created. The created packet delay throttle is utilized by amodified PID controller implemented in software. The PID controller utilizesthe packet delay throttle as a means to influence its input value: the averagewait time of the resource being controlled. The resource being controlled inthe lab setup is LVM volume groups, but the methods are generally adaptableto any kind of resource exhibiting similar attributes.
The effect of packet delay throttling and the PID controllers’ suitability as deci-sion engine is thoroughly examined through experimental results. Finally, allpreviously designed and tested elements used in single aspect experiments aretied together in a prototype for a autonomous resource control framework thatis able to keep resource read response time below a configurable threshold bythrottling write activity to the resource automatically. In spite of rapidly vary-ing write workloads, the framework is able to keep a resource read responsetime below the set threshold. The set of throttleable write consumers is auto-matically maintained and ready to be used by the PID controller monitoringread response time. The framework spawns a PID controller per resource, us-ing per resource sets of throttleable consumers and per resource response timemeasurements.
Throttling only occurs when response time of a resource violates the presetthreshold. When no throttling occurs, there is a negligible worst case overheadof 0.4% for reads and 1.7% for writes caused by the static traffic control filterswhich are always present and ready to detect packet marks.
This project opens several interesting paths for further research and applica-tions. By using the fundamental ideas explored, it is possible to create QoSmodules to be used as an external bridge in front of iSCSI appliances or in-tegrated into Linux based iSCSI appliances similar to the lab environment.
99

CHAPTER 6. DISCUSSION AND CONCLUSION
Previously developed algorithms can be combined with the throttling tech-niques from this paper to create even more efficient and/or general purposeQoS mechanisms for iSCSI or even other IP/Ethernet based storage technolo-gies. Furthermore, the PID control algorithm could be evaluated as a means tocreate stability and predictability in other infrastructure components than justiSCSI devices.
By using the basic building blocks of this project it is possible to create a vastamount of prioritization schemes. The few examples demonstrated serves asa demonstration of the inherent opportunities. With the modular design ofthe different programs it should be trivial to reimplement the framework insimilar set ups with minor adjustments only.
With the small resource consumption footprint of the prototype, and room forfurther improvement of it, this concept should scale to enterprise level produc-tion environments with large amounts of resources and storage consumers.
By utilizing the ideas from this project, system administrators and vendors canoffer QoS for iSCSI storage, thereby making it possible to offer differentiatedSLAs to storage consumers supporting application SLAs with a confidencepreviously very difficult to achieve.
100

Bibliography
[1] G.A. Gibson and R. Van Meter. Network attached storage architecture.Communications of the ACM, 43(11):45, 2000.
[2] M. Karlsson, C. Karamanolis, and X. Zhu. Triage: Performance differen-tiation for storage systems using adaptive control. ACM Transactions onStorage (TOS), 1(4):480, 2005.
[3] Dave Raffo. iscsi san finally proves worthy alternative to fibre channelsan for the mainstream. URL http://searchstorage.techtarget.com/
generic/0,295582,sid5 gci1380504,00.html.
[4] Mark Peters. iscsi adoption continues its upwardpath. URL http://www.markmywordsblog.com/2010/01/18/
iscsi-adoption-continues-its-upward-path/.
[5] W. John. Traveling To Rome: A Retrospective On The Journey. Operatingsystems review, 43(1):10–15, 2009.
[6] Home page of lvm. URL http://sourceware.org/lvm2/.
[7] International committee for information technology standards.
[8] Incits techincal comitee for scsi3. URL http://www.t10.org/scsi-3.
htm.
[9] Y. Lu and D.H.C. Du. Performance study of iSCSI-based storage subsys-tems. IEEE communications magazine, 41(8):76–82, 2003.
[10] Incits techincal comitee for fc. URL http://www.t11.org/index.html.
[11] A. Veitch, E. Riedel, S. Towers, J. Wilkes, et al. Towards global storagemanagement and data placement. In Eighth IEEE Workshop on Hot Topicsin Operating Systems (HotOS-VIII), pages 184–184. Citeseer.
[12] S. Aiken, D. Grunwald, A. Pleszkun, and J. Willeke. A performanceanalysis of the iSCSI protocol. In Proc. 11th NASA Goddard, 20th IEEEConf. Mass Storage Systems and Technologies (MSST 2003). Citeseer, 2003.
101
BIBLIOGRAPHY
[13] A. Joglekar, M.E. Kounavis, and F.L. Berry. A scalable and high perfor-mance software iSCSI implementation.
[14] J. Satran, K. Meth, C. Sapuntzakis, M. Chadalapaka, and E. Zeidner.RFC3720: Internet small computer systems interface (iSCSI). RFC Edi-tor United States, 2004.
[15] Homepage of the iso20000 standard. URL http://www.
standardsdirect.org/bs15000.htm.
[16] L. Qiao, B.R. Iyer, D. Agrawal, and A. El Abbadi. Automated storagemanagement with qos guarantees. In Proceedings of the 22nd InternationalConference on Data Engineering, page 150. IEEE Computer Society, 2006.
[17] A. Popescu and S. Ghanbari. A Study on Performance Isolation Ap-proaches for Consolidated Storage. Technical report, Technical Report,University of Toronto, 2008.
[18] Cisco. Internetworking technologies handbook, fourth edition. Cisco Press,2004.
[19] X. Xiao and L.M. Ni. Internet QoS: A big picture. IEEE network, 13(2):8–18, 1999.
[20] M.A. El-Gendy, A. Bose, and K.G. Shin. Evolution of the Internet QoSand support for soft real-time applications. Proceedings of the IEEE, 91(7):1086–1104, 2003.
[21] P. Iovanna, R. Sabella, M. Settembre, et al. A traffic engineering systemfor multilayer networks based on the GMPLS paradigm. IEEE network,17(2):28–37, 2003.
[22] X.P. Xiao, T. Telkamp, V. Fineberg, C. Chen, and LM Ni. A practical ap-proach for providing QoS in the Internet backbone. IEEE communicationsMagazine, 40(12):56–62, 2002.
[23] A. Ziviani, B.E. Wolfinger, J.F. De Rezende, O.C.M.B. Duarte, andS. Fdida. Joint adoption of QoS schemes for MPEG streams. MultimediaTools and Applications, 26(1):59–80, 2005.
[24] J. Guitart, J. Torres, and E. Ayguade. A survey on performance manage-ment for internet applications. Concurrency and Computation: Practice andExperience, 2009.
[25] S. Blake, D. Black, M. Carlson, E. Davies, Z. Wang, and W. Weiss.RFC2475: An Architecture for Differentiated Service. RFC Editor UnitedStates, 1998.
102

BIBLIOGRAPHY
[26] R. Braden, D. Clark, and S. Shenker. RFC1633: Integrated Services in theInternet Architecture: an Overview. RFC Editor United States, 1994.
[27] K. Nichols, S. Blake, F. Baker, and D. Black. RFC2474: Definition of theDifferentiated Services Field (DS Field) in the IPv4 and IPv6 Headers.RFC Editor United States, 1998.
[28] E.B. Fgee, JD Kenney, WJ Phillips, W. Robertson, and S. Sivakumar.Comparison of qos performance between ipv6 qos management modeland intserv and diffserv qos models. In Communication Networks and Ser-vices Research Conference, 2005. Proceedings of the 3rd Annual, pages 287–292, 2005.
[29] L. Zhang, S. Berson, S. Herzog, S. Jamin, and R. Braden. RFC2205: Re-source ReSerVation Protocol (RSVP)–Version 1 Functional Specification.RFC Editor United States, 1997.
[30] Homepage of the iproute2 project. URL http://linux-net.osdl.org/
index.php/Iproute2.
[31] The linux advanced routing and traffic control home page. URL http:
//lartc.org.
[32] L. Gheorghe. Designing and Implementing Linux Firewalls with QoSusing netfilter, iproute2, NAT and l7-filter, 2006.
[33] B.A. Forouzan and S.C. Fegan. Data communications and networking.McGraw-Hill Science Engineering, 2007 edition, 2003.
[34] Homepage of the linux intermediate queueing device., . URL http://
www.linuximq.net/.
[35] Homepage of the linux intermediate functional block device., .URL http://www.linuxfoundation.org/collaborate/workgroups/
networking/ifb.
[36] Jonathan Corbet. Which i/o controller is the fairest of them all? URLhttp://lwn.net/Articles/332294/.
[37] Vivek Goyal. Block io controller v1. URL http://lwn.net/Articles/
360304/.
[38] A.A. Palekar and R.D. Russell. Design and implementation of a SCSItarget for storage area networks. In Proceedings of the 5th annual LinuxShowcase & Conference, 2001.
103

BIBLIOGRAPHY
[39] P. Ramaswamy. Provisioning task based symmetric QoS in iSCSI SAN.2008.
[40] DV Sarwate. Computation of cyclic redundancy checks via table look-up. 1988.
[41] X. He, M. Zhang, and Q. Yang. STICS: SCSI-to-IP cache for storage areanetworks. Journal of Parallel and Distributed Computing, 64(9):1069–1085,2004.
[42] Home page of the iozone tool. URL http://www.iozone.org.
[43] Home page of the postmark tool. URL http://www.netapp.com.
[44] Home page of the vxbench tool. URL http://www.veritas.com.
[45] Richard Stallmann. Gnu’s not unix. URL http://www.gnu.org/.
[46] Linus Torvalds. The home of the linux kernel. URL http://kernel.org.
[47] Berkeley software distribution variants. URL http://www.bsd.org/.
[48] iscsi enterprise target project homepage. URL http://iscsitarget.
sourceforge.net/.
[49] Generic scsi target subsystem, . URL http://scst.sourceforge.net/.
[50] Linux scsi target framework, . URL http://stgt.sourceforge.net/.
[51] Risingtide Systems. Lio linux iscsi target stack. URL http://
linux-iscsi.org/.
[52] Risingtide systems company website. URL http://www.
risingtidesystems.com.
[53] Neterion company homepage. URL http://www.neterion.com/.
[54] Open iscsi project, . URL http://www.open-iscsi.org/.
[55] The linux-iSCSI initiator project. Homepage. URL http://
linux-iscsi.sourceforge.net/.
[56] Announcement of merger between open-iscsi and linux-iscsi projects, .URL http://kerneltrap.org/node/4992.
[57] Announcemnet of lefthand networks acquistion by hp. URL http://
www.hp.com/hpinfo/newsroom/press/2008/081001a.html.
104

BIBLIOGRAPHY
[58] Annoucement of equallogic acqusition by dell. URL http:
//www.dell.com/content/topics/global.aspx/corp/pressoffice/
en/2008/2008 01 28 rr 000?c=us&l=en.
[59] L. Huang, G. Peng, and T. Chiueh. Multi-dimensional storage virtual-ization. ACM SIGMETRICS Performance Evaluation Review, 32(1):14–24,2004.
[60] Lan Huang. Stonehenge: A high performance virtualized storage clusterwith qos guarantees. Technical report, 2003.
[61] W. Jin, J.S. Chase, and J. Kaur. Interposed proportional sharing for astorage service utility. In Proceedings of the joint international conference onMeasurement and modeling of computer systems, pages 37–48. ACM NewYork, NY, USA, 2004.
[62] G. Peng. Availability, fairness, and performance optimization in storage virtu-alization systems. PhD thesis, Stony Brook University, 2006.
[63] S. Uttamchandani, L. Yin, G.A. Alvarez, J. Palmer, and G. Agha.CHAMELEON: a self-evolving, fully-adaptive resource arbitrator forstorage systems. URL https://www.usenix.org/events/usenix05/
tech/general/full papers/uttamchandani/uttamchandani html/
paper.html.
[64] M. Wachs, M. Abd-El-Malek, E. Thereska, and G.R. Ganger. Argon: per-formance insulation for shared storage servers. In Proceedings of the 5thUSENIX conference on File and Storage Technologies, pages 5–5. USENIXAssociation, 2007.
[65] A. Gulati and I. Ahmad. Towards distributed storage resource manage-ment using flow control. ACM SIGOPS Operating Systems Review, 42(6):10–16, 2008.
[66] Ajay Gulati, Chethan Kumar, and Irfan Ahmad. Modeling workloadsand devices for io load balancing in virtualized environments. SIG-METRICS Perform. Eval. Rev., 37(3):61–66, 2009. ISSN 0163-5999. doi:http://doi.acm.org/10.1145/1710115.1710127.
[67] Ajay Gulati, Irfan Ahmad, and Carl A. Waldspurger. Parda: propor-tional allocation of resources for distributed storage access. In FAST ’09:Proccedings of the 7th conference on File and storage technologies, pages 85–98, Berkeley, CA, USA, 2009. USENIX Association.
105

BIBLIOGRAPHY
[68] J.C. Wu and S.A. Brandt. The design and implementation of AQuA: anadaptive quality of service aware object-based storage device. In Pro-ceedings of the 23rd IEEE/14th NASA Goddard Conference on Mass StorageSystems and Technologies, pages 209–218. Citeseer.
[69] S.A. Weil, S.A. Brandt, E.L. Miller, D.D.E. Long, and C. Maltzahn. Ceph:A scalable, high-performance distributed file system. In Proceedings of the7th Symposium on Operating Systems Design and Implementation (OSDI),2006.
[70] Chao Jin and R. Buyya. An adaptive mechanism for fair sharing of stor-age resources. In Computer Architecture and High Performance Computing,2009. SBAC-PAD ’09. 21st International Symposium on, pages 75 –82, oct.2009. doi: 10.1109/SBAC-PAD.2009.19.
[71] J.C.I. Chuang and M.A. Sirbu. Distributed network storage service withquality-of-service guarantees. Journal of Network and Computer Applica-tions, 23(3):163–185, 2000.
[72] A. Neogi, A. Raniwala, and T. Chiueh. Phoenix: a low-power fault-tolerant real-time network-attached storage device. In Proceedings of theseventh ACM international conference on Multimedia (Part 1), pages 447–456. ACM New York, NY, USA, 1999.
[73] A. Raniwala, S. Sharma, A. Neogi, and C. Tzi-cker. Implementation ofa Fault-Tolerant Real-Time Network-Attached Storage Device. In NASACONFERENCE PUBLICATION, pages 89–104. Citeseer, 2000. URL http:
//www.ecsl.cs.sunysb.edu/phoenix/phoenix impl/phoenix.html.
[74] P. Shenoy and H.M. Vin. Cello: A Disk Scheduling Framework for NextGeneration Operating Systems*. Real-Time Systems, 22(1):9–48, 2002.
[75] C.R. Lumb, A. Merchant, and G.A. Alvarez. Facade: Virtual storagedevices with performance guarantees. In Proceedings of the 2nd USENIXConference on File and Storage Technologies, page 144. USENIX Association,2003.
[76] M. Abd-El-Malek, W.V. Courtright II, C. Cranor, G.R. Ganger, J. Hen-dricks, A.J. Klosterman, M. Mesnier, M. Prasad, B. Salmon, R.R. Samba-sivan, et al. Ursa Minor: versatile cluster-based storage. In Conference onFile and Storage Technologies, pages 59–72, 2005.
[77] A. Lebrecht, N. Dingle, and W. Knottenbelt. A response time distributionmodel for zoned RAID. Analytical and Stochastic Modeling Techniques andApplications, pages 144–157.
106

BIBLIOGRAPHY
[78] A. Traeger, E. Zadok, N. Joukov, and C.P. Wright. A nine year studyof file system and storage benchmarking. ACM Transactions on Storage(TOS), 4(2):5, 2008.
[79] Home page of the iperf utility. URL http://sourceforge.net/
projects/iperf/.
[80] Home page of flexible i/o tool, . URL http://freshmeat.net/
projects/fio/.
[81] Kerneltrap: Interview with jens axboe. URL http://kerneltrap.org/
node/7637.
[82] Experiment breaking the 1 million iops barrier, . URLhttp://www.businesswire.com/news/google/20090406005417/en/
CORRECTING-REPLACING-Fusion-io-Breaks-Storage-Performance-Barriers.
[83] Homepage of hewlett packard. URL http://www.hp.com.
[84] Homepage of the fusion io company. URL http://www.fusionio.com/.
[85] Jens Axboe. Homepage of the blktrace utility. URL http://git.kernel.
org/?p=linux/kernel/git/axboe/blktrace.git;a=blob;f=README.
[86] Homepage of the collectl utility, .
[87] Home page of the collectd tool, . URL http://collectd.org/.
[88] Homepage of the plot program. URL http://plot.micw.eu/.
[89] Alteon os application guide. URL http://www.bladenetwork.net/
userfiles/file/PDFs/IBM GbE L2-3 Applicat Guide.pdf.
[90] Home page of tcpdump tool, . URL http://www.tcpdump.org/.
[91] Home page of tcptrace tool, . URL http://www.tcptrace.org/.
[92] Home page of xpl2gpl tool. URL http://masaka.cs.ohiou.edu/
software/tcptrace/xpl2gpl/.
[93] Home page of argus tool. URL http://www.qosient.com/argus/.
[94] Home page of the udev utility. URL http://www.kernel.org/pub/
linux/utils/kernel/hotplug/udev.html.
[95] Home page of ipset. URL http://ipset.netfilter.org/.
[96] Home page of systemtap tool. URL http://sourceware.org/
systemtap/.
107

BIBLIOGRAPHY
[97] V. Paxson and M. Allman. RFC2988: Computing TCP’s RetransmissionTimer. RFC Editor United States, 2000.
[98] M. Allman, V. Paxson, and W. Stevens. RFC2581: TCP congestion con-trol. Internet RFCs, 1999.
[99] F. Haugen. PID control. Tapir Academic Press, 2004.
[100] F. Haugen. Anvendt reguleringsteknikk. Tapir, 1992.
[101] Wikipedia user:silverstar. URL http://en.wikipedia.org/wiki/User:
SilverStar.
108

Appendix A
I/O Throttlers
Listing A.1: Script for throttling individual IP address� �#!/usr/bin/perl -w
# name: throttle_iscsi_initiator.pl
# This script classify packets for further treatment
# by traffic control. Classification is done using the
mark
# target of iptables.
if ( ! exists($ARGV [1])) {
&usage;
}
my $lasthandle = 20; # Needs to be adapted to number of
tc classes.
my $step;
if ( exists $ARGV [2] ) { $step = $ARGV [2] } else {
$step = 1 };
my $initiator_ip = $ARGV [0];
my $action = $ARGV [1];
my $myip = ’10.0.0.253 ’;
my $rv = 0;
my $rulenum = -1;
my $mark = 0 ;
my $iptables = "/sbin/iptables ";
my $starthandle = 1 ;
my $tc = "/sbin/tc";
109

APPENDIX A. I/O THROTTLERS
my $iscsi_dev = "eth1";
if ( $initiator_ip =~ /^([\d]+) \.([\d]+) \.([\d]+) \.([\d
]+)$/ ) {
if ( $action eq ’slower ’) {
( $rulenum , $mark ) = &get_rule("up");
if ( $rulenum == -1 ) {
if ( $step > $lasthandle ) { $step = $lasthandle
};
$rv = ‘$iptables -A OUTPUT -o $iscsi_dev -s $myip
-d $initiator_ip -j MARK --set -mark $step ‘;
} else {
$rv = ‘$iptables -A OUTPUT -o $iscsi_dev -s $myip
-d $initiator_ip -j MARK --set -mark $mark ‘;
$rv = ‘$iptables -D OUTPUT $rulenum ‘;
}
} elsif ( $action eq ’faster ’) {
( $rulenum , $mark ) = &get_rule("down");
if ( $rulenum != -1 ) {
if ( ($mark + 1 ) == $starthandle ) {
$rv = ‘$iptables -D OUTPUT $rulenum ‘;
} else {
$rv = ‘$iptables -A OUTPUT -o $iscsi_dev -s
$myip -d $initiator_ip -j MARK --set -mark
$mark ‘;
$rv = ‘$iptables -D OUTPUT $rulenum ‘;
}
}
} elsif ( $action eq ’free’) {
( $rulenum , $mark ) = &get_rule("up");
$rv = ‘$iptables -D OUTPUT $rulenum ‘;
} else {
&usage
}
} else {
&usage
}
# ------- Functions ----------
sub usage {
print "Usage: $0 initator_ipaddr faster|slower|free [
step] \n";
110

exit 1;
}
sub get_rule {
# Check if $initator_ip is classified and get its
existing handle.
# Increment or decremnent returned new mark based on
given argument
my $direction = shift;
my $newmark = 0 ;
if ( $direction eq "down" ) {
$step = $step * -1 ;
}
my @ret =[];
foreach (‘$iptables --line -numbers -n -L OUTPUT ‘) {
chomp;
if ( /^\d+.+/) {
my @rule = split(" ",$_);
if ( $rule [4] eq $myip && $rule [5] eq
$initiator_ip ) {
$rulenum = $rule [0] ;
$rule [8] =~ /^0x(.+) \/.+/;
$mark = sprintf(’%d’,hex($1));
if ( $mark + $step < 0 ) {
$newmark = 0;
} elsif ( $mark + $step > $lasthandle ) {
$newmark = $lasthandle ;
} else {
$newmark = $mark + $step;
}
}
}
}
@ret = ($rulenum ,$newmark);
return @ret;
}� �Listing A.2: The PID controller script used in 5.9 and 5.10� �
#!/usr/bin/perl -w
# name: reg.pl
use POSIX;;
111

APPENDIX A. I/O THROTTLERS
use Time::HiRes qw( usleep );
$SIG{INT} = "cleanup";
my $ipt_mark = 0;
my $lastmark = 0;
my $ds = "/proc/diskstats";
my $countermem;
my $lastewma = 0;
my $ewma_alpha = 0.25;
my $setpoint = 10;
my $max_throttle = -40;
my @prev_devs = (0,0,0);
my @prev_uks = (0,0,0);
my $Kp = 0.3;
my $Ti = 500;
my $Td = 1;
my $T = 16;
my $iptables = "/usr/local/sbin/iptables -t mangle";
$|=1;
my $mondev = "dm -0";
STDOUT ->autoflush;
create_sets ();
while ( 1 ) {
open(DISKSTATS ,"<",$ds) or die "open $ds , $!";
while (<DISKSTATS >) {
chomp;
s/\s+/ /g;
my ($major , $minor , $dev , @fields ) = split(’ ’,$_)
;
if ( $dev eq $mondev ) {
my $weitime = counter("dm -0","weitime",$fields
[10]);
my $req = counter("dm -0","r",$fields [0]) +
counter("dm -0","w",$fields [4]);
my $wait;
if ($req > 0 ) { $wait = $weitime / $req } else {
$wait = 0 } ;
my $cur_ewma = $lastewma + $ewma_alpha *($wait -
$lastewma);
unshift(@prev_devs ,$setpoint - $cur_ewma);
112

pid_reg ();
$lastewma = $cur_ewma;
}
}
close(DISKSTATS);
usleep 100000;
}
# functions
sub pid_reg {
my $uk = $prev_uks [0] + $Kp*(1-($T/$Ti)) + $Kp*
$prev_devs [0] + (($Kp*$Td)/$T)*( $prev_devs [0] - 2*
$prev_devs [1] + $prev_devs [2]);
if ( $uk > 0 ) {
$uk = 0;
} elsif ($uk < $max_throttle ) {
$uk = $max_throttle;
}
if ( $uk < 0 ) {
$ipt_mark = -1*ceil($uk);
}
if ( $ipt_mark != $lastmark ) {
throttle("throttlers",$ipt_mark);
if ( $ipt_mark > $lastmark ) {
for (my $bar =1; $bar <= $ipt_mark - $lastmark; $bar
++) {
print "#";
}
} elsif ( $ipt_mark < $lastmark ) {
for (my $bar =1; $bar <= $lastmark - $ipt_mark;
$bar ++) {
print "\x08";
}
}
}
unshift(@prev_uks ,$uk);pop(@prev_uks);
pop(@prev_devs);
$lastmark = $ipt_mark;
}
sub counter {
my $obj = shift;
113

APPENDIX A. I/O THROTTLERS
my $field = shift;
my $current_value = shift;
my $cm;
my $ret = 0 ;
if (exists($countermem ->{$obj}->{$field })) {
$cm = $countermem ->{$obj}->{$field };
if ( $cm > $current_value ) {
$ret = ( 4294967296 - $cm) + $current_value;
} else {
$ret = $current_value - $cm;
}
}
$countermem ->{$obj}->{$field} = $current_value;
return $ret;
}
sub create_sets {
‘ipset -N throttlers ipmap --network 10.0.0.0/24 ‘;
‘ipset -A throttlers 10.0.0.243 ‘;
‘ipset -A throttlers 10.0.0.244 ‘;
‘ipset -A throttlers 10.0.0.245 ‘;
}
sub cleanup {
‘iptables -F -t mangle ‘;
‘ipset -X throttlers ‘;
die "Ouch !\n";
}
sub throttle {
my $set_name = shift;
my $tv = shift;
my $myip = ’10.0.0.253 ’;
my $mark = 0 ;
my $iscsi_dev = "eth1";
my @ipsets;
foreach (‘ipset -L ‘) {
chomp;
if ( /^Name .*/) {
my @l = split;
push(@ipsets ,$l[1]);
}
114
}
if ( grep /^ $set_name$/,@ipsets ) {
unless ( $tv == 0 ) {
‘$iptables -A OUTPUT -o $iscsi_dev -s $myip -m set
--match -set $set_name dst -j MARK --set -mark
$tv ‘;
}
delete_other($set_name ,$tv ,$myip);
}
}
sub delete_other {
my $set_name = shift;
my $tv = shift;
my $myip = shift;
foreach (‘$iptables --line -numbers -n -L OUTPUT ‘) {
print if $debug;
chomp;
if ( /^\d+.+/) {
my @rule = split(" ",$_);
print join(",",@rule)."\n" if $debug;
$rule [11] =~ /^0x(.+)/;
$mark = sprintf(’%d’,hex($1));
if ( $rule [4] eq $myip && $rule [7] eq $set_name
&& $mark != $tv ) {
‘$iptables -D OUTPUT $rule[0]‘ ;
}
}
}
}� �Listing A.3: The PID controller script used in FIXME� �
#!/usr/bin/perl -w
use Config;
$Config{useithreads} or die(’Recompile Perl with
threads to run this program.’);
use IPC:: Shareable;
use Data:: Dumper;
use POSIX;;
use Time::HiRes qw( usleep );
115

APPENDIX A. I/O THROTTLERS
use threads;
$SIG{INT} = "cleanup";
my @prev_devs = (0,0,0);
my @prev_uks = (0,0,0);
my $ewmas;
tie $ewmas , ’IPC:: Shareable ’, ’AVEWMAS ’, {create => 0,
destroy => 0};
my $Kp = 0.3;
my $Ti = 500;
my $Td = 1;
my $T = 16;
my $max_throttle = -40;
my $lat_thresh = 10;
my $iptables = "/usr/local/sbin/iptables -t mangle";
my $controller_mem;
my $threads;
foreach my $resource (keys %{ $ewmas }) {
print "Creating PID controller for $resource \n";
$controller_mem ->{$resource}->{’prev_uk ’} = 0;
$controller_mem ->{$resource}->{’lastmark ’} = 0;
@{$controller_mem ->{$resource}->{’prev_devs ’}} =
(0,0,0);
$threads ->{$resource} = threads ->create (\& pid_reg ,
$resource ,$lat_thresh);
$threads ->{$resource}->detach ();
}
while (1) {
sleep 10;
}
# Functions
sub pid_reg {
my $resource = shift;
my $thresh = shift;
my $ipt_mark = 0;
while (1) {
unshift(@{$controller_mem ->{$resource}->{’prev_devs
116

’}},$thresh - $ewmas ->{$resource });
my $prev_uk = $controller_mem ->{$resource}->{’
prev_uk ’};
my @prev_devs = @{$controller_mem ->{$resource}->{’
prev_devs ’}};
#print "$prev_uk" .join("-", @prev_devs)."\n";
#print Dumper($controller_mem);
#print "$prev_uk -- $Kp -- $T -- $Ti -- $prev_devs [0]
-- $Td -- $prev_devs [1] -- $prev_devs [2] \n";
my $uk = $prev_uk + $Kp*(1-($T/$Ti)) + $Kp*
$prev_devs [0] + (($Kp*$Td)/$T)*( $prev_devs [0] -
2* $prev_devs [1] + $prev_devs [2]);
#print "$uk -- $prev_uk -- $Kp -- $T -- $Ti --
$prev_devs [0] -- $Td -- $prev_devs [1] --
$prev_devs [2] \n";
if ( $uk > 0 ) {
$uk = 0;
} elsif ($uk < $max_throttle ) {
$uk = $max_throttle;
}
if ( $uk < 0 ) {
$ipt_mark = -1*ceil($uk);
}
if ( $ipt_mark != $controller_mem ->{$resource}->{’
lastmark ’} ) {
throttle($resource ,$ipt_mark);
}
$controller_mem ->{$resource}->{’prev_uk ’} = $uk;
pop(@{$controller_mem ->{$resource}->{’prev_devs ’}})
;
$controller_mem ->{$resource}->{’lastmark ’} =
$ipt_mark;
usleep 200000;
}
}
sub throttle {
my $set_name = shift;
my $tv = shift;
my $myip = ’10.0.0.253 ’;
my $mark = 0 ;
my $iscsi_dev = "eth1";
my @ipsets;
117
APPENDIX A. I/O THROTTLERS
foreach (‘ipset -L ‘) {
chomp;
if ( /^Name .*/) {
my @l = split;
push(@ipsets ,$l[1]);
}
}
if ( grep /^ $set_name$/,@ipsets ) {
unless ( $tv == 0 ) {
‘$iptables -A OUTPUT -o $iscsi_dev -p tcp --tcp -
flags ACK ACK -s $myip -m set --match -set
$set_name dst -j MARK --set -mark $tv ‘;
}
delete_other($set_name ,$tv ,$myip);
}
}
sub delete_other {
my $set_name = shift;
my $tv = shift;
my $myip = shift;
foreach (‘$iptables --line -numbers -n -L OUTPUT ‘) {
print if $debug;
chomp;
if ( /^\d+.+/) {
my @rule = split(" ",$_);
print join(",",@rule)."\n" if $debug;
$rule [13] =~ /^0x(.+)/;
$mark = sprintf(’%d’,hex($1));
if ( $rule [4] eq $myip && $rule [9] eq $set_name
&& $mark != $tv ) {
my $ret = ‘$iptables -D OUTPUT $rule[0]‘ ;
}
}
}
}
sub cleanup {
‘iptables -F -t mangle ‘;
die "Ouch !\n";
118

}� �Listing A.4: Shaping script for bandwidth Used in figure� �
#!/bin/bash
# name bw-shaping.sh
# script for doing timed throttling of
# individual iscsi initiators.
stm=‘date +%s‘
scriptdir="/root/scripts"
resultdir="/root/results"
iscsi_dev="eth1"
firsthandle =10
lasthandle =19
sleep_period="10"
b2 =10.0.0.242
b3 =10.0.0.243
b4 =10.0.0.244
b5 =10.0.0.245
# Go to a starting point where throttling has an effect
.
for i in $b2 $b3 $b4
do
${scriptdir }/ throttle_iscsi_initiator.pl $i slower 10
done
for i in ‘seq 11 23‘
do
${scriptdir }/ throttle_iscsi_initiator.pl $b2 slower
sleep 3
done
for i in ‘seq 11 23‘
do
${scriptdir }/ throttle_iscsi_initiator.pl $b3 slower
sleep 3
done
for i in ‘seq 11 23‘
119

APPENDIX A. I/O THROTTLERS
do
${scriptdir }/ throttle_iscsi_initiator.pl $b4 slower
sleep 3
done
sleep 12
${scriptdir }/ throttle_iscsi_initiator.pl $b2 free
sleep 15
${scriptdir }/ throttle_iscsi_initiator.pl $b3 free
sleep 15
${scriptdir }/ throttle_iscsi_initiator.pl $b4 free� �Listing A.5: Shaping script for packet delay (Used in figures 5.3 and 5.4)� �
#!/bin/bash
stm=‘date +%s‘
scriptdir="/root/scripts"
resultdir="/root/results"
iscsi_dev="eth1"
firsthandle =10
lasthandle =19
sleep_period="10"
> ${resultdir }/ runlog
b2 =10.0.0.242
b3 =10.0.0.243
b4 =10.0.0.244
b5 =10.0.0.245
sleep 10
for i in ‘seq 1 30‘
do
${scriptdir }/ throttle_iscsi_initiator.pl $b2 slower
sleep 2
done
sleep 5
for i in ‘seq 1 30‘
do
${scriptdir }/ throttle_iscsi_initiator.pl $b3 slower
sleep 2
done
sleep 5
120

for i in ‘seq 1 30‘
do
${scriptdir }/ throttle_iscsi_initiator.pl $b4 slower
sleep 2
done
sleep 12
${scriptdir }/ throttle_iscsi_initiator.pl $b2 free
sleep 15
${scriptdir }/ throttle_iscsi_initiator.pl $b3 free
sleep 15
${scriptdir }/ throttle_iscsi_initiator.pl $b4 free� �
121

APPENDIX A. I/O THROTTLERS
122

Appendix B
Interface queueing setup
Listing B.1: Scripts which creates egress bandwidth queues (Creates figure 3.3)� �#!/bin/bash
# name: class_chop_nic_bw.sh
# This script attach a number of bandwidth queues to
the iscsi
# interface. Traffic is classified by marks assigned by
# iptables mark target
tc="/sbin/tc"
iscsi_nic="eth1"
case $1 in
"start")
typeset -i class=2
${tc} qdisc add dev ${iscsi_nic} root handle 1: htb
default 1
${tc} class add dev ${iscsi_nic} parent 1:0 classid
1:1 htb rate 1gbit burst 1mbit ceil 1gbit cburst 1
mbit
for limit in ‘seq 50 50 950| sort -n -r‘
do
${tc} class add dev ${iscsi_nic} parent 1:1 classid 1:
${class} htb rate ${limit}mbit
class=${class }+1
done
123

APPENDIX B. INTERFACE QUEUEING SETUP
for limit in ‘seq 5 10 45| sort -n -r‘
do
${tc} class add dev ${iscsi_nic} parent 1:1 classid 1:
${class} htb rate ${limit}mbit
class=${class }+1
done
for filter in ‘seq 1 $((${class}-2))‘
do
${tc} filter add dev ${iscsi_nic} protocol ip parent
1: prio 1 handle ${filter} fw classid 1:$((${filter
}+1))
done
;;
"stop")
${tc} qdisc del dev ${iscsi_nic} root
;;
"show" )
echo "----- Show qdisc of ${iscsi_nic} -----"
${tc} qdisc show dev ${iscsi_nic}
echo "----- Show classes of ${iscsi_nic} -----"
${tc} class show dev ${iscsi_nic}
echo "----- Show filters of ${iscsi_nic} -----"
${tc} filter show dev ${iscsi_nic}
;;
* )
echo "Usage $0 start|stop|show"
;;
esac� �Listing B.2: Scripts which creates egress packet delay queues (Creates figure3.2.7� �#!/bin/bash
# name: class_chop_nic_delay.sh
# This script attach a number of delay queues to the
iscsi
# interface. Traffic is classified by marks assigned by
# iptables mark target
124

tc="/sbin/tc"
iscsi_nic="eth1"
case $1 in
"start")
typeset -i class=1
${tc} qdisc add dev ${iscsi_nic} root handle 1: htb
default 1
class=${class }+1
for delay in ‘seq 0.1 0.5 10‘
do
tc class add dev ${iscsi_nic} parent 1:0 classid 1:${
class} htb rate 1Gbps
tc qdisc add dev eth1 parent 1:${class} handle 1${
class}: netem delay ${delay}ms
class=${class }+1
done
for filter in ‘seq 1 $((${class}-2))‘
do
${tc} filter add dev ${iscsi_nic} protocol ip parent
1: prio 1 handle ${filter} fw classid 1:$((${filter
}+1))
done
;;
"stop")
${tc} qdisc del dev ${iscsi_nic} root
;;
"show" )
echo "----- Show qdisc of ${iscsi_nic} -----"
${tc} qdisc show dev ${iscsi_nic}
echo "----- Show classes of ${iscsi_nic} -----"
${tc} class show dev ${iscsi_nic}
echo "----- Show filters of ${iscsi_nic} -----"
${tc} filter show dev ${iscsi_nic}
;;
* )
echo "Usage $0 start|stop|show"
;;
esac
125

APPENDIX B. INTERFACE QUEUEING SETUP
� �
126

Appendix C
Other scripts
Listing C.1: Script for finding stable relation between delay and throughput (Itproduces data for figures 5.5 and 5.5 )� �#!/bin/bash
jobdefs="/root/scripts/jobdefs/"
job=‘basename $0 .sh‘
delay=0
function loop {
for i in ‘seq 1 20‘
do
echo "‘date +%H:%M:%S‘ ${delay} ‘/usr/bin/time -f
%e /usr/local/bin/fio --minimal --output /dev
/null ${jobdefs}${job}_$(hostname) 2>&1‘ "
done
}
loop
sleep 2
for delay in ‘seq 0.1 0.5 10‘
do
ssh -p 5432 bm ’/root/scripts/throttle_iscsi_initiator.
pl 10.0.0.242 slower ’
loop
sleep 2
done� �127

APPENDIX C. OTHER SCRIPTS
Listing C.2: Script used for dynamically maintaining sets of throttle-able IPaddresses� �#!/usr/bin/perl -w
use Set:: Scalar;
use Time::HiRes qw(time sleep);
use Data:: Dumper;
use IPC:: Shareable;
$SIG{’INT’} = ’inthandler ’;
$SIG{’TERM’} = ’inthandler ’;
my $countermem;
my $ewmas;
my @ipsets = ();
my $write_thresh = 1000;
my %fm = ( r => 0,
rrqm => 1,
rsec => 2,
rtime => 3,
w => 4,
wsec => 6,
wtime => 7,
inflight => 8,
time => 9,
weitime => 10,
);
my $iscsi_sessions;
tie $iscsi_sessions , ’IPC:: Shareable ’, ’ISCSIMAP ’, {
create => 1, mode => 664, destroy => 1};
$iscsi_sessions = get_iscsi_session_map ();
while (1) {
update_metrics ();
foreach my $s (@ipsets) {
my $target_population = populate_target_set($s);
converge_ipset($s,$target_population)
}
sleep 1;
}
128

# Functions
sub populate_target_set {
$setname = shift;
my @ips = ();
foreach my $dm ( keys %{ $ewmas} ) {
if ( $iscsi_sessions ->{$dm}->{’vg’} eq $setname ) {
if ( $ewmas ->{$dm}->{’wsec’} > $write_thresh ) {
push(@ips , $iscsi_sessions ->{$dm}->{’ip’}); # Add
the ip of this abuser
}
}
}
my $ret;
if ( $#ips >= 0 ) {
$ret = new Set:: Scalar(@ips);
} else {
$ret = new Set::Scalar ->null;
}
return $ret;
}
sub converge_ipset {
my $setname = shift;
my $target = shift;
my @ips = ();
foreach (‘ipset -L $setname ‘) {
chomp;
if ( /^(\d{1 ,3}\.\d{1 ,3}\.\d{1 ,3}\.\d{1,3})$/) {;
push(@ips ,$1);
}
}
my $ipset;
if ($#ips >= 0 ) {
$ipset = new Set:: Scalar(@ips);
} else {
$ipset = new Set::Scalar ->null;
}
my $remove = $ipset - $target ;
my $add = $target - $ipset ;
unless ($remove ->is_null) {
for my $i ($remove ->members) {
‘ipset -D $setname $i ‘;
129

APPENDIX C. OTHER SCRIPTS
}
}
unless ($add ->is_null) {
for my $i ($add ->members) {
‘ipset -A $setname $i ‘;
}
}
}
sub get_iscsi_session_map {
my $lvs;
my $raw;
my $active_dms;
my %iet_sessions;
my $stats;
my $vgs;
my $lvs_cmd = ’/sbin/lvs -v’;
if ( -f "/etc/redhat -release" ) { $lvs_cmd = "/usr/
sbin/lvs -v";}
foreach (‘$lvs_cmd 2> /dev/null ‘) {
next if /.+ UUID .+/ ;
s/\s+/ /g;
chomp;
my @l = split;
# Map dm vg-lv to dm-nn
$lvs ->{$l[1]}->{$l[0]}->{’dm’} = ’dm-’.$l[8];
}
# Map tids to volumes
$raw = ‘cat /proc/net/iet/volume ‘;
my %iet_volumes = $raw =~ /tid:(\d{1,3})\sname :.+?\n
.+? path :(.+?)\n/smg;
# Map tids to sessions
# Only populate tids with an initator attached
my @tids;
foreach my $l (‘cat /proc/net/iet/session ‘) {
if ($l =~ /^tid:(\d{1,3})\sname .+/) {
push(@tids ,$1);
} elsif ( $l =~ /^\s+cid:.+ip:(.+)\sstate .+/) {
# Only populate if it seems like an lv-name
$iet_sessions{$tids [$# tids]} = $1;
shift(@tids);
}
130

}
# Know various info about dm- devices that is involved
in
# active iscsi sessions
foreach my $tid (keys %iet_sessions) {
if ( $iet_volumes{$tid} && $iet_volumes{$tid} =~
/^\/.+?\/.+?\/.+$/ ) {
my @a = split(’/’,$iet_volumes{$tid});
my $vg = $a[2];
my $lv = $a[3];
my $dm = $lvs ->{$vg}->{$lv}->{’dm’};
my $stat = $lvs ->{$vg}->{$lv}->{’stat’};
my $ip = $iet_sessions{$tid};
$active_dms ->{$dm}->{’vg’} = $vg;
$active_dms ->{$dm}->{’lv’} = $lv;
# $active_dms ->{$dm}->{’statfile ’} = $stat;
$active_dms ->{$dm}->{’ip’} = $ip;
push (@{$vgs ->{$vg}},$dm);
}
}
foreach my $vg (keys %{$vgs}) {
‘ipset -N $vg ipmap --network 10.0.0.0/24 ‘;
push(@ipsets ,$vg);
}
return $active_dms;
}
sub counter {
my $obj = shift;
my $field = shift;
my $current_value = shift;
my $cm;
my $ret = "nan" ;
if (exists($countermem ->{$obj}->{$field })) {
$cm = $countermem ->{$obj}->{$field };
if ( $cm > $current_value ) {
$ret = ( 4294967296 - $cm) + $current_value;
} else {
$ret = $current_value - $cm;
}
}
131

APPENDIX C. OTHER SCRIPTS
$countermem ->{$obj}->{$field} = $current_value;
return $ret;
}
sub update_metrics {
my $active_dms = shift;
my $interval = shift;
my $alpha = 0.25;
my $ds = "/proc/diskstats";
# Snapshot disstats with a minimum of time usage
open(DISKSTATS ,"<",$ds) or die "open $ds , $!";
my $time = time;
while (<DISKSTATS >) {
chomp;
s/\s+/ /g;
my ($major , $minor , $dev , @fields ) = split(’ ’,$_)
;
if ( $dev =~ /dm -\d+/) {
my $cur_rate = counter($dev ,’wsec’,$fields[$fm{’
wsec’}]); #Sector ->Kb
if ( $cur_rate eq "nan" ) {
$ewmas ->{$dev}->{’wsec’} = 0;
} else {
$ewmas ->{$dev}->{’wsec’} = $ewmas ->{$dev}->{’
wsec’} + $alpha *( $cur_rate - $ewmas ->{$dev
}->{’wsec’});
}
#print "$dev -> $cur_rate $ewmas ->{$dev}->{’wsec
’} \n";
}
}
close(DISKSTATS);
#print "----------\n";
}
sub inthandler {
(tied $iscsi_sessions)->remove;
‘ipset -X‘;
exit;
}� �Listing C.3: Script used for dynamically maintaining a resource saturation in-
132

dicator in shared memory. The information is used as input to A.3� �#!/usr/bin/perl -w
use IPC:: Shareable;
use Time::HiRes qw(time usleep);
use Data:: Dumper;
#use Statistics :: Descriptive;
$SIG{’INT’} = ’inthandler ’;
$SIG{’TERM’} = ’inthandler ’;
my $alpha = 0.25;
my $iscsi_sessions;
tie $iscsi_sessions , ’IPC:: Shareable ’, ’ISCSIMAP ’, {
create => 0, destroy => 0};
my $avwait_ewmas ;
tie $avwait_ewmas , ’IPC:: Shareable ’, ’AVEWMAS ’, {create
=> 1, mode => 664, destroy => 1};
my $resource_map = map_resource_consumers ();
while (1) {
my $cur_wait = grab_current_avwait ();
foreach my $resource (keys %{ $resource_map }) {
my $touched = 0;
foreach my $dm (@{$resource_map ->{$resource }} ) {
if ($cur_wait ->{$dm} ne "nan" ) {
my $w = $cur_wait ->{$dm} ;
my $e = $avwait_ewmas ->{$resource };
my $n = $e + $alpha *($w - $e);
$avwait_ewmas ->{$resource} = $n;
$touched = 1
}
}
if ( $touched == 0 ) {
my $e = $avwait_ewmas ->{$resource };
$avwait_ewmas ->{$resource} = $e - $alpha * $e;
# Drop ewma when no activity
}
usleep 100000;
}
}
133
APPENDIX C. OTHER SCRIPTS
# Functions
sub map_resource_consumers {
my $map;
foreach my $dm (keys %{ $iscsi_sessions }) {
push(@{$map ->{$iscsi_sessions ->{$dm}->{’vg’}}},$dm)
;
}
return $map;
}
sub grab_current_avwait {
my $ds = "/proc/diskstats";
open(DISKSTATS ,"<",$ds) or die "open $ds , $!";
while (<DISKSTATS >) {
chomp;
s/\s+/ /g;
my ($major , $minor , $dev , @fields ) = split(’ ’,$_)
;
if ( $dev =~ /^dm -.+/ ) {
my $weitime = counter($dev ,"weitime",$fields [10])
;
my $req = counter($dev ,"r",$fields [0]) ;#+
counter($dev ,"w",$fields [4]);
my $wait;
if ($req > 0 ) { $wait = $weitime / $req } else {
$wait = "nan" } ;
$cur_wait ->{$dev} = $wait;
}
}
close(DISKSTATS);
return $cur_wait;
}
sub inthandler {
(tied $avwait_ewmas)->remove;
exit;
}
sub counter {
my $obj = shift;
134

my $field = shift;
my $current_value = shift;
my $cm;
my $ret = "nan" ;
if (exists($countermem ->{$obj}->{$field })) {
$cm = $countermem ->{$obj}->{$field };
if ( $cm > $current_value ) {
$ret = ( 4294967296 - $cm) + $current_value;
} else {
$ret = $current_value - $cm;
}
}
$countermem ->{$obj}->{$field} = $current_value;
return $ret;
}� �Listing C.4: Script for collecting test results� �
#!/usr/bin/perl -w
# name: get_results.pl
my @hosts = ( "b1","bm","b2","b3","b4","b5" );
my $rresultdir = "/root/results";
if ( ! exists($ARGV [0])) {
print "Usage: $0 job -script\n";
exit 1;
}
my $job = $ARGV [0];
my $jobdir = "/Users/jarleb/Documents/masterprog/thesis
/results/$job";
if ( -d $jobdir ) {
‘rm -rf $jobdir ‘ ;
}
‘mkdir -p $jobdir ‘;
foreach my $host (@hosts) {
print "--- Fetching from $host ---- \n";
‘mkdir "$jobdir/$host"‘;
‘scp -r "$host:$rresultdir/$job/*" "$jobdir/$host/"‘;
}� �135

APPENDIX C. OTHER SCRIPTS
Listing C.5: Script for distributing scripts and job definitions� �#!/usr/bin/perl -w
# name: dist.pl
my @dist_hosts = ( "b1","b2","b3","b4","b5","bm" );
my $scriptdir = "/root/scripts";
foreach my $host (@dist_hosts) {
print "--- Dist to $host ---- \n";
‘ssh $host mkdir -p $scriptdir ‘;
‘rsync --delete -avz -e ssh * "$host:$scriptdir"‘;
‘ssh $host chmod +x $scriptdir /*‘;
}� �Listing C.6: Script for scheduling jobs� �
#!/usr/bin/perl -w
# name: schedule.pl
‘./dist.pl ‘;
my @hosts = ( "b2","b3","b4","b5" );
my $scriptdir = "/root/scripts/";
if ( ! exists($ARGV [1]) ) {
print "Usage: $0 time[hh:mm] script\n";
exit 1;
}
my $tm = $ARGV [0];
my $script = $ARGV [1];
$script =~/^(.+) \.sh/;
my $job=$1;
my $resultdir = "/root/results/$job";
my $runlog = "$resultdir/runlog";
print "Scheduling monitoring on b1 tcpdump\n";
‘echo "$scriptdir/b1-mon.sh $job >/dev/null 2>&1" |ssh
b1 ’cat |at $tm ’‘;
foreach my $host (@hosts) {
print "--- Scheduling on $host ---- \n";
‘echo "$scriptdir/$script "|ssh $host ’cat |at $tm’‘;
136

}
print "Scheduling monitoring on bm \n";
‘echo "$scriptdir/bm-mon.sh $job " |ssh bm ’cat |at $tm
’‘;
print "scheduling shaping on bm\n" ;
‘echo "$scriptdir/shaping.sh > /var/tmp/shaping_log
2>&1" |ssh bm ’cat |at $tm’‘;� �Listing C.7: Script for binding iSCSI initiators� �
#!/usr/bin/perl -w
# name iscsi_bind.pl
if ( ! exists($ARGV [0])) {
print "Usage: $0 start|stop\n";
exit 1;
}
my @initiator_hosts = ( "b2","b3","b4","b5" );
my $cmd = $ARGV [0];
my $bind_script = "/root/scripts/blade_iscsi_bind.sh";
my $target_script = "/root/scripts/iscsi -target.sh";
if ($cmd eq ’start’ ) {
#⌖
#sleep 5;
&initators;
exit 0;
}
if ($cmd eq ’stop’ ) {
&initators;
#⌖
exit 0;
}
sub initators {
foreach my $host (@initiator_hosts) {
print "--- Running $cmd on $host ---- \n";
‘ssh $host ’iscsiadm --mode discovery --type
sendtargets --portal bm’‘;
137

APPENDIX C. OTHER SCRIPTS
‘ssh $host $bind_script $cmd ‘;
}
}
sub target {
‘ssh bm $target_script $cmd ‘;
}� �Listing C.8: Script for picking out the relevant data from collectd files� �
#!/usr/bin/perl -w
# tc_extract.pl
use File::Find;
use POSIX;
my @files = () ;
my %items;
my $start ;
my $end;
my @searchdirs = ( "/var/lib/collectd/csv/blademon.vlab
.iu.hio.no/netlink -eth1/" );
my $date=‘date +%Y-%m-%d‘;
chomp($date);
if ( $ARGV [0] eq "showfiles" ) {
find (\&wanted , @searchdirs);
foreach (keys %items) {print "$_\t-> $items{$_}\n";}
exit 0;
}
if ( ! $ARGV [2] ) {
usage();
exit 1;
} elsif ( $ARGV [0] eq "showfiles" ) {
find (\&wanted , @searchdirs);
foreach (keys %items) {print "$_\t-> $items{$_}\n";}
exit 0;
}
if ( $ARGV [0] =~ m/\d{1 ,2}:\d{1 ,2}:\d{1,2}/ && $ARGV
[1] =~ m/\d+/ ) {
my $job = $ARGV [2];
138

my $runlength = $ARGV [1];
my $outdir = "/root/results/$job/tc-vectors";
‘mkdir -p $outdir ‘;
‘rm $outdir /*‘;
$start = ‘date +%s --date $ARGV [0]‘; chomp($start);
#$end = ‘date +%s --date $ARGV [0]‘; chomp($end);
$end = $start + $runlength;
find (\&wanted , @searchdirs);
print localtime($start)." -> ".localtime( $end)." \n";
foreach my $item ( keys %items ) {
print "Generating $item \n";
open F, "$items{$item}" or die "Cannot open $items{
$item} for read: $!";
open O, ">$outdir/$item" or die "Cannot open $outdir
/$item for write :$!";
my $lastval = 0;
my $cval = 0;
while (<F>) {
chomp;
next if ( ! /^\d/ );
my @l = split(",",$_);
if ( $l[0] >= $start && $l[0] <= $end ) {
$cval = $l[1];
$val = $cval - $lastval;
if ( $val != $cval || $cval == 0 ) {
my $plot_time = $l[0] - 978307200;
print O "$plot_time ,$val\n";
}
$lastval = $cval;
}
}
close O;
close F;
}
} else { usage(); }
sub usage {
print "Usage: $0 showfiles| HH:MM:SS runlength(s)
jobname\n";
}
sub wanted {
139

APPENDIX C. OTHER SCRIPTS
if ($File::Find::name =~ /.*\/( ipt_ .+ -.+:.+)-$date/) {
$items{$1} = $File::Find::name;
}
}� �Listing C.9: Script for picking out iostat columns based on header names� �
#!/usr/bin/perl
# name: fix_iostat.pl
my $f = $ARGV [0];
open F, "$f" or die "Cannot open $f for read: $!";
my $header = readline (*F);
my @metrics = split(" ",$header);
shift(@metrics);
my $c = 0;
my %metrics;
my @pmetrics;
foreach (@metrics) {
$metrics{$_} = $c;
$c++;
}
if ( ! exists($ARGV [1]) ) {
print "Usage: $0 blktrace_iostat_file metric .\n";
print "Available metrics :\n";
foreach my $metric (keys %metrics) {
print "$metric \n";
#print "$metric ($metrics{$metric })\n";
}
close F;
exit 1;
}
$pmetrics [0] = ’Stamp ’;
push(@pmetrics ,$ARGV [1]);
while (<F>) {
if ( /^\(.*/ && ! /.* TOTAL .*/ ) {
chomp;
s/\(.+\) //;
140

my @line = split(" ",$_);
foreach my $pm (@pmetrics) {
print "$line[$metrics{$pm}] ";
}
print "\n";
}
}
close F;� �Listing C.10: Script for binding iSCSI locally on blade server� �
#!/bin/bash
# name: blade_iscsi_bind.sh
case $1 in
"start")
iscsiadm --mode node --targetname iqn.iscsilab:perc_
‘hostname ‘ bm:3260 --login
iscsiadm --mode node --targetname iqn.iscsilab:aic_ ‘
hostname ‘ bm:3260 --login
;;
"stop")
iscsiadm --mode node --targetname iqn.iscsilab:perc_
‘hostname ‘ bm:3260 --logout
iscsiadm --mode node --targetname iqn.iscsilab:aic_ ‘
hostname ‘ bm:3260 --logout
;;
*)
echo "Usage $0 start|stop"
;;
esac� �Listing C.11: Script for generating separate files for Plot� �
#!/bin/bash
# name: generate_plotdata.sh
metrics =( wkB/s rkB/s r/s w/s await svctm %util avgrq -
sz wrqm/s rrqm/s wsec/s avgqu -sz rsec/s )
resultdir="/Users/jarleb/Documents/masterprog/thesis/
results/";
iostatfile="blkt_iostat";
plotdatadir="/Users/jarleb/Documents/masterprog/thesis/
plotdata";
141

APPENDIX C. OTHER SCRIPTS
mkdir -p ${plotdatadir}
for jobdir in ‘ls ${resultdir}‘
do
if [[ -d ${plotdatadir }/${jobdir} ]]
then
rm -rf ${plotdatadir }/${jobdir}
fi
mkdir -p ${plotdatadir }/${jobdir}
for bladedir in ‘ls "${resultdir }/${jobdir}"‘
do
if [[ -f ${resultdir }/${jobdir }/${bladedir }/${
iostatfile} ]]
then
if [[ -d ${plotdatadir }/${jobdir }/${bladedir} ]]
then
rm -rf ${plotdatadir }/${jobdir }/${bladedir}
fi
mkdir -p ${plotdatadir }/${jobdir }/${bladedir}
for metric in ${metrics [*]}
do
outmetric=‘echo $metric|sed ’s|/| _pr_|g’‘
‘pwd ‘/ fix_iostat.pl ${resultdir }/${jobdir }/${
bladedir }/${iostatfile} ${metric} > ${
plotdatadir }/${jobdir }/${bladedir }/${outmetric}
done
fi
done
done
echo "remember dstat and tc data in results dir"� �Listing C.12: Post processing script for target server� �
#!/bin/bash
# name: postproc.sh
if [[ -z $1 ]]
then
echo "Usage: $0 jobname"
exit 1
fi
142

exec &> /root/results/$1/pp-log
echo "-----‘date ‘-----"
echo "Killing dstat and collectl"
pkill -f "dstat --noheaders"
pkill collectl
echo "Copying script versions for this run"
cp -r /root/scripts /root/results/$1
/root/scripts/tc-graph.pl > /root/results/$1/tc-graph.
dot
jobstart=$(grep ’Monitoring started ’ /root/results/job2
/runlog |awk ’{print $6}’)
jobstart_epoch=‘date -d ${jobstart} +%s‘
period=$((‘date +%s‘-${jobstart_epoch }))
/root/scripts/tc_extract.pl ${jobstart} ${period} $1
sync
sleep 3
cat /root/results/$1/runlog /root/results/$1/pp-log|/
root/scripts/sendmail.pl $1� �Listing C.13: Monitor script for target server� �
#!/bin/bash
# bm-mon.sh
if [[ -z $1 ]]
then
echo "Usage: $0 jobname"
exit 1
fi
rm /var/lib/collectd/csv/blademon.vlab.iu.hio.no/
netlink -eth1/*
/etc/init.d/collectd restart
dir="/root/results/$1"
if [[ -d $dir ]]
then
rm -rf $dir
fi
mkdir -p ${dir}
143

APPENDIX C. OTHER SCRIPTS
exec &> ${dir}/ runlog
echo "Monitoring started ‘date ‘------"
echo "starting collectl "
collectl -s nNdDtTcCmyjJ -f$dir &
echo "Starting dstat with output to $dir/dstat.csv"
dstat --noheaders -tdnmc -D total ,dm -0,dm -1,dm -2,dm -3,
sdb ,sdc ,sdd ,sde ,sdf ,sdg ,sdh ,sdj ,sdi ,sdk -N eth1 --
sys -s -T --output ${dir}/dstat.csv > /dev/null 2>&1
&� �Listing C.14: Monitor script to b1 (argus)� �
#!/bin/bash
# name: b1-mon.sh
results="/root/results/"
job=$1
tcpdump_file="${results }/${job}/argus.bin"
if [[ -d ${results }/${job} ]]
then
rm -rf ${results }/${job}
fi
mkdir -p "${results }/${job}"
exec &> /root/results/${job}/ runlog
argus -S 1 -i eth1 -w ${tcpdump_file}� �Listing C.15: Job template script� �
#!/bin/bash
starttime=‘date ‘
#date=‘/bin/date +%Y%m%d-%H%M-%S‘;
jobdefs="/root/scripts/jobdefs/"
job=‘basename $0 .sh‘
results="/root/results/"
blktrace_prefix="iscsi_0.trace"
blkparse_binfile="iscsi_0.bin"
blktrace_devices="/dev/iscsi_0"
blktrace_iostat_file="blkt_iostat"
blktrace_q2c_lat_prefix="blkt_q2c"
144
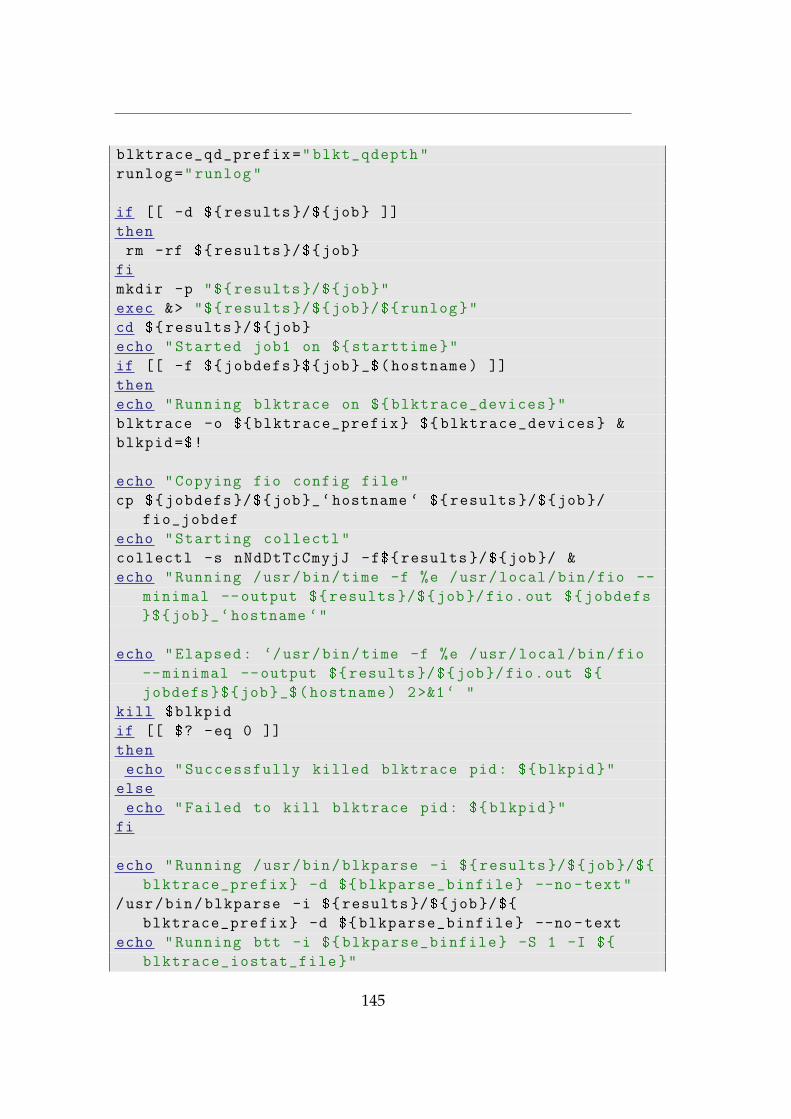
blktrace_qd_prefix="blkt_qdepth"
runlog="runlog"
if [[ -d ${results }/${job} ]]
then
rm -rf ${results }/${job}
fi
mkdir -p "${results }/${job}"
exec &> "${results }/${job}/${runlog}"
cd ${results }/${job}
echo "Started job1 on ${starttime}"
if [[ -f ${jobdefs}${job}_$(hostname) ]]
then
echo "Running blktrace on ${blktrace_devices}"
blktrace -o ${blktrace_prefix} ${blktrace_devices} &
blkpid=$!
echo "Copying fio config file"
cp ${jobdefs }/${job}_‘hostname ‘ ${results }/${job}/
fio_jobdef
echo "Starting collectl"
collectl -s nNdDtTcCmyjJ -f${results }/${job}/ &
echo "Running /usr/bin/time -f %e /usr/local/bin/fio --
minimal --output ${results }/${job}/fio.out ${jobdefs
}${job}_‘hostname ‘"
echo "Elapsed: ‘/usr/bin/time -f %e /usr/local/bin/fio
--minimal --output ${results }/${job}/fio.out ${
jobdefs}${job}_$(hostname) 2>&1‘ "
kill $blkpid
if [[ $? -eq 0 ]]
then
echo "Successfully killed blktrace pid: ${blkpid}"
else
echo "Failed to kill blktrace pid: ${blkpid}"
fi
echo "Running /usr/bin/blkparse -i ${results }/${job}/${
blktrace_prefix} -d ${blkparse_binfile} --no-text"
/usr/bin/blkparse -i ${results }/${job}/${
blktrace_prefix} -d ${blkparse_binfile} --no-text
echo "Running btt -i ${blkparse_binfile} -S 1 -I ${
blktrace_iostat_file}"
145

APPENDIX C. OTHER SCRIPTS
btt -i ${blkparse_binfile} -S 1 -I ${
blktrace_iostat_file} > /dev/null
echo "Running btt -i ${blkparse_binfile} -q ${
blktrace_q2c_lat_prefix}"
btt -i ${blkparse_binfile} -q ${blktrace_q2c_lat_prefix
} > /dev/null
echo "Running btt -i ${blkparse_binfile} -Q ${
blktrace_qd_prefix}"
btt -i ${blkparse_binfile} -Q ${blktrace_qd_prefix} > /
dev/null
echo "Creating btrecord files"
mkdir btrecord
btrecord -D btrecord ${blktrace_prefix}
echo "Deleting blktrace and blkparse files for space
conservation"
rm ${blkparse_binfile}
rm ${blktrace_prefix }*
pkill collectl
echo "Ended job1 on ‘date ‘"
else
echo "No jobfile , not running any fio job"
fi
if [[ ‘hostname ‘ == "b2" ]]
then
while true
do
f=""
for b in b3 b4 b5
do
f=${f}‘ssh $b pgrep $job ‘
done
echo "-- ‘date ‘ contents of f=$f"
if [[ -z ${f} ]]
then
break
fi
sleep 5
done
echo "-- ‘date ‘ running postproc on bm"
ssh -p 5432 bm "/root/scripts/postproc.sh ${job} "
ssh b1 "pkill argus;gzip /root/results/${job}/argus.
bin"
146

fi� �Listing C.16: Mathematica code for finding the best moving average algorithmin Figure 4.3� �(* Import the vector representing the real AVWAIT
logged during experiment *)
(* This is the raw data that will be tested for the
best sliding average algoritmh. *)
v = Flatten[Import["/Users/jarleb/Documents/masterprog/
thesis/results/jb-AVWAIT -comp/bm/v_wait", "Table"]];
(* Generate a plot of the raw data and store it in a
variable *)
a = ListPlot[v, PlotJoined -> True];
(* Function for prepending the vector with the same
amount of elements as the moving median reduces it
with when window size increases.*)
(* This is done to avoid time shifting of the moving
median graph when stacked on top of the real data
and the EWMA*)
tr[{elem_ , num_}] := Table[elem , {num}]
(* A slider for moving median window size (integers) *)
Slider[Dynamic[r], {2, 20, 1}]
(* Slider for ewma alpha parameter *)
Slider[Dynamic[alpha], {0.0001 , 1}]
(* Dynamic plot with the three grahs stacked on top of
each other *)
Dynamic[Show[a,ListPlot[ExponentialMovingAverage[v,
alpha], PlotJoined -> True ,PlotStyle -> {RGBColor[1,
0, 0], Thick}],ListPlot[MovingMedian[Join[tr[{0, av
}], v], av], PlotJoined -> True ,PlotStyle -> {
RGBColor[0, 2, 0], Thick }]]]� �147

APPENDIX C. OTHER SCRIPTS
148

Appendix D
Collection of fio job definitions
Listing D.1: Fio job definition run from script 5.4� �[global]
rw=read
#rw=write
size =200m
blocksize =64k
direct =1
ioengine=sync
write_lat_log
write_bw_log
[job1 -1]
filename =/dev/iscsi_1
;� �Listing D.2: Fio job definition for the small job described in 5.5� �
[global]
rw=randread
size =128m
blocksize =8k
ioengine=sync
rate =256k
write_lat_log
direct =1
[job1 -1]
filename =/dev/iscsi_0
149
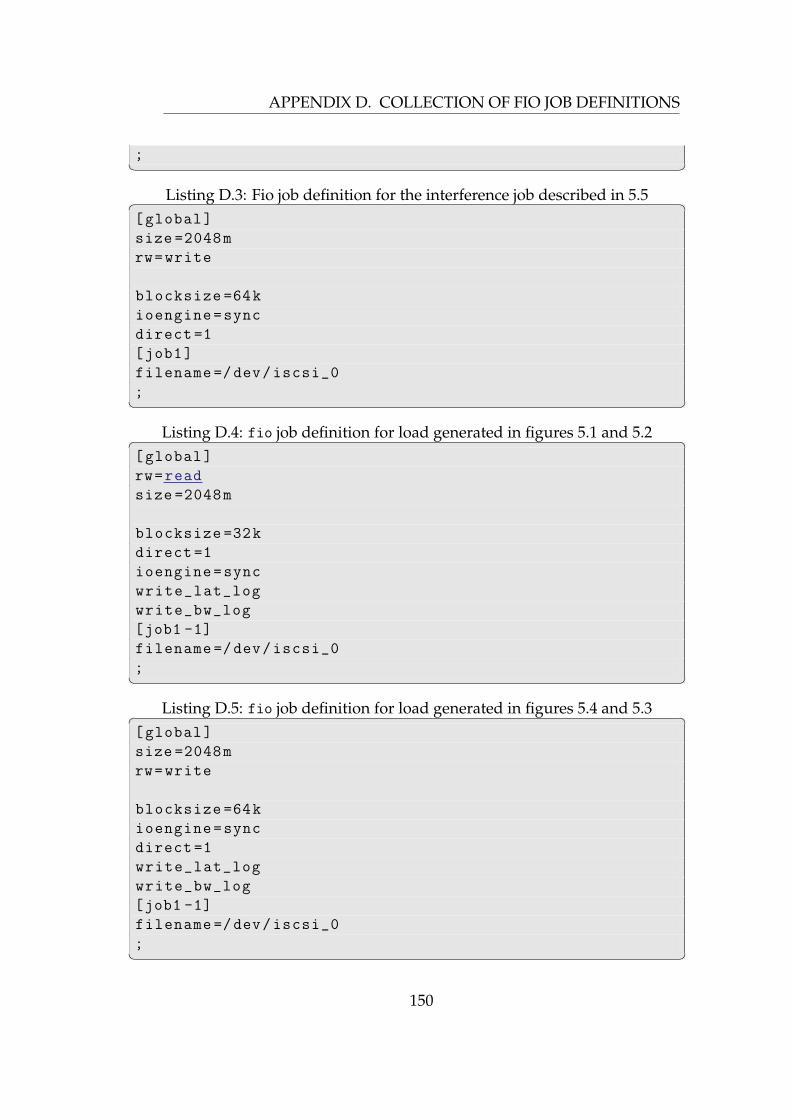
APPENDIX D. COLLECTION OF FIO JOB DEFINITIONS
;� �Listing D.3: Fio job definition for the interference job described in 5.5� �
[global]
size =2048m
rw=write
blocksize =64k
ioengine=sync
direct =1
[job1]
filename =/dev/iscsi_0
;� �Listing D.4: fio job definition for load generated in figures 5.1 and 5.2� �
[global]
rw=read
size =2048m
blocksize =32k
direct =1
ioengine=sync
write_lat_log
write_bw_log
[job1 -1]
filename =/dev/iscsi_0
;� �Listing D.5: fio job definition for load generated in figures 5.4 and 5.3� �
[global]
size =2048m
rw=write
blocksize =64k
ioengine=sync
direct =1
write_lat_log
write_bw_log
[job1 -1]
filename =/dev/iscsi_0
;� �150

Appendix E
Collection of commands
Listing E.1: R commands used to create figures 5.5 and 5.6� �library(sciplot)
t=read.table(r)
bargraph.CI(V1,V2,data=t,xlab="Introduced delay (ms)",
ylab="Time to read 200MB of data (s)",err.width
=0.05)� �Listing E.2: R commands used to identify overhead introduced by tc packetchecking� �> no_tc_r=read.table("no_tc_read.out")
> w_tc_r=read.table("with_tc_read.out")
> w_tc_w=read.table("with_tc_write.out")
> no_tc_w=read.table("no_tc_write.out")
> read=t.test(w_tc_r ,no_tc_r ,conf.level =0.99)
> write=t.test(w_tc_w ,no_tc_w ,conf.level =0.99)
> round(c(read$conf.int[1], read$estimate [1]-
read$estimate [2], read$conf.int[2], read$estimate [1],
read$estimate [2]) ,3)
mean of x mean of x mean of y
0.011 0.023 0.035 7.210 7.188
> round(c(write$conf.int[1], write$estimate [1]-
write$estimate [2], write$conf.int[2], write$estimate
[1], write$estimate [2]) ,3)
mean of x mean of x mean of y
0.069 0.112 0.155 8.843 8.731
>
151

APPENDIX E. COLLECTION OF COMMANDS
>� �Listing E.3: Commands used to check for packet loss logged on the host sidein experiment 5.5 and 5.6� �jarleb@rubeus b2 $ pwd
/Users/jarleb/Documents/masterprog/thesis/results/dfunc
-write/b2
jarleb@rubeus b2 $ cat lossfish.pl
#!/usr/bin/perl -w
while (<> ) {
next if /^#/;
chomp;
s/\s+/ /g;
my @l = split;
print "$l[0] $l[1] $l[4] \n" if $l[4] != 0;
}
jarleb@rubeus b2 $
jarleb@rubeus b2 $ collectl -p collectl -b2
-20100413 -211521. raw -s t -oT --thru 20100414:03:00
--plot |./ lossfish.pl
jarleb@rubeus bm $ cd ../bm
jarleb@rubeus bm $ collectl -p collectl -blademon
-20100413 -211329. raw.gz -s t -oT --thru
20100414:03:00 --plot |../b2/lossfish.pl
jarleb@rubeus b2 $ cd ../../ dfunc -read/b2
jarleb@rubeus b2 $ collectl -p collectl -b2
-20100412 -162129. raw.gz -s t -oT --thru
20100412:19:40:00 --plot |../../ dfunc -write/b2/
lossfish.pl
jarleb@rubeus b2 $
jarleb@rubeus bm $ collectl -p collectl -blademon
-20100412 -162357. raw.gz -s t -oT --thru
20100412:19:40:00 --plot |../../ dfunc -write/b2/
lossfish.pl
jarleb@rubeus bm $� �Listing E.4: Commands used to generate argus plots in figure 3.5� �
jarleb@rubeus b1 $ra -r argus.bin.gz -u -n -s stime ,
ltime ,saddr ,sport ,daddr ,dport ,spkts ,dpkts ,sload ,
dload - dst port 3260 and src 10.0.0.242 and src
port 36966|./ plot.pl > plots/b2
152

jarleb@rubeus b1 $ra -r argus.bin.gz -u -n -s stime ,
ltime ,saddr ,sport ,daddr ,dport ,spkts ,dpkts ,sload ,
dload - dst port 3260 and src 10.0.0.243 and src
port 52209|./ plot.pl > plots/b3
jarleb@rubeus b1 $ra -r argus.bin.gz -u -n -s stime ,
ltime ,saddr ,sport ,daddr ,dport ,spkts ,dpkts ,sload ,
dload - dst port 3260 and src 10.0.0.244 and src
port 46645|./ plot.pl > plots/b4
jarleb@rubeus b1 $ra -r argus.bin.gz -u -n -s stime ,
ltime ,saddr ,sport ,daddr ,dport ,spkts ,dpkts ,sload ,
dload - dst port 3260 and src 10.0.0.245 and src
port 51901|./ plot.pl > plots/b5
jarleb@rubeus b1 $
jarleb@rubeus b1 $ pwd
/Users/jarleb/Documents/masterprog/thesis/results/
seqread -delay -shape/b1
jarleb@rubeus b1 $
jarleb@rubeus b1 $ cat plot.pl
#!/usr/bin/perl -w
my $divisor = ( 1024*8 );
my $column = 7 ;
my $starttime;
while (<>) {
chomp;
s/\s+/ /g;
my @l = split ;
if ( $. == 1 ) { $starttime = $l[0]; }
my $reltime = $l[0] - $starttime;
my $v = $l[$column] / $divisor ;
print "$reltime $v\n";
}
jarleb@rubeus b1 $� �Listing E.5: Commands used to generate logical volume plots in figure 3.5� �
jarleb@rubeus bm $ collectl -p blademon
-20100324 -194803. raw.gz -s D -oT -oD |grep dm -0 |./
plot.pl > plots/b2
jarleb@rubeus bm $ collectl -p blademon
-20100324 -194803. raw.gz -s D -oT -oD |grep dm -1 |./
plot.pl > plots/b3
153

APPENDIX E. COLLECTION OF COMMANDS
jarleb@rubeus bm $ collectl -p blademon
-20100324 -194803. raw.gz -s D -oT -oD |grep dm -2 |./
plot.pl > plots/b4
jarleb@rubeus bm $ collectl -p blademon
-20100324 -194803. raw.gz -s D -oT -oD |grep dm -3 |./
plot.pl > plots/b5
jarleb@rubeus bm $
jarleb@rubeus bm $ pwd
/Users/jarleb/Documents/masterprog/thesis/results/
seqread -delay -shape/bm
jarleb@rubeus bm $
jarleb@rubeus bm $ cat plot.pl
#!/usr/bin/perl
use Date::Parse;
my $starttime;
while (<>) {
chomp;
s/\s+/ /g;
@l = split;
my $timestr = "$l[0] $l[1]";
my $time = str2time($timestr);
if ($. == 1 ) { $starttime = $time ; }
my $reltime = $time - $starttime;
print $reltime." $l[3]\n";
}
jarleb@rubeus bm $� �Listing E.6: RTO min value from /proc/net/snmp� �
[root@blademon scripts]# cat /proc/net/snmp|grep ^Tcp |
awk ’{print $3}’
RtoMin
200
[root@blademon scripts]#� �Listing E.7: Aggregated amount of lost or retransmitted packets during trafficshaping using artificial delay of ACK packets as shown in figure 5.4� �jarleb@rubeus b1 $ pwd
/Users/jarleb/Documents/masterprog/thesis/results/
seqwrite -delay -shape/b1
154

jarleb@rubeus b1 $ racluster -m saddr -r argus.bin.gz -
s saddr loss
10.0.0.242 0
10.0.0.243 0
10.0.0.244 0
10.0.0.245 0
10.0.0.253 0
10.0.0.254 0
10.0.0.200 0
10.0.0.242 0
10.0.0.253 0
jarleb@rubeus b1 $� �Listing E.8: Aggregated amount of lost or retransmitted packets during trafficshaping using artificial delay of ACK data packets as shown in figure 5.3� �jarleb@rubeus b1 $ pwd
/Users/jarleb/Documents/masterprog/thesis/results/
seqread -delay -shape/b1
jarleb@rubeus b1 $ racluster -m saddr -r argus.bin.gz -
s saddr loss
10.0.0.242 0
10.0.0.243 0
10.0.0.244 0
10.0.0.245 0
10.0.0.253 0
10.0.0.200 0
10.0.0.242 0
10.0.0.253 0
jarleb@rubeus b1 $� �
155
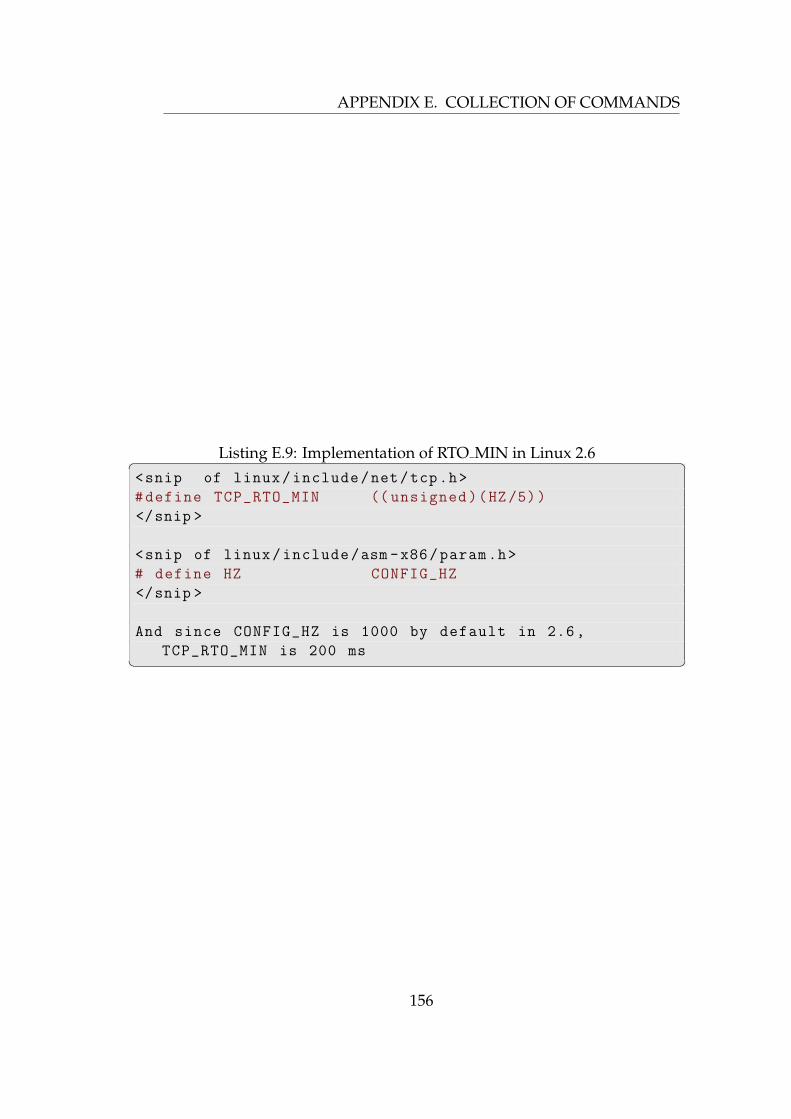
APPENDIX E. COLLECTION OF COMMANDS
Listing E.9: Implementation of RTO MIN in Linux 2.6� �<snip of linux/include/net/tcp.h>
#define TCP_RTO_MIN (( unsigned)(HZ/5))
</snip >
<snip of linux/include/asm -x86/param.h>
# define HZ CONFIG_HZ
</snip >
And since CONFIG_HZ is 1000 by default in 2.6,
TCP_RTO_MIN is 200 ms� �
156