Using Supercomputers and Data Analytics to Discover the Differences in Health and Disease
26
“Using Supercomputers and Data Analytics to Discover the Differences in Health and Disease” Briefing for Dell Analytics Team Calit2’s Qualcomm Institute University of California, San Diego April 7, 2016 Dr. Larry Smarr Director, California Institute for Telecommunications and Information Technology Harry E. Gruber Professor, Dept. of Computer Science and Engineering Jacobs School of Engineering, UCSD http://lsmarr.calit2.net 1
-
Upload
larry-smarr -
Category
Data & Analytics
-
view
317 -
download
0
Transcript of Using Supercomputers and Data Analytics to Discover the Differences in Health and Disease

“Using Supercomputers and Data Analytics to Discover the Differences in Health and Disease”
Briefing forDell Analytics Team
Calit2’s Qualcomm InstituteUniversity of California, San Diego
April 7, 2016
Dr. Larry SmarrDirector, California Institute for Telecommunications and Information Technology
Harry E. Gruber Professor, Dept. of Computer Science and Engineering
Jacobs School of Engineering, UCSDhttp://lsmarr.calit2.net
1

We Gathered Raw Illumina Reads on 275 Humansand Generated a Time Series of My Gut Microbiome
5 Ileal Crohn’s Patients, 3 Points in Time
2 Ulcerative Colitis Patients, 6 Points in Time
“Healthy” Individuals
Source: Jerry Sheehan, Calit2Weizhong Li, Sitao Wu, CRBS, UCSD
Total of 27 Billion ReadsOr 2.7 Trillion Bases
Inflammatory Bowel Disease (IBD) Patients250 Subjects
1 Point in Time
7 Points in Time
Each Sample Has 100-200 Million Illumina Short Reads (100 bases)
Larry Smarr(Colonic Crohn’s)

To Map Out the Dynamics of Autoimmune Microbiome Ecology Couples Next Generation Genome Sequencers to Big Data Supercomputers
Source: Weizhong Li, UCSD
Our Team Used 25 CPU-yearsto Compute
Comparative Gut MicrobiomesStarting From
2.7 Trillion DNA Bases of My Samples
and Healthy and IBD Controls
Illumina HiSeq 2000 at JCVI
SDSC Gordon Data Supercomputer

To Expand IBD Project the Knight/Smarr Labs Were Awarded ~ 1 CPU-Century Supercomputing Time
• Smarr Gut Microbiome Time Series– From 7 Samples Over 1.5 Years – To 50 Samples Over 4 Years
• IBD Patients: From 5 Crohn’s Disease and 2 Ulcerative Colitis Patients to ~100 Patients– 50 Carefully Phenotyped Patients Drawn from Sandborn BioBank– 43 Metagenomes from the RISK Cohort of Newly Diagnosed IBD patients
• New Software Suite from Knight Lab– Re-annotation of Reference Genomes, Functional / Taxonomic Variations– Novel Compute-Intensive Assembly Algorithms from Pavel Pevzner
8x Compute Resources Over Prior Study

Next Step Programmability, Scalability, and Reproducibility using bioKepler
www.kepler-project.org
www.biokepler.org
National Resources
(Gordon) (Comet)
(Stampede)(Lonestar)
Cloud Resources
Optimized
Local Cluster Resources
Source: Ilkay
Altintas, SDSC

Using HPC and Data Analyticsto Discover Microbial Diagnostics for Disease Dynamics
• Can Data Distinguish Between Health and Disease Subtypes?
• Can Data Track the Time Development of the Disease State?
• Can Data Create Novel Microbial Diagnostics for Identifying Health and Disease States?
• Can Data Discover Functional Microbiome Gene Changes Between Health and Disease?

Can Data Distinguish Between Health and Disease Subtypes?
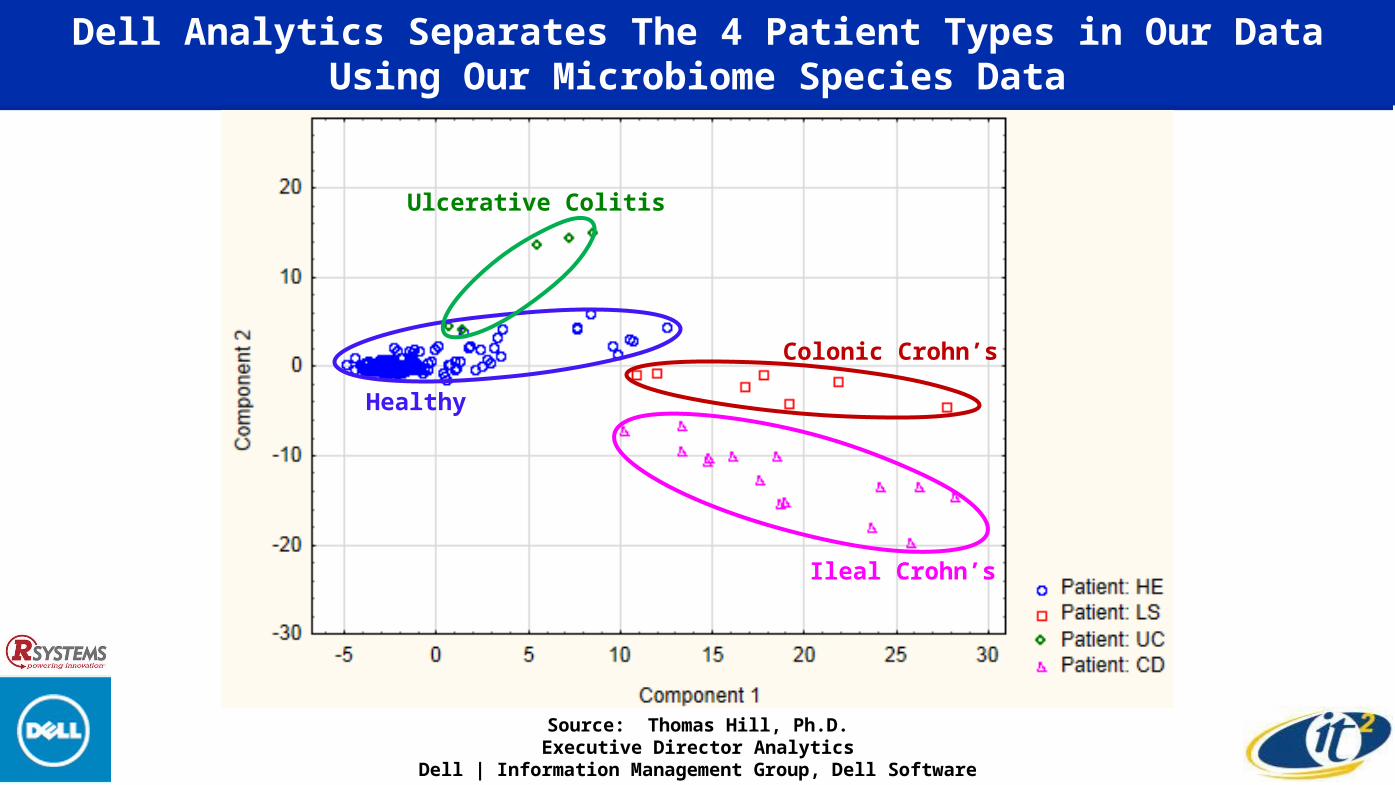
Dell Analytics Separates The 4 Patient Types in Our DataUsing Our Microbiome Species Data
Source: Thomas Hill, Ph.D.Executive Director Analytics
Dell | Information Management Group, Dell Software
Healthy
Ulcerative Colitis
Colonic Crohn’s
Ileal Crohn’s

Can Data Track the Time Development of the Disease State?
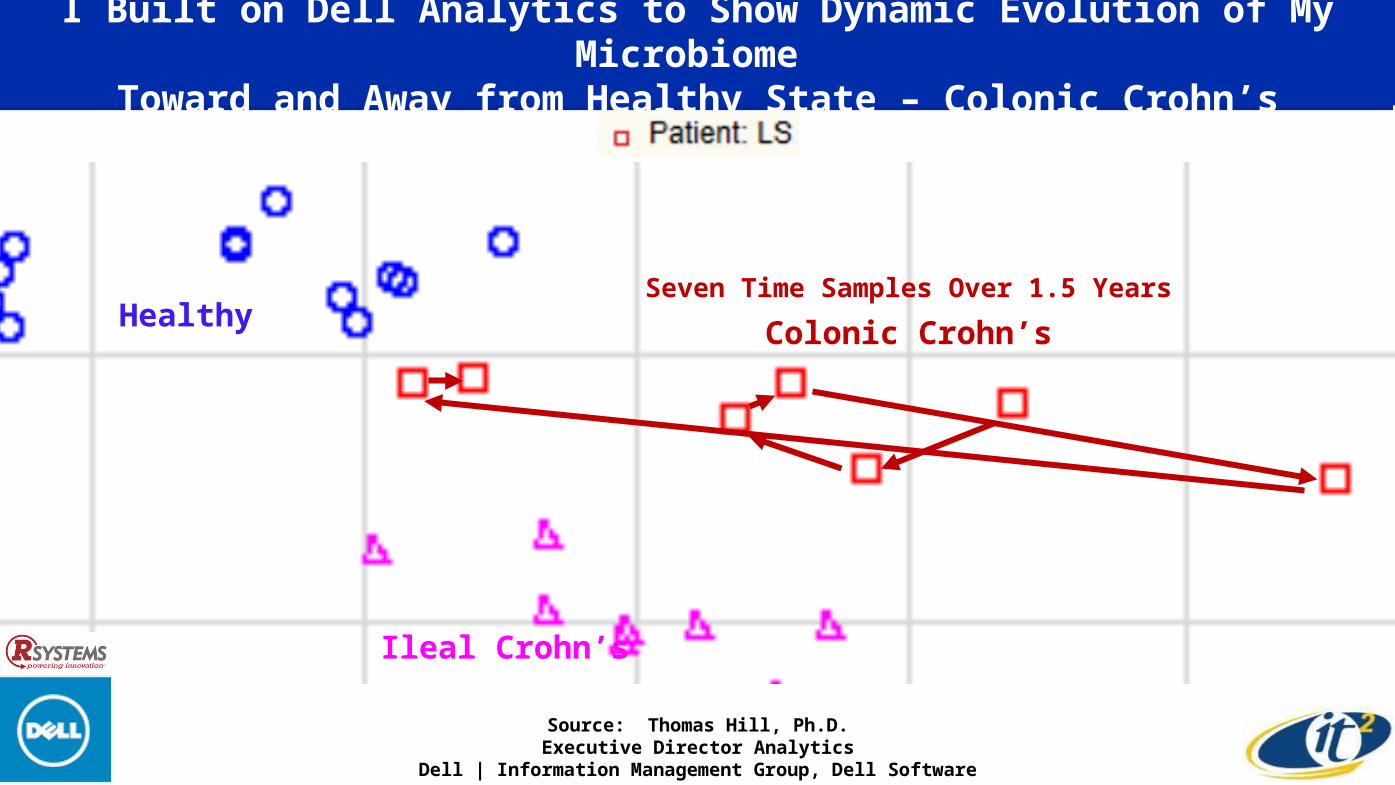
I Built on Dell Analytics to Show Dynamic Evolution of My Microbiome Toward and Away from Healthy State – Colonic Crohn’s
Healthy
Ileal Crohn’s
Seven Time Samples Over 1.5 Years
Colonic Crohn’s
Source: Thomas Hill, Ph.D.Executive Director Analytics
Dell | Information Management Group, Dell Software

Variation in My Gut Microbiome by 16S Families – 40 Samples Over 3.5 Years
Data from Justine Debelius & Jose Navas, Knight Lab, UCSD; Larry Smarr Analysis, January 2016

Larry Smarr Gut Microbiome Ecology Shifted After Drug Therapy Between Two Time-Stable Equilibriums Correlated to Physical Symptoms
Lialda &
Uceris
12/1/13 to 1/1/14
12/1/13-1/1/14
Frequent IBD SymptomsWeight Loss
5/1/12 to 12/1/14Blue Balls on Diagram
to the Right
Few IBD SymptomsWeight Gain
1/1/14 to 1/1/16Red Balls on Diagram
to the Right
Principal Coordinate Analysis of Microbiome Ecology
PCoA by Justine Debelius and Jose Navas, Knight Lab, UCSD
Weight Data from Larry Smarr, Calit2, UCSD
Ant
ibio
ticsPrednisone
1/1/12 to 5/1/12
5/1/12
Weekly Weight (Red Dots Stool Sample)
Few IBD SymptomsWeight Gain
1/1/14 to 1/1/16Red Balls on Diagram
to the Right

Can Data Create Novel Microbial Diagnostics for Identifying Health and Disease States?

Dell Analytics Tree Graphs Classifies the 4 Health/Disease States With Just 3 Microbe Species
Source: Thomas Hill, Ph.D.Executive Director Analytics
Dell | Information Management Group, Dell Software
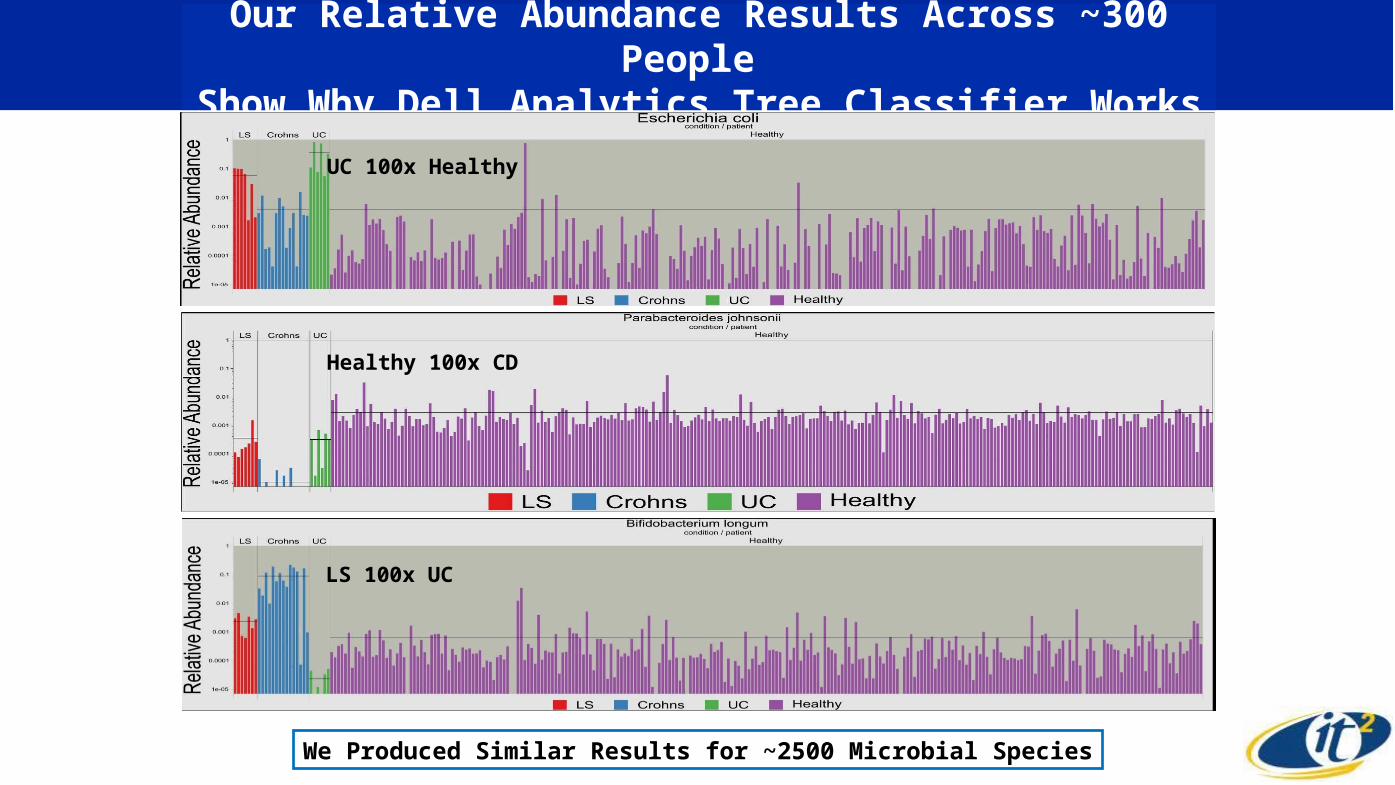
Our Relative Abundance Results Across ~300 People Show Why Dell Analytics Tree Classifier Works
UC 100x Healthy
LS 100x UC
We Produced Similar Results for ~2500 Microbial Species
Healthy 100x CD

Ayasdi Enables Discovery of Differences Between Healthy and Disease States Using Microbiome Species
Healthy LS
Ileal Crohn’s Ulcerative Colitis
Using Multidimensional Scaling Lens with Correlation Metric
High in Healthy and LS
High in Healthy and Ulcerative Colitis
High in Both LS and Ileal Crohn’s Disease
Analysis by Mehrdad Yazdani, Calit2

Can Data Discover Functional Microbiome Gene Changes Between Health and Disease?

We Computed the Relative Abundance of Microbial Gene Families -~10,000 KEGG Orthologous Genes, Across Healthy and IBD Subjects
How Large is the Microbiome’s Genetic ChangeBetween Health and Disease States?

In a “Healthy” Gut Microbiome:Large Taxonomy Variation, Low Protein Family Variation
Source: Nature, 486, 207-212 (2012)
Over 200 People

Ratio of HE11529 to Ave HETest to see How Much Variation There is Within Healthy
Most KEGGs Are Within 10xOf Healthy for a Random HE
Ratio of Random HE11529 to Healthy Average for Each Nonzero KEGG
Similar to HMP Healthy Results

Our Research Shows Large Changes in Protein Families Between Health and Disease – Ileal Crohns
KEGGs Greatly IncreasedIn the Disease State
KEGGs Greatly DecreasedIn the Disease State
Over 7000 KEGGs Which Are Nonzero in Health and Disease States
Ratio of CD Average to Healthy Average for Each Nonzero KEGG
Note Hi/LowSymmetry
Similar Results for UC and LS

We Found a Set of Ayasdi Lenses That Separate Out the 43 Extreme KEGGs Common to the Disease States
K00108(choline_dehydrogenase)K00673(arginine_N-succinyltransferase)K00867(type_I_pantothenate_kinase)K01169(ribonuclease_I_(enterobacter_ribonuclease))K01484(succinylarginine_dihydrolase)K01682(aconitate_hydratase_2)K01690(phosphogluconate_dehydratase)K01825(3-hydroxyacyl-CoA_dehydrogenase_/_enoyl-CoA_hydratase_/3-hydroxybutyryl-CoA_epimerase_/_enoyl-CoA_isomerase_[EC:1.1.1.354.2.1.17_5.1.2.3_5.3.3.8])K02173(hypothetical_protein)K02317(DNA_replication_protein_DnaT)K02466(glucitol_operon_activator_protein)K02846(N-methyl-L-tryptophan_oxidase)K03081(3-dehydro-L-gulonate-6-phosphate_decarboxylase)K03119(taurine_dioxygenase)K03181(chorismate--pyruvate_lyase)K03807(AmpE_protein)K05522(endonuclease_VIII)K05775(maltose_operon_periplasmic_protein)K05812(conserved_hypothetical_protein)K05997(Fe-S_cluster_assembly_protein_SufA)K06073(vitamin_B12_transport_system_permease_protein)K06205(MioC_protein)K06445(acyl-CoA_dehydrogenase)K06447(succinylglutamic_semialdehyde_dehydrogenase)K07229(TrkA_domain_protein)K07232(cation_transport_protein_ChaC)K07312(putative_dimethyl_sulfoxide_reductase_subunit_YnfH_(DMSO_reductaseanchor_subunit))K07336(PKHD-type_hydroxylase)K08989(putative_membrane_protein)K09018(putative_monooxygenase_RutA)K09456(putative_acyl-CoA_dehydrogenase)K09998(arginine_transport_system_permease_protein)K10748(DNA_replication_terminus_site-binding_protein)K11209(GST-like_protein)K11391(ribosomal_RNA_large_subunit_methyltransferase_G)K11734(aromatic_amino_acid_transport_protein_AroP)K11735(GABA_permease)K11925(SgrR_family_transcriptional_regulator)K12288(pilus_assembly_protein_HofM)K13255(ferric_iron_reductase_protein_FhuF)K14588()K15733()K15834()
L-Infinity Centrality Lens Using Norm Correlation
as Metric (Resolution: 242, Gain: 5.7)
Entropy & Variance LensUsing Angle as Metric
(Resolution: 30, Gain 3.00)
Analysis by Mehrdad Yazdani, Calit2
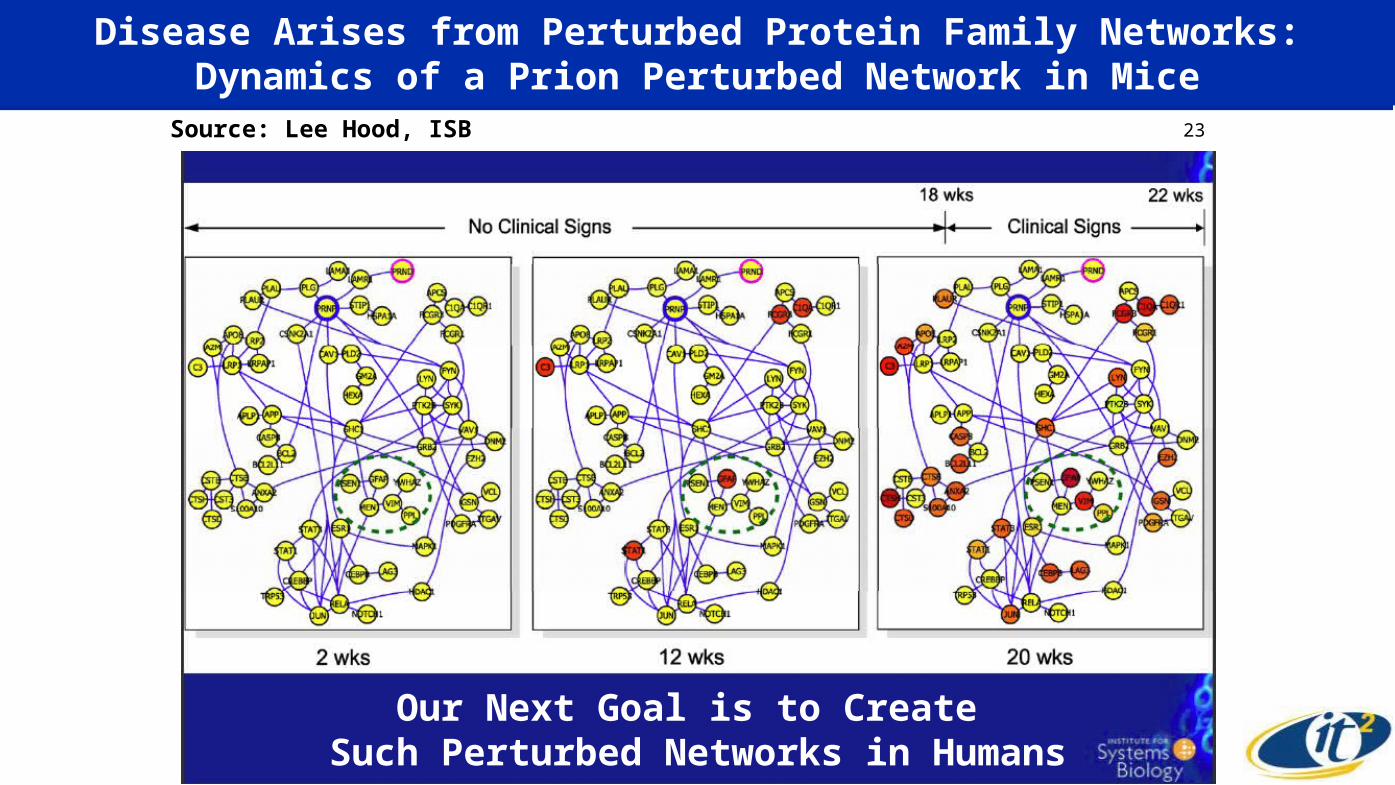
Disease Arises from Perturbed Protein Family Networks:Dynamics of a Prion Perturbed Network in Mice
Source: Lee Hood, ISB 23
Our Next Goal is to Create Such Perturbed Networks in Humans

Calit2’s Qualcomm Institute Has Developed Interactive Scalable Visualization for Biological Networks
20,000 Samples60,000 OTUs
18 Million Edges
Runs Native on 64Million Pixels

Center for Microbiome Innovation
Seminars Faculty Hiring Education
UCSD Microbial Sciences Initiative
InstrumentCores
Seed GrantsFellowships
Chancellor Khosla Launched the UC San Diego Microbiome and Microbial Sciences Initiative October 29, 2015

Thanks to Our Great Team!
Calit2@UCSD Future Patient TeamJerry SheehanTom DeFanti Joe Keefe John GrahamKevin PatrickMehrdad YazdaniJurgen Schulze Andrew Prudhomme Philip Weber Fred RaabErnesto Ramirez
JCVI TeamKaren Nelson Shibu Yooseph Manolito Torralba
AyasdiDevi RamananPek Lum
UCSD Metagenomics TeamWeizhong Li Sitao Wu
SDSC TeamMichael Norman Mahidhar Tatineni Robert Sinkovits Ilkay Altintas
UCSD Health Sciences TeamDavid BrennerRob Knight Lab Justine Debelius Jose Navas Bryn Taylor Gail Ackermann Greg HumphreyWilliam J. Sandborn Lab Elisabeth Evans John Chang Brigid Boland
Dell/R SystemsBrian KucicJohn Thompson Thomas Hill