Using STATA in Survey Data Analysis - Niveen El Zayat
23
Using STATA in Survey Data Analysis NIVEEN EL ZAYAT ASSISTANT LECTURER DEPARTMENT OF STATISTICS FACULTY OF ECONOMICS AND POLITICAL SCIENCE
-
Upload
economic-research-forum -
Category
Government & Nonprofit
-
view
818 -
download
0
Transcript of Using STATA in Survey Data Analysis - Niveen El Zayat
Using STATA in Survey Data AnalysisNIVEEN EL ZAYAT
ASSISTANT LECTURER
DEPARTMENT OF STATISTICS
FACULTY OF ECONOMICS AND POLITICAL SCIENCE
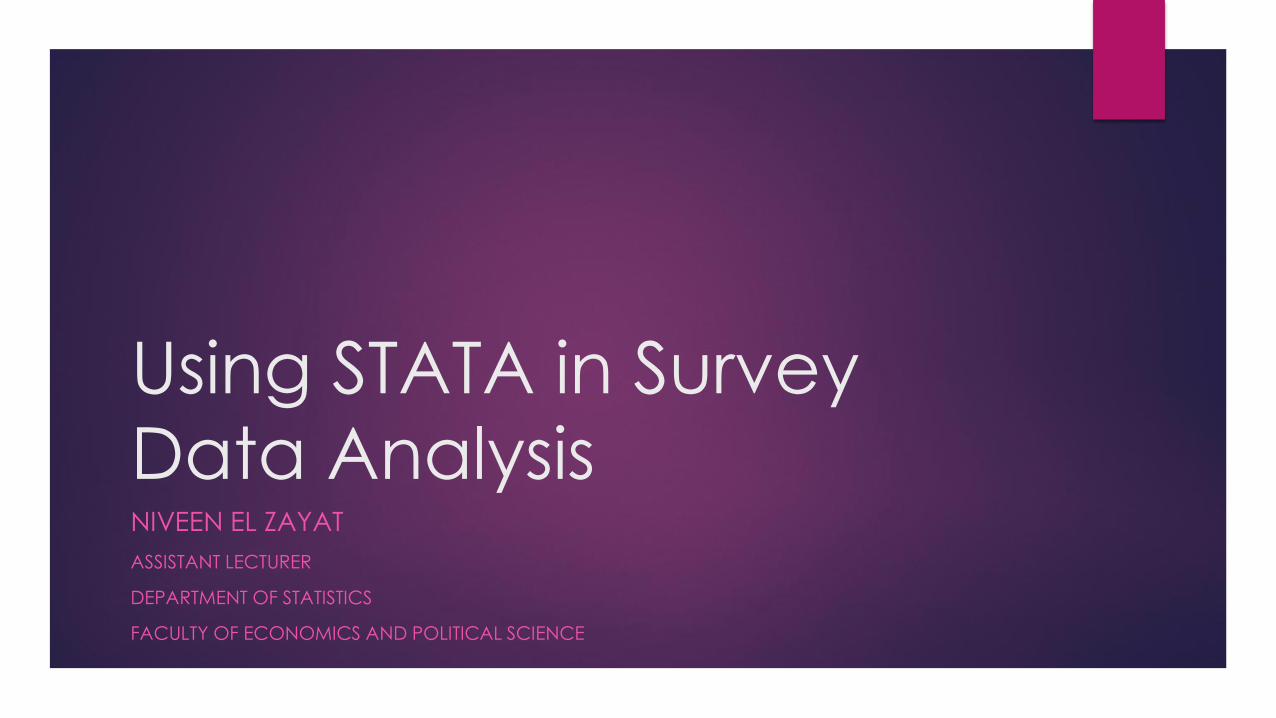
Outlines
Aspects of survey data
Survey Designs
Setting survey design in STATA: svyset
Describing survey design: svydes
Estimation commands using prefix svy: (In STATA do-file)
Estimation for subpopulations (In STATA do-file)
Extracting survey-weighted tables and graphs (In STATA do-file)
Aspects of survey data
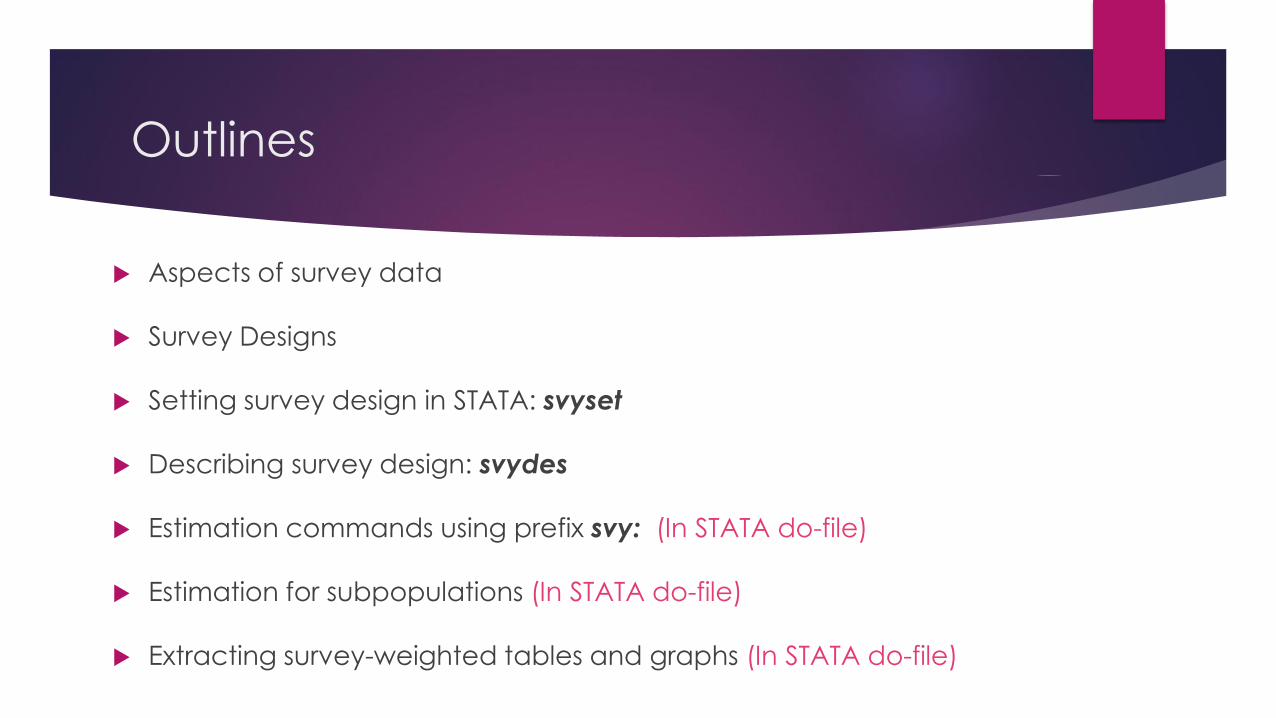
What is Survey?
A research technique to draw information about well-defined population through selecting a
sample that systematically questioned, hence, results are analyzed and generalized to the
population.
Surveys necessary for providing decision-makers with information that serves the planning,
monitoring and evaluation purposes
Survey data is collected through either “complete enumeration” or “sampling”.
Complete enumeration indicates to collecting data from all units exist in the population.
Sampling indicates to collecting data from a subset of the population and designed to be
hopefully representative to that population and used to determine truths about it.
Censuses are examples of complete enumeration while Demographic Health Survey (DHS) and
Labor Force Sample Survey are examples of sample surveys.
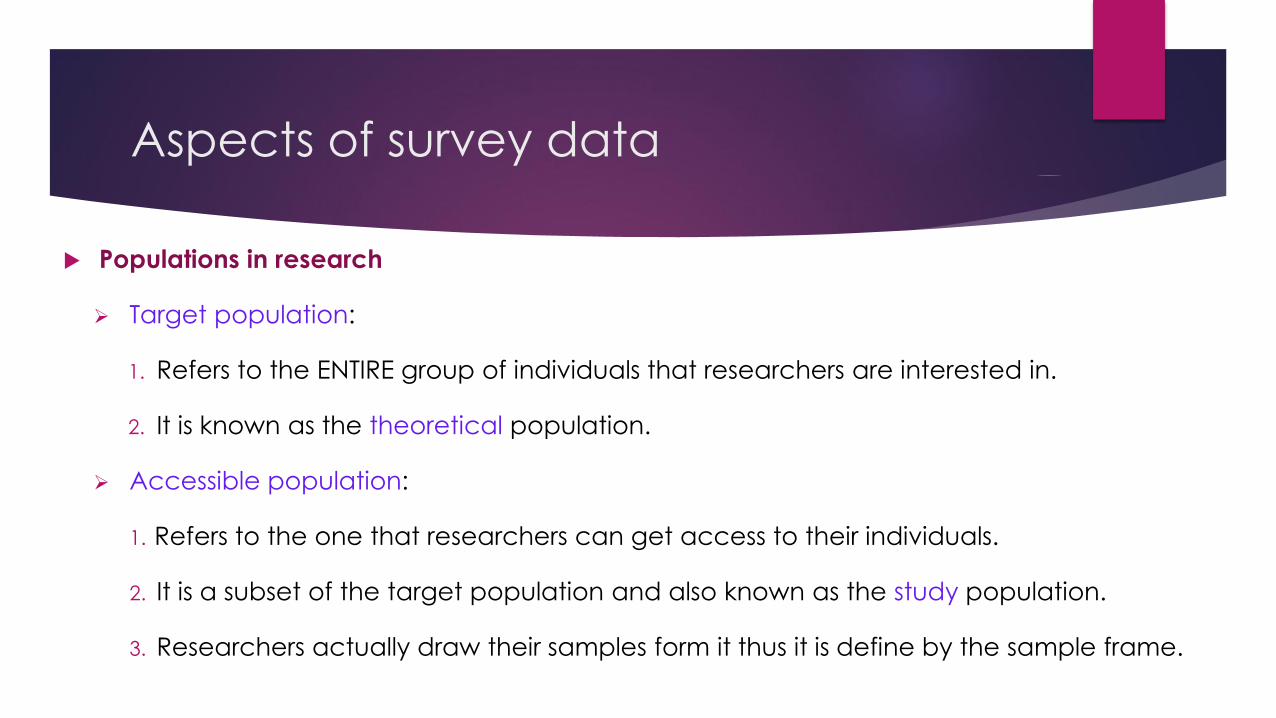
Aspects of survey data
Populations in research
Target population:
1. Refers to the ENTIRE group of individuals that researchers are interested in.
2. It is known as the theoretical population.
Accessible population:
1. Refers to the one that researchers can get access to their individuals.
2. It is a subset of the target population and also known as the study population.
3. Researchers actually draw their samples form it thus it is define by the sample frame.
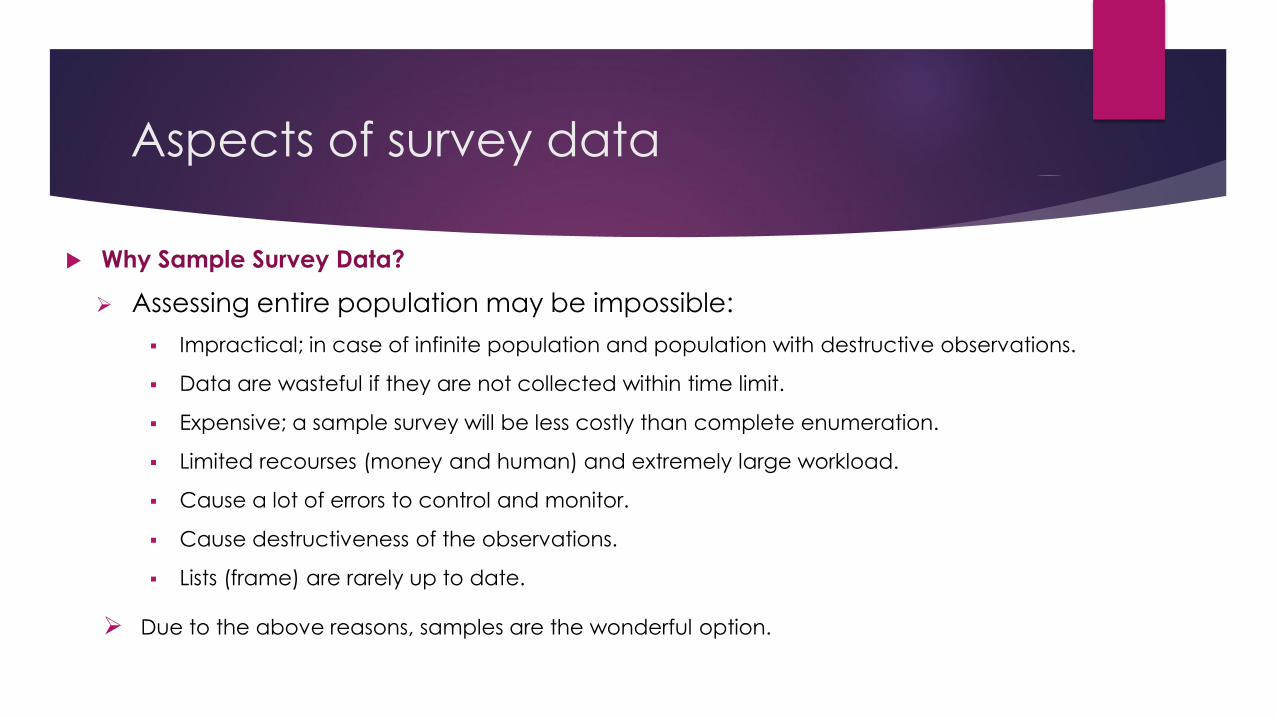
Aspects of survey data
Why Sample Survey Data?
Assessing entire population may be impossible:
Impractical; in case of infinite population and population with destructive observations.
Data are wasteful if they are not collected within time limit.
Expensive; a sample survey will be less costly than complete enumeration.
Limited recourses (money and human) and extremely large workload.
Cause a lot of errors to control and monitor.
Cause destructiveness of the observations.
Lists (frame) are rarely up to date.
Due to the above reasons, samples are the wonderful option.
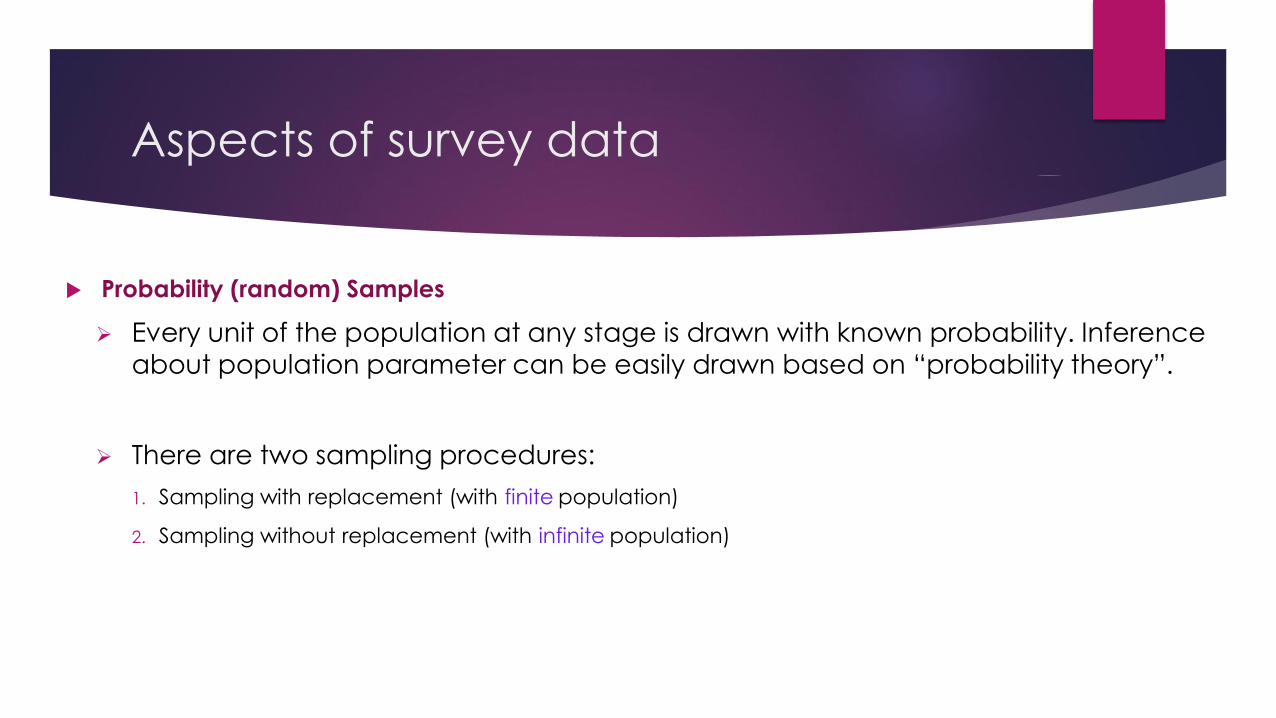
Aspects of survey data
Probability (random) Samples
Every unit of the population at any stage is drawn with known probability. Inference
about population parameter can be easily drawn based on “probability theory”.
There are two sampling procedures:
1. Sampling with replacement (with finite population)
2. Sampling without replacement (with infinite population)
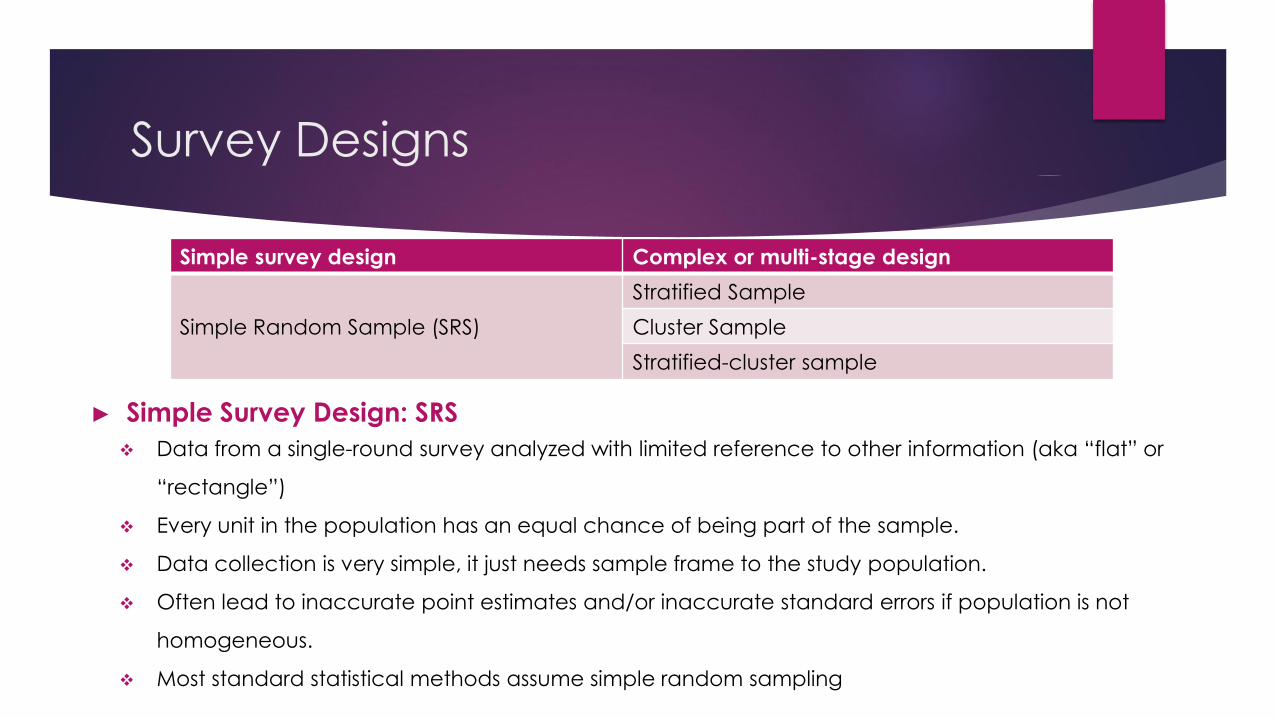
Survey Designs
► Simple Survey Design: SRS
Data from a single-round survey analyzed with limited reference to other information (aka “flat” or
“rectangle”)
Every unit in the population has an equal chance of being part of the sample.
Data collection is very simple, it just needs sample frame to the study population.
Often lead to inaccurate point estimates and/or inaccurate standard errors if population is not
homogeneous.
Most standard statistical methods assume simple random sampling
Complex or multi-stage designSimple survey design
Stratified Sample
Simple Random Sample (SRS) Cluster Sample
Stratified-cluster sample
► Complex (multi-stages/ hierarchical) designs
Drawing SRS is sometimes impossible (e.g., there is indicative frame to the population elements).
Different elements may have different probability of selection into the sample due to population
nature.
Used with hierarchical data (HH surveys).
Many statistical procedures assume i.i.d. , moreover, many statistical packages treat data as SRS.
Elements are not samples independently in most surveys as one may need to select groups of
individual.
Survey Designs
Survey Designs
► Stratification
The entire studied population is divided into well-defined groups called “strata” based
on a relevant characteristic often based on geographically (region) or demographic
variables (gender, level of education or SES).
Sampling units are independently and randomly sampled from within each stratum with
different probability of selection.
It is usually results in smaller variance and standard errors than that of SRS.
An example is to stratify the population by locality (urban/rural).
Survey Designs
► Clustering
Set of individuals (regions, districts, city blocks or households) are sampled as a group (cluster)
then population elements are drawn from the selected cluster.
Further subsamples within cluster may be drawn (often called multi-stage design).
The highest level of cluster is referred to as Primary Sampling Unit (PSU)
The lower level of cluster is referred to as Secondary Sampling Unit (SSU)
An example when geographical regions, such as local government areas, are selected in the
first stage. In the second stage schools were selected. In the third stage, the unit of analysis -
perhaps teachers or students are sampled. Regions represent PSUs in this example.
Different sample techniques may be applied at different stages which increase sample-to-
sample variability and lead to higher variance and standard errors.
Survey Designs
► Exercise
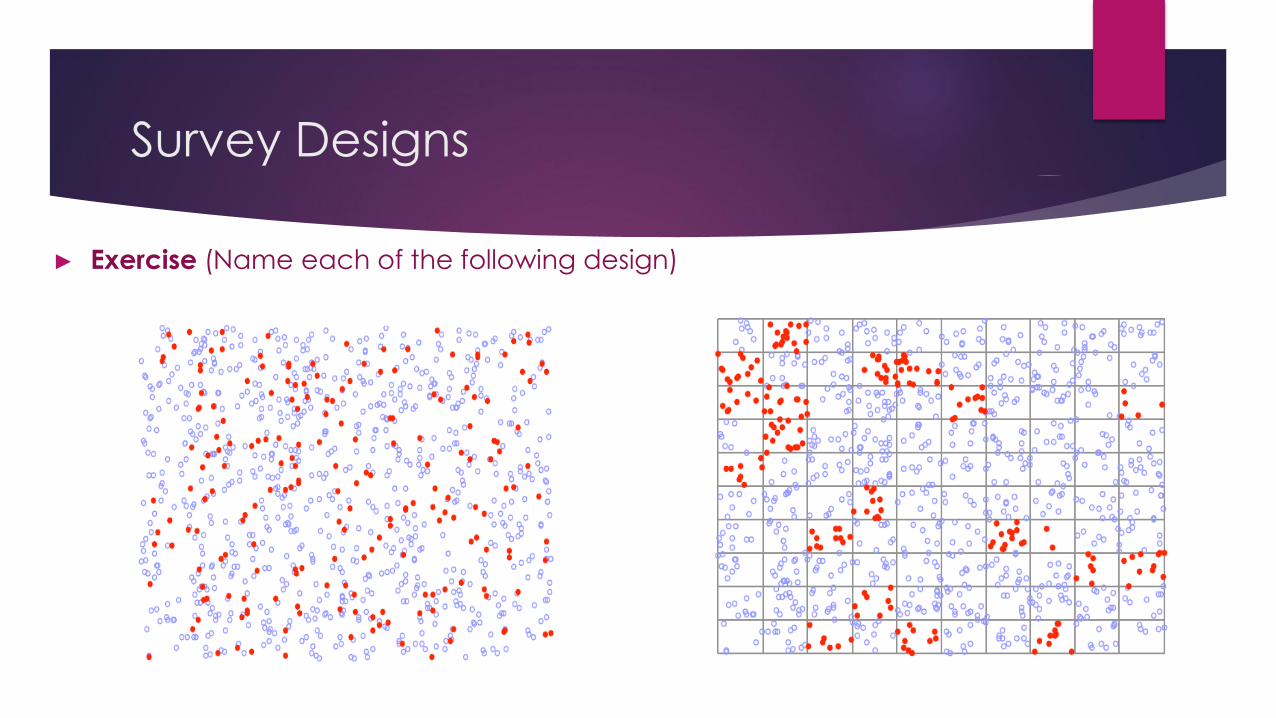
Survey Designs
► Exercise (Name each of the following design)
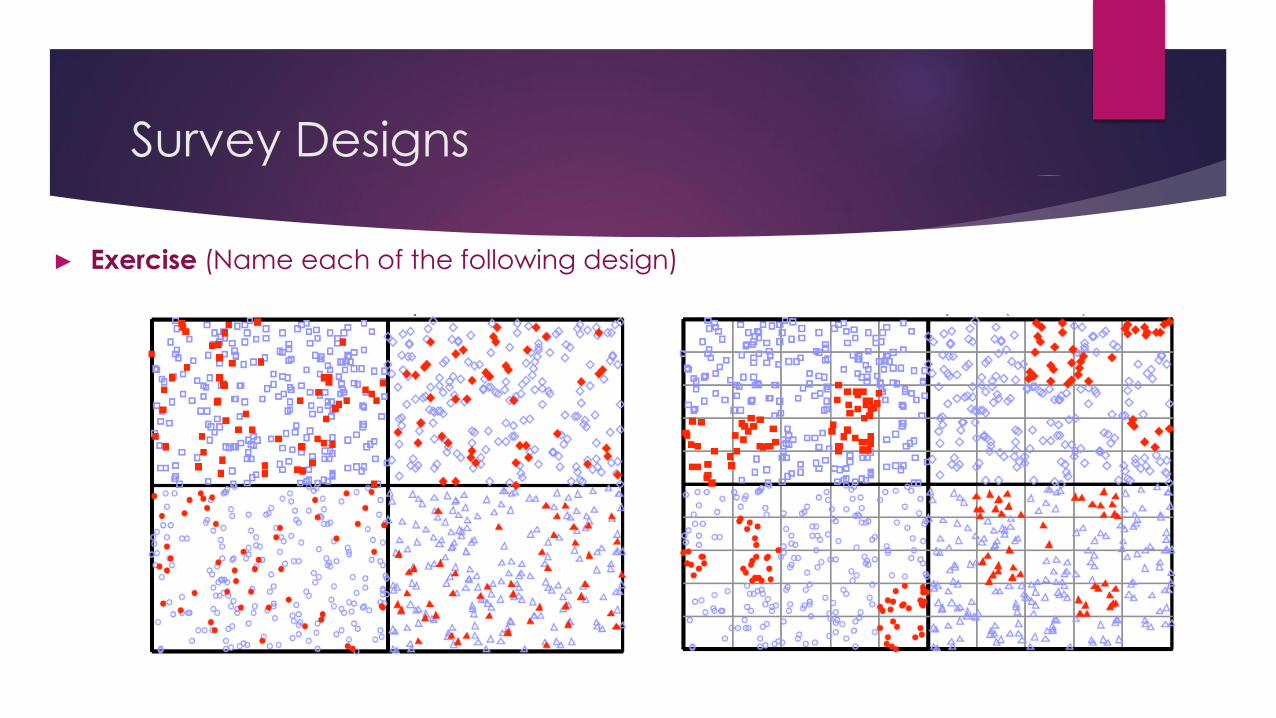
Survey Designs
► Exercise (Name each of the following design)
Survey Designs
► Features of survey designs
Probability (sample) weights
The most common is the sampling weight (aka probability weight) which is used to weight the
sample back to the population from which the sample was drawn.
By definition, this weight is the inverse of the sample fraction (N/n).
In a two-stage design, the probability weight is calculated as f1f2, which means that the inverse of
the sampling fraction for the first stage is multiplied by the inverse of the sampling fraction for the
second stage.
In actual survey data sets, the "final weight" usually starts with the inverse of the sampling fraction,
then several adjustments may be applied to account for sampling design problems such as unit
non-response, errors in the sampling frame (aka non-coverage) or post-stratification.
Survey Designs
► Features of survey designs
Finite population correction (FPC)
It is an adjustment applied to the variance due to sampling without replacement from finite
population. Based on central limit theorem, FPC is calculated as:
FPC = [ (N-n)/(N-1) ]1/2.
PC is usually applied when sample fraction (n/N) is large otherwise when n is small relative to
the population size N, the FPC is almost close to 1, it will have a little impact and can be
safely ignored.
For multi-stage survey design, one may apply FPC at one or more stages.
Survey Designs
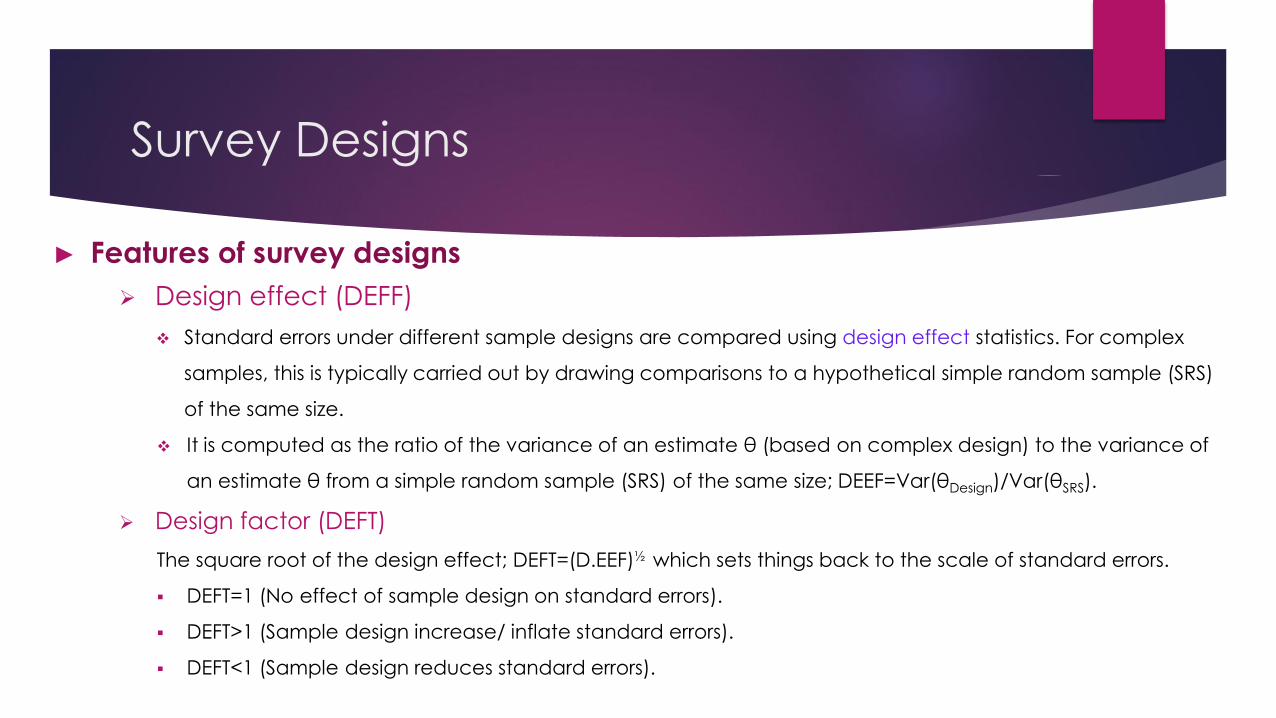
► Features of survey designs
Design effect (DEFF)
Standard errors under different sample designs are compared using design effect statistics. For complex
samples, this is typically carried out by drawing comparisons to a hypothetical simple random sample (SRS)
of the same size.
It is computed as the ratio of the variance of an estimate θ (based on complex design) to the variance of
an estimate θ from a simple random sample (SRS) of the same size; DEEF=Var(θDesign)/Var(θSRS).
Design factor (DEFT)
The square root of the design effect; DEFT=(D.EEF)½ which sets things back to the scale of standard errors.
DEFT=1 (No effect of sample design on standard errors).
DEFT>1 (Sample design increase/ inflate standard errors).
DEFT<1 (Sample design reduces standard errors).
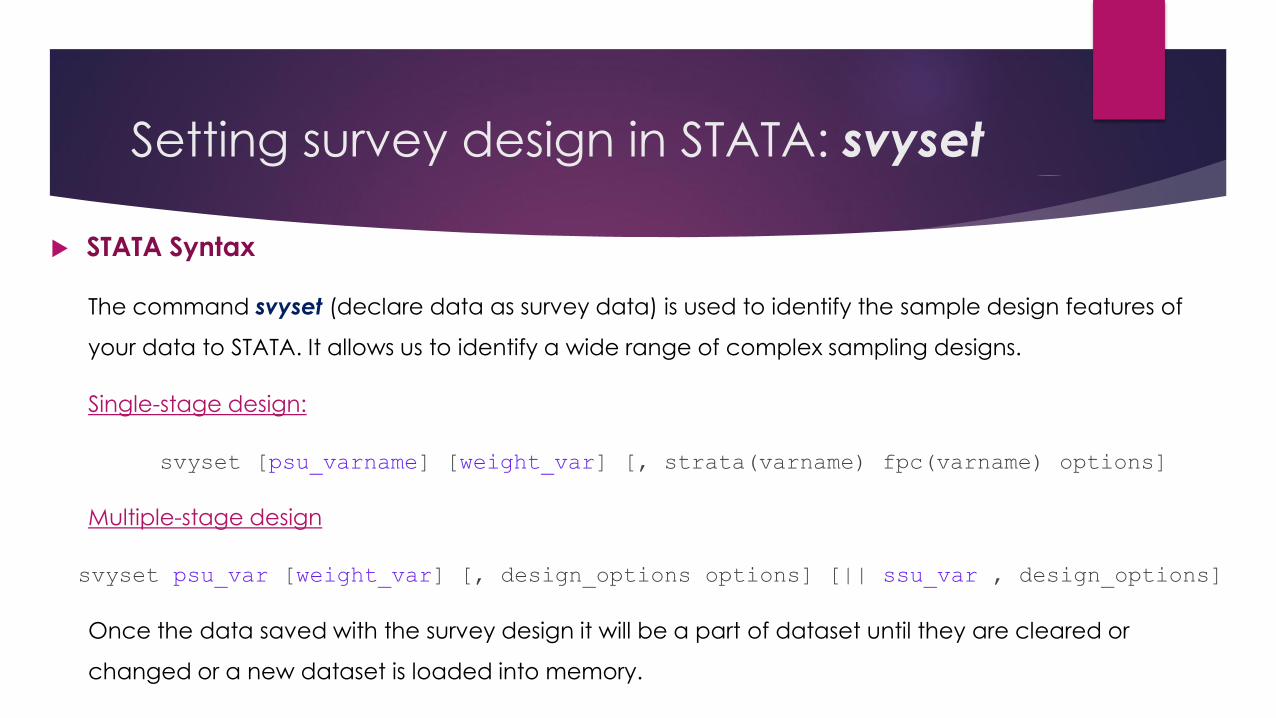
Setting survey design in STATA: svyset
STATA Syntax
The command svyset (declare data as survey data) is used to identify the sample design features of
your data to STATA. It allows us to identify a wide range of complex sampling designs.
Single-stage design:
svyset [psu_varname] [weight_var] [, strata(varname) fpc(varname) options]
Multiple-stage design
svyset psu_var [weight_var] [, design_options options] [|| ssu_var , design_options]
Once the data saved with the survey design it will be a part of dataset until they are cleared or
changed or a new dataset is loaded into memory.
Setting survey design in STATA: svyset
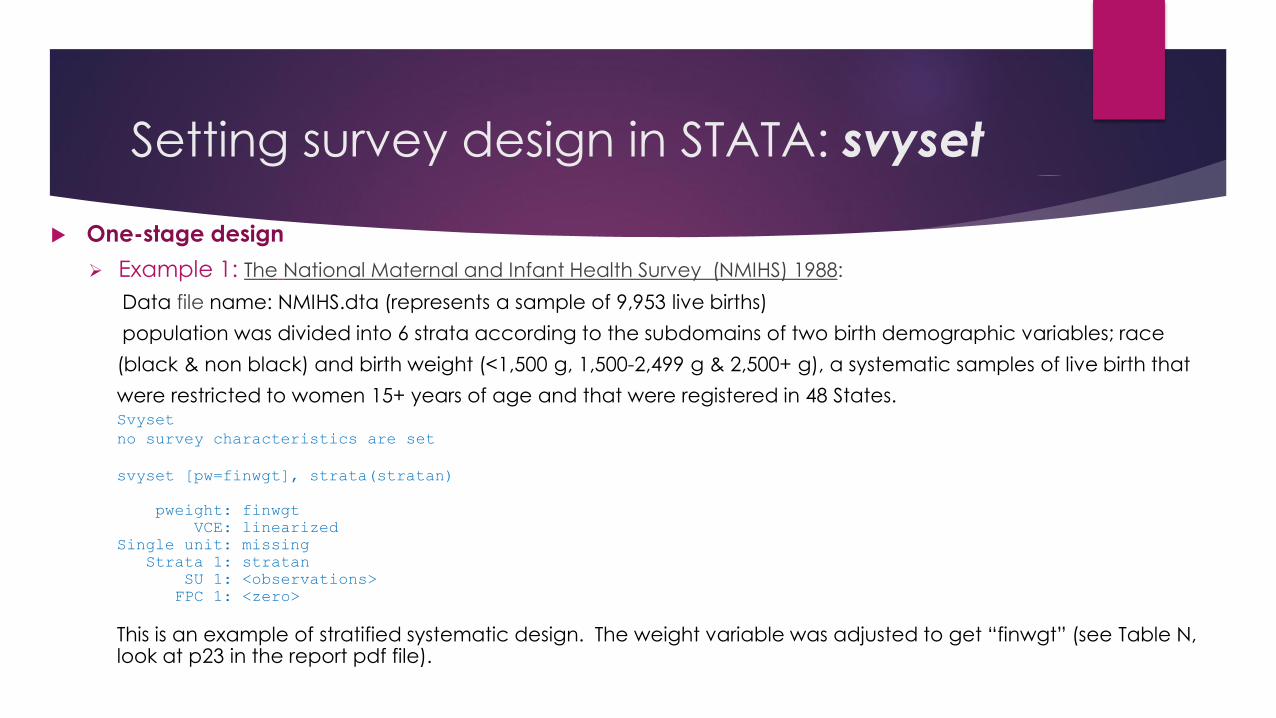
One-stage design
Example 1: The National Maternal and Infant Health Survey (NMIHS) 1988:
Data file name: NMIHS.dta (represents a sample of 9,953 live births)
population was divided into 6 strata according to the subdomains of two birth demographic variables; race
(black & non black) and birth weight (<1,500 g, 1,500-2,499 g & 2,500+ g), a systematic samples of live birth that
were restricted to women 15+ years of age and that were registered in 48 States.Svyset
no survey characteristics are set
svyset [pw=finwgt], strata(stratan)
pweight: finwgt
VCE: linearized
Single unit: missing
Strata 1: stratan
SU 1: <observations>
FPC 1: <zero>
This is an example of stratified systematic design. The weight variable was adjusted to get “finwgt” (see Table N, look at p23 in the report pdf file).
Setting survey design in STATA: svyset
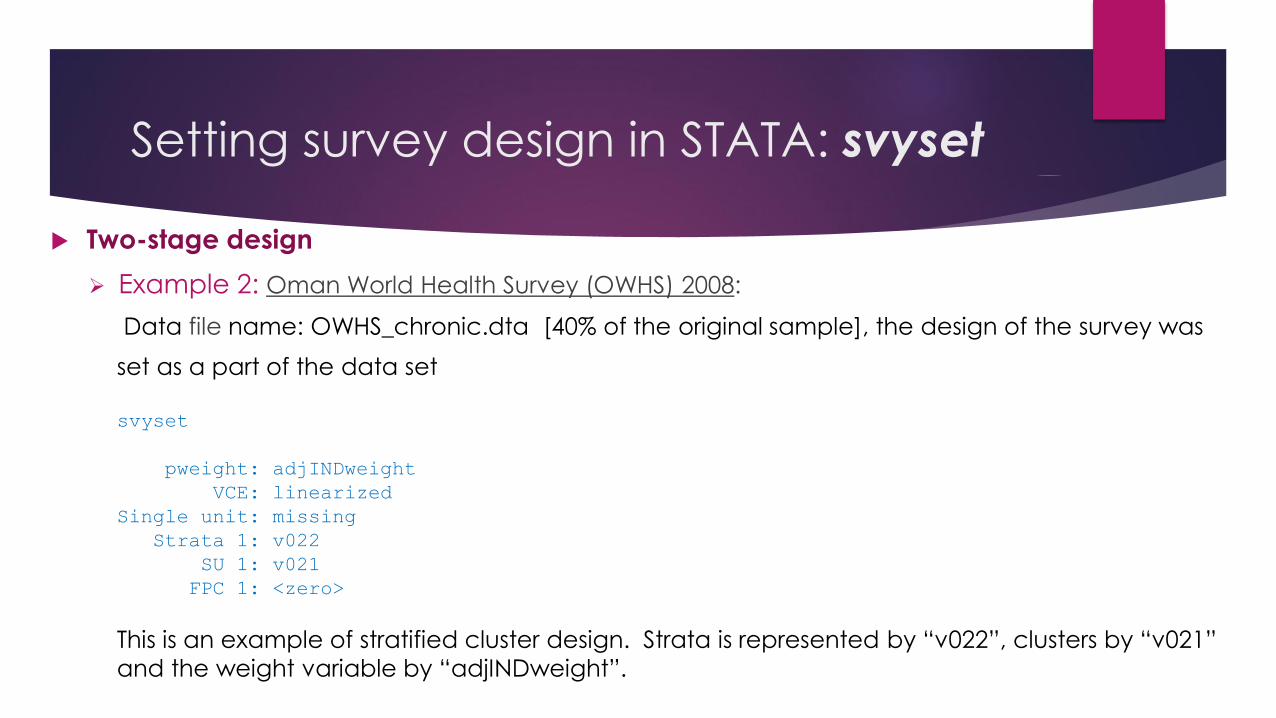
Two-stage design
Example 2: Oman World Health Survey (OWHS) 2008:
Data file name: OWHS_chronic.dta [40% of the original sample], the design of the survey was
set as a part of the data set
svyset
pweight: adjINDweight
VCE: linearized
Single unit: missing
Strata 1: v022
SU 1: v021
FPC 1: <zero>
This is an example of stratified cluster design. Strata is represented by “v022”, clusters by “v021”
and the weight variable by “adjINDweight”.
Setting survey design in STATA: svyset
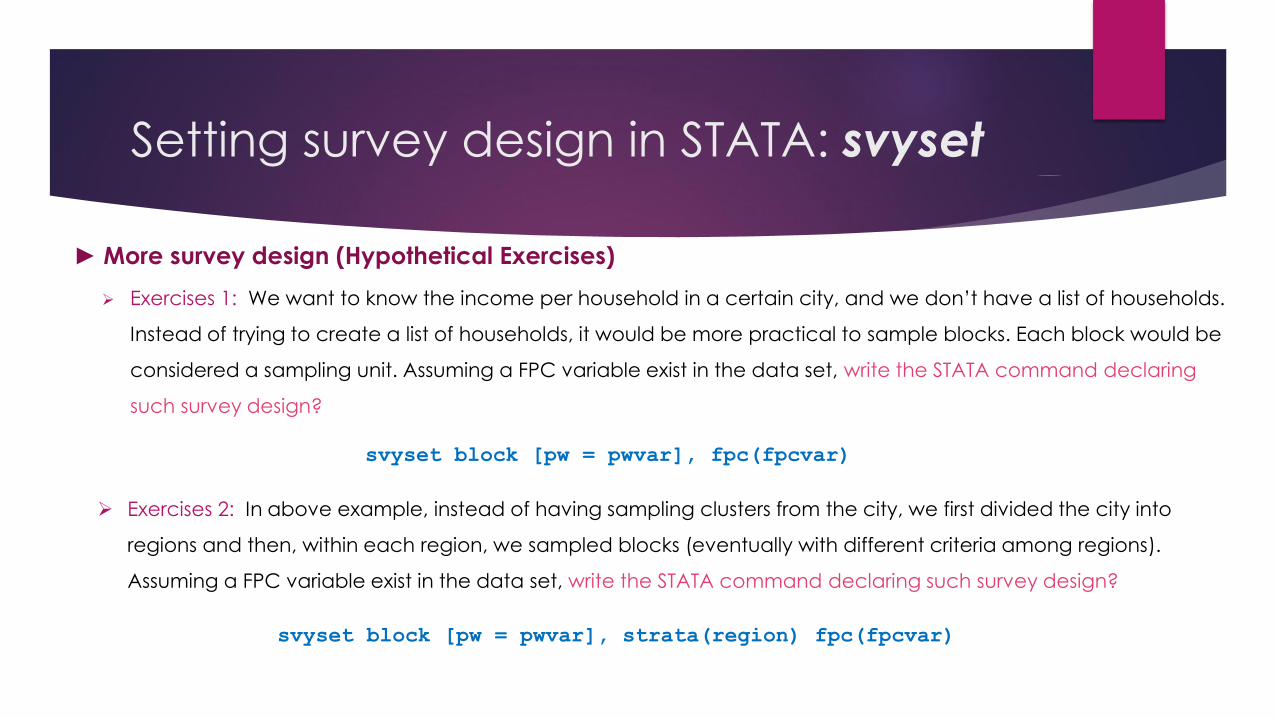
Exercises 1: We want to know the income per household in a certain city, and we don’t have a list of households.
Instead of trying to create a list of households, it would be more practical to sample blocks. Each block would be
considered a sampling unit. Assuming a FPC variable exist in the data set, write the STATA command declaring
such survey design?
Exercises 2: In above example, instead of having sampling clusters from the city, we first divided the city into
regions and then, within each region, we sampled blocks (eventually with different criteria among regions).
Assuming a FPC variable exist in the data set, write the STATA command declaring such survey design?
► More survey design (Hypothetical Exercises)
svyset block [pw = pwvar], fpc(fpcvar)
svyset block [pw = pwvar], strata(region) fpc(fpcvar)
Setting survey design in STATA: svyset
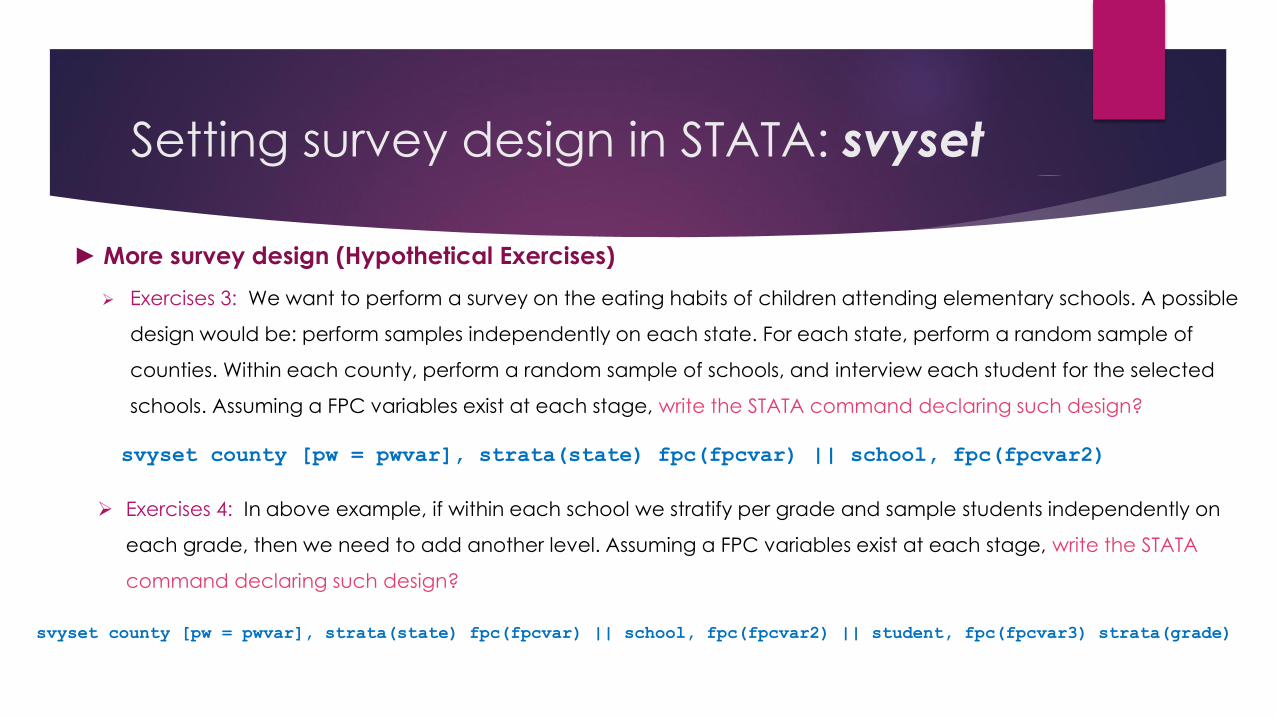
Exercises 3: We want to perform a survey on the eating habits of children attending elementary schools. A possible
design would be: perform samples independently on each state. For each state, perform a random sample of
counties. Within each county, perform a random sample of schools, and interview each student for the selected
schools. Assuming a FPC variables exist at each stage, write the STATA command declaring such design?
Exercises 4: In above example, if within each school we stratify per grade and sample students independently on
each grade, then we need to add another level. Assuming a FPC variables exist at each stage, write the STATA
command declaring such design?
► More survey design (Hypothetical Exercises)
svyset county [pw = pwvar], strata(state) fpc(fpcvar) || school, fpc(fpcvar2)
svyset county [pw = pwvar], strata(state) fpc(fpcvar) || school, fpc(fpcvar2) || student, fpc(fpcvar3) strata(grade)
Describing survey design: svydes
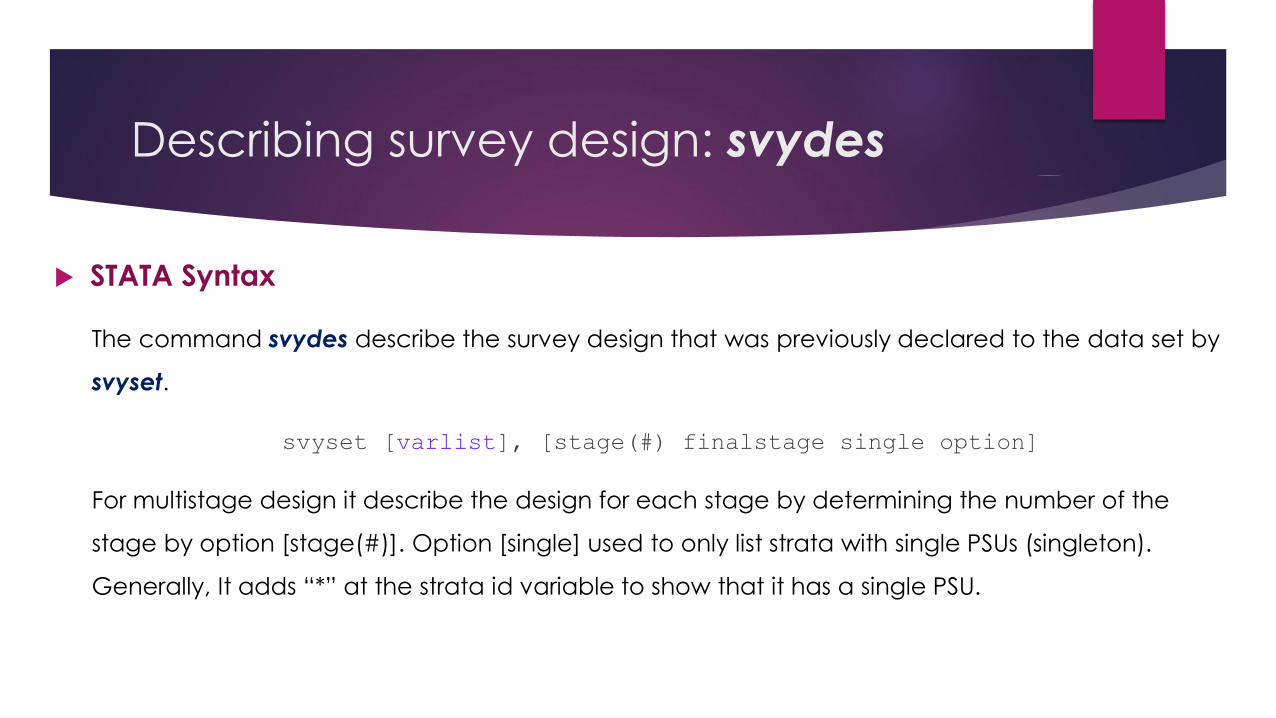
STATA Syntax
The command svydes describe the survey design that was previously declared to the data set by
svyset.
svyset [varlist], [stage(#) finalstage single option]
For multistage design it describe the design for each stage by determining the number of the
stage by option [stage(#)]. Option [single] used to only list strata with single PSUs (singleton).
Generally, It adds “*” at the strata id variable to show that it has a single PSU.
Describing survey design: svydes
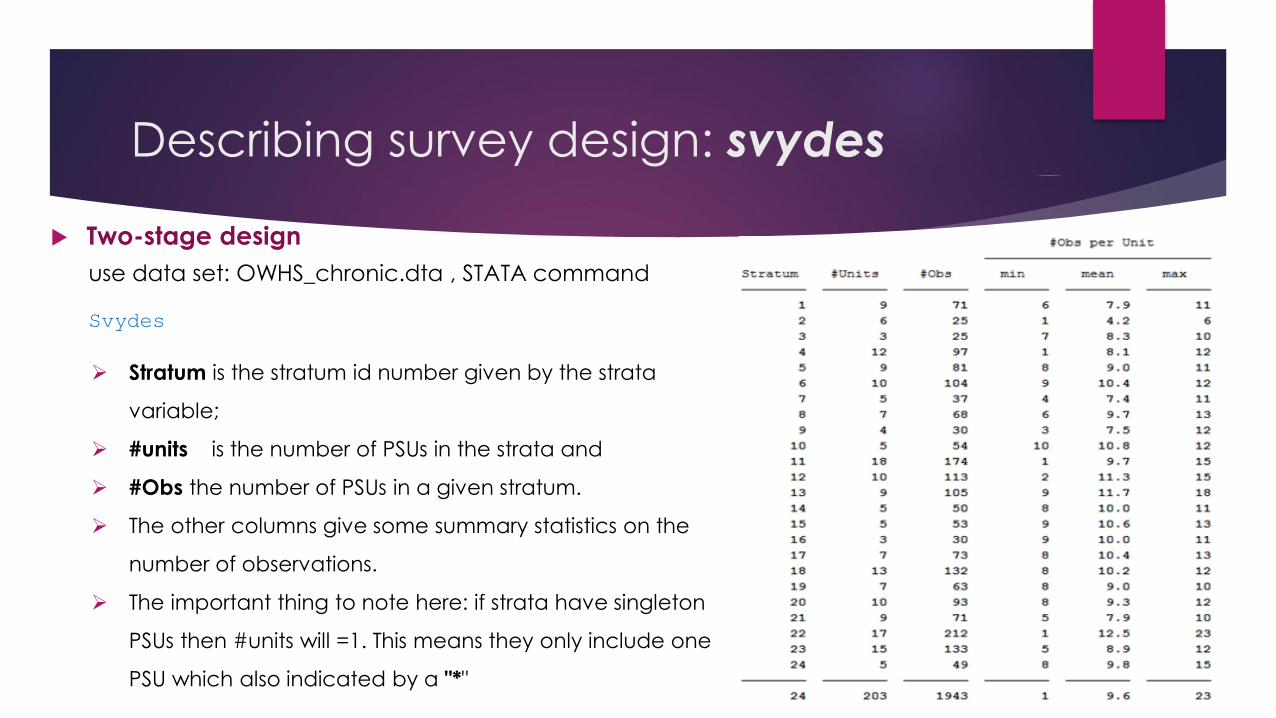
Two-stage design
use data set: OWHS_chronic.dta , STATA command
Svydes
Stratum is the stratum id number given by the strata
variable;
#units is the number of PSUs in the strata and
#Obs the number of PSUs in a given stratum.
The other columns give some summary statistics on the
number of observations.
The important thing to note here: if strata have singleton
PSUs then #units will =1. This means they only include one
PSU which also indicated by a "*"