
Using Soils Data to Map The Challenges of Eco Engineering ...
51
The Challenges of Eco Engineering: Making the Using Soils Data to Map “Natural” Floodplains Kevin Coulton, P.E., CFM cbec eco engineering ASCE EWRG Section Meeting February 26, 2014
Transcript of Using Soils Data to Map The Challenges of Eco Engineering ...
The Challenges of Eco Engineering: Making the Connections Between Engineering and Ecology
Chris Bowles, Ph.D., P.E., cbec eco engineering
CWEMF
April 24, 2013
Using Soils Data to Map “Natural” Floodplains
Kevin Coulton, P.E., CFM cbec eco engineering
ASCE EWRG Section Meeting
February 26, 2014
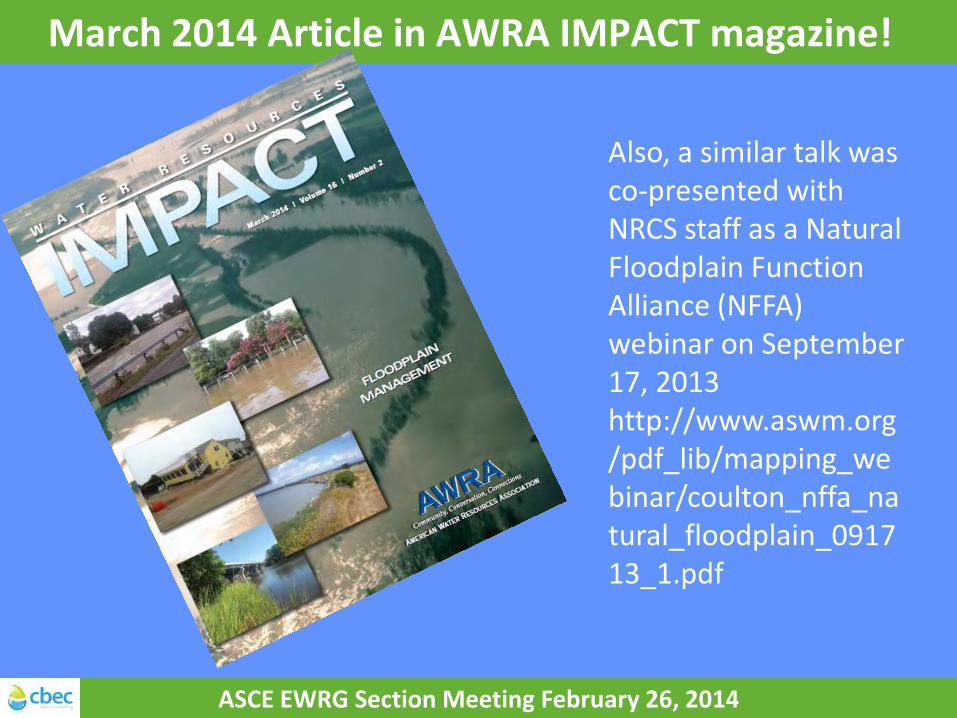
March 2014 Article in AWRA IMPACT magazine!
ASCE EWRG Section Meeting February 26, 2014
Also, a similar talk was co-presented with NRCS staff as a Natural Floodplain Function Alliance (NFFA) webinar on September 17, 2013 http://www.aswm.org/pdf_lib/mapping_webinar/coulton_nffa_natural_floodplain_091713_1.pdf
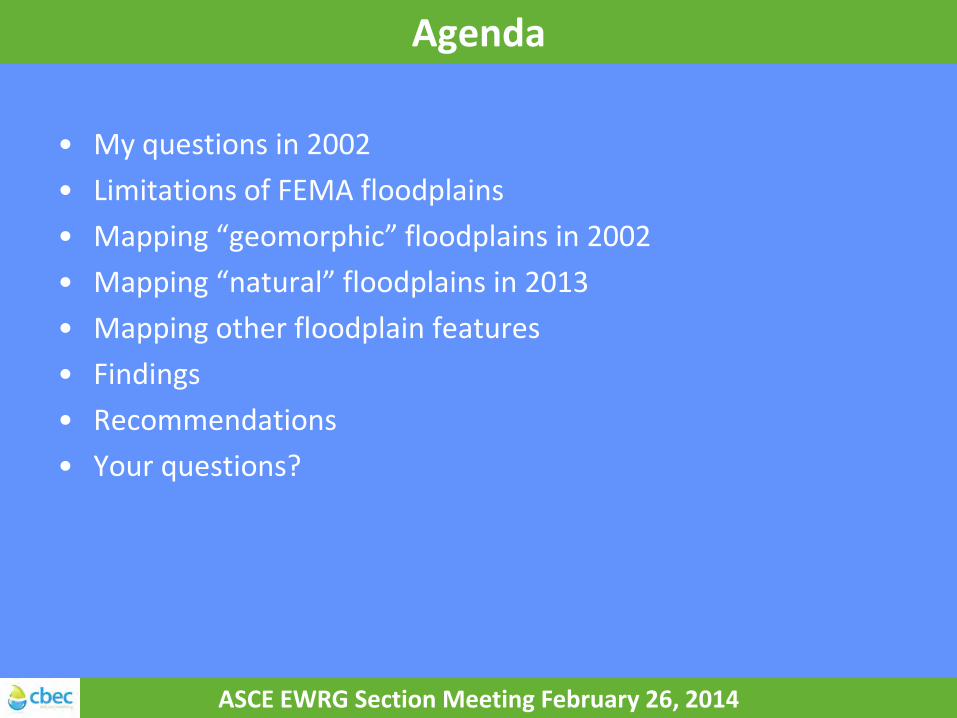
Agenda
• My questions in 2002 • Limitations of FEMA floodplains • Mapping “geomorphic” floodplains in 2002 • Mapping “natural” floodplains in 2013 • Mapping other floodplain features • Findings • Recommendations • Your questions?
ASCE EWRG Section Meeting February 26, 2014
ASCE EWRG Section Meeting February 26, 2014
My Questions in 2002
• Is there a way to visualize the natural expression of flooding across the landscape, ignoring the land cover disruptions caused by human interventions?
• If so, how do you delineate these “natural” floodplains?
• How would these “natural” floodplains compare and contrast to the floodplains mapped by FEMA?
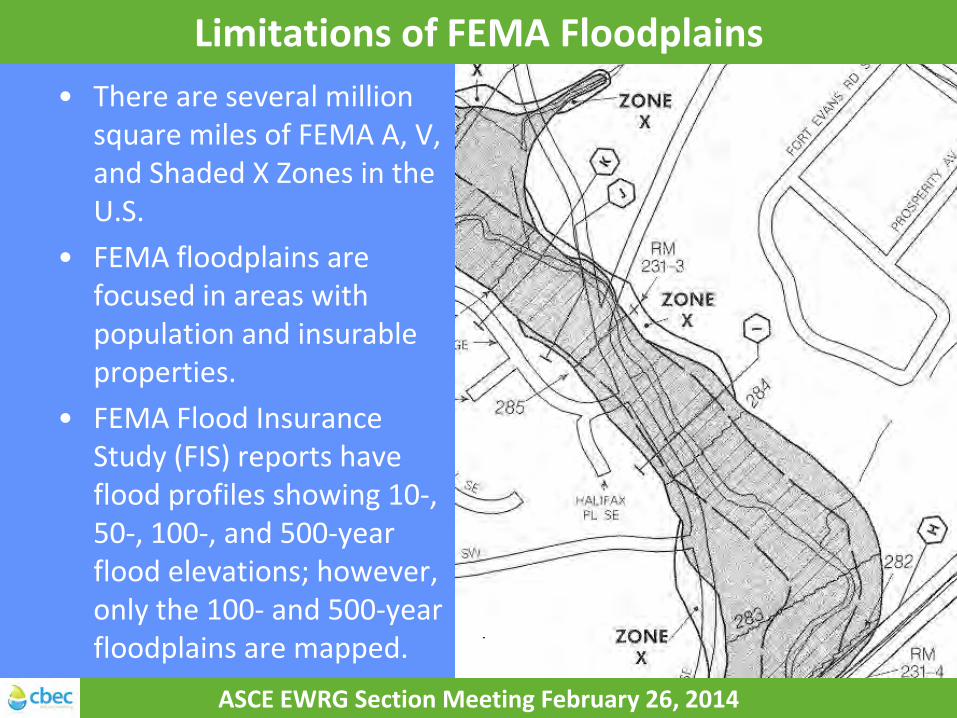
Limitations of FEMA Floodplains • There are several million
square miles of FEMA A, V, and Shaded X Zones in the U.S.
• FEMA floodplains are focused in areas with population and insurable properties.
• FEMA Flood Insurance Study (FIS) reports have flood profiles showing 10-, 50-, 100-, and 500-year flood elevations; however, only the 100- and 500-year floodplains are mapped.
ASCE EWRG Section Meeting February 26, 2014

Mapping “Geomorphic” Floodplains in 2002 • “Geomorphic” floodplains can be
defined by soils subject to flooding.
• Soils data were retrieved from State Soil Geographic Data Base (STATSGO) derived from 1:250,000 scale soils maps.
• These data are coarse and for planning purposes only; i.e., for use above the county level.
ASCE EWRG Section Meeting February 26, 2014
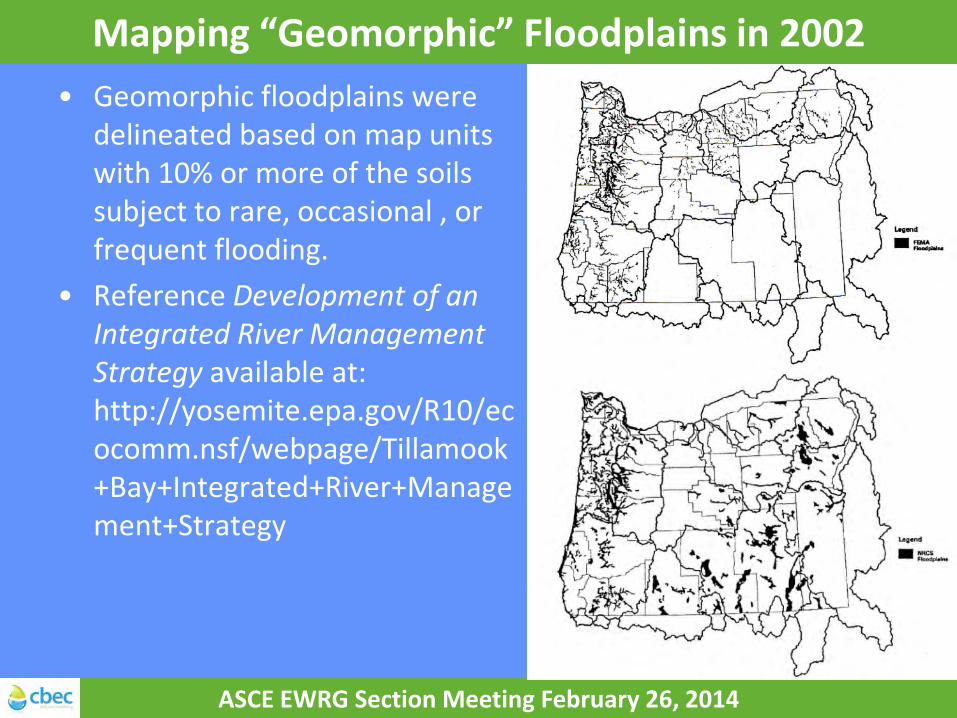
Mapping “Geomorphic” Floodplains in 2002 • Geomorphic floodplains were
delineated based on map units with 10% or more of the soils subject to rare, occasional , or frequent flooding.
• Reference Development of an Integrated River Management Strategy available at: http://yosemite.epa.gov/R10/ecocomm.nsf/webpage/Tillamook+Bay+Integrated+River+Management+Strategy
ASCE EWRG Section Meeting February 26, 2014
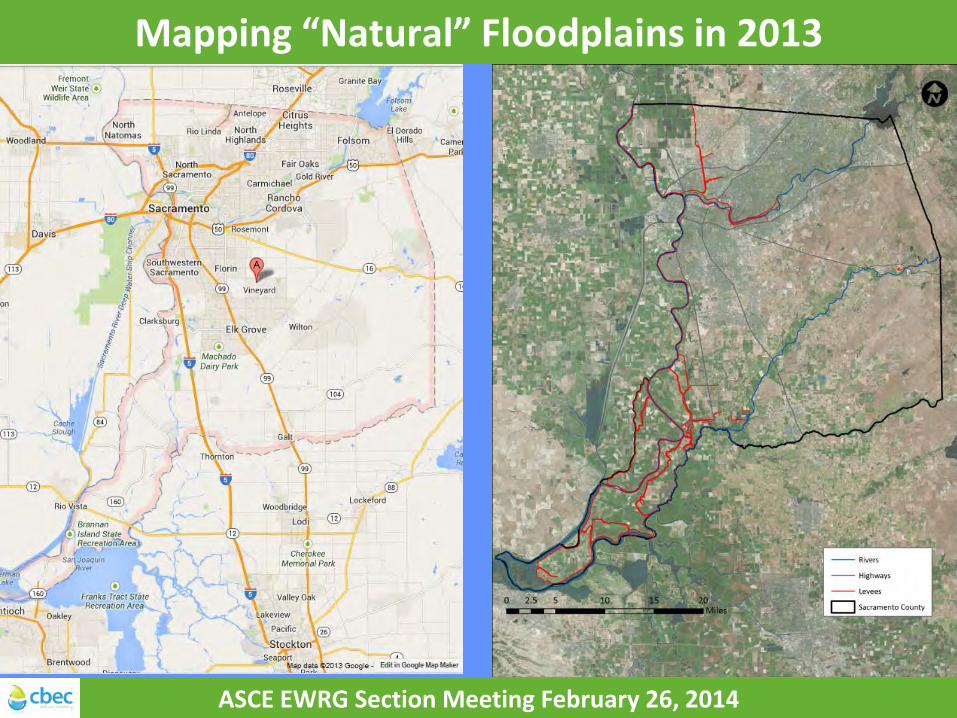
Mapping “Natural” Floodplains in 2013
ASCE EWRG Section Meeting February 26, 2014
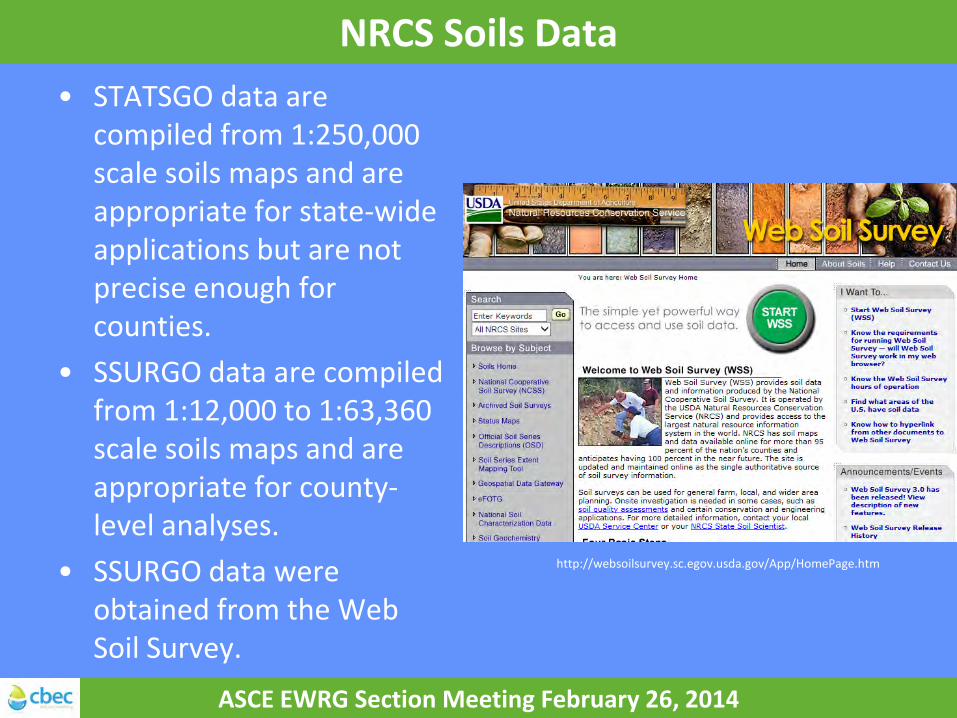
NRCS Soils Data • STATSGO data are
compiled from 1:250,000 scale soils maps and are appropriate for state-wide applications but are not precise enough for counties.
• SSURGO data are compiled from 1:12,000 to 1:63,360 scale soils maps and are appropriate for county-level analyses.
• SSURGO data were obtained from the Web Soil Survey. ASCE EWRG Section Meeting February 26, 2014
http://websoilsurvey.sc.egov.usda.gov/App/HomePage.htm
ASCE EWRG Section Meeting February 26, 2014
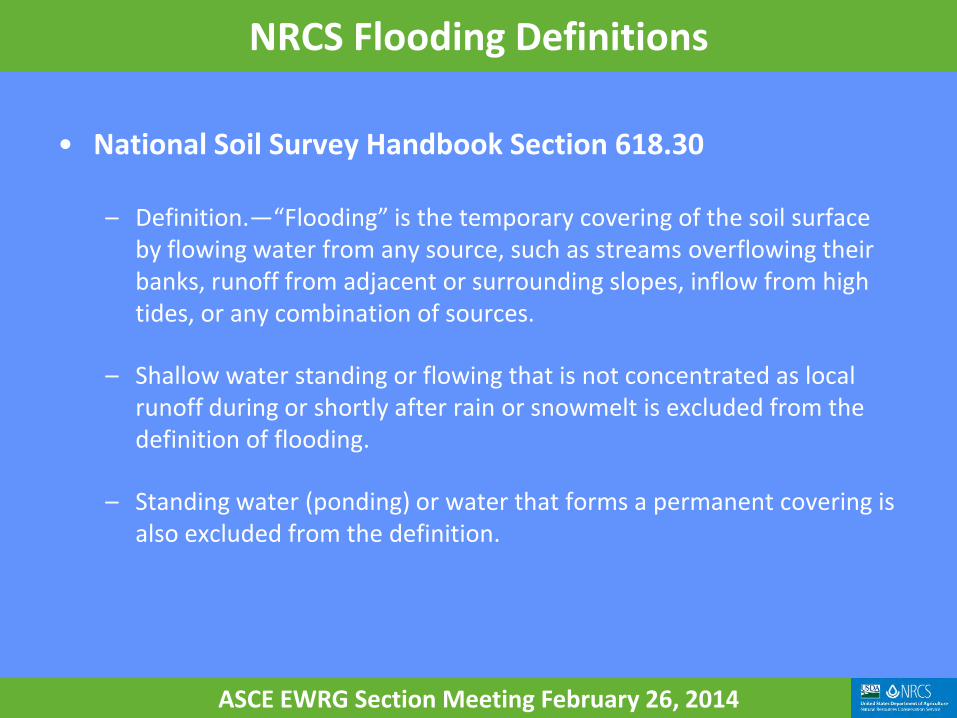
NRCS Flooding Definitions
• National Soil Survey Handbook Section 618.30
– Definition.—“Flooding” is the temporary covering of the soil surface by flowing water from any source, such as streams overflowing their banks, runoff from adjacent or surrounding slopes, inflow from high tides, or any combination of sources.
– Shallow water standing or flowing that is not concentrated as local runoff during or shortly after rain or snowmelt is excluded from the definition of flooding.
– Standing water (ponding) or water that forms a permanent covering is also excluded from the definition.

NRCS Flooding Frequency Class
Flooding Frequency Class Definition
None No reasonable possibility of flooding; one chance out of 500 of flooding in any year or less than 1 time in 500 years.
Very rare Flooding is very unlikely but is possible under extremely unusual weather conditions; less than 1 percent chance of flooding in any year or less than 1 time in 100 years but more than 1 time in 500 years.
Rare Flooding is unlikely but is possible under unusual weather conditions; 1 to 5 percent chance of flooding in any year or nearly 1 to 5 times in 100 years
Occasional Flooding is expected infrequently under usual weather conditions; 5 to 50 percent chance of flooding in any year or 5 to 50 times in 100 years.
Frequent Flooding is likely to occur often under usual weather conditions; more than a 50 percent chance of flooding in any year (i.e., 50 times in 100 years), but less than a 50 percent chance of flooding in all months in any year.
Very frequent Flooding is likely to occur very often under usual weather conditions; more than a 50 percent chance of flooding in all months of any year.
ASCE EWRG Section Meeting February 26, 2014

NRCS Flooding Duration Class
Flooding Duration Class Duration
Extremely brief 0.1 to 4 hours
Very brief 4 hours to < 2 days
Brief 2 days to < 7 days
Long 7 days to < 30 days
Very long > 30 days
ASCE EWRG Section Meeting February 26, 2014

Field Observed Clues to Flooded Soils
• Extent of flooded areas, flood debris in trees, damage to fences and bridges, and other signs of maximum water height are recorded
• Aerial photographs showing former river channels, oxbows, point bars, alluvial fans, meander scrolls, sloughs, natural levees, backswamps, sand splays, and terraces
• Vegetation that grows in flood areas may furnish clues to past flooding • Thin strata of material of contrasting color, texture, or both • An irregular decrease in organic matter content, not due to human-alteration by mixing or
transportation of material, which is an indication of a buried genetic surface horizon • Soil layers that have abrupt boundaries to contrasting kinds of material, which indicate that
the materials were laid down suddenly at different times and were from different sources or were deposited from stream flows of different velocities
• Laboratory analyses of properly sampled layers are often helpful in verifying these observations. Organic carbon and particle-size analyses are particularly useful in verifying flood deposits.
• Microscopic observations may detect preferential horizontal orientation of plate-like particles; microlayering, which indicates water-laid deposits; or mineralogical differences between layers.
ASCE EWRG Section Meeting February 26, 2014

FEMA Flood Zone Data • Flood zones are geographic
areas that FEMA has defined according to varying types of flood hazards.
• These zones are depicted on a community's Flood Insurance Rate Map (FIRM) or Flood Hazard Boundary Map. Each zone reflects the severity or type of flooding in the area.
• This study focused on A Zones (100-year) and Shaded X Zones (500-year).
ASCE EWRG Section Meeting February 26, 2014
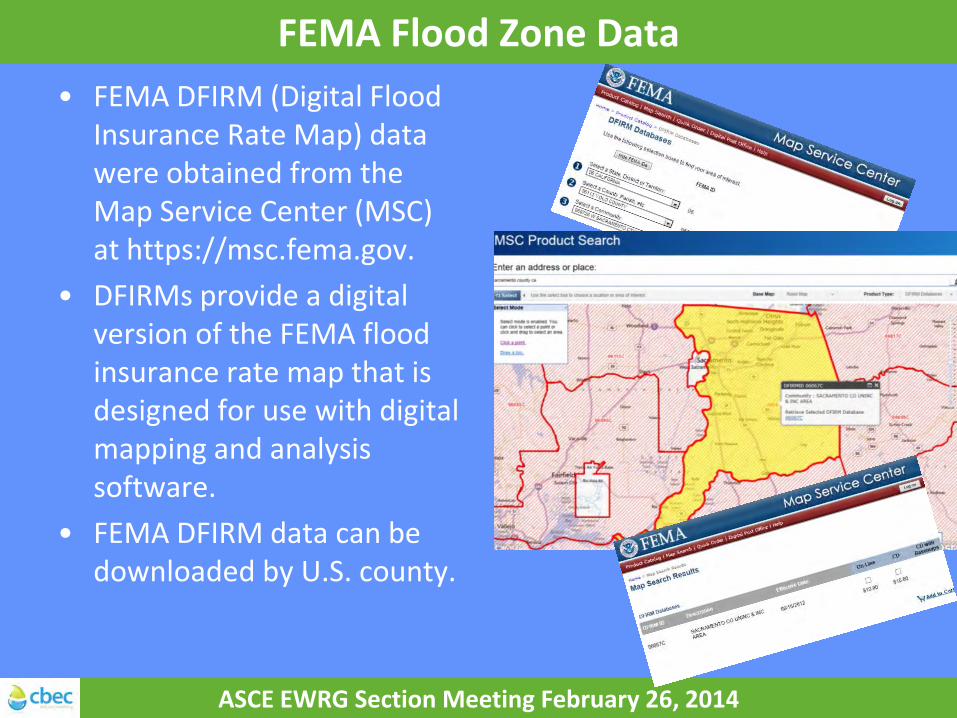
FEMA Flood Zone Data • FEMA DFIRM (Digital Flood
Insurance Rate Map) data were obtained from the Map Service Center (MSC) at https://msc.fema.gov.
• DFIRMs provide a digital version of the FEMA flood insurance rate map that is designed for use with digital mapping and analysis software.
• FEMA DFIRM data can be downloaded by U.S. county.
ASCE EWRG Section Meeting February 26, 2014

Sacramento County Soils Data • xx
ASCE EWRG Section Meeting February 26, 2014
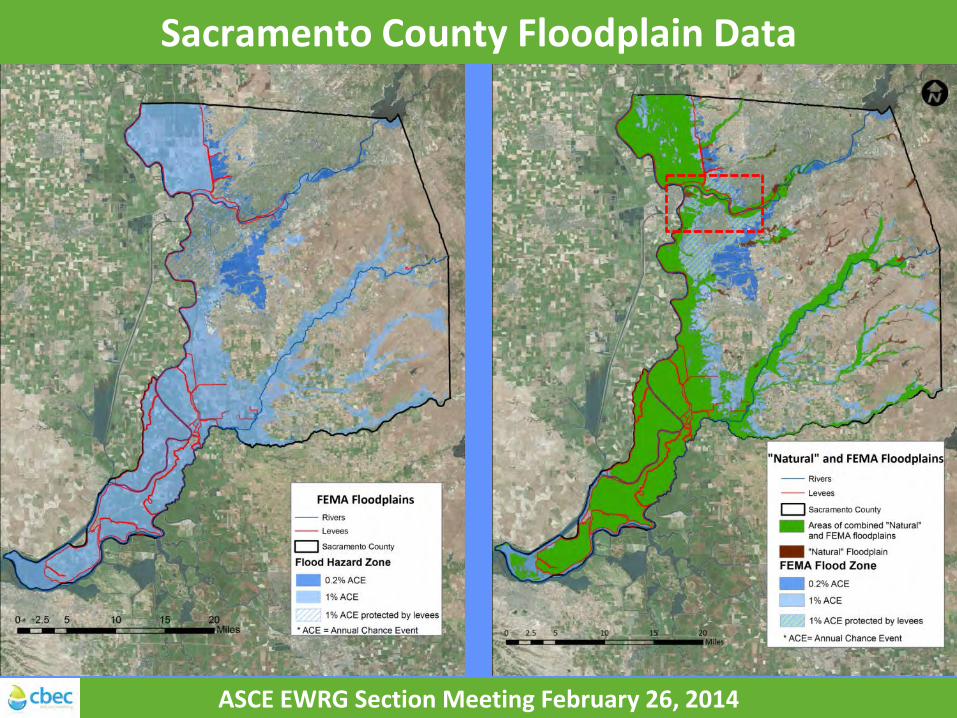
Sacramento County Floodplain Data • xx
ASCE EWRG Section Meeting February 26, 2014
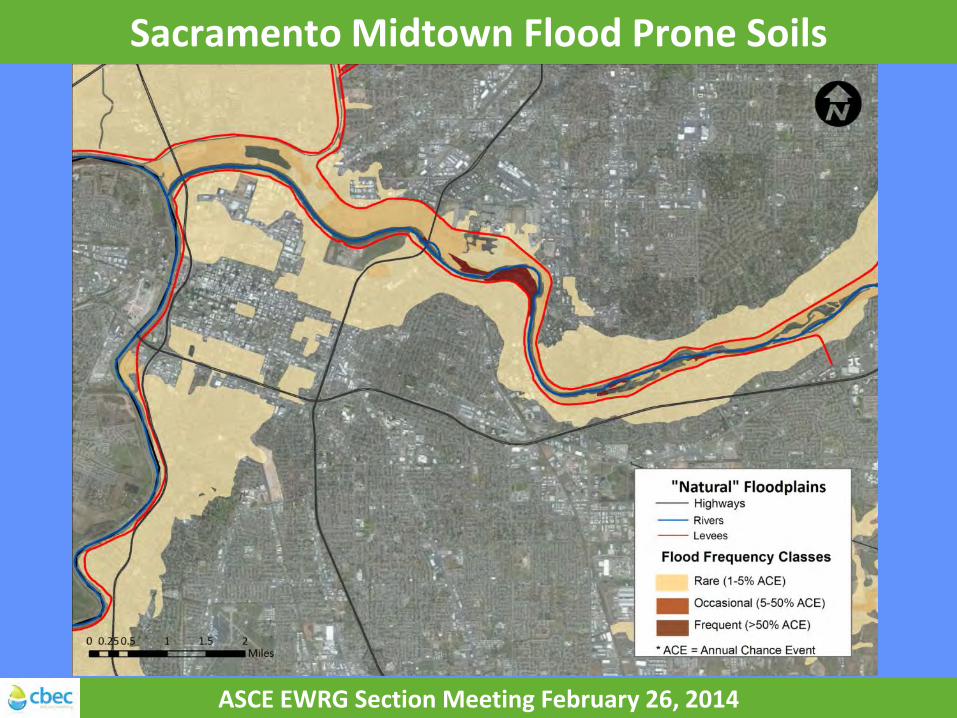
Sacramento Midtown Flood Prone Soils
ASCE EWRG Section Meeting February 26, 2014
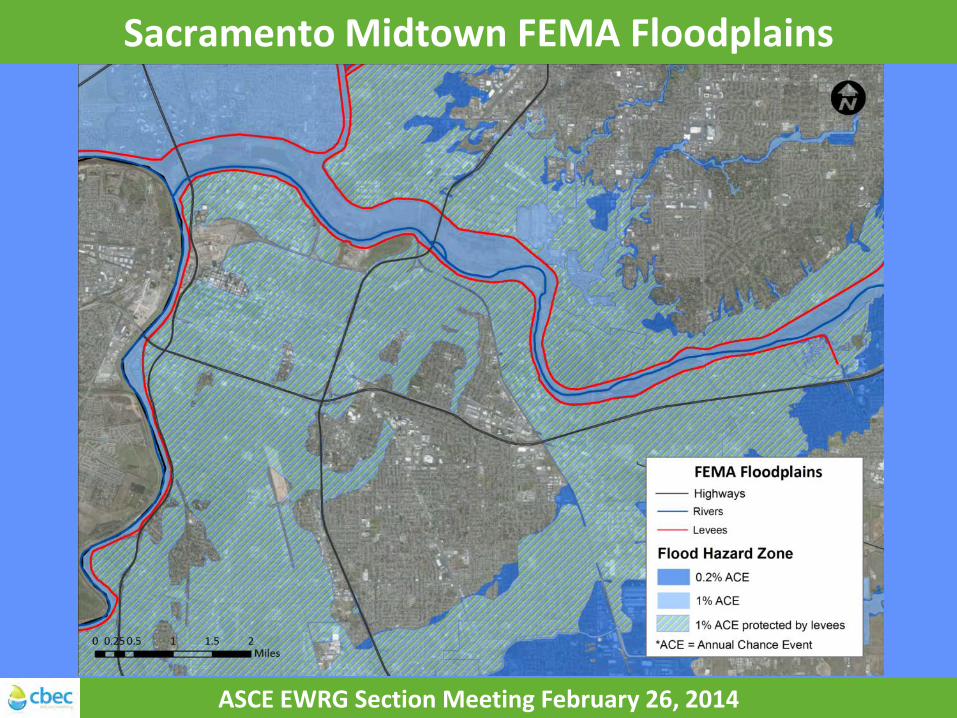
Sacramento Midtown FEMA Floodplains
ASCE EWRG Section Meeting February 26, 2014
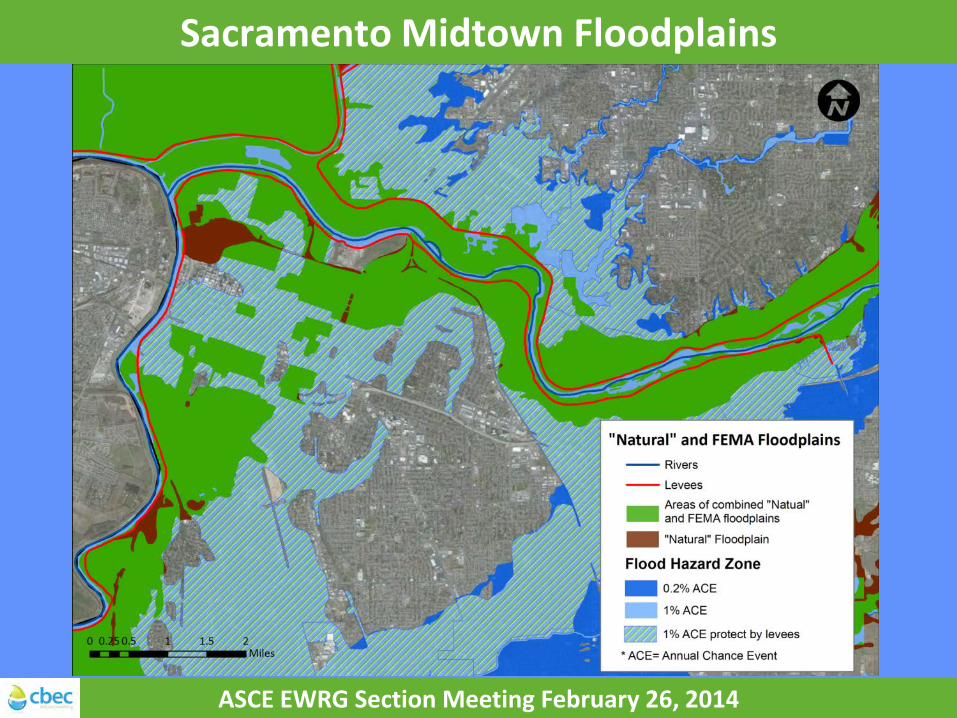
Sacramento Midtown Floodplains
ASCE EWRG Section Meeting February 26, 2014
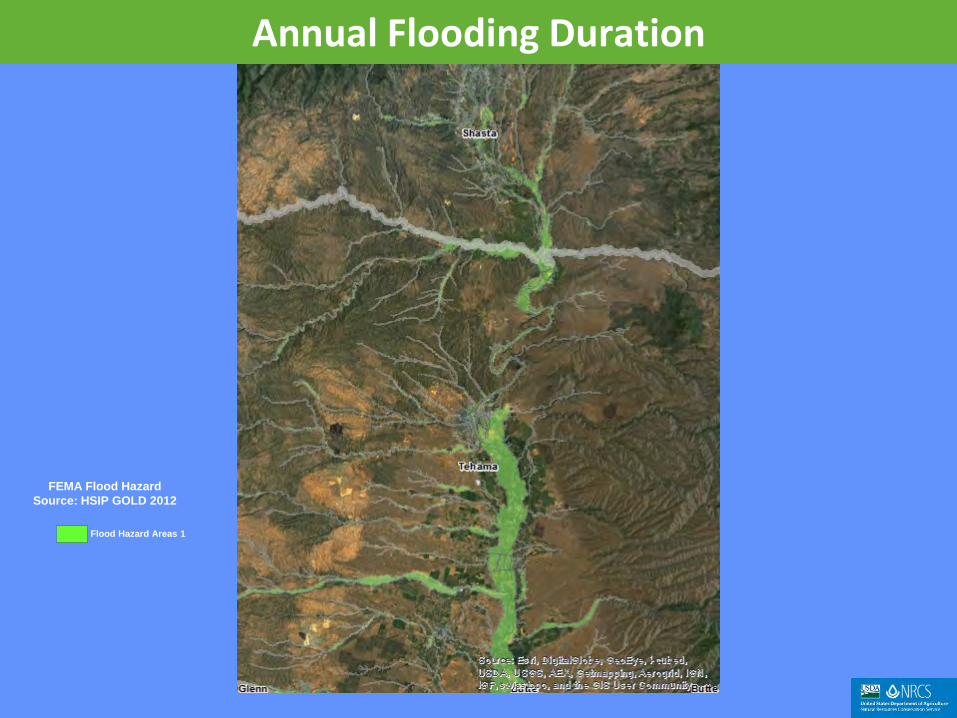
Soil Flooding Frequency and Duration Example
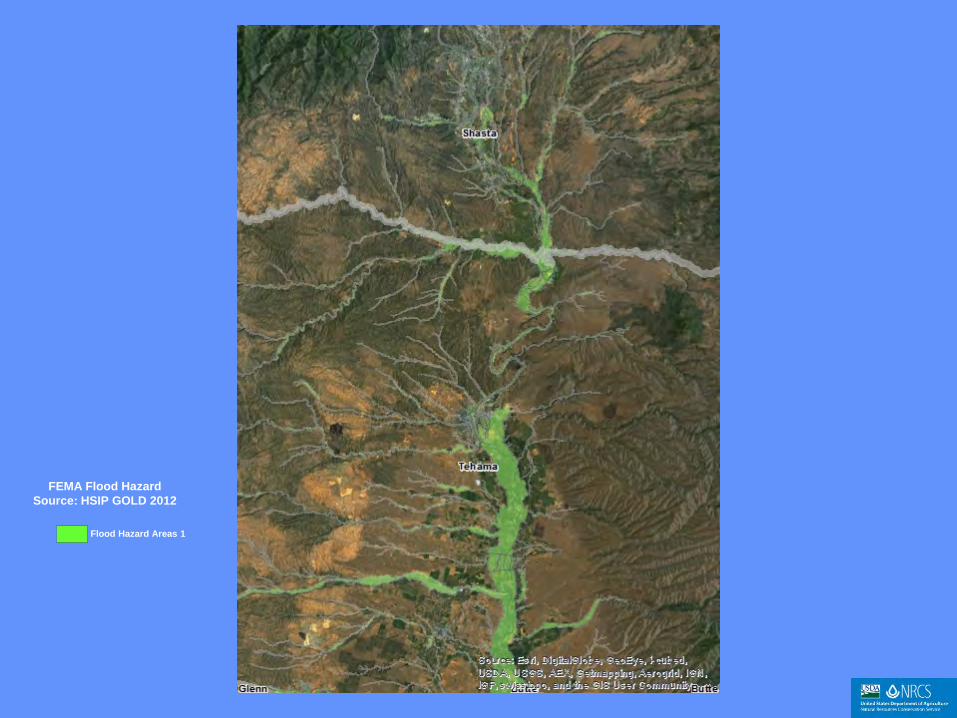
FEMA Flood Hazard Source: HSIP GOLD 2012
Flood Hazard Areas 1

Flooding Frequency and Duration
Flooding Frequency and Duration relative to Soil Climate
Rainfall occurs mostly in the winter months for Xeric or Mediterranean Soil Moisture Regime

January
Annual Flooding Frequency Class
Frequent
Occasional
Rare
Very frequent
Very rare

February
Annual Flooding Frequency Class
Frequent
Occasional
Rare
Very frequent
Very rare
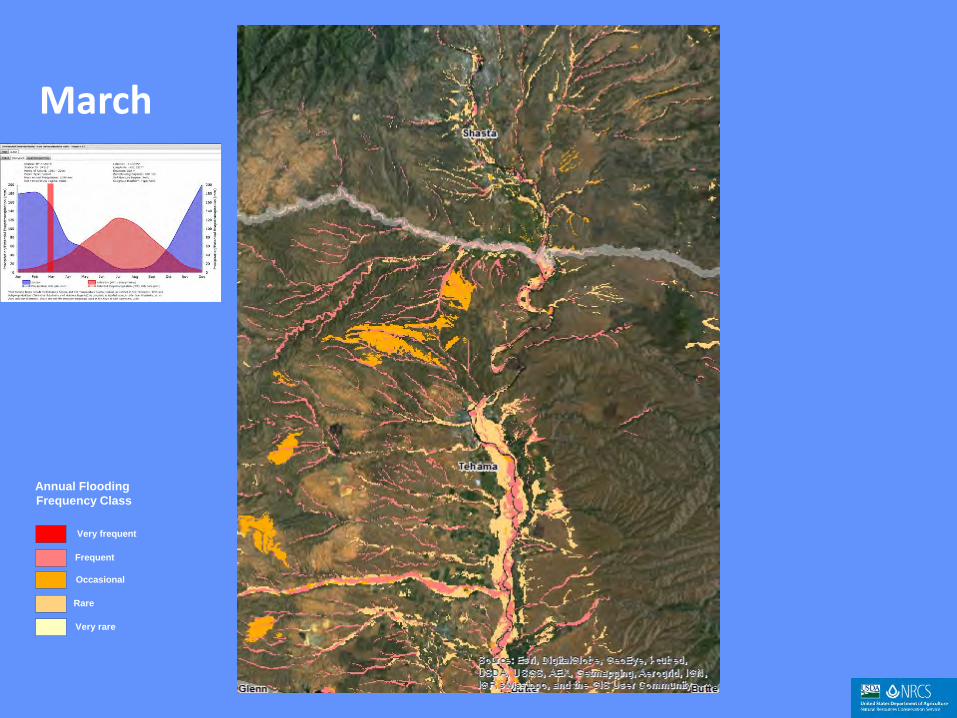
March
Annual Flooding Frequency Class
Frequent
Occasional
Rare
Very frequent
Very rare
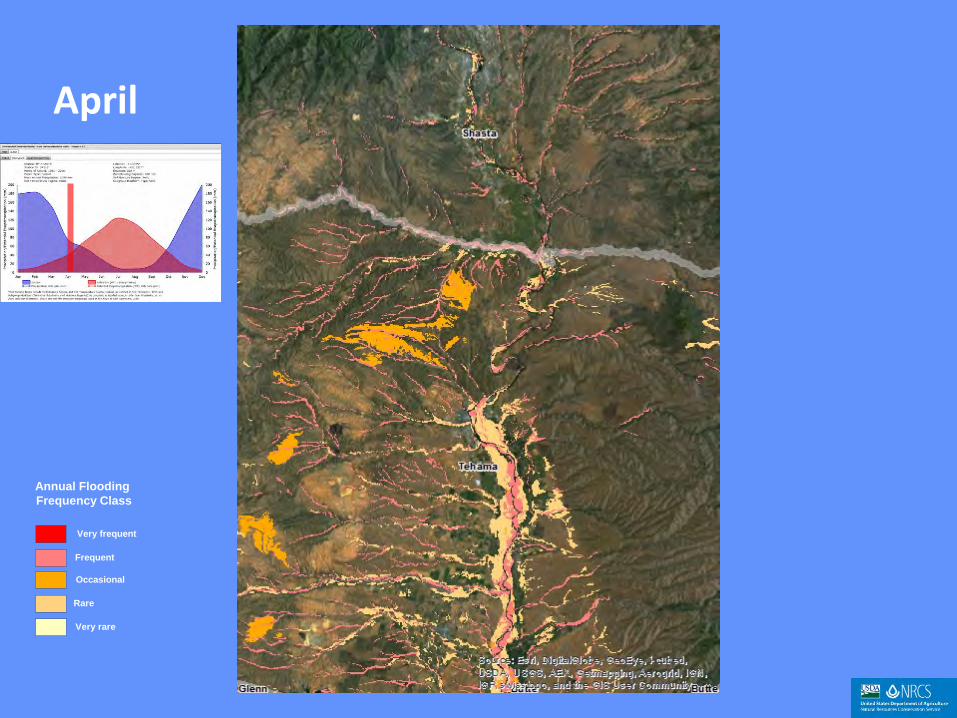
April
Annual Flooding Frequency Class
Frequent
Occasional
Rare
Very frequent
Very rare

May
Annual Flooding Frequency Class
Frequent
Occasional
Rare
Very frequent
Very rare

June
Annual Flooding Frequency Class
Frequent
Occasional
Rare
Very frequent
Very rare
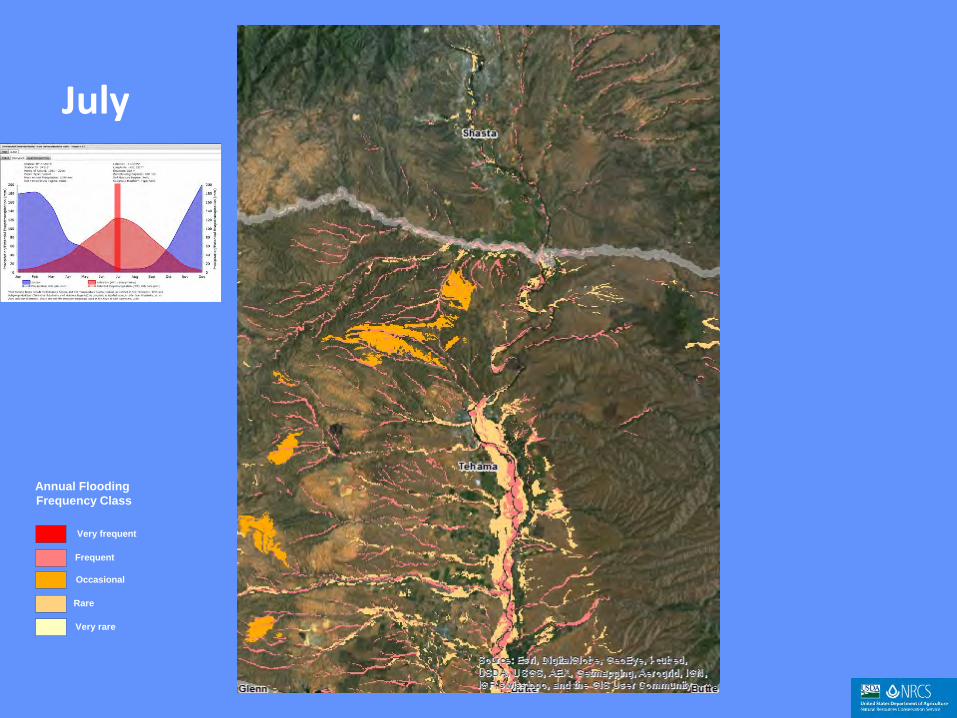
July
Annual Flooding Frequency Class
Frequent
Occasional
Rare
Very frequent
Very rare

August
Annual Flooding Frequency Class
Frequent
Occasional
Rare
Very frequent
Very rare

September
Annual Flooding Frequency Class
Frequent
Occasional
Rare
Very frequent
Very rare
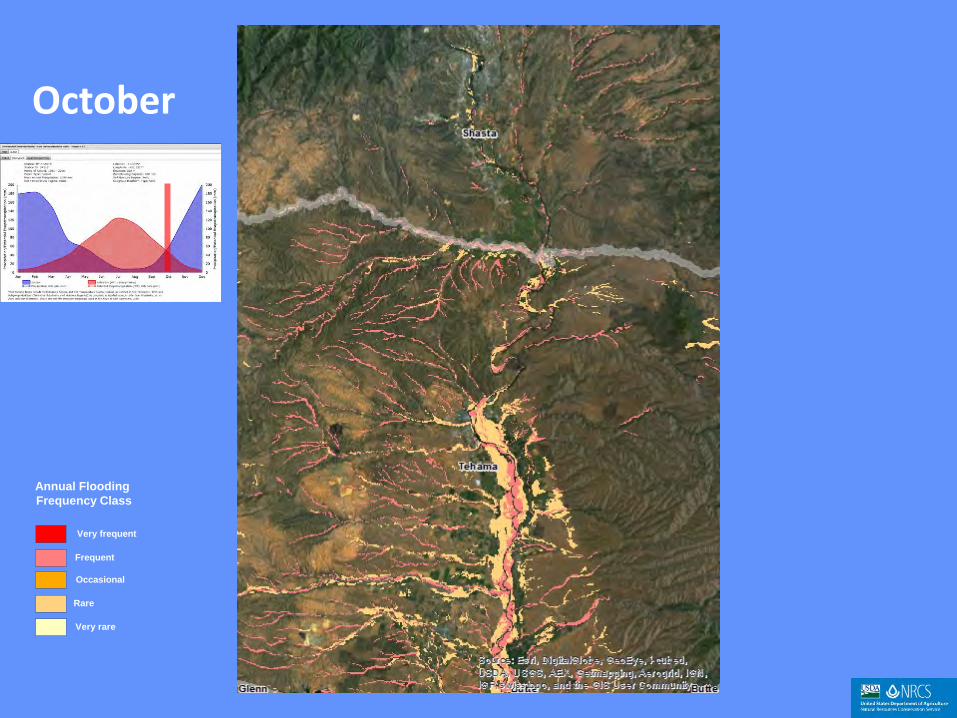
October
Annual Flooding Frequency Class
Frequent
Occasional
Rare
Very frequent
Very rare
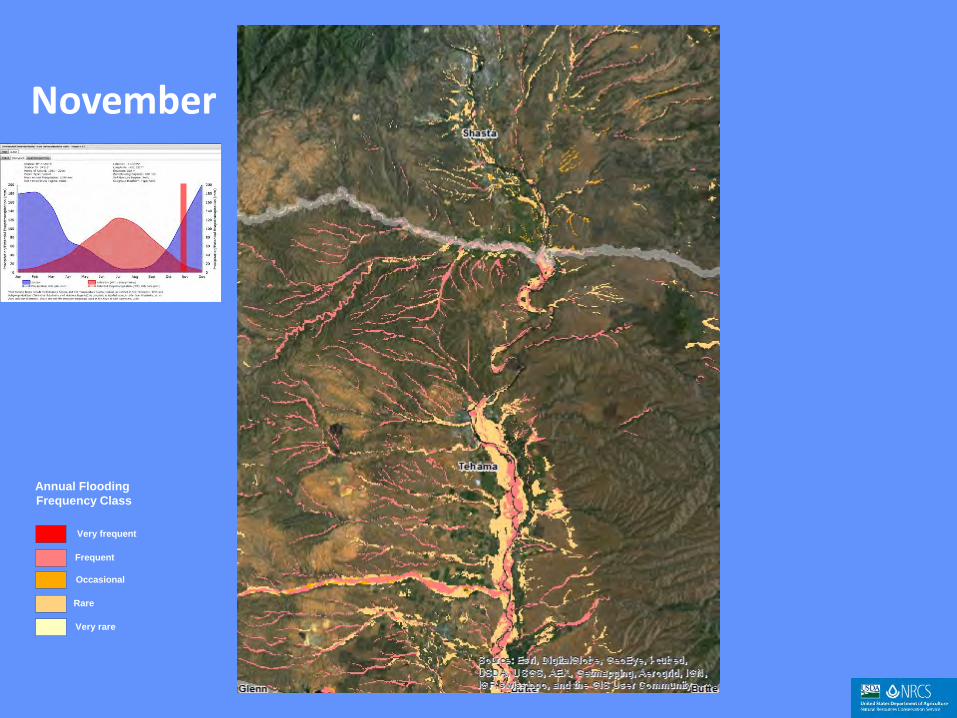
November
Annual Flooding Frequency Class
Frequent
Occasional
Rare
Very frequent
Very rare
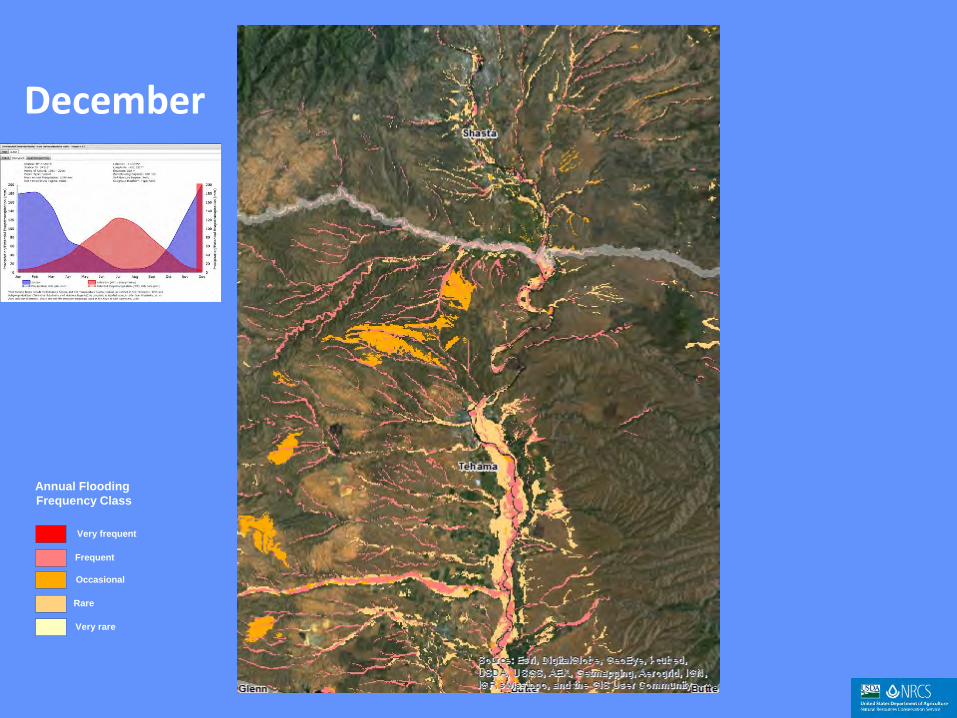
December
Annual Flooding Frequency Class
Frequent
Occasional
Rare
Very frequent
Very rare
FEMA Flood Hazard Source: HSIP GOLD 2012
Flood Hazard Areas 1
Annual Flooding Duration
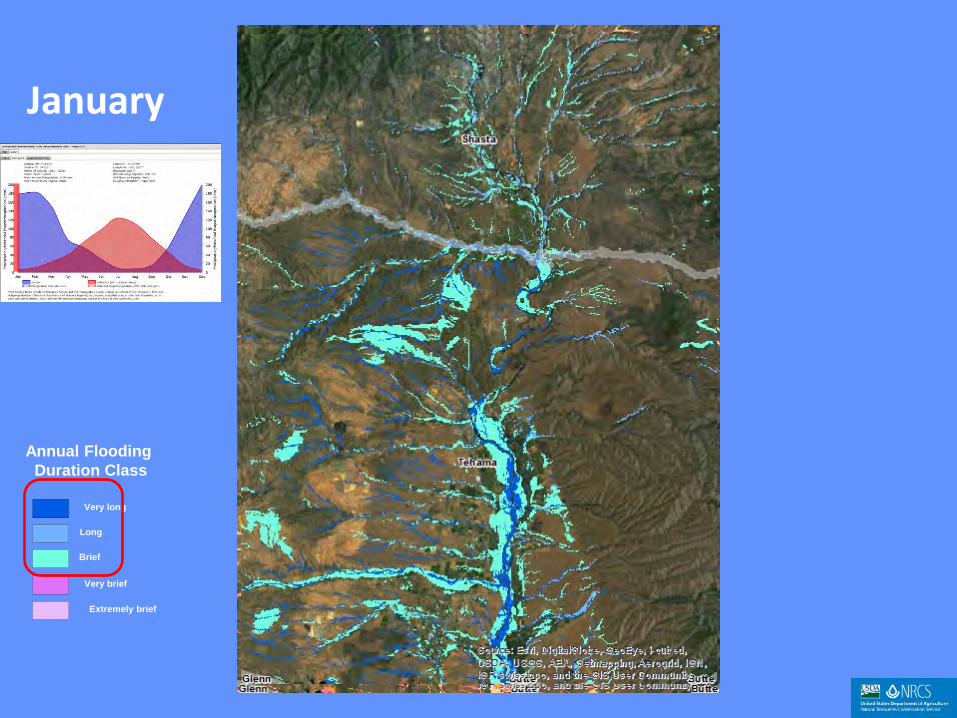
January
Brief
Extremely brief
Long
Very brief
Very long
Annual Flooding Duration Class
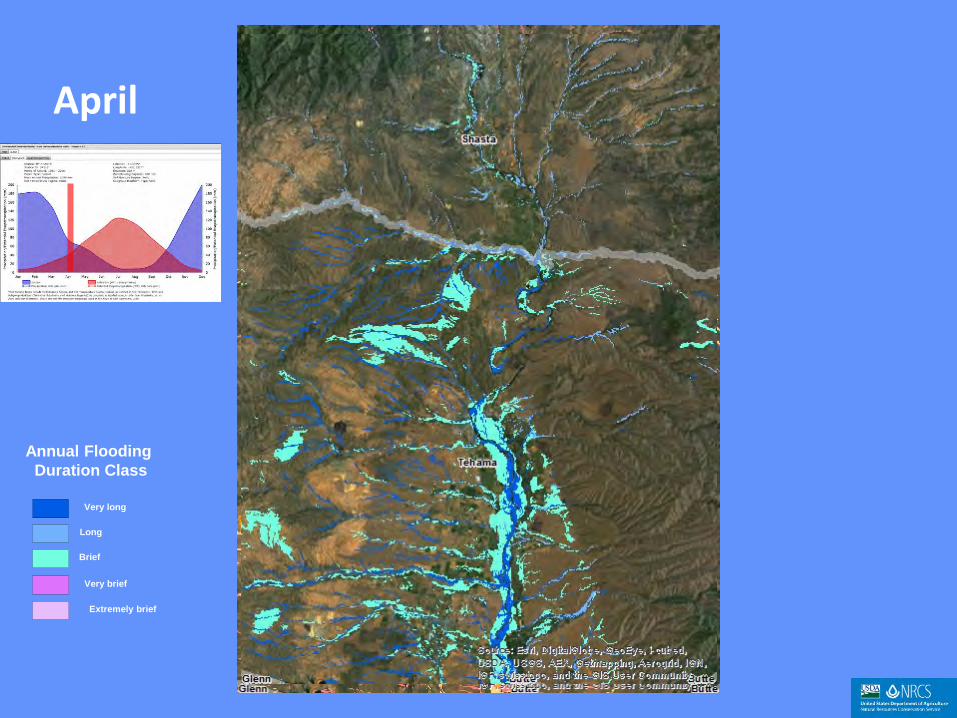
April
Brief
Extremely brief
Long
Very brief
Very long
Annual Flooding Duration Class
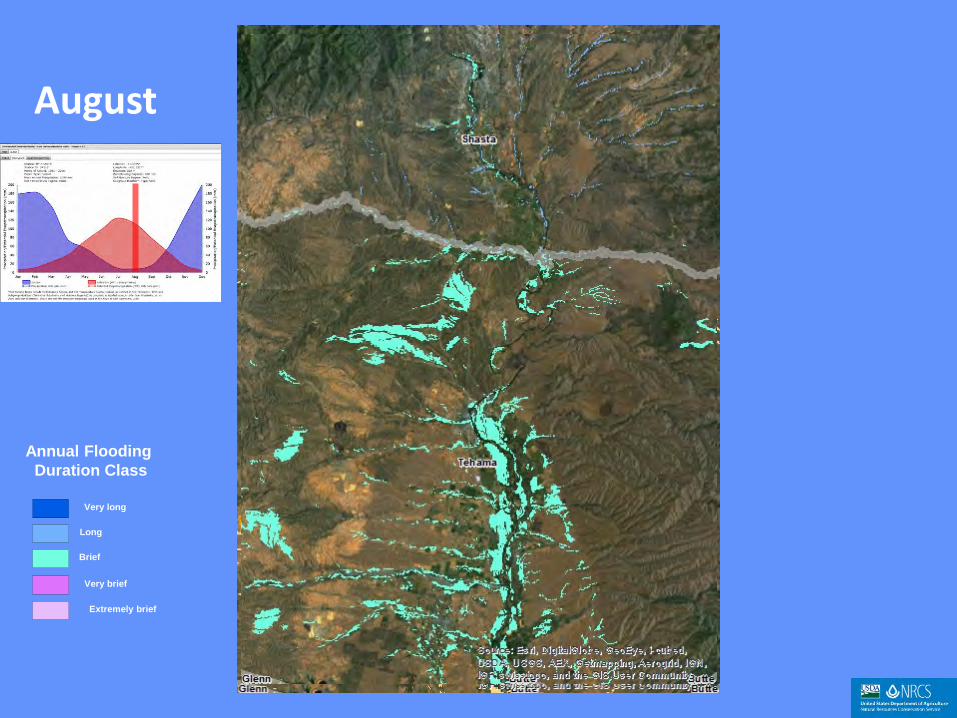
August
Brief
Extremely brief
Long
Very brief
Very long
Annual Flooding Duration Class
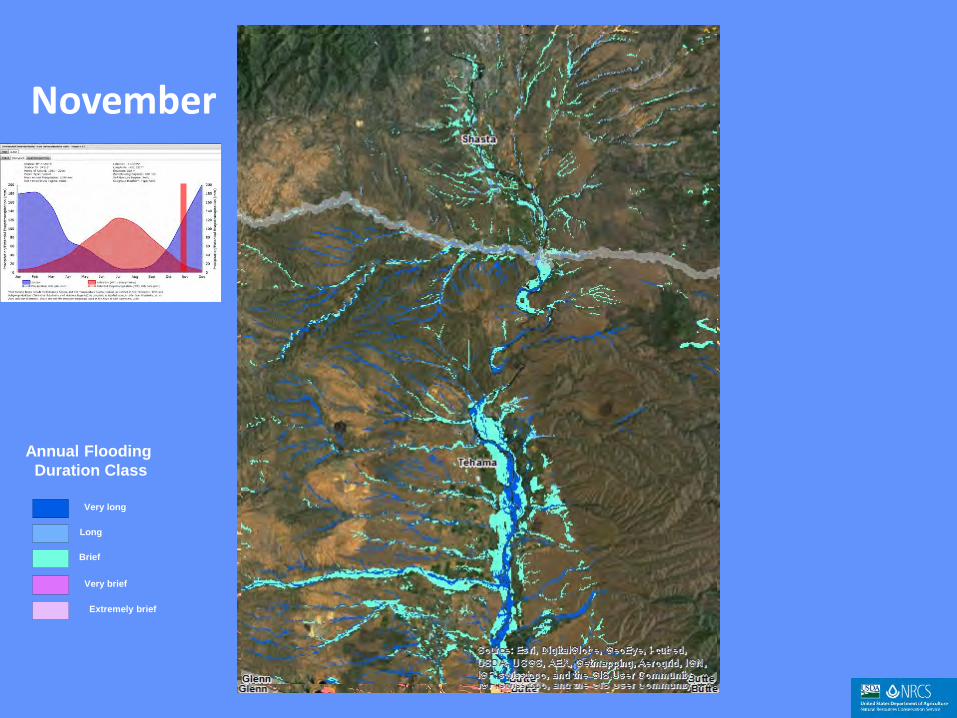
November
Brief
Extremely brief
Long
Very brief
Very long
Annual Flooding Duration Class
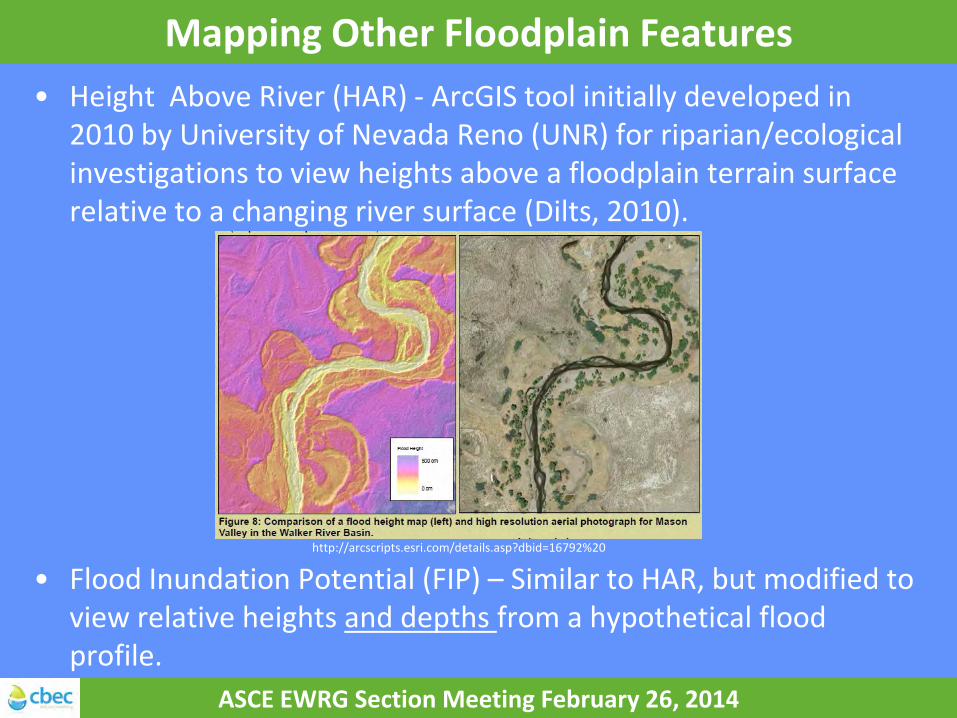
Mapping Other Floodplain Features • Height Above River (HAR) - ArcGIS tool initially developed in
2010 by University of Nevada Reno (UNR) for riparian/ecological investigations to view heights above a floodplain terrain surface relative to a changing river surface (Dilts, 2010).
• Flood Inundation Potential (FIP) – Similar to HAR, but modified to view relative heights and depths from a hypothetical flood profile.
ASCE EWRG Section Meeting February 26, 2014
http://arcscripts.esri.com/details.asp?dbid=16792%20
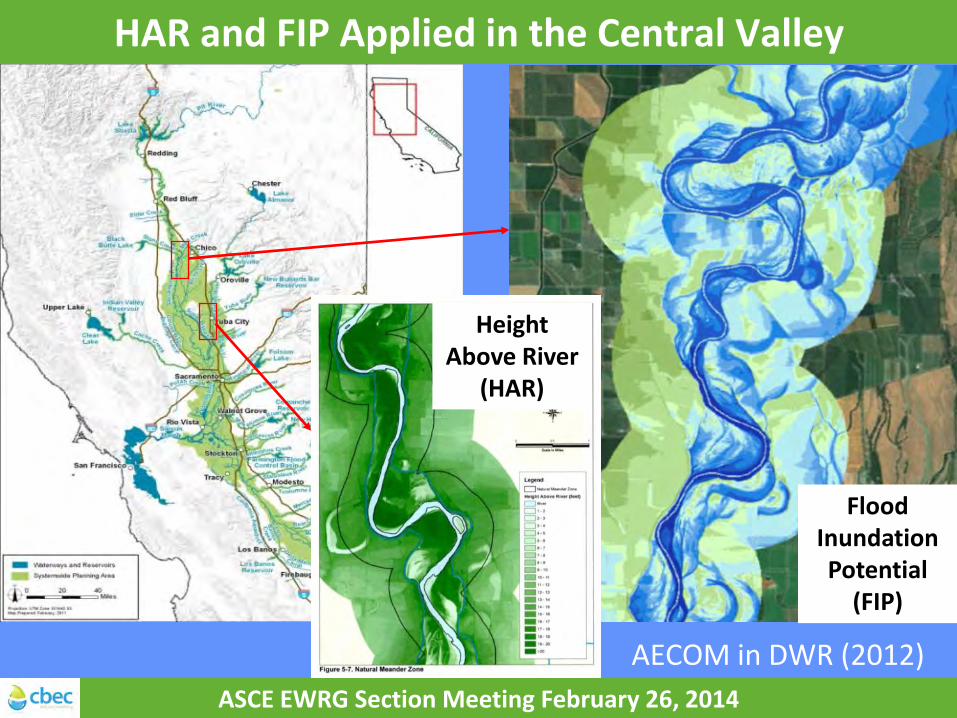
HAR and FIP Applied in the Central Valley
ASCE EWRG Section Meeting February 26, 2014
Height Above River
(HAR)
Flood Inundation Potential
(FIP)
AECOM in DWR (2012)

50% ACE Flood Inundation Potential (FIP)
ASCE EWRG Section Meeting February 26, 2014
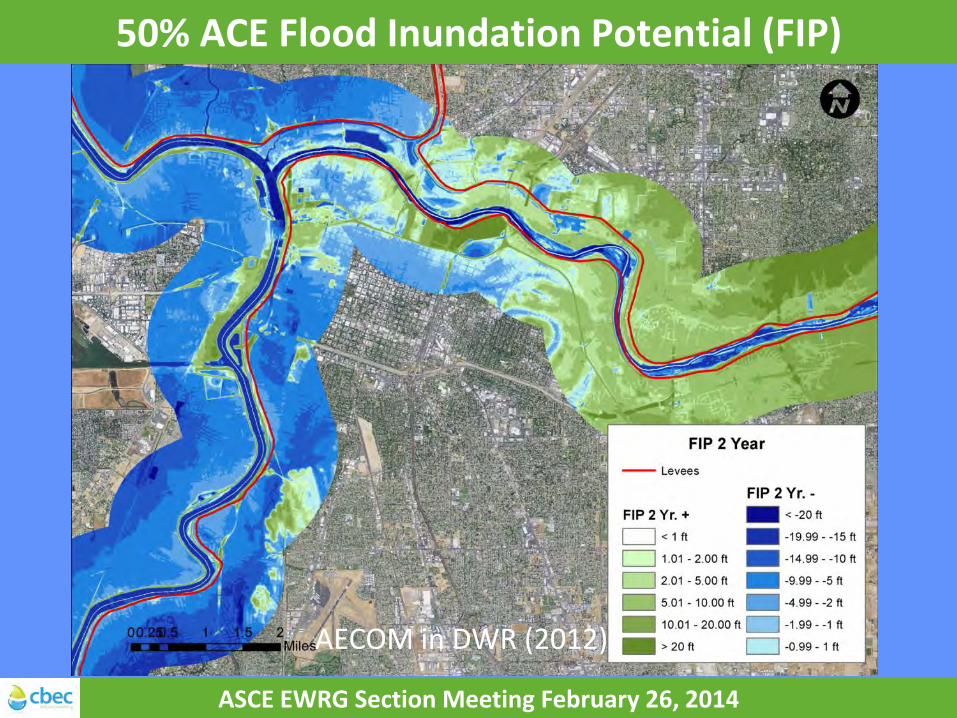
50% ACE Flood Inundation Potential (FIP)
ASCE EWRG Section Meeting February 26, 2014
AECOM in DWR (2012)
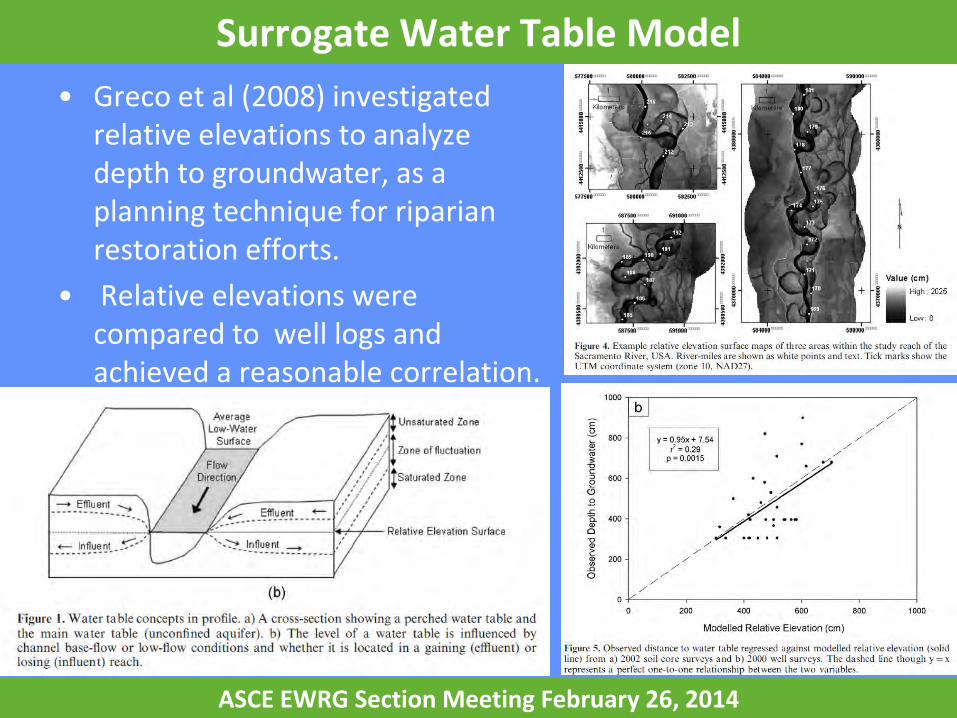
Surrogate Water Table Model • Greco et al (2008) investigated
relative elevations to analyze depth to groundwater, as a planning technique for riparian restoration efforts.
• Relative elevations were compared to well logs and achieved a reasonable correlation.
ASCE EWRG Section Meeting February 26, 2014
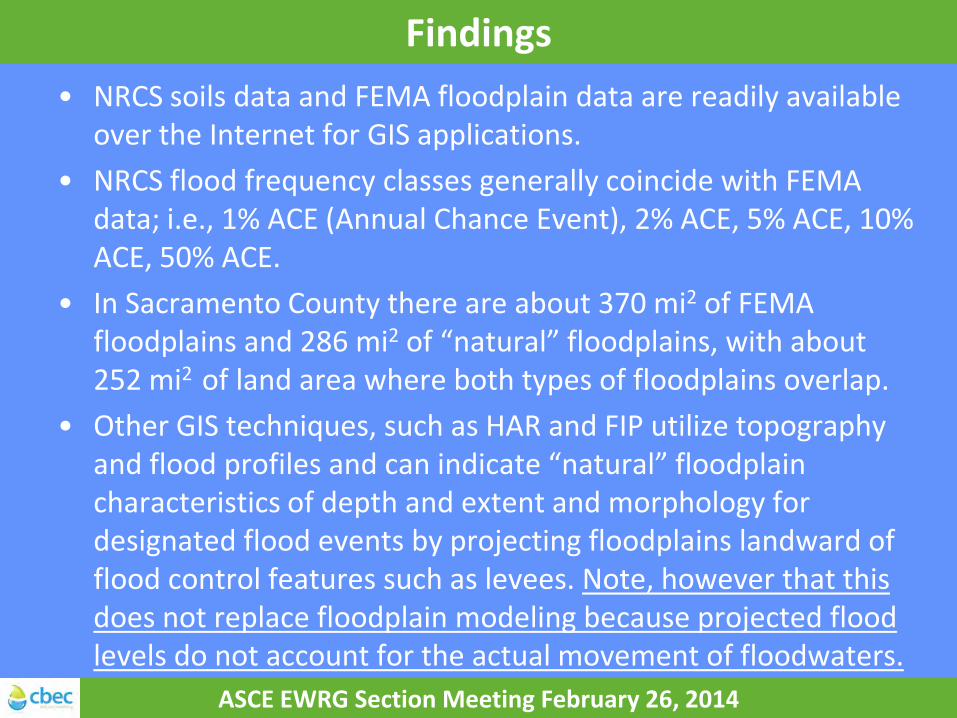
Findings • NRCS soils data and FEMA floodplain data are readily available
over the Internet for GIS applications. • NRCS flood frequency classes generally coincide with FEMA
data; i.e., 1% ACE (Annual Chance Event), 2% ACE, 5% ACE, 10% ACE, 50% ACE.
• In Sacramento County there are about 370 mi2 of FEMA floodplains and 286 mi2 of “natural” floodplains, with about 252 mi2 of land area where both types of floodplains overlap.
• Other GIS techniques, such as HAR and FIP utilize topography and flood profiles and can indicate “natural” floodplain characteristics of depth and extent and morphology for designated flood events by projecting floodplains landward of flood control features such as levees. Note, however that this does not replace floodplain modeling because projected flood levels do not account for the actual movement of floodwaters.
ASCE EWRG Section Meeting February 26, 2014
Recommendations
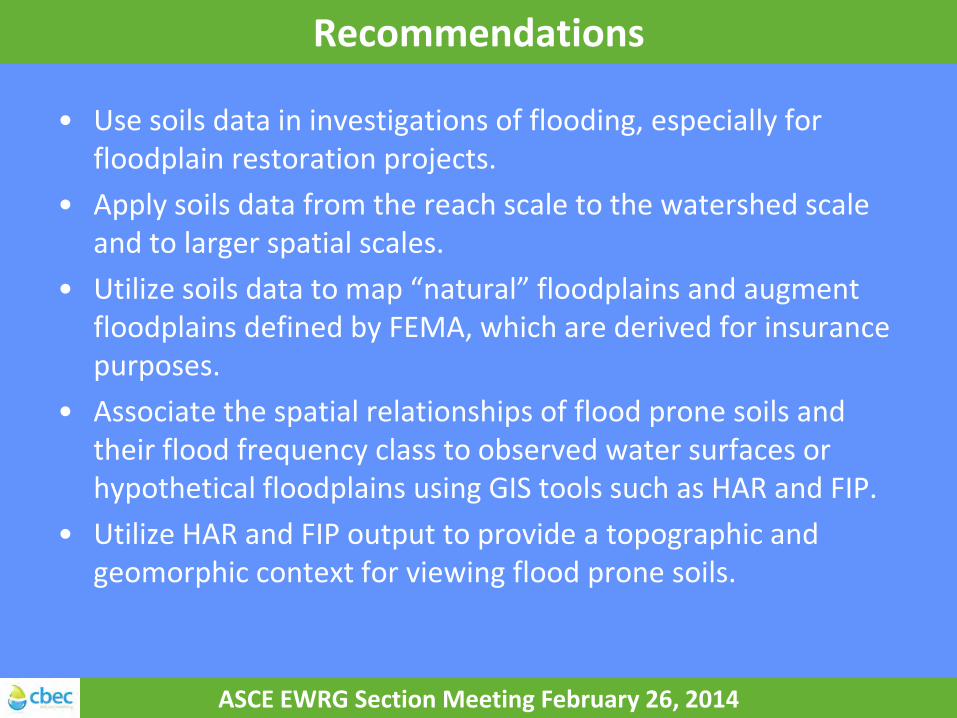
• Use soils data in investigations of flooding, especially for floodplain restoration projects.
• Apply soils data from the reach scale to the watershed scale and to larger spatial scales.
• Utilize soils data to map “natural” floodplains and augment floodplains defined by FEMA, which are derived for insurance purposes.
• Associate the spatial relationships of flood prone soils and their flood frequency class to observed water surfaces or hypothetical floodplains using GIS tools such as HAR and FIP.
• Utilize HAR and FIP output to provide a topographic and geomorphic context for viewing flood prone soils. ASCE EWRG Section Meeting February 26, 2014
Selected References
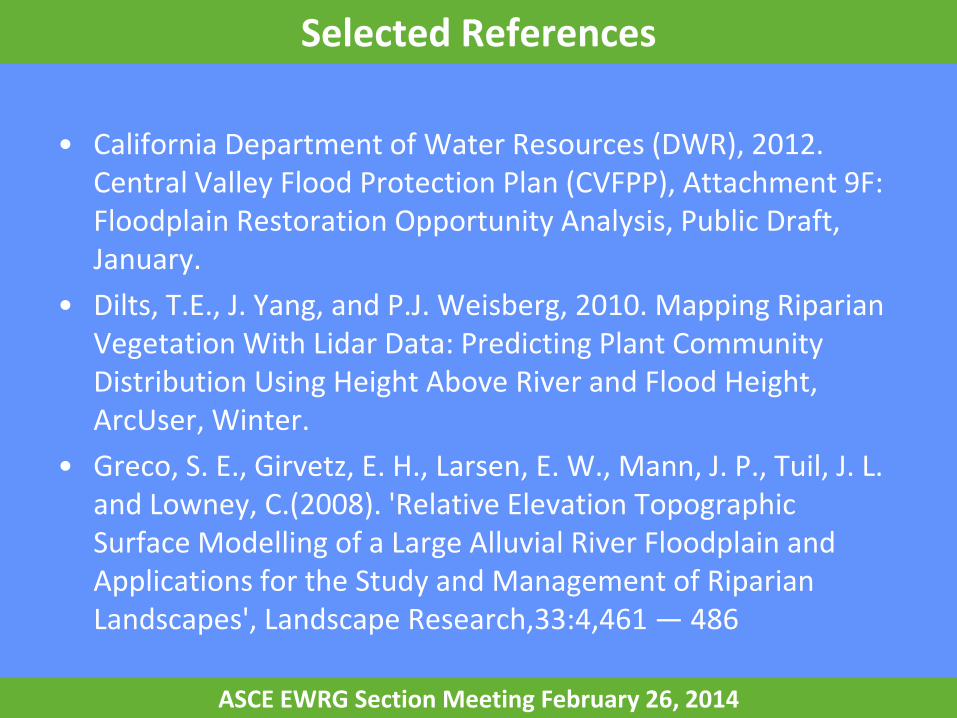
• California Department of Water Resources (DWR), 2012. Central Valley Flood Protection Plan (CVFPP), Attachment 9F: Floodplain Restoration Opportunity Analysis, Public Draft, January.
• Dilts, T.E., J. Yang, and P.J. Weisberg, 2010. Mapping Riparian Vegetation With Lidar Data: Predicting Plant Community Distribution Using Height Above River and Flood Height, ArcUser, Winter.
• Greco, S. E., Girvetz, E. H., Larsen, E. W., Mann, J. P., Tuil, J. L. and Lowney, C.(2008). 'Relative Elevation Topographic Surface Modelling of a Large Alluvial River Floodplain and Applications for the Study and Management of Riparian Landscapes', Landscape Research,33:4,461 — 486
ASCE EWRG Section Meeting February 26, 2014

Acknowledgements
• David Hoover, National Leader, NRCS, Soil Business Systems • Sharon Waltman, Soil Scientist, NRCS, Geospatial Research Unit • Keenan Lorenzato and Denise Tu, cbec, inc. • Jonathan McLandrich, AECOM • Tom Dilts, University of Nevada Reno (UNR) • Dr. Steven Greco, University of California, Davis CA
ASCE EWRG Section Meeting February 26, 2014
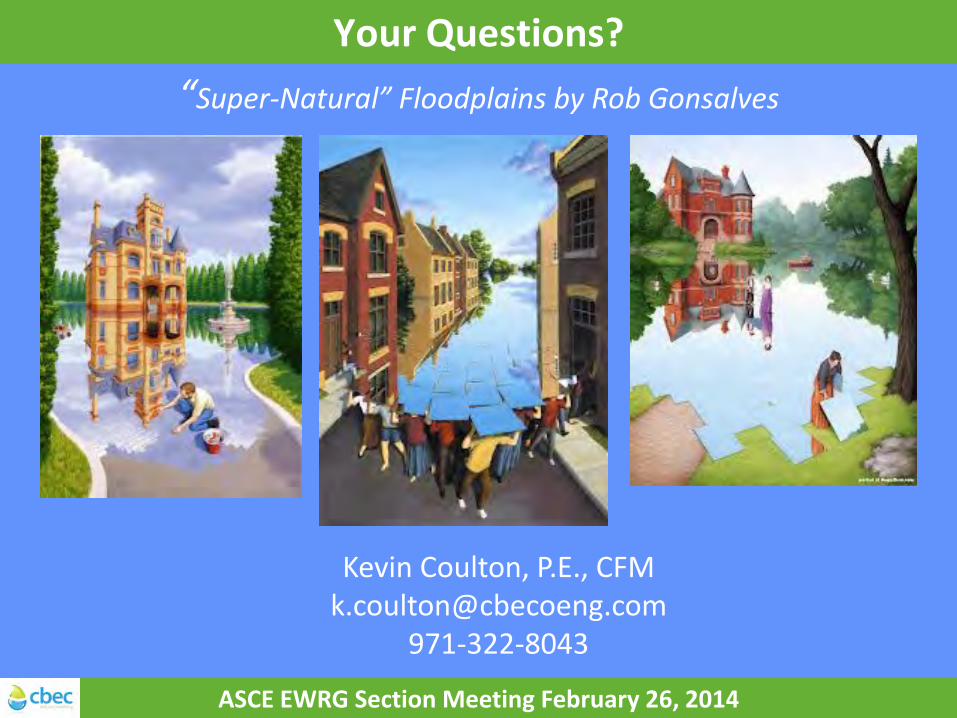
Your Questions?
ASCE EWRG Section Meeting February 26, 2014
“Super-Natural” Floodplains by Rob Gonsalves
Kevin Coulton, P.E., CFM [email protected]
971-322-8043