Using @RISK for Traffic Forecast Analysis, London | 22.04.2008 TIS.PT – Transportes Inovação e...
31
Using @RISK for Traffic Forecast Analysis, London | 22.04.2008 TIS.PT – Transportes Inovação e Sistemas, S.A. Slide 1 | 29 Transportes, Inovação e Sistemas, S.A. Transportes, Inovação e Sistemas, S.A. Av. da Republica, 35, 6º 1050-186 Lisboa | Portugal | www.tis.pt Using @RISK for Traffic Forecast Analysis Case Study: Marão Tunnel Concession Palisade User Conference London, 22nd April 2008 Inês Teles Afonso
-
Upload
martha-teesdale -
Category
Documents
-
view
216 -
download
0
Transcript of Using @RISK for Traffic Forecast Analysis, London | 22.04.2008 TIS.PT – Transportes Inovação e...

Using @RISK for Traffic Forecast Analysis, London | 22.04.2008 TIS.PT – Transportes Inovação e Sistemas, S.A. Slide 1 | 29
Transportes, Inovação e Sistemas, S.A.Transportes, Inovação e Sistemas, S.A.
Av. da Republica, 35, 6º 1050-186 Lisboa | Portugal | www.tis.pt
Using @RISK for Traffic Forecast Analysis
Case Study: Marão Tunnel Concession
Palisade User Conference
London, 22nd April 2008
Inês Teles Afonso

Using @RISK for Traffic Forecast Analysis, London | 22.04.2008 TIS.PT – Transportes Inovação e Sistemas, S.A. Slide 2 | 29
Table of ContentsTable of Contents
Case Study Presentation
Context – What is a traffic study?
What are the advantages of using @RISK?
Traffic Modelling Model (VISUM) with @RISK
Methodology @RISK
Results Analysis
The data presented in this presentation was modified so that we could ensure the privacy of our client

Using @RISK for Traffic Forecast Analysis, London | 22.04.2008 TIS.PT – Transportes Inovação e Sistemas, S.A. Slide 3 | 29
Case Study PresentationCase Study Presentation
TUNNEL MARÃO CONCESSIONNational Politics
Strategy
Identical opportunities
of Development
Similar mobility
conditions
Traffic Forecast
in concession
sections
Main Objective
Traffic Study

Using @RISK for Traffic Forecast Analysis, London | 22.04.2008 TIS.PT – Transportes Inovação e Sistemas, S.A. Slide 4 | 29
Junction 3
Junction 5
Junction 1
Junction 4
IP4
IP4
A24/IP3
A24/IP3
A4/IP4
Penaguião
Amarante
IP4
EN2
EN304 EN313-2
VilaReal
EN15
A4/IP4
Carvalhais
CampeãQuintã
IP4
EN304EN210
EN15
EN101-5
EN210
EN312
EN101
EN101
EN15
MARÃO TUNNELMARÃO TUNNELCONCESSIONCONCESSION
MARÃO TUNNELMARÃO TUNNELCONCESSIONCONCESSION
Junction 2
A4/IP4
Main characteristics:
Connection between cities of Amarante and Vila Real
length → 30 km
Cross-Section → 2x2
Free Flow Speed → 100 km/h
Tolled motorway → open scheme with toll charge in road section
→ 3 - 4
Vila Real
Case Study PresentationCase Study Presentation

Using @RISK for Traffic Forecast Analysis, London | 22.04.2008 TIS.PT – Transportes Inovação e Sistemas, S.A. Slide 5 | 29
4 5
Case Study PresentationCase Study Presentation
Traffic Model was built on the
VISUM platform
The obtained results allow to predict
the traffic demand on the studied
sections over the period of analysis
Note: These values doesn't correspond to the real project values
321
0
100.000
200.000
300.000
400.000
500.000
2012 2015 2018 2021 2024 2027 2030 2033 2036 2039
AADT.k
m
Section (1-2) Section (2-3) Section (3-4) Section (4-5)

Using @RISK for Traffic Forecast Analysis, London | 22.04.2008 TIS.PT – Transportes Inovação e Sistemas, S.A. Slide 6 | 29
Context – What is a traffic study?Context – What is a traffic study?
INPUTTransport Demand Characteristics
Traffic Study / Traffic Model
Traffic Forecasts for the study infra-structure
Finance Analysis(...income estimates)
Environmental Impact
AssessmentProject Analysis
OUTPUT
Transport Supply Characteristics

Using @RISK for Traffic Forecast Analysis, London | 22.04.2008 TIS.PT – Transportes Inovação e Sistemas, S.A. Slide 7 | 29
Context – What is a traffic study?Context – What is a traffic study?
INPUT
Traffic Study / Traffic Modal
OUTPUT
ANALYSIS
It is a very important issue to know the expected
evolution for the traffic (OUTPUT) and what are
the associated risks.
Usually we reflect the uncertainty of the
model results in three scenarios such as
“central”, “optimistic” and
“pessimistic” allowing for a very limited
deterministic analysis.
Is it possible to present a clearer and
stricter outcome?

Using @RISK for Traffic Forecast Analysis, London | 22.04.2008 TIS.PT – Transportes Inovação e Sistemas, S.A. Slide 8 | 29
What are the advantages of using @RISK?What are the advantages of using @RISK?
YES!
Using @RISK, the OUTPUT
(traffic forecast) is represented
by a probability distribution
which improves the quality of
decision-making.
HOW?
With simulation (Monte Carlo
simulation). In each iteration
@RISK tries all valid
combinations of the values of
INPUT to simulate all possible
outcomes (OUTPUT).
variable variable
AAvariable variable
BBvariable variable
CC
Traffic Traffic
Model Model
Relations..Relations..
OUTPUOUTPU
TT
ANALYSIS

Using @RISK for Traffic Forecast Analysis, London | 22.04.2008 TIS.PT – Transportes Inovação e Sistemas, S.A. Slide 9 | 29
Traffic Modelling Model (VISUM) with @RISKTraffic Modelling Model (VISUM) with @RISK
4 minutes for a traffic
assignment
10.000 @RISK iterations
iterations duration
833 hours!
35 days!!!
SOLUTION
Draw adjustment curves
representing the relationship
between OUTPUT (traffic forecast)
and INPUT variables - Elasticity
Curves
PROBLEM
Due the complexity of traffic model,
it takes some time to get its
outcome (traffic forecast). Therefore
it is not feasible to do a traffic
assignment (VISUM) for each @RISK
iteration.

Using @RISK for Traffic Forecast Analysis, London | 22.04.2008 TIS.PT – Transportes Inovação e Sistemas, S.A. Slide 10 | 29
Traffic Modelling Model (VISUM) with @RISKTraffic Modelling Model (VISUM) with @RISK
Variable
OU
TP
UT
- A
AD
T.k
m
2. Traffic Assignments
3. Elasticity curves
adjustment
1. Change INPUT values
Using @RISK for Traffic Forecast Analysis, London | 22.04.2008 TIS.PT – Transportes Inovação e Sistemas, S.A. Slide 11 | 29
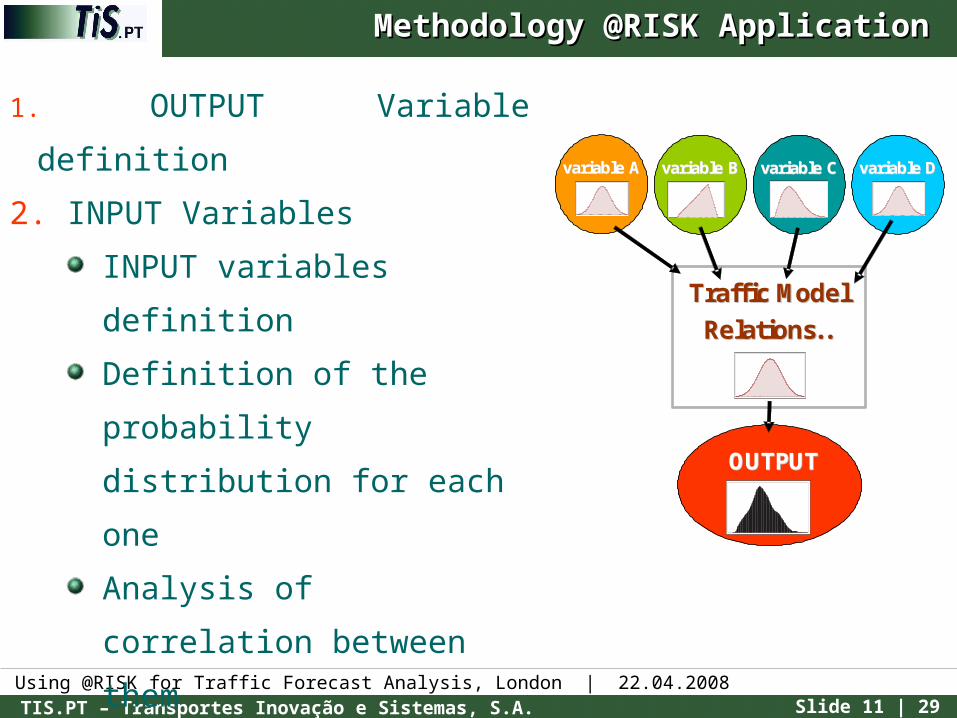
Methodology @RISK Application Methodology @RISK Application
1. OUTPUT Variable definition
2. INPUT Variables
INPUT variables definition
Definition of the
probability distribution for
each one
Analysis of correlation
between them
3. Interaction between INPUT
and OUTPUT variables
4. @RISK Simulation
5. Results Analysis
variable Avariable A
Traffic Model Traffic Model
Relations..Relations..
OUTPUTOUTPUT
variable Bvariable B variable Cvariable C variable Dvariable D
Using @RISK for Traffic Forecast Analysis, London | 22.04.2008 TIS.PT – Transportes Inovação e Sistemas, S.A. Slide 12 | 29
Junction 3
Junction 5
Junction 1
Junction 4
IP4
IP4
A24/IP3
A24/IP3
A4/IP4
Penaguião
Amarante
IP4
EN2
EN304 EN313-2
VilaReal
EN15
A4/IP4
Carvalhais
CampeãQuintã
IP4
EN304EN210
EN15
EN101-5
EN210
EN312
EN101
EN101
EN15
Junction 2
A4/IP4
Vila Real
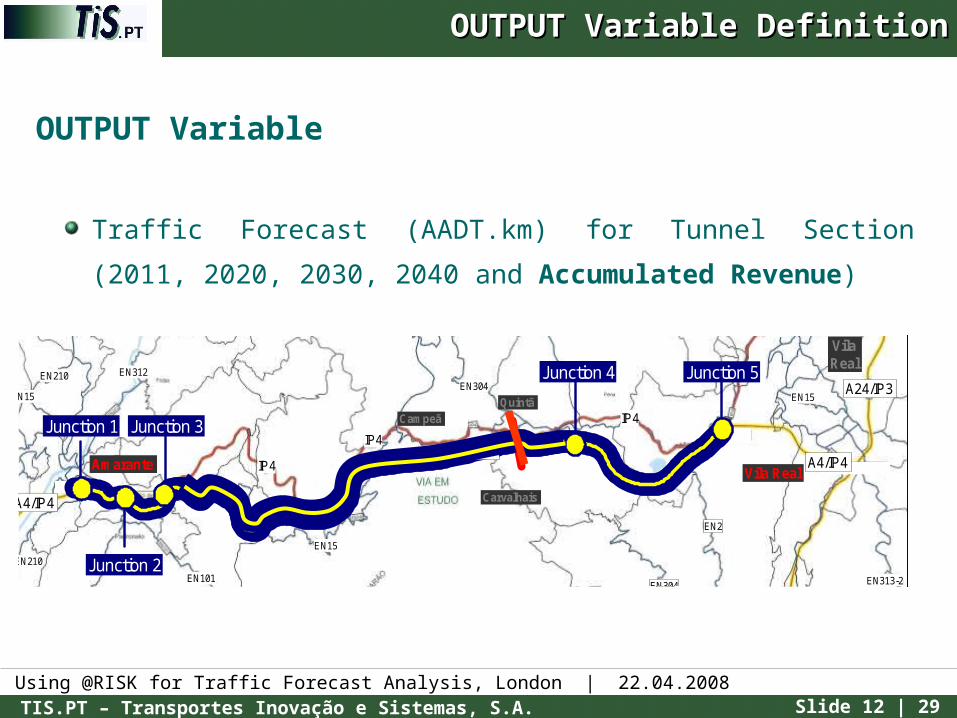
OUTPUT Variable DefinitionOUTPUT Variable Definition
OUTPUT Variable
Traffic Forecast (AADT.km) for Tunnel Section (2011, 2020,
2030, 2040 and Accumulated Revenue)

Using @RISK for Traffic Forecast Analysis, London | 22.04.2008 TIS.PT – Transportes Inovação e Sistemas, S.A. Slide 13 | 29
INPUT Variables DefinitionINPUT Variables Definition
INPUT Variables
GDP Annual Variation Rate (after
2009)
Toll value f(VAT)
Value of Time (VoT) Variation Rate
Fuel Cost Annual Variation Rate
GC= l (length).Co (Operational Cost) + t (travel time).VOT +
l.T(unit toll)
Traffic growth factors
Transport Demand
Generalized Cost

Using @RISK for Traffic Forecast Analysis, London | 22.04.2008 TIS.PT – Transportes Inovação e Sistemas, S.A. Slide 14 | 29
Probability Distribution for INPUT Variables Probability Distribution for INPUT Variables
Traffic Model Traffic Model
Relations..Relations..
OUTPUTOUTPUT
variable Avariable A variable Bvariable B variable Cvariable C variable Dvariable D Around each input variable,
there was a very deep
discussion to decide which
probability distribution should
the variable assume.
This discussion was based
mainly on expert judgement.

Using @RISK for Traffic Forecast Analysis, London | 22.04.2008 TIS.PT – Transportes Inovação e Sistemas, S.A. Slide 15 | 29
Probability Distribution for INPUT Variables Probability Distribution for INPUT Variables
GDP Annual Variation Rate (after 2009)GDP Annual Variation Rate (after 2009)The source for GDP before 2009 was the Bank of Portugal
After 2009 it is considered a stochastic variable
Normal distributionMean= 2,3%Standard Deviation = 0,5%
To avoid to have
negative values of
traffic, which is a non
sense, the distribution
was truncated.

Using @RISK for Traffic Forecast Analysis, London | 22.04.2008 TIS.PT – Transportes Inovação e Sistemas, S.A. Slide 16 | 29
Probability Distribution for INPUT Variables Probability Distribution for INPUT Variables
Fuel Cost Variation RateFuel Cost Variation RateIt was considered that the likeliness of fuel prices reaching very
high levels in the long or medium term is higher than that of
regressing to lower levels
Weibull distributionPercentile 5% = 0,8Percentile 50% = 1Percentile 95% = 1,5
The modelled variable
consists of the Fuel
Cost Variation until
2020.
Using @RISK for Traffic Forecast Analysis, London | 22.04.2008 TIS.PT – Transportes Inovação e Sistemas, S.A. Slide 17 | 29
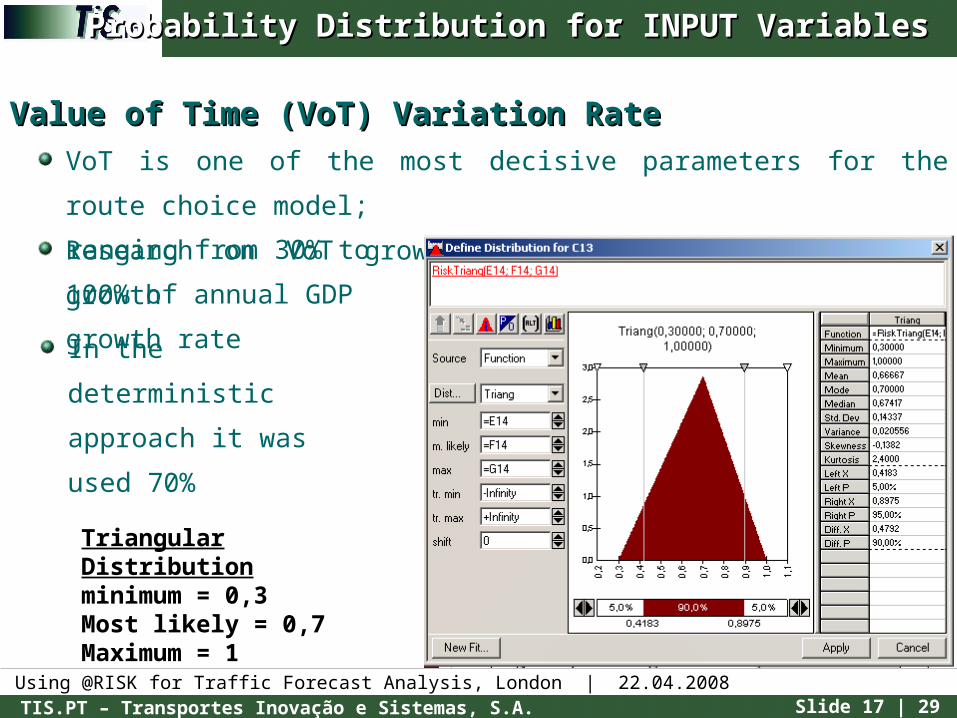
Probability Distribution for INPUT Variables Probability Distribution for INPUT Variables
Value of Time (VoT) Variation RateValue of Time (VoT) Variation RateVoT is one of the most decisive parameters for the route choice
model;
Research on VoT growth over time indicates annual growth
Triangular Distributionminimum = 0,3Most likely = 0,7Maximum = 1
ranging from 30% to
100% of annual GDP
growth rateIn the deterministic
approach it was used
70%

Using @RISK for Traffic Forecast Analysis, London | 22.04.2008 TIS.PT – Transportes Inovação e Sistemas, S.A. Slide 18 | 29
Probability Distribution for INPUT Variables Probability Distribution for INPUT Variables
Toll valueToll = €0,07.(1+VAT).(paid length)
The toll value is changed when VAT changes. VAT is the INPUT
variable;In 2007 Portuguese VAT was 21%;It is not likely that VAT can
increase much more;
The probability of simulating
a lower VAT than the most
likely is higher than getting a
higher most likely value
Weibull distributionPercentile 5% = 0,18Percentile 50% = 0,21Percentile 95% = 0,23

Using @RISK for Traffic Forecast Analysis, London | 22.04.2008 TIS.PT – Transportes Inovação e Sistemas, S.A. Slide 19 | 29
Correlation Analysis Between INPUT VariablesCorrelation Analysis Between INPUT Variables
The correlation matrix was constructed considering the following
variable relations:
Negative correlation between GDP and VAT, and GDP and Fuel
Costs
Positive correlation between GDP and VoT
Positive correlation between VAT and Fuel Costs
Using @RISK for Traffic Forecast Analysis, London | 22.04.2008 TIS.PT – Transportes Inovação e Sistemas, S.A. Slide 20 | 29
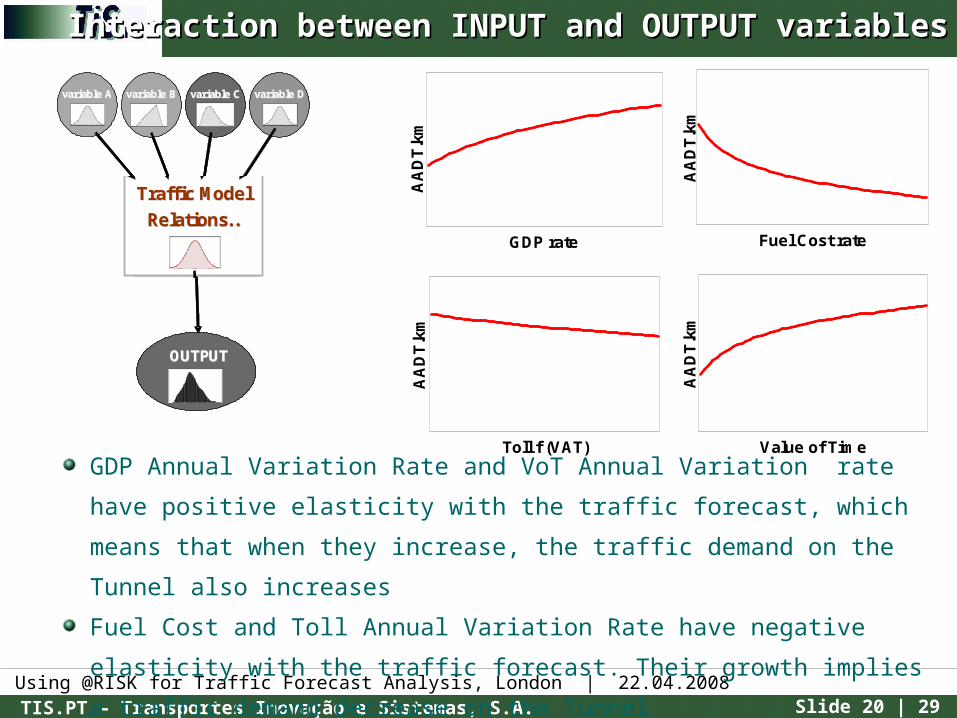
Interaction between INPUT and OUTPUT variablesInteraction between INPUT and OUTPUT variables
GDP rate
AA
DT
.km
Fuel Cost rate
AA
DT
.km
Toll f (VAT)
AA
DT
.km
Value of Time
AA
DT
.km
GDP Annual Variation Rate and VoT Annual Variation rate have positive
elasticity with the traffic forecast, which means that when they increase, the
traffic demand on the Tunnel also increases
Fuel Cost and Toll Annual Variation Rate have negative elasticity with
the traffic forecast. Their growth implies a traffic demand decrease on
the Tunnel
variable Avariable A
Traffic Model Traffic Model
Relations..Relations..
OUTPUTOUTPUT
variable Bvariable B variable Cvariable C variable Dvariable Dvariable Avariable A
Traffic Model Traffic Model
Relations..Relations..
OUTPUTOUTPUT
variable Bvariable B variable Cvariable C variable Dvariable D
variable Avariable A
Traffic Model Traffic Model
Relations..Relations..
OUTPUTOUTPUT
variable Bvariable B variable Cvariable C variable Dvariable D

Using @RISK for Traffic Forecast Analysis, London | 22.04.2008 TIS.PT – Transportes Inovação e Sistemas, S.A. Slide 21 | 29
The data presented in this presentation was modified so that we could ensure the privacy of our client

Using @RISK for Traffic Forecast Analysis, London | 22.04.2008 TIS.PT – Transportes Inovação e Sistemas, S.A. Slide 22 | 29
200 225 250 275 300
5% 90% 5% 253,4292 279,3718
Mean=267450,7
Distribution for AADT.km TUNNEL / 2011/F16
Val
ues
in 1
0^ -
5
Values in Thousands
0
1
2
3
4
5
6
Mean=267450,7
200 225 250 275 300 0 125 250 375 500
5% 90% 5% 260,5224 408,8325
Mean=338624,3
Distribution for AADT.km TUNNEL / 2020/O16
Val
ues
in 1
0^ -
6
Values in Thousands
0
1
2
3
4
5
6
7
8
9
Mean=338624,3
0 125 250 375 500
0 175 350 525 700
5% 90% 5% 322,8853 556,4628
Mean=444670,7
Distribution for AADT.km TUNNEL / 2030/Y16
Val
ues
in 1
0^ -
6
Values in Thousands
0
1
2
3
4
5
6
Mean=444670,7
0 175 350 525 700 0 200 400 600 800
5% 90% 5% 357,5827 615,0895
Mean=490997,5
Distribution for AADT.km TUNNEL / 2040/AI16
Val
ues
in 1
0^ -
6
Values in Thousands
0,0000,5001,0001,5002,0002,5003,0003,5004,0004,5005,000
Mean=490997,5
0 200 400 600 800
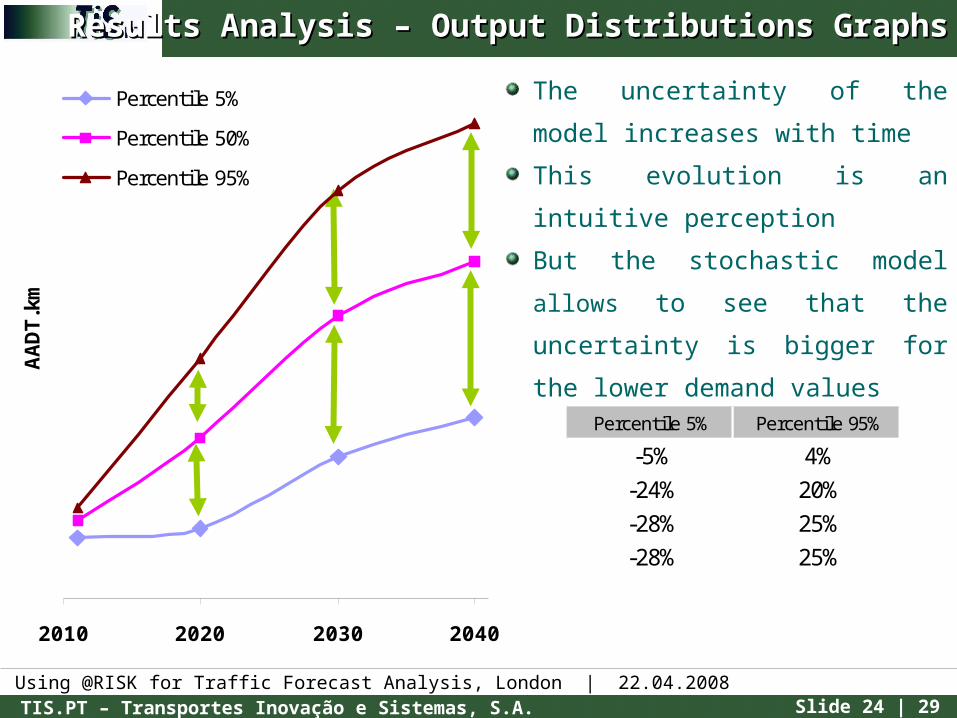
Results Analysis – Output Distributions GraphsResults Analysis – Output Distributions Graphs
1 2
3 4
Traffic Model Traffic Model
Traffic Model Traffic Model

Using @RISK for Traffic Forecast Analysis, London | 22.04.2008 TIS.PT – Transportes Inovação e Sistemas, S.A. Slide 23 | 29
Results Analysis – Output Distributions GraphsResults Analysis – Output Distributions Graphs
0 200 400 600 800
5% 90% 5% 357,5827 615,0895
Mean=490997,5
1 2
3 4
Traffic Model Traffic Model
Distribution for AADT.km TUNNEL / 2011/F16
Values in 10^ -5
Values in Thousands
0
1
2
3
4
5
6
Mean=267450,7
200 225 250 275 300200 225 250 275 300
5% 90% 5% 253,4292 279,3718
Mean=267450,7
Distribution for AADT.km TUNNEL / 2020/O16
Values in 10^ -6
Values in Thousands
0
1
2
3
4
5
6
7
8
9
Mean=338624,3
0 125 250 375 5000 125 250 375 500
5% 90% 5% 260,5224 408,8325
Mean=338624,3
Distribution for AADT.km TUNNEL / 2030/Y16
Values in 10^ -6
Values in Thousands
0
1
2
3
4
5
6
Mean=444670,7
0 175 350 525 7000 175 350 525 700
5% 90% 5% 322,8853 556,4628
Mean=444670,7
Distribution for AADT.km TUNNEL / 2040/AI16
Values in 10^ -6
Values in Thousands
0,0000,5001,0001,5002,0002,5003,0003,5004,0004,5005,000
Mean=490997,5
0 200 400 600 800
The red line
represents the
deterministic output
(traffic forecast.km)
of the Traffic Model.
The deterministic outcome is always on the right side of the mean value of
the distribution.
This means that traffic study may have assumed optimistic values
Using @RISK for Traffic Forecast Analysis, London | 22.04.2008 TIS.PT – Transportes Inovação e Sistemas, S.A. Slide 24 | 29
Results Analysis – Output Distributions GraphsResults Analysis – Output Distributions Graphs
The uncertainty of the model
increases with time
This evolution is an intuitive
perception
But the stochastic model allows to
see that the uncertainty is bigger for
the lower demand values
2010 2020 2030 2040
AADT.k
m
Percentile 5%
Percentile 50%
Percentile 95%
Percentile 5% Percentile 95%
-5% 4%
-24% 20%
-28% 25%
-28% 25%
Using @RISK for Traffic Forecast Analysis, London | 22.04.2008 TIS.PT – Transportes Inovação e Sistemas, S.A. Slide 25 | 29
Results Analysis – Tornado Graphs Results Analysis – Tornado Graphs
Regression Sensitivity for AADT.km TUNNEL /2011/F16
Std b Coefficients
VAT (Toll charge) / SIMULA.../C10-,227
VOT (relation GDP & VOT) /.../C13 ,242
Fuel Cost Annual Evoluatio.../C7-,281
GDP Annual Evoluation Tax .../C4 ,766
-1 -0,75 -0,5 -0,25 0 0,25 0,5 0,75 1
Regression Sensitivity for AADT.km TUNNEL /2020/O16
Std b Coefficients
VAT (Toll charge) / SIMULA.../C10-,07
VOT (relation GDP & VOT) /.../C13 ,242
Fuel Cost Annual Evoluatio.../C7-,566
GDP Annual Evoluation Tax .../C4 ,647
-1 -0,75 -0,5 -0,25 0 0,25 0,5 0,75 1 Regression Sensitivity for AADT.km TUNNEL /2030/Y16
Std b Coefficients
VAT (Toll charge) / SIMULA.../C10-,03
VOT (relation GDP & VOT) /.../C13 ,326
Fuel Cost Annual Evoluatio.../C7-,58
GDP Annual Evoluation Tax .../C4 ,593
-1 -0,75 -0,5 -0,25 0 0,25 0,5 0,75 1
Regression Sensitivity for AADT.km TUNNEL /2040/AI16
Std b Coefficients
VAT (Toll charge) / SIMULA.../C10-,125
VOT (relation GDP & VOT) /.../C13 ,344
Fuel Cost Annual Evoluatio.../C7-,559
GDP Annual Evoluation Tax .../C4 ,575
-1 -0,75 -0,5 -0,25 0 0,25 0,5 0,75 1
1 2
3 4

Using @RISK for Traffic Forecast Analysis, London | 22.04.2008 TIS.PT – Transportes Inovação e Sistemas, S.A. Slide 26 | 29
Results Analysis – Tornado Graphs Results Analysis – Tornado Graphs Regression Sensitivity for AADT.km TUNNEL /
2011/F16
Std b Coefficients
VAT (Toll charge) / SIMULA.../C10-,227
VOT (relation GDP & VOT) /.../C13 ,242
Fuel Cost Annual Evoluatio.../C7-,281
GDP Annual Evoluation Tax .../C4 ,766
-1 -0,75 -0,5 -0,25 0 0,25 0,5 0,75 1
Regression Sensitivity for AADT.km TUNNEL /2020/O16
Std b Coefficients
VAT (Toll charge) / SIMULA.../C10-,07
VOT (relation GDP & VOT) /.../C13 ,242
Fuel Cost Annual Evoluatio.../C7-,566
GDP Annual Evoluation Tax .../C4 ,647
-1 -0,75 -0,5 -0,25 0 0,25 0,5 0,75 1
Regression Sensitivity for AADT.km TUNNEL /2030/Y16
Std b Coefficients
VAT (Toll charge) / SIMULA.../C10-,03
VOT (relation GDP & VOT) /.../C13 ,326
Fuel Cost Annual Evoluatio.../C7-,58
GDP Annual Evoluation Tax .../C4 ,593
-1 -0,75 -0,5 -0,25 0 0,25 0,5 0,75 1
Regression Sensitivity for AADT.km TUNNEL /2040/AI16
Std b Coefficients
VAT (Toll charge) / SIMULA.../C10-,125
VOT (relation GDP & VOT) /.../C13 ,344
Fuel Cost Annual Evoluatio.../C7-,559
GDP Annual Evoluation Tax .../C4 ,575
-1 -0,75 -0,5 -0,25 0 0,25 0,5 0,75 1
1 2
3 4
These results shows
the importance of the
uncertainty of the
INPUT variables on
uncertainty of output
outcome
What factors cause higher uncertainty on the traffic forecast?
• GDP is the INPUT with more influence. Fuel Costs are the second most
influential and become more relevant until 2020 where the variable value
remains constant

Using @RISK for Traffic Forecast Analysis, London | 22.04.2008 TIS.PT – Transportes Inovação e Sistemas, S.A. Slide 27 | 29
What is the possibility of having the revenues 15% less than the deterministic
forecast?
• The model allows to estimate that that outcome can occur with a probability
of 13%
Results Analysis - RevenuesResults Analysis - Revenues
Using @RISK for Traffic Forecast Analysis, London | 22.04.2008 TIS.PT – Transportes Inovação e Sistemas, S.A. Slide 28 | 29
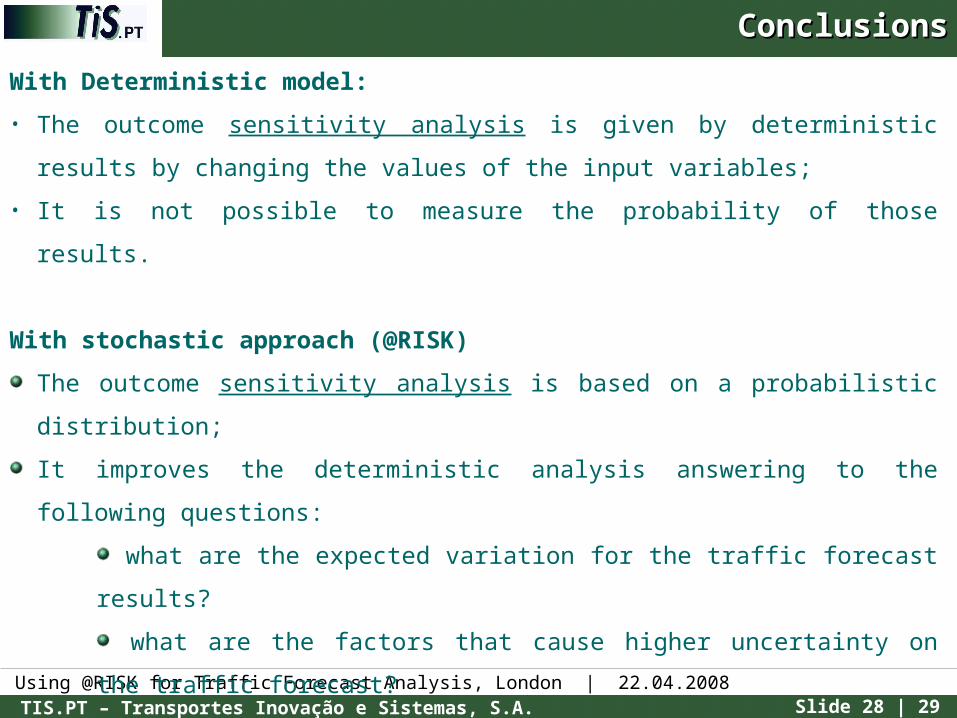
ConclusionsConclusions
With Deterministic model:
• The outcome sensitivity analysis is given by deterministic results by
changing the values of the input variables;
• It is not possible to measure the probability of those results.
With stochastic approach (@RISK)
The outcome sensitivity analysis is based on a probabilistic distribution;
It improves the deterministic analysis answering to the following
questions:
what are the expected variation for the traffic forecast results?
what are the factors that cause higher uncertainty on the traffic
forecast?
What are the risks of having less revenue than the deterministic
forecast?
For all of these, the decision (expert and client) can obtain a more
transparent and accurate approach of the outcome presented by traffic
model using @RISK analysis software.

Using @RISK for Traffic Forecast Analysis, London | 22.04.2008 TIS.PT – Transportes Inovação e Sistemas, S.A. Slide 29 | 29
ConclusionsConclusionsThe undertaken analysis allow to identify the main RISKS associated
with the Concession Traffic Forecast.
Usually, on the deterministic model we assume the most likely values
for the input variables.
The @RISK results, in this case, allows to observe that the
deterministic outcome could have been too optimistic
The information supplied by @RISK analyses allows to add information
to the traffic forecast results, improving the interpretations of the
results
In future analysis we remain with two main challenges:
to accurately replicate the relevant relations of the traffic model
in Excel (VISUM with @RISK)
to improve the methodology for the setting of the probability
distributions

Using @RISK for Traffic Forecast Analysis, London | 22.04.2008 TIS.PT – Transportes Inovação e Sistemas, S.A. Slide 30 | 29
Results Analysis – Tornado Graphs Results Analysis – Tornado Graphs
Thank You

Using @RISK for Traffic Forecast Analysis, London | 22.04.2008 TIS.PT – Transportes Inovação e Sistemas, S.A. Slide 31 | 29
Transportes, Inovação e Sistemas, S.A.Transportes, Inovação e Sistemas, S.A.
Av. da Republica, 35, 6º 1050-186 Lisboa | Portugal | www.tis.pt
Using @RISK for Traffic Forecast Analysis
Case Study: Marão Tunnel Concession
Palisade User Conference
London, 22nd April 2008
Inês Teles Afonso