QuickBooks: Point of Sale - QuickBooks Help, QuickBooks Support
Upload
mariah-merrymanCategory
view
213download
0
Using QuickBooks Pro for Ranch Accounting & Analysis
Stan BeversProfessor & Ext. EconomistTexas A&M AgriLife Extension ServiceVernon, TX
April 2, 2013The Changing Role of Risk in Livestock Production ManagementDenver, Colorado

The Cow-calf Industry as a BusinessThe Cow-calf Industry is an “Asset
Management” business that must focus on the next seven years.◦ It is not a margin business
Buy and sell margins
◦Our Primary Assets are continually eroding Our Breeding Herd
Average Replacement Rate is 16% Machinery and Equipment Fencing and Improvements
◦Approximately 45-50% of our total costs are fixed costs, not variable.

If you are not going the whole distance, then stay where you are and quit worrying about it.
Implementing and completing the MA system using QB.◦Accounting Skills
Analysis and Change◦Analytical Skills
Interpretation and Communication ◦Communication Skills
Using QuickBooks Pro for Ranch Accounting & Analysis
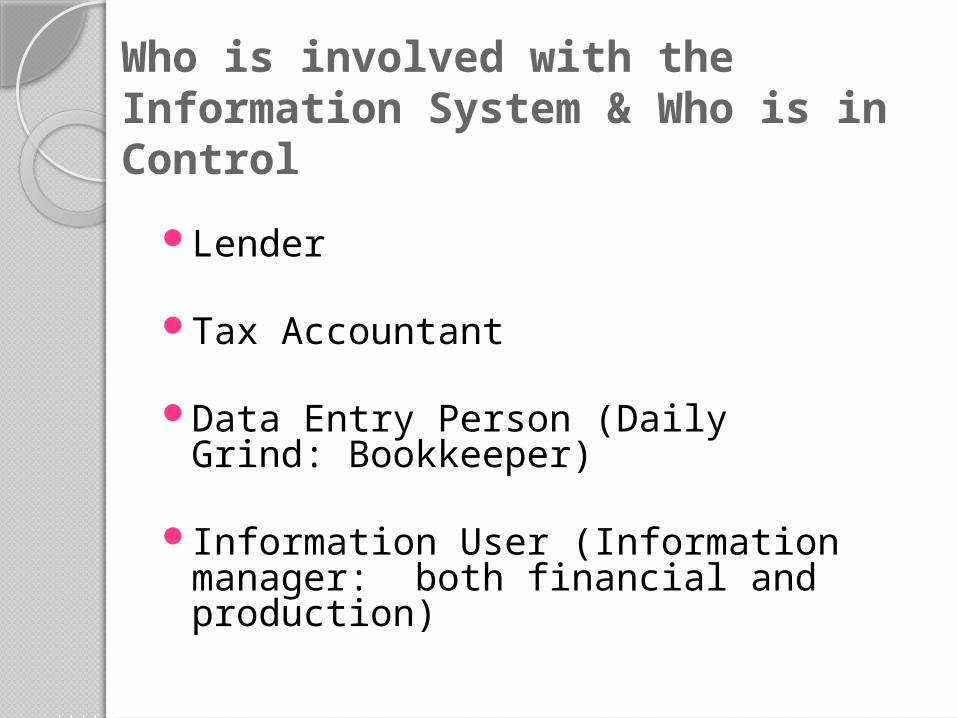
Who is involved with the Information System & Who is in Control
Lender
Tax Accountant
Data Entry Person (Daily Grind: Bookkeeper)
Information User (Information manager: both financial and production)

Start with the “End Results” in mindRanchers are always told, “you need
good financial records” but what is that? Meaningful information, which can impact the
management of the business We defined the End Products to be:
• Financial Statements Beginning and Ending Balance Sheet Profit and Loss Statement
• Financial Analysis as defined by the Sweet 16 ratios as recommended by the FFSC.
• Profit & Loss by Class• Total Unit Cost (TUC)• Commodity Cycle Reports (SPA, Yearlings, Crops)
• BUT, ultimately KPI’s defined by the management team

Question: How do you get there?Quicken won’t get you there, but it’s a
place to start if you haven’t done anything and your skills are lacking.
QuickBooks Pro will partially get you there, however, some accounting knowledge is required and the program’s flexibility can cause problems.

Ranch Accounting Using QuickBooks Pro
Create the system with the end products in mind.
Create a rigid structure for QB Pro and we don’t give the user many choices.◦ Our Chart of Accounts◦ Your Class List using Our Approach.
Follow the Timeline…◦ Introduction to QuickBooks Pro (Daily
Grind)◦ Advanced QuickBooks Pro (The Rest of the
Story)Incorporate Microsoft Excel.

Implementing the MA SystemImport chart of accounts
◦Add & delete accounts to fit the operation (use caution) Understand the role of the transfer
accounts
◦Includes B\S accounts◦Get to know your COA◦Print COA for reference
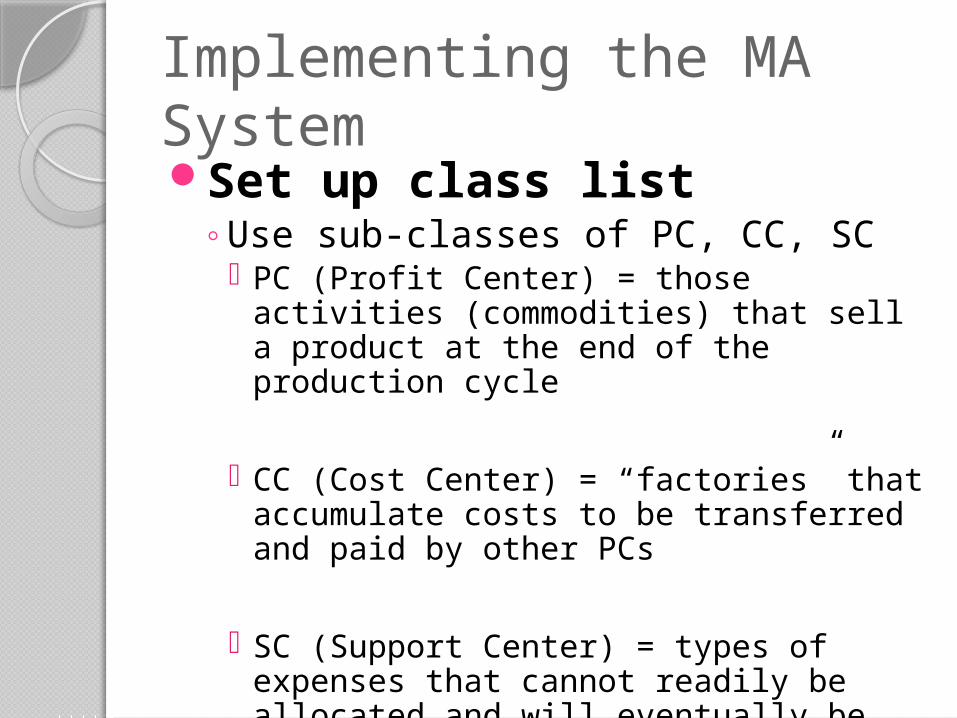
Implementing the MA SystemSet up class list
◦Use sub-classes of PC, CC, SC PC (Profit Center) = those activities
(commodities) that sell a product at the end of the production cycle
CC (Cost Center) = “factories” that accumulate costs to be transferred and paid by other PCs
SC (Support Center) = types of expenses that cannot readily be allocated and will eventually be paid by PCs
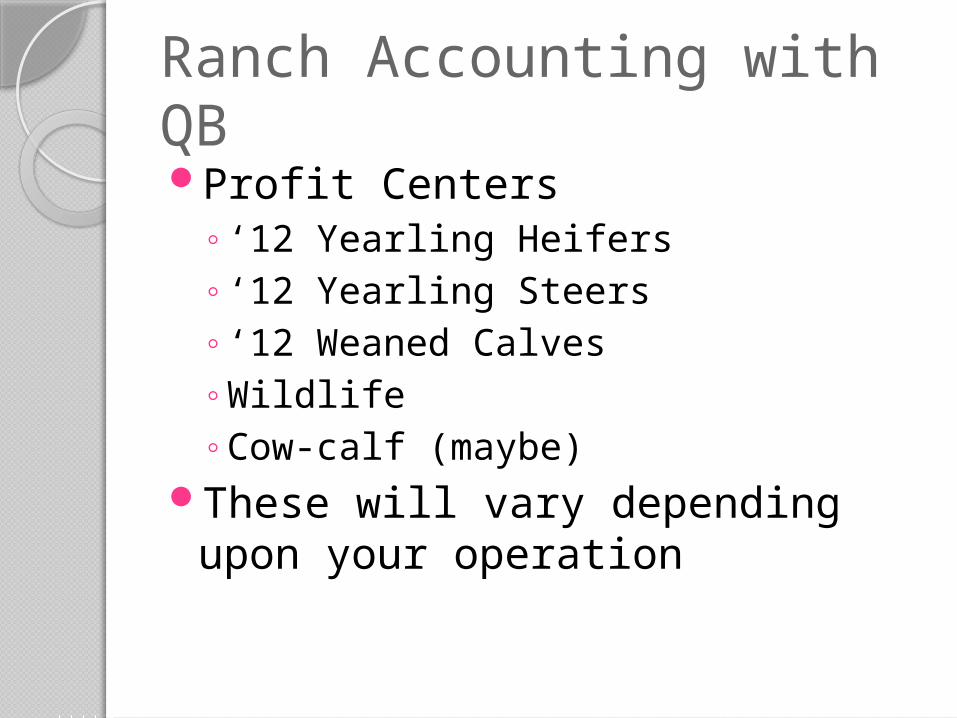
Profit Centers◦‘12 Yearling Heifers◦‘12 Yearling Steers◦‘12 Weaned Calves◦Wildlife◦Cow-calf (maybe)
These will vary depending upon your operation
Ranch Accounting with QB

Cost Centers◦Cow-calf (maybe)◦‘11 Repl Heifers◦‘10 Repl Heifers◦Hay Production◦Grazing
These will vary depending upon your operation
Ranch Accounting with QB

Support Centers◦Finance (Interest)◦Machinery & Equipment (M&E)◦Labor & Management (L&M)◦General & Administrative (G&A)
These are always the same
Ranch Accounting with QB
Management vs. Tax Accounting
Major differences◦Tax = cash, MA = accrual adjusted◦Depreciation method◦Capitalization◦Handling of “management and labor”
However, within the MA system, tax integrity is maintained

Management vs. Tax Accounting
How is “tax” integrity maintained in QuickBooks?◦MA transactions take place below “Net
Ordinary Income” Except for depreciation, mgmt. labor, cost
of good sold, gains/losses on sale of assets. Your tax preparer should re-calculate
◦MA transactions accomplished with “classes” and additional accounts Other Incomes Other Expenses

Specific Ranch Accounting IssuesThe Breeding Herd
◦Capitalization of raised livestock◦Only if determinable useful life◦If indeterminable, must expense in
current year◦BIG PROBLEM with the cow-calf industry◦Without this, you never really know the
financial health of your cow herd.◦And, inventory of livestock is rarely
reconciled with Asset List (Depreciation Schedule).

Specific Ranch Accounting IssuesDepreciation
◦Tax = accelerated + sec 179◦Book = represents allocation of
asset’s cost over useful life◦Does it really matter that she was
raised?◦Book depreciation can be easily
provided with minimal cost, or…◦In some operations, you may want to
purchase your own “fixed asset” software

Specific Ranch Accounting IssuesMA includes management
(owner) labor as expense (non-deductible)◦There is value to the services that
you provide your ownership. If there wasn’t you wouldn’t be doing it
◦I encourage you to write yourself a check (withdrawals) and deposit it into a personal account
◦What would it cost you to hire someone to do what you do?

Specific Ranch Accounting IssuesAccumulated costs for incomplete
classes are transferred to B/S◦Think about retaining weaned calves
across calendar years◦Use journal entry to increase “Investment
in …” account (current asset) and decrease expense for that class
◦Recognized as expense in year income occurs (matching principle)
◦Developing Replacement Heifers

Implementing the SystemTime Line1. “Daily Grind”2. Check Unclassified Column3. Track Loans- Loan Transaction
Histories4. Update Asset List (Additions &
Disposals)5. Book Accrual Adjustments (Mgmt
Labor & Other Resources Used)6. Is it reasonable?

Implementing the MA SystemTime Line
7. Allocate Support Centers8. Transfer Cost Centers9. Capitalize Unfinished Profit
Centers10. Reports
• Profit & Loss by Class• FinAnalysis• Total Unit Cost • Commodity Reports

Implementing the MA System
The daily grind◦Not much more than you should be
doing already◦Assign account and class to every
transaction that affects the IS◦Develop your routine and be consistent

Implementing the MA SystemReconcile accounts
◦Bank accounts (checking)◦Payables
Clean up bills to be paid
◦Were note payments handled correctly? (principle vs. interest)

Implementing the MA System
Reconcile Loans◦ Get “Loan Transaction History” from creditor◦ Reconcile each loan advance and each payment with QuickBooks
Asset disposals/additions◦ Asset Reconciliation including the breeding herd.◦ “Book” asset disposals◦ Was purchase made with check or loan proceeds? Was there a
trade involved?◦ Book CY depreciation
Management Labor◦ Your labor is a resource that was used by the business!
Seek advice or services of an accounting professional
Implementing the MA SystemExamine P&L by class
(Reasonable Test)◦Watch for “unclassified” transactions◦Were transactions classified
correctly?◦Memorize re-occurring transactions

Year End ActivitiesAccrual adjustments
◦ Prepaid expenses, payables, receivables◦ Management labor◦ Inventory◦ Depreciation (straight-line basis)
Allocate support centers (Excel worksheets)
Transfer cost centers (Excel worksheets)Send “incomplete” centers to the
balance sheetCompile reports (Excel worksheets)

Real Life 2012 3,000 Cow Example Profit
Centers◦ ‘11 Yrlng Str
◦ ‘11 Yrlng Hfr
◦ Cow-calf
◦ Grain – Dry
◦ Grain – Irrig
◦ Wildlife
Cost Centers
Hay Prod ‘12 Rep
Hfrs ‘11 Rep
Hfrs ‘10 Rep
Hfrs
Support Centers
G&A M&E L&M

Real Life 2012 Example SC G&A Allocation
$574,369
$23,243 (4%) PC: ’11 Yrlng Hfr
$206,608 (36%)PC: Cow-calf
$7,748 (1%) PC: ‘11 Yrlng Str
$4,132 (1%) PC: Grain Dry
$2,066 (1/2%) PC: Wildlife
After allocations are made, all support centers should have a zero net income.
$185,947 (32%)CC: Hay
$123,965 (22%)CC: ‘11 Rep Hfrs
$20,661 (4%) PC: Grain Irr

YEA – ReportsP&L (Net Ordinary Income) to
CPAP&L by class and balance sheetFin AnalysisTotal Unit Cost ReportCommodity Reports
◦Note: Bottom 2 reports combine with production data

Real Life 3,000 Cow Example
2009 2010 2011 2012
ROA 1.87% 0.87% 7.26% 12.63%
Net Income from Operations
$172,644
$83,613 $724,470
$1,367,148
Asset Turnover Ratio 0.21% 0.19% 0.26% 0.30%
Operating Expense Ratio
62.0% 61.3% 44.9% 35.3%
Interest Expense Ratio 0.0% 0.0% 0.0% 0.0%
Depreciation Expense Ratio
28.9% 34.2% 26.7% 22.3%
Net Income Ratio 9.1% 4.5% 28.4% 42.5%

Real Life 3,000 Cow Example
2009 2010 2011 2012
Cow-calf (/ Female) $578.76 $683.72 $678.82 $723.31
Cow-calf (/ Cwt. Weaned)
$92.63 $110.13 $98.35 $106.77
Hay Production (/ Ton) $49.46 $59.79 $62.98 $70.59
Replacement Heifer (/Head)
$1,554.70
$997.32 $1,027.78
$1,280.54

REAL LIFE EXAMPLE
Slides taken from a specific ranch and it’s presentation at it’s Board of Directors meeting. Salary committee meeting to determine ranch manager’s compensation followed this presentation.

Key Performance IndicatorsBased on management and
Board of Director input, Key Performance Indicators (KPI’s) have been established
They include both production and financial measures
These indicators are use to evaluate performance and establish goals

KPIProduction
Pregnancy percentageCalving percentageWeaning percentageWeaning weight per headLbs. weaned per cow exposedTotal cost per cowUnit cost of weaned calf (break
even)

KPIProduction – Unit Cost (Breakeven)
2008 2009 2010 2011 2012 $-
$100.00
$200.00
$300.00
$400.00
$500.00
$600.00
$700.00
$800.00
Total Cost/CowUnit Cost/Calf per CWTPrice Received

KPIFinancial
Working capitalROANet Income from Operations (pre
interest & income tax)
Ratios◦Operating Expense◦Depreciation Expense◦Interest Expense◦Net Income from Operations

KPIFinancial - ROA
20082009
20102011
2012
0.00%
2.00%
4.00%
6.00%
8.00%
10.00%
12.00%
14.00%

KPIOperating Ratios
2008 2009 2010 2011 20120.0%
20.0%
40.0%
60.0%
80.0%
100.0%
Depreciation ExpenseOperating ExpenseNet Income - OperationsInterest Expense

If you are not going the whole distance, then stay where you are.
Implementing and completing the MA system.◦Accounting Skills
Analysis and Change◦Analytical Skills
Interpretation and Communication ◦Communication Skills

Contact Information
Stan BeversProfessor & Ext. EconomistTexas A&M AgriLife Extension ServiceP.O. Box 2159Vernon, TX 76385940 552-9941, ext. [email protected]
Website:http://agrisk.tamu.edu