Using Prometheus and Grafana to build a Postgres Dashboard - Welcome - PostgreSQL … · Using...
45
Using Prometheus and Grafana to build a Postgres Dashboard Gregory Stark October 25, 2018 Gregory Stark Monitoring Postgres
Transcript of Using Prometheus and Grafana to build a Postgres Dashboard - Welcome - PostgreSQL … · Using...

Using Prometheus and Grafana to build a Postgres Dashboard
Gregory Stark
October 25, 2018
Gregory Stark Monitoring Postgres
What is Monitoring?
Gregory Stark Monitoring Postgres
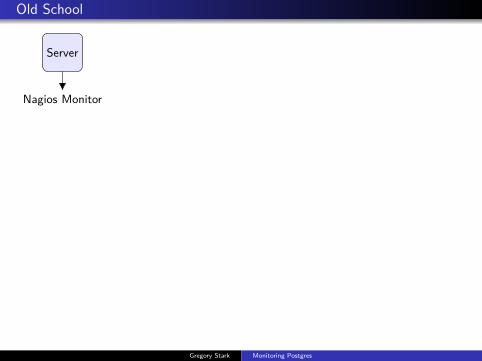
Old School
Server
Nagios Monitor
Gregory Stark Monitoring Postgres
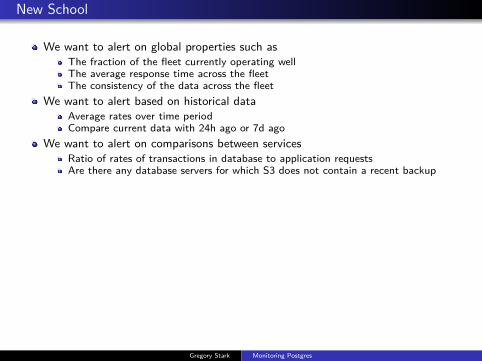
New School
We want to alert on global properties such asThe fraction of the fleet currently operating wellThe average response time across the fleetThe consistency of the data across the fleet
We want to alert based on historical dataAverage rates over time periodCompare current data with 24h ago or 7d ago
We want to alert on comparisons between servicesRatio of rates of transactions in database to application requestsAre there any database servers for which S3 does not contain a recent backup
Gregory Stark Monitoring Postgres

The Tools
PrometheusDatabase specifically designed for handling time series. It performsrecorded queries regularly to synthesize new time series and to generatealerts.
AlertmanagerPart of Prometheus project. Handles generating notifications for alerts.
node exporterAgent for system statsitics. For more agents see:https://prometheus.io/docs/instrumenting/exporters/
postgres exporterAgent that exports statistics from pg stat * views
mtailUseful to fill gaps where Postgres doesn’t provide a statistics views toexpose them. e.g. log min duration, log lock waits
GrafanaWYSIWYG dashboard software.
Gregory Stark Monitoring Postgres
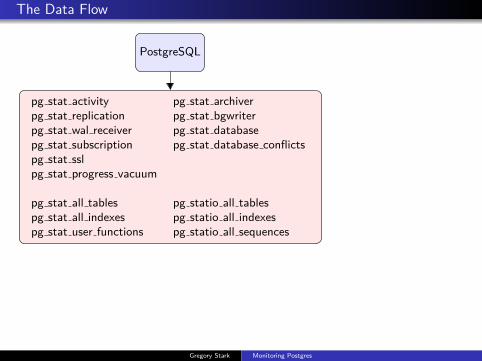
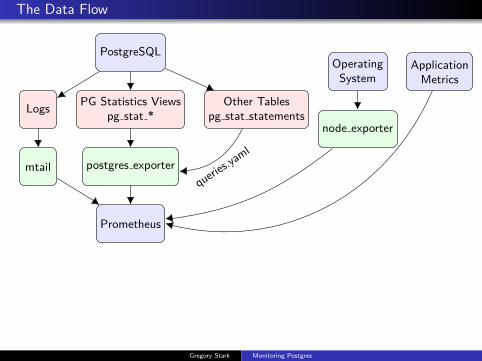
The Data Flow
PostgreSQL
pg stat activity pg stat archiverpg stat replication pg stat bgwriterpg stat wal receiver pg stat databasepg stat subscription pg stat database conflictspg stat sslpg stat progress vacuum
pg stat all tables pg statio all tablespg stat all indexes pg statio all indexespg stat user functions pg statio all sequences
Gregory Stark Monitoring Postgres

The Data Flow
PostgreSQL
PG Statistics Viewspg stat *
Gregory Stark Monitoring Postgres

The Data Flow
PostgreSQL
PG Statistics Viewspg stat *Logs
Gregory Stark Monitoring Postgres

The Data Flow
PostgreSQL
PG Statistics Viewspg stat *Logs Other Tables
pg stat statements
Gregory Stark Monitoring Postgres

The Data Flow
PostgreSQL
PG Statistics Viewspg stat *Logs Other Tables
pg stat statements
postgres exporterqueries.yaml
Gregory Stark Monitoring Postgres

The Data Flow
PostgreSQL
PG Statistics Viewspg stat *Logs Other Tables
pg stat statements
postgres exporterqueries.yaml
mtail
Gregory Stark Monitoring Postgres

The Data Flow
PostgreSQL
PG Statistics Viewspg stat *Logs Other Tables
pg stat statements
postgres exporterqueries.yaml
mtail
Prometheus
Gregory Stark Monitoring Postgres
The Data Flow
PostgreSQL
PG Statistics Viewspg stat *Logs Other Tables
pg stat statements
postgres exporterqueries.yaml
mtail
Prometheus
OperatingSystem
node exporter
ApplicationMetrics
Gregory Stark Monitoring Postgres
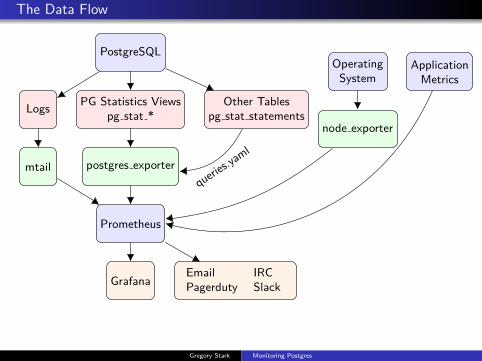
The Data Flow
PostgreSQL
PG Statistics Viewspg stat *Logs Other Tables
pg stat statements
postgres exporterqueries.yaml
mtail
Prometheus
OperatingSystem
node exporter
ApplicationMetrics
GrafanaEmail IRCPagerduty Slack
Gregory Stark Monitoring Postgres
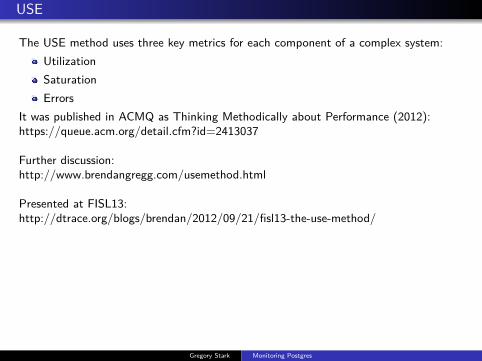
USE
The USE method uses three key metrics for each component of a complex system:UtilizationSaturationErrors
It was published in ACMQ as Thinking Methodically about Performance (2012):https://queue.acm.org/detail.cfm?id=2413037
Further discussion:http://www.brendangregg.com/usemethod.html
Presented at FISL13:http://dtrace.org/blogs/brendan/2012/09/21/fisl13-the-use-method/
Gregory Stark Monitoring Postgres

RED
The RED model uses latency (duration) instead of utilization:
RateErrorsDuration
From:https://www.weave.works/blog/the-red-method-key-metrics-for-microservices-architecture/
See also:https://www.vividcortex.com/blog/monitoring-and-observability-with-use-and-red
Gregory Stark Monitoring Postgres

Google’s SRE Golden Signals
SRE Golden Signals are very similar:LatencyTrafficErrorsSaturation
Orginally published in Site Reliability Book:
Also see discussion at:https://medium.com/devopslinks/how-to-monitor-the-sre-golden-signals-1391cadc7524
Gregory Stark Monitoring Postgres

PromQL
Gregory Stark Monitoring Postgres

PromQL
Gregory Stark Monitoring Postgres

PromQL
Gregory Stark Monitoring Postgres

Alerts - Rate
groups:- name: postgresql.rules
rules:- alert: PostgreSQL_CommitRateTooLow
expr: |rate(pg_stat_database_xact_commit{datname="gitlabhq_production",
environment="prd"}[1m]) < 1000for: 2mlabels:
severity: warnchannel: database
annotations:description: |
Commits/s on {{$labels.instance}} database {{$labels.datname}}is {{$value | printf "%.0f" }} which is implausibly low.Perhaps the application is unable to connect
runbook: troubleshooting/postgresql.md#availabilitytitle: 'Postgres seems to be processing very few transactions'
Gregory Stark Monitoring Postgres

Alerts - Errors
groups:- name: postgresql.rules
rules:- alert: PostgreSQL_RollbackRateTooHigh
expr: |rate(pg_stat_database_xact_rollback{datname="gitlabhq_production"}[5m])
/ ON(instance, datname)rate(pg_stat_database_xact_commit{datname="gitlabhq_production"}[5m])
> 0.02for: 5mlabels:
severity: warnchannel: database
annotations:description: |
Ratio of transactions being aborted compared to committed is{{$value | printf "%.2f" }} on {{$labels.instance}}
runbook: troubleshooting/postgresql.md#errorstitle: 'Postgres transaction rollback rate is high'
Gregory Stark Monitoring Postgres

Alerts - Saturation
groups:- name: postgresql.rules
rules:- alert: PostgreSQL_ConnectionsTooHigh
expr: |sum(pg_stat_activity_count) BY (environment, instance)
> ON(instance)pg_settings_max_connections * 0.75
for: 10mlabels:
severity: warnchannel: database
annotations:runbook: troubleshooting/postgresql.md#connectionstitle: |
Postgres has {{$value}} connections on {{$labels.instance}}which is close to the maximum
Gregory Stark Monitoring Postgres

Alerts - more Errors
# Count of specific types of errors -- notably statement timeoutscounter postgresql_logs_total by severitycounter postgresql_errors_total by type
/ˆ[0-9_:.-]* [a-z0-9-]* postgresql: (?P<date>\d\d\d\d-\d\d-\d\d \d\d:\d\d:\d\d [A-Z]{3}) \[[0-9]*\]:\[[0-9]*-1\] (?P<severity>DEBUG[1-5]|INFO|NOTICE|WARNING|ERROR|LOG|FATAL|PANIC): / {
postgresql_logs_total[$severity]++
/ERROR: (?P<message>.*)$/ {/canceling statement due to statement timeout/ {
postgresql_errors_total["statement_timeout"]++}/canceling autovacuum task/ {
postgresql_errors_total["canceled_autovacuum"]++}/deadlock detected/ {
postgresql_errors_total["deadlock_detected"]++}/duplicate key value violates unique constraint/ {
postgresql_errors_total["duplicate_key"]++}otherwise {
postgresql_errors_total["other"]++}
}}
Gregory Stark Monitoring Postgres

Alerts
groups:- name: postgresql.rules
rules:- alert: PostgreSQL_StatementTimeout_Errors
expr: |rate(postgresql_errors_total{type="statement_timeout"}[1m]) > 0.5
for: 5mlabels:
severity: warnchannel: database
annotations:descrition: |
Database {{$labels.instance}} is logging{{ $value | printf "%.1f" }} statement timeouts per second
runbook: troubleshooting/postgresql.md#errorstitle: 'Postgres transactions showing high rate of statement timeouts'
Gregory Stark Monitoring Postgres

Alerts - Exposing hidden problems
pg_replication:query: |
SELECT EXTRACT(epoch FROM (now() - pg_last_xact_replay_timestamp()
))::int AS lag,CASE WHEN pg_is_in_recovery() THEN 1 ELSE 0 END AS is_replica
metrics:- lag:
usage: "GAUGE"description: "Replication lag behind primary in seconds"
- is_replica:usage: "GAUGE"description: "Indicates if this host is a replica"
Gregory Stark Monitoring Postgres

Alerts - Exposing hidden problems
groups:- name: postgresql.rules
rules:- alert: PostgreSQL_ReplicationLagTooLarge
expr: |(pg_replication_lag > 120)
AND ON(instance)(pg_replication_is_replica == 1)
annotations:description: |
Replication lag on server {{$labels.instance}} is currently{{$value | humanizeDuration }}
runbook: troubleshooting/postgres.md#replication-is-lagging-or-has-stoppedtitle: 'Postgres Replication lag is over 2 minutes'
Gregory Stark Monitoring Postgres

Alerts - Exposing hidden problems
pg_replication_slots:query: |
SELECT slot_name, slot_type,case when active then 1.0 else 0.0 end AS active,age(xmin) AS xmin_age,age(catalog_xmin) AS catalog_xmin_age,
FROM pg_replication_slotsmetrics:
- slot_name:usage: "LABEL"description: "Slot Name"
- slot_type:usage: "LABEL"description: "Slot Type"
- active:usage: "GAUGE"description: "Boolean flag indicating whether this slot has a consumer streaming from it"
- xmin_age:usage: "GAUGE"description: "Age of oldest transaction that cannot be vacuumed due to this replica"
- catalog_xmin_age:usage: "GAUGE"description: "Age of oldest transaction that cannot be vacuumed from catalogs due to this replica (used by logical replication)"
Gregory Stark Monitoring Postgres

Alerts - Exposing hidden problems
groups:- name: postgresql.rules
rules:- alert: PostgreSQL_UnusedReplicationSlot
expr: 'pg_replication_slots_active == 0'for: 30mlabels:
severity: warnchannel: database
annotations:description: |
Unused {{$labels.slot_type}} slot "{{$labels.slot_name}}"on {{$labels.instance}}
Gregory Stark Monitoring Postgres
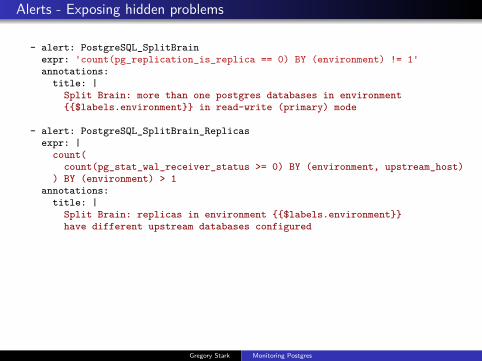
Alerts - Exposing hidden problems
- alert: PostgreSQL_SplitBrainexpr: 'count(pg_replication_is_replica == 0) BY (environment) != 1'annotations:
title: |Split Brain: more than one postgres databases in environment{{$labels.environment}} in read-write (primary) mode
- alert: PostgreSQL_SplitBrain_Replicasexpr: |
count(count(pg_stat_wal_receiver_status >= 0) BY (environment, upstream_host)
) BY (environment) > 1annotations:
title: |Split Brain: replicas in environment {{$labels.environment}}have different upstream databases configured
Gregory Stark Monitoring Postgres

Alerts - Miscellaneous
- alert: PostgreSQL_FleetSizeChangeexpr: 'postgres:databases != postgres:databases OFFSET 2m'annotations:
description: 'There are now {{$value}} databases in "{{$labels.environment}}"'title: 'Number of PostgreSQL Databases in {{$labels.environment}} has changed'
- alert: PostgreSQL_RoleChangeexpr: 'pg_replication_is_replica and changes(pg_replication_is_replica[1m]) > 0'
title: 'Postgres Database replica promotion occurred in "{{$labels.environment}}"'
- alert: PostgreSQL_ConfigurationChangeexpr: |
{__name__=˜"pg_settings_.*"} !=ON(__name__, instance){__name__=˜"pg_settings_.*",__name__!="pg_settings_transaction_read_only"}OFFSET 10m
Gregory Stark Monitoring Postgres

The GUI Dashboard
Gregory Stark Monitoring Postgres

The GUI Dashboard
Gregory Stark Monitoring Postgres

The GUI Dashboard
Gregory Stark Monitoring Postgres

pg stat statements
pg_stat_statements:query: |
SELECTpg_get_userbyid(userid) as user,pg_database.datname,pg_stat_statements.queryid,pg_stat_statements.calls,pg_stat_statements.total_time as time_milliseconds,pg_stat_statements.rows,pg_stat_statements.shared_blks_hit,pg_stat_statements.shared_blks_read,pg_stat_statements.shared_blks_dirtied,pg_stat_statements.shared_blks_written,pg_stat_statements.local_blks_hit,pg_stat_statements.local_blks_read,pg_stat_statements.local_blks_dirtied,pg_stat_statements.local_blks_written,pg_stat_statements.temp_blks_read,pg_stat_statements.temp_blks_written,pg_stat_statements.blk_read_time,pg_stat_statements.blk_write_timeFROM pg_stat_statementsJOIN pg_database
ON pg_database.oid = pg_stat_statements.dbid
Gregory Stark Monitoring Postgres

pg stat statements
metrics:- user:
usage: "LABEL"description: "The user who executed the statement"
- datname:usage: "LABEL"description: "The database in which the statement was executed"
- queryid:usage: "LABEL"description: "Internal hash code, computed from the statement's parse tree"
- calls:usage: "COUNTER"description: "Number of times executed"
- time_milliseconds:usage: "COUNTER"description: "Total time spent in the statement, in milliseconds"
- rows:usage: "COUNTER"description: "Total number of rows retrieved or affected by the statement"
- shared_blks_hit:usage: "COUNTER"description: "Total number of shared block cache hits by the statement"
- shared_blks_read:usage: "COUNTER"description: "Total number of shared blocks read by the statement"
- shared_blks_dirtied:usage: "COUNTER"description: "Total number of shared blocks dirtied by the statement"
- shared_blks_written:usage: "COUNTER"description: "Total number of shared blocks written by the statement"
- local_blks_hit:usage: "COUNTER"description: "Total number of local block cache hits by the statement"
- local_blks_read:usage: "COUNTER"description: "Total number of local blocks read by the statement"
- local_blks_dirtied:usage: "COUNTER"description: "Total number of local blocks dirtied by the statement"
- local_blks_written:usage: "COUNTER"description: "Total number of local blocks written by the statement"
- temp_blks_read:usage: "COUNTER"description: "Total number of temp blocks read by the statement"
- temp_blks_written:usage: "COUNTER"description: "Total number of temp blocks written by the statement"
- blk_read_time:usage: "COUNTER"description: "Total time the statement spent reading blocks, in milliseconds"
- blk_write_time:usage: "COUNTER"description: "Total time the statement spent writing blocks, in milliseconds"
Gregory Stark Monitoring Postgres
pg stat statements
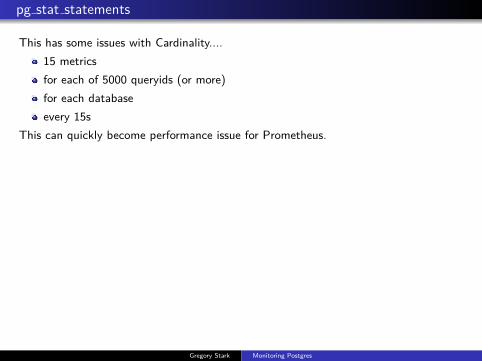
This has some issues with Cardinality....15 metricsfor each of 5000 queryids (or more)for each databaseevery 15s
This can quickly become performance issue for Prometheus.
Gregory Stark Monitoring Postgres
pg stat statements
Gregory Stark Monitoring Postgres

pg stat statements
Gregory Stark Monitoring Postgres

pg stat statements
Gregory Stark Monitoring Postgres

pg stat statements
Gregory Stark Monitoring Postgres

pg stat statements
Gregory Stark Monitoring Postgres

Future things to address
Missing stats in postgres exporterQueries.yaml requires a good understanding of Postgres *and* Prometheus towrite. It also makes rules and dashboards non-portable which is a major downside.It’s considered an “anti-pattern” in Prometheus exporter world.
Missing data in pg stats *: errors, lock timing, slow queriesIf you have more please tell me, I’ll be working on adding these in the future.
Saturation is basically impossible to measure in Postgrespg stat activity does not really represent saturation very well whenapplications keep persistent connections and use pooling of any form. If you filteron state=active it’s useful but still very coarse and incomplete representation.There’s a pgbouncer exporter as well and you can add instrumentation to yourapplication to address this. But it would be good to identify standard ways ofmeasuring Postgres saturation.
Gregory Stark Monitoring Postgres

Future things to address
postgres exporter should be eliminated entirelyIt would be much preferable to have Postgres speak common monitoring protocolsdirectly. That would make the statistics more consistent, reliable, and easier todeploy.
Distributed TracingThis is different from but complementary to monitoring and is a major gap thatwould help expose the connections between database metrics and applicationmetrics.
Gregory Stark Monitoring Postgres

More information
This presentation is online at:https://_stark.gitlab.io/monitoring-postgres-pgconf.eu-2018/monitoring.pdf
Gitlab Project for presentation at:https://gitlab.com/_stark/monitoring-postgres-pgconf.eu-2018
Source code for presentation at:https://gitlab.com/_stark/monitoring-postgres-pgconf.eu-2018.git
Author contact address:[email protected]
Gregory Stark Monitoring Postgres