Using Poincaré and Coefficient Analyses to Assess Changes ...
22
University of Tennessee, Knoxville University of Tennessee, Knoxville TRACE: Tennessee Research and Creative TRACE: Tennessee Research and Creative Exchange Exchange Chancellor’s Honors Program Projects Supervised Undergraduate Student Research and Creative Work 5-2016 Using Poincaré and Coefficient Analyses to Assess Changes in Using Poincaré and Coefficient Analyses to Assess Changes in Variability in Respiration as a Function of Leptin Status, Sex, and Variability in Respiration as a Function of Leptin Status, Sex, and Buprenorphine in Mice Buprenorphine in Mice Wateen Hussein Alami [email protected] Follow this and additional works at: https://trace.tennessee.edu/utk_chanhonoproj Part of the Numerical Analysis and Computation Commons, Other Chemicals and Drugs Commons, and the Other Pharmacy and Pharmaceutical Sciences Commons Recommended Citation Recommended Citation Alami, Wateen Hussein, "Using Poincaré and Coefficient Analyses to Assess Changes in Variability in Respiration as a Function of Leptin Status, Sex, and Buprenorphine in Mice" (2016). Chancellor’s Honors Program Projects. https://trace.tennessee.edu/utk_chanhonoproj/1995 This Dissertation/Thesis is brought to you for free and open access by the Supervised Undergraduate Student Research and Creative Work at TRACE: Tennessee Research and Creative Exchange. It has been accepted for inclusion in Chancellor’s Honors Program Projects by an authorized administrator of TRACE: Tennessee Research and Creative Exchange. For more information, please contact [email protected].
Transcript of Using Poincaré and Coefficient Analyses to Assess Changes ...

University of Tennessee, Knoxville University of Tennessee, Knoxville
TRACE: Tennessee Research and Creative TRACE: Tennessee Research and Creative
Exchange Exchange
Chancellor’s Honors Program Projects Supervised Undergraduate Student Research and Creative Work
5-2016
Using Poincaré and Coefficient Analyses to Assess Changes in Using Poincaré and Coefficient Analyses to Assess Changes in
Variability in Respiration as a Function of Leptin Status, Sex, and Variability in Respiration as a Function of Leptin Status, Sex, and
Buprenorphine in Mice Buprenorphine in Mice
Wateen Hussein Alami [email protected]
Follow this and additional works at: https://trace.tennessee.edu/utk_chanhonoproj
Part of the Numerical Analysis and Computation Commons, Other Chemicals and Drugs Commons,
and the Other Pharmacy and Pharmaceutical Sciences Commons
Recommended Citation Recommended Citation Alami, Wateen Hussein, "Using Poincaré and Coefficient Analyses to Assess Changes in Variability in Respiration as a Function of Leptin Status, Sex, and Buprenorphine in Mice" (2016). Chancellor’s Honors Program Projects. https://trace.tennessee.edu/utk_chanhonoproj/1995
This Dissertation/Thesis is brought to you for free and open access by the Supervised Undergraduate Student Research and Creative Work at TRACE: Tennessee Research and Creative Exchange. It has been accepted for inclusion in Chancellor’s Honors Program Projects by an authorized administrator of TRACE: Tennessee Research and Creative Exchange. For more information, please contact [email protected].
Using Poincaré and Coefficient Analyses to Assess Changes in Variability in
Respiration as a Function of Leptin Status, Sex, and Buprenorphine in Mice.
Wateen Alami
University of Tennessee, Knoxville, TN
Submitted in Partial Fulfillment
of the
Requirements for an Undergraduate Honors Thesis in Psychology Department
Submitted 05 May, 2016

Wateen Alami Honors Thesis 5/03/16
Page 2 of 21
Abstract
Background: Opioids are the main class of drugs used for management of acute and
chronic pain. One of the unwanted side effects of opioids, such as buprenorphine, is
respiratory depression. Opioid-induced depression is especially problematic in obese and
female patients, but the mechanisms underlying these associations are not understood.
Recent studies have used descriptive and inferential statistics to evaluate the hypothesis
that the cytokine leptin, secreted by fat cells, contributes to buprenorphine-induced
respiratory depression in male and female mice. These analyses have begun to
quantitatively phenotype breathing as a function of leptin status and buprenorphine
administration. The goal of this honors thesis was to test the hypothesis that additional
analytic techniques such as Poincaré analysis and coefficient of variation could reveal
feature of breathing that are not visualized by inferential statistics.
Methods: The raw data included measures of minute ventilation (ml/min/g body weight)
of both male and female mice after they were administered saline (control) or
buprenorphine. Buprenorphine effects on breathing were measured in mice that 1) lack
leptin and are obese (Lepob); 2) lack leptin receptors, are obese and diabetic (Leprdb); 3)
have normal weight and leptin levels (C57Bl/6J).
Results: The Poincaré analysis revealed that male mice showed more variability in
breathing than female mice. In addition, normal, wild type mice showed more respiratory
variability than obese mice. All mice showed decrease in variability in minute ventilation
data after injection of buprenorphine.
Conclusion: The results support the hypothesis that Poincaré analyses were superior to
coefficient of variation in visualizing and quantifying variability in control of breathing.

Wateen Alami Honors Thesis 5/03/16
Page 3 of 21
The results are significant in demonstrating that Poincaré analyses provide a novel tool
for efforts to better characterize the role of leptin dysfunction, difference in sex, and
buprenorphine as contributors to respiratory depression.

Wateen Alami Honors Thesis 5/03/16
Page 4 of 21
Introduction:
Chronic pain (defined as persisting for 3 months) is a significant problem that
effects 20-30% of population worldwide2. The widespread presence of chronic pain will
continue to accumulate as the prevalence of related diseases such as obesity and cancer
increase2. There has been a rise in opioid prescriptions as a result of the increased number
of individuals experiencing pain2. Opioids are analgesics that have been used for
millennia22 due to their effectiveness in treating pain. Many opioids, such as morphine
and fentanyl produce analgesia by activating mu opioid receptors throughout the nervous
system and decreasing neuronal excitability. The activation of mu receptors not only
causes an analgesic effect, but also leads to a euphoric feeling and respiratory depression,
a common, unwanted effect of opioids. In the U.S. alone in 2014, there were 28,647
reported deaths involved opioids23. Buprenorphine is a drug suggested to be more useful
because it causes less respiratory depression while still providing an analgesia.
Buprenorphine is a partial mu agonist, meaning it has high affinity for mu receptors, but a
lower efficacy, the maximum response achievable, than a full mu agonists like morphine1,
15. As a result, buprenorphine has a ceiling effect that allows for the increase of dosage
without causing an increase in respiratory depression15. In addition, buprenorphine is a
kappa opioid receptor antagonist with decreased abuse potential15.
Though buprenorphine is suggested to be a useful opioid because of its analgesic
effects and lesser potential for respiratory depression and abuse potential, it has only been
tested in normal healthy weight male subjects. This limited testing is problematic since
individuals who are more likely to experience chronic pain are women and obese
Wateen Alami Honors Thesis 5/03/16
Page 5 of 21
individuals8, 19, 25. Buprenorphine testing limited to healthy male individuals makes it
impossible to determine how factors such as sex and obesity, contribute to
buprenorphine-induced respiratory depression. Recent preliminary studies using mice
suggest that leptin, a cytokine secreted by fat cells, plays a role in buprenorphine-induced
respiratory depression in male and female mice 4, 5.
By using analytical techniques to characterize the variability in the respiratory
data, breathing can be phenotyped as a function of leptin status, sex, and buprenorphine
administration. A recent human study suggested that analyzing variability in minute
ventilation and tidal volume predicted which subjects would experience opioid-induced
respiratory depression12. That study found that individuals who had more variability in
their minute ventilation and tidal volume recordings, experienced less respiratory
depression after opioid injections12. Such a finding implies the potential to predict which
patients are at greatest risk for opioid-induced respiratory depression.
Obese humans are at greater risk of experiencing opioid-induced respiratory
depression than are age and sex-matched normal weight patients10, 18, 19 In addition,
women also have a greater risk of having opioid induced-respiratory depression in
comparison to their male counterparts of similar age and weight6, 11, 19. Accordingly, this
thesis research hypothesized that obese mice and female mice, which also exhibit
buprenorphine-induced respiratory depression4, 5, would display less variability in
measures of minute ventilation. The hypothesis was tested by quantifying respiratory
variability using Poincaré analyses and coefficient of variation in data reported recently 4,
5. The results described in this thesis support the hypothesis that male mice showed more
variability in their breathing than female mice, and normal, wild type, mice showed more

Wateen Alami Honors Thesis 5/03/16
Page 6 of 21
respiratory variability than obese mice. The ability to respond to a ventilatory challenge
requires being able to vary respiratory rate and volume of inspiration. Therefore, these
results support the interpretation that leptin dysfunction and buprenorphine are associated
with respiratory depression.
METHODS:
Drug Administration and Respiratory Measures
The data to be analyzed using Poincaré and coefficient of variation were obtained
from my previous studies on the respiratory effects of buprenorphine4, 5. These studies
began by purchasing three different genotypes of mice from the Jackson Laboratory (Bar
Harbor, ME, USA). The three genotypes included mice that lack leptin and are obese
(B6.Cg-Lepob/J: ob/ob: female n=10, male n=10), lack leptin receptors, are obese and
diabetic (C57BLKS-Leprdb: db/db: female n=10, male n=10), and wild-type (control)
mice with normal weight and leptin levels (C57Bl/6J, female n=10, male n=10). Mice
were allowed two weeks for adjustment to the laboratory and being handled. Each testing
day began by preparing one of five different buprenorphine concentrations (0.1 mg/kg,
0.3 mg/kg, 1.0 mg/kg, 3.0 mg/kg, and 10.0 mg/kg). During drug preparation, the mice
acclimated for 15 minutes in the chamber of the Buxco FinePointe Whole Body
Plethysmograph (DSI, St. Paul, MN, USA). The DSI plethysmograph made it possible to
quantify breathing from unrestrained, behaving mice (Figure 1). After termination of the
acclimation period, mice were intraperitoneally injected with 0.3 mL of saline (vehicle
control), or with 0.3 mL of buprenorphine solution. Breathing was measured every five
seconds for 60 min after injection. Measures of breathing included frequency (f) in

Wateen Alami Honors Thesis 5/03/16
Page 7 of 21
breaths per min, tidal volume (Tvb), minute ventilation (Mvb), inspiratory time (Ti),
expiratory time (Te), total respiration time (Ttot) as the sum of duration of inspiration
(Ti) plus expiration (Te). Additional measures included duty cycle (Ti/(Ttot) as an index
of the active phase of respiration, and inspiratory flow (Tvb/Ti), an indirect measure of
respiratory drive.
Figure 1 Buxco Whole Body Plethysmograph. Unrestrained mice were placed in each of
the chambers (A) in order to monitor breathing. Transducers (B) detected changes in air
pressure and volume. These changes were then amplified and transferred to a computer
software, FinePointe, in order to be analyzed. The bias flow (C) supplied fresh air to the
mice.
Measures of Variability
The purpose of this honors thesis was to test the hypothesis that variability in
respiratory data differed as a function of sex, leptin status, and buprenorphine. The
buprenorphine concentration of 0.3mg/kg, was chosen because it has been shown to
produce antinociception in mice16, 17. Previous efforts to quantify respiratory variability in
rodents used the coefficient of variation of minute ventilation and tidal volume24.

Wateen Alami Honors Thesis 5/03/16
Page 8 of 21
Therefore, the study reported here evaluated coefficient of variation and Poincaré
analyses in an effort to determine which method of the two approaches could best
quantify and visualize variability in breathing.
Quantitative Analyses
Poincaré Analysis of Minute Ventilation
Poincaré plots are graphs in which each point, representing a repeating dependent
measure, is plotted relative to a similar data point obtained earlier in time. Poincaré
analyses assess variability in two different ways as illustrated by Figure 2. Standard
Deviation 1 (SD1), is the short term variability, which is the variability in minute
ventilation for one breath to the next breath14, 21. SD1 calculations plot the average minute
ventilation value from one time interval (x) to the next time interval (y), as can be seen in
Figure 2. The line of identity, x=y, is plotted as the perpendicular line between each data
point, as demonstrated by Figure 1. The line of identity is calculated using the Pythagorean
Theorem. The standard deviation of all the distances is then calculated. Standard deviation
2 (SD2) expresses the long-term variability in minute ventilation over the course of the
entire measurement period21. SD2 is acquired by plotting the average minute ventilation
value for one time interval to the next time interval, y as a function of x as shown by Figure
2. The distance of each data point to the line perpendicular to and intersecting the line of
identity is then calculated. Then the standard deviation of all the distances is calculated21.
The point at which the line of identity and the line perpendicular to the line of identity
intersect is called the centroid and is the mean minute ventilation value for all time
Wateen Alami Honors Thesis 5/03/16
Page 9 of 21
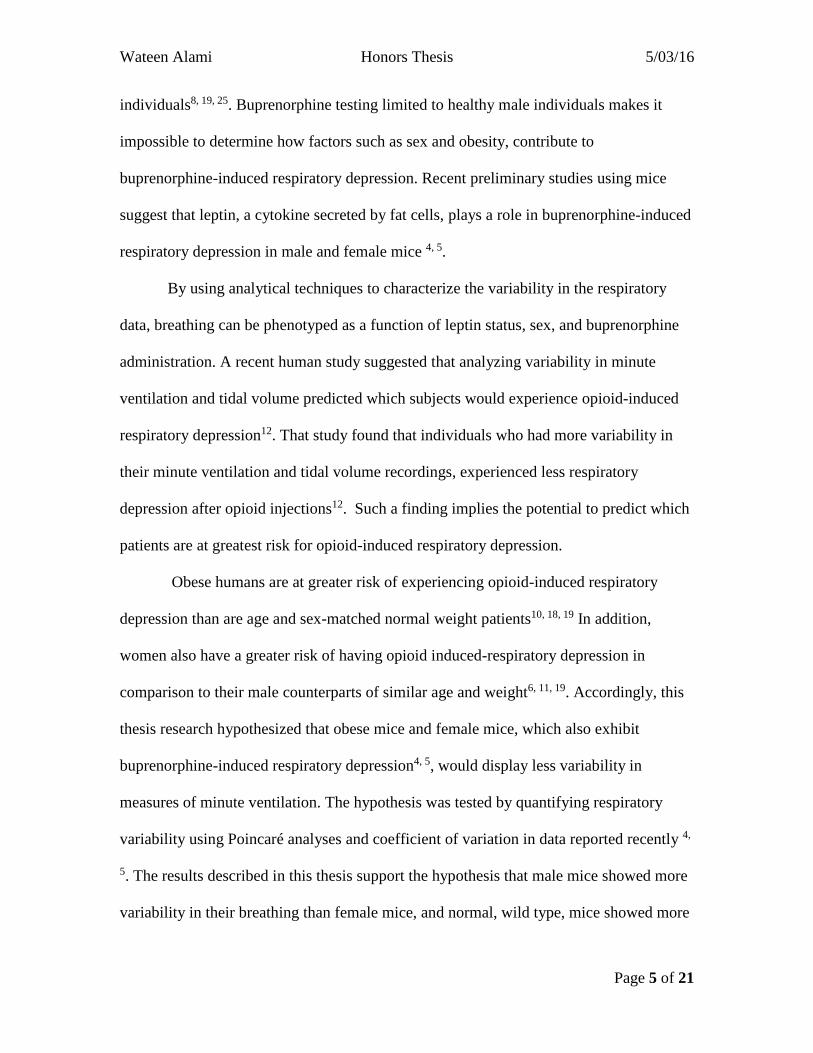
intervals14. The more variability there is in a data set, the higher the SD1 and SD2 values21.
Viewing the Poincaré plots and noting the degree to which the points are scattered also
illustrates the variability in the data.
Figure 2 Each point seen on this Poincaré plot represents the mean minute ventilation
value of a 5-minute interval graphed against the next 5 minute interval. The blue arrow
points to the line-of-identity. The points perpendicular to the line-of-identity make up the
SD1. The green arrow points to the line perpendicular to and intersecting the line-of-
identity. The standard deviation of the distances of each of the points to this line is then
calculated in order to get the SD2. The centroid, the point at which the line of identity and
the line highlighted by the green arrow intersect at, indicates the overall minute
ventilation mean.
Coefficient of Variation
The coefficient of variation is an analytic technique that makes it possible to
compare the variability in a measurement relative to the mean of the measured values. An
advantage of the coefficient of variation is that two different forms of measurement can be
compared because the units of measurement are eliminated. The coefficient of variation is
calculated by dividing the standard deviation by the mean. A higher coefficient of variation
indicates more variability relative to the mean.

Wateen Alami Honors Thesis 5/03/16
Page 10 of 21
RESULTS:
Poincaré
Results from Poincaré analyses, Figure 3, supported the hypothesis that variability
in respiratory data differed as a function of buprenorphine. Percent change calculations,
as seen in Figure 5, Table A., showed there to be a 21.6 to 64.7% decrease in average
SD1 minute ventilation values between vehicle and buprenorphine injections in all three
mouse genotypes and in both sexes. As presented in Figure 5, Table B. , average SD2
minute ventilation data for vehicle and buprenorphine injections in all genotypes of mice
and in both sexes revealed that percent change decreased by 38.8 to 61.5%. The decrease
in SD1 and SD2 minute ventilation values, from vehicle to buprenorphine injections
demonstrate how the plots collapse. These data show that variability is decreasing.
Furthermore, unpaired t-test using Welch’s correction revealed that short term variability,
SD1, seen in vehicle minute ventilation measurements, were significantly (p<0.05) less
than the short term variability caused by buprenorphine. This was true for all genotypes
and both sexes with the exclusion of ob/ob males. The unpaired t-test using Welch’s
correction also showed that there was a statistical significant difference between the long-
term variability, SD2, seen in vehicle minute ventilation measurements, which was less
than the SD2 seen in buprenorphine minute ventilation measurements for all three
genotypes and both sexes.
The results obtained from the Poincaré analyses also support the hypothesis that
variability in breathing after buprenorphine administration differed as a function of
mouse sex. Percent change calculations revealed that average SD1 values for vehicle

Wateen Alami Honors Thesis 5/03/16
Page 11 of 21
injections in B6 and db/db female mice decreased by 10.8% and 26.8% respectively
compared to the male mice, as seen in Figure 5, Table C. The female ob/ob mice had SD1
values increased by 5.2% from average male SD1 vehicle injection values (Figure 5,
Table C). Average SD1 values after buprenorphine injections in female B6, db/db, and
ob/ob decreased by 13.5%, 30.7%, and 28.1% respectively from average male SD1
values for buprenorphine injections in B6, db/db, and ob/ob mice, as noted by Table D
and Figure 5. Table E in Figure 5 demonstrates that there was a 20.6% and 26.2%
increase in the average SD2 minute ventilation vehicle value respectively for female B6
and db/db mice from their male counterparts. The average SD2 vehicle minute ventilation
value for female ob/ob mice decreased by 7.07% compared to the male ob/ob SD2
minute ventilation vehicle value. Figure 5, Table F, shows that average SD2 values for
buprenorphine injections in female B6, db/db, and ob/ob increased by 24.8%, 32.3%, and
16.8% respectively from average male SD2 values for buprenorphine injections in B6,
db/db, and ob/ob mice. Additionally, the unpaired t-test using Welch’s correction results
revealed that there was a statistical significant difference between male and female SD1
vehicle minute ventilation values for db/db mice and a statistical significant difference for
SD1 buprenorphine minute ventilation values for db/db and ob/ob mice. There was no
statistical significant difference between male and female SD2 values for either vehicle or
buprenorphine minute ventilation values.
The results obtained from the Poincaré analyses support the hypothesis that
variability in respiratory data differed as a function of buprenorphine’s effects on
different mouse genotypes. There was a 37.9% decrease between female B6 mice and
female db/db mice in average SD1 minute ventilation vehicle injections (Figure 5, Table

Wateen Alami Honors Thesis 5/03/16
Page 12 of 21
G), while there was a 33.7% decrease between B6 average female SD1 minute ventilation
vehicle values and average ob/ob SD1 minute ventilation vehicle values (Figure 5, Table
H). Male db/db mice had a 44.1% increase in their average SD1 buprenorphine minute
ventilation values in comparison to the B6 mice, as seen in Figure 5, Table G. Male ob/ob
mice showed a 43.8% decrease in average SD1 minute ventilation vehicle values from
the B6 mice (Figure 5, Table H). For average SD2 vehicle minute ventilation values,
Figure 5, Table I, db/db had a 3.1% decrease from the average vehicle minute ventilation
value for B6 mice. T-test calculations confirm these observations and showed that there
was a statistical significant difference between vehicle SD1 minute ventilation values in
female B6 vs female db/db mice, female B6 vs female ob/ob mice, and male B6 vs male
ob/ob mice, where B6 mice, both male and female, had greater variability than db/db and
ob/ob male and female mice. There was also a statistical significant difference between
male B6 and male db/db mice for SD1 buprenorphine minute ventilation values and for
SD2 vehicle minute ventilation values.
Coefficient of Variation
Coefficient of variation (CV) (Figure 4) calculations revealed that variability in
respiratory data differed as a function of buprenorphine. CV values decreased after
buprenorphine injections for all three genotypes of mice and in both sexes. CV values
also showed that variability in respiratory data varied based on the genotype of the
mouse. Overall, B6 mice, in both sexes, had higher vehicle minute ventilation data than
db/db and ob/ob mice. Meanwhile female ob/ob mice had higher CV vehicle minute
ventilation values in comparison to the female db/db mice. Male ob/ob mice had lower

Wateen Alami Honors Thesis 5/03/16
Page 13 of 21
vehicle minute ventilation CV values than db/db male mice. After buprenorphine
injections, db/db female mice had higher CV minute ventilation values compared to B6
and ob/ob female mice. Male db/db mice had higher CV minute ventilation values than
ob/ob and B6 male mice. Coefficient of variation calculations were not very telling of sex
differences in response to buprenorphine and vehicle calculations.

Wateen Alami Honors Thesis 5/03/16
Page 14 of 21
Figure 3: Poincaré plots demonstrate the amount of variability that can be seen in the
monitoring of minute ventilation in B6, db/db, and ob/ob female and male mice after
being injected with vehicle (saline) or 0.3 mg/kg buprenorphine dose.

Wateen Alami Honors Thesis 5/03/16
Page 15 of 21
Figure 4: The coefficient of variation graphs show the variation relative to the mean
minute ventilation value for each five minute segment over the course of an hour
recording period. Coefficient of variation graphs were plotted for male and female B6,
db/db, and ob/ob mice after vehicle and 0.3 mg/kg buprenorphine injections.
Wateen Alami Honors Thesis 5/03/16
Page 16 of 21
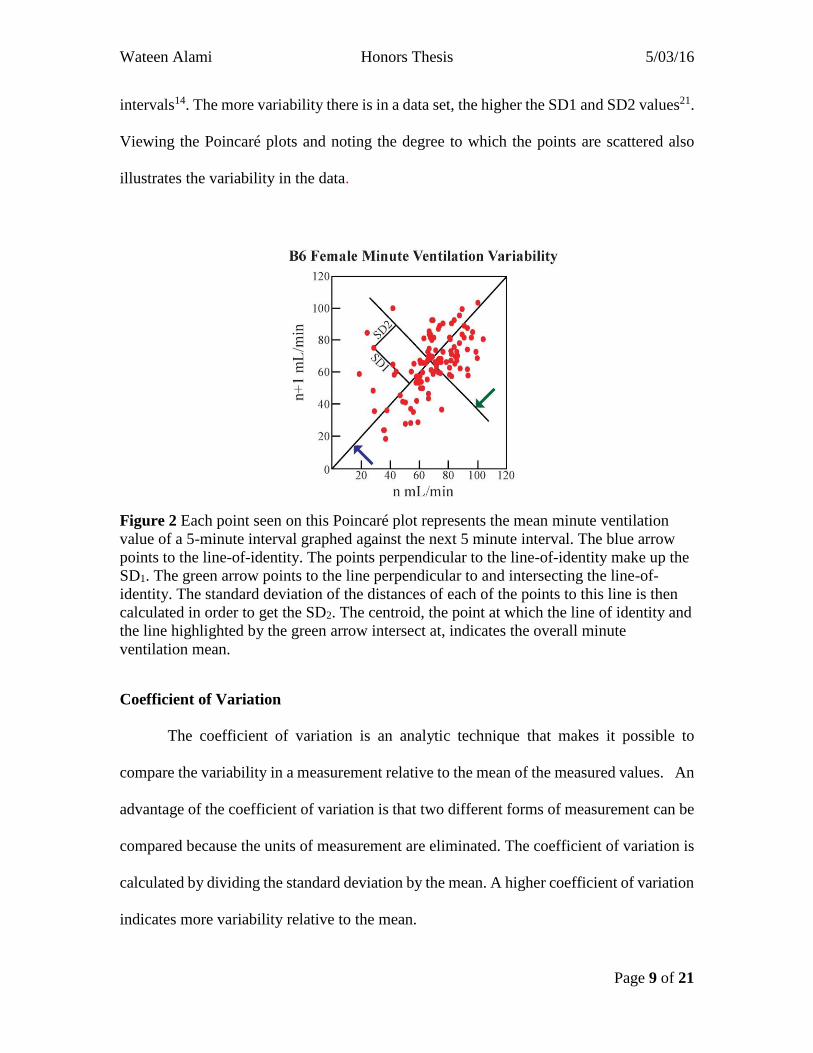
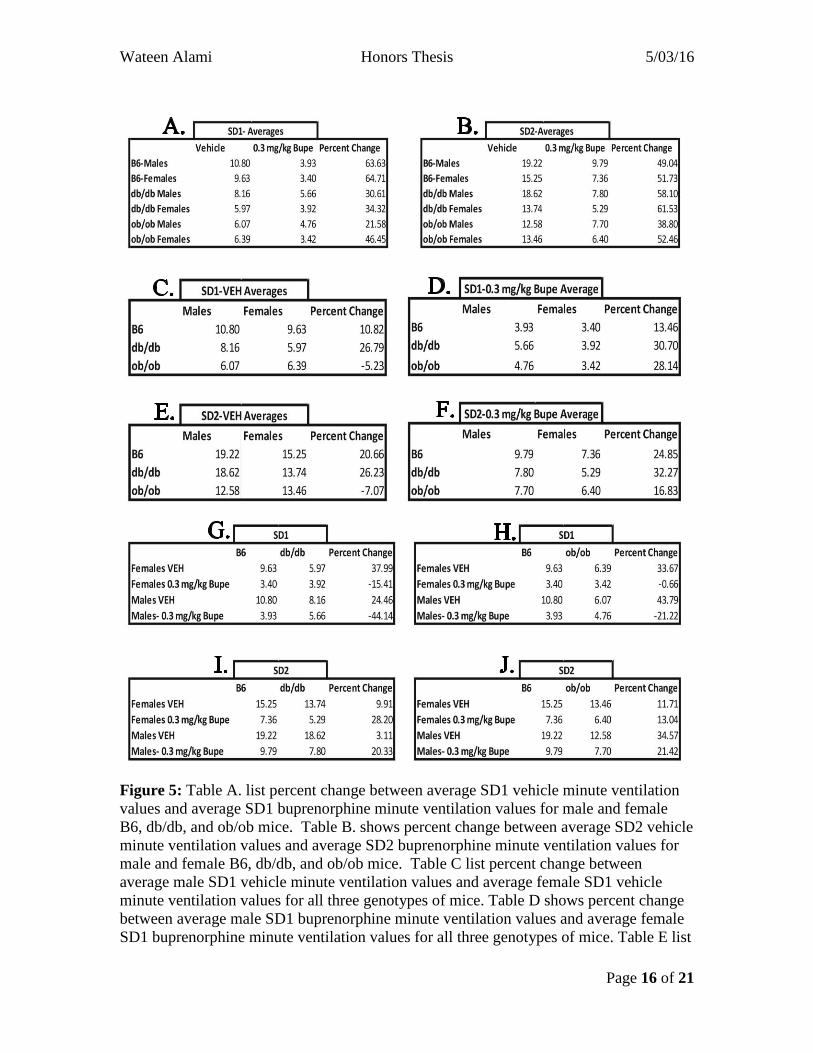
Figure 5: Table A. list percent change between average SD1 vehicle minute ventilation
values and average SD1 buprenorphine minute ventilation values for male and female
B6, db/db, and ob/ob mice. Table B. shows percent change between average SD2 vehicle
minute ventilation values and average SD2 buprenorphine minute ventilation values for
male and female B6, db/db, and ob/ob mice. Table C list percent change between
average male SD1 vehicle minute ventilation values and average female SD1 vehicle
minute ventilation values for all three genotypes of mice. Table D shows percent change
between average male SD1 buprenorphine minute ventilation values and average female
SD1 buprenorphine minute ventilation values for all three genotypes of mice. Table E list

Wateen Alami Honors Thesis 5/03/16
Page 17 of 21
percent change between average male SD2 vehicle minute ventilation values and average
female SD2 vehicle minute ventilation values for all three genotypes of mice. Table F
shows percent change between average male SD2 buprenorphine minute ventilation
values and average female SD2 buprenorphine minute ventilation values for all three
genotypes of mice. Tables G and H show percent change between average SD1 minute
ventilation vehicle and buprenorphine values between male/female B6 mice and
male/female db/db mice and male/female B6 mice and ob/ob male/female mice
respectively. Tables I and J show percent change between average SD2 minute
ventilation vehicle and buprenorphine values between male/female B6 mice and
male/female db/db mice and male/female B6 mice and male/female ob/ob mice
respectively.
Discussion:
Results from Poincaré and coefficient of variation analyses supported the
hypothesis that obese and female mice would exhibit less variability in measures of
minute ventilation, since they are more susceptible to opioid-induced respiratory
depression. Poincaré analysis revealed that although there was a difference in variability,
the statistical significant difference (p<0.05) in variability was mostly noted in short-term
variability. Even though female mice showed less variability than male mice, and normal
weight mice showed more variability in respiratory data than overweight mice, both
sexes and all three genotypes showed less variability in their data after buprenorphine
injections. This supports the idea that the more variable the respiratory data, the more
likely it is the subject is experiencing normal respiratory behavior. After injections of
buprenorphine, even the healthy mice, showed less variable data since their breathing was
compromised. The fact that variability is an indicator of a subject’s respiratory status
demonstrates the fact that monitoring vehicle minute ventilation variability could be a
more powerful way to predict which mouse is more likely to experience respiratory
depression. Though all mice showed less variability in their minute ventilation data after
buprenorphine injections, females showed less variability in their respiratory data than
Wateen Alami Honors Thesis 5/03/16
Page 18 of 21
males. Based on coefficient of variation calculations, it was difficult to note any
difference in variability in minute ventilation in sex responses to buprenorphine
injections; however, Poincaré analysis revealed that the difference in short term
variability was not significant after vehicle injections. However, a statistical difference
between male and females was observed after buprenorphine injections, during which
females exhibited less variability. Hence variability was correlated to respiratory status.
There seemed to be no statistically significant difference between males and females
average minute ventilation long-term variability in all three genotypes for vehicle or
buprenorphine injections. Why there was only a statistical difference between male and
females in short-term variability and not in long-term variability is still unknown. In
addition, it is not known what causes short-term variability. Studies have investigated sex
differences in active metabolism of buprenorphine in order to see if this had any effects
on an individual’s respiratory response to buprenorphine3. One study found that females
who received the same doses of buprenorphine as males had higher levels of the
metabolite, norbuprenorphine-3-glucuronide20. Further investigation of sex differences in
response to buprenorphine is needed. Recently, it was found that women were overdosing
on a Food and Drug Administration (FDA) approved drug, Ambien (Zolpidem), a
medicine used to help with insomnia. These women were overdosing because they were
prescribed the same dose as their male counterparts. The FDA then requested that women
received half the dose as males9. It is cases like these that show the importance of
investigating sex differences in response to opioid-induced respiratory depression and
finding ways to detect susceptibility such as monitoring variability in baseline recordings
of respiratory behavior.
Wateen Alami Honors Thesis 5/03/16
Page 19 of 21
Both Poincaré and coefficient of variation analysis revealed that B6 mice had
more variability in their minute ventilation vehicle and buprenorphine injection data
compared to db/db and ob/ob mice. Many studies have found that leptin not only acts as a
satiety hormone, but could also be acting as a respiratory stimulant4, 13. One can speculate
that the overweight mice, db/db and ob/ob, do not experience the stimulatory effects of
leptin due to the fact that db/db mice do not have functioning leptin receptors, and ob/ob
mice do not have any leptin circulating in their system.
Though both Poincaré and coefficient of variation analyses revealed information
about variability in minute ventilation, Poincaré offered more information about the
variability. Not only did it provide information about long-term variability, it also offered
more insight on short-term variability. In conclusion, differences in variability in
respiratory data as a function of genotype, sex, and buprenorphine injections were more
seen more clearly in Poincaré results than in the coefficient of variation results.

Wateen Alami Honors Thesis 5/03/16
Page 20 of 21
References
1. Clinical guidelines for the use of buprenorphine in the treatment of opioid
addiction. 2004, Rockville, MD: Center for substance abuse treatment.
2. The role of opioids in the treatment of chronic pain 2014 March 5, 2015 [cited
2016 February 22]; Available from: https://prevention.nih.gov/programs-
events/pathways-to-prevention/past-workshops/opioids-chronic-pain.
3. Alhaddad, H., Cisternino, S., Saubamea, B., Schlatter, J., Chiadmi, F., Risede, P.,
Smirnova, M., Cochois-Guegan, V., Tournier, N., Baud, F., and Megarbane, B.,
Gender and strain contributions to the variability of buprenorphine-related
respiratory toxicity in mice. Toxicology 2013. 305: p.99-108.
4. Angel, C., Alami, W., Mihalko, S., Baghdoyan, H., and Lydic, R.,
Buprenorphine-Induced respiratory depression varies as a function of leptin-
related genotype in normal weight and obese mice. . FASEB Journal 2016. 30:
(717.7).
5. Angel, C., W., A., Mihalko, S., Baghdoyan, H., and Lydic, R., Sex, leptin status,
and obesity modulate buprenorphine-induced respiratory depression in mice. The
Physiologist 2016. 59: p. 22.
6. Barash, P., Cullen, B., Stoelting, R., Cahalan, M., Stock, C., and Ortega, R.,
Clinical Anesthesia. 2013, Philadelphia, PA: Lippincott Williams and Wilkins, a
Wolters Kluwer Business
7. Barbour, S., Vandebeek, C., and Ansermino, M., Increased tidal volume varibility
in children is a better marker of opioid-induced respiratory depression than
decreased respiratory rate. Journal of Clinical Monitoring and Computing 2004.
18(3): p. 171-8.
8. Bartley, E. and Fillingim, R., Sex differences in pain: a brief review of clinical
and experimental findings. British Journal of Anaesthesia, 2013. 111(1): p. 52-58.
9. Cahill, L., Equal the same: sex differences in human brain. Cerebrum 2014.
10. Dahan, A., Aarts, L., and Smith, T., Incidence, reversal, and prevention of opioid-
induced respiratory depression. Anesthesiology, 2010. 112: p. 226-238.
11. Daoust, R., Paquet, J., Lavigne, G., Piette, E., and Chauny, J., Impact of age, sex,
and route of administration on adverse events after opioid treatment in the
emergency department: a retrospective study. Pain Research and Management
2015. 20(1): p. 23-28.
12. Davide, C., Jordan, B., and Edward, G., Respiratory Volume Variability Prior to
Opioid Administration as an Indicator for Opioid-Induced Respiratory
Depression, in A22. STRATEGIES TO ADDRESS QUALITY IMPROVEMENT.
2015, American Thoracic Society. p. A1081-A1081.
Wateen Alami Honors Thesis 5/03/16
Page 21 of 21
13. Foteini, M., Papaioannou, A., Gourgoulianis, K., and Daniil, Z., The role of leptin
in the respiratory system: an overview. Respiratory Research 2010. 11(1).
14. Icaza, E.E., Huang, X., Fu, Y., Neubig, R.R., Baghdoyan, H., and Lydic, R.,
Isoflurane-Induced changes in righting response and breathing are modulated by
RGS Proteins. PubMed Central 2011. 109(5): p. 1500-1505.
15. Johnson, R., Fudala, P., and Payne, R., Buprenorphine: considerations for pain
management. Journal of Pain and Symptom Management, 2005. 29(3): p. 297-
326.
16. Kabirullah, L., Shoshana, E., Camron, B., Yu, Y., Nazli, S., Wendy, W., Brigitte,
K., Hiroshi, T., Ivy, C., Nigel, M., and Christopher, E., Buprenorphine- Induced
antinociception is mediated by u-opioid receptors and compromised by
concomitatn activation of opioid receptor-like receptors The Journal of
Neuroscience, 2013. 23(32): p. 10331-10337.
17. Kamei, J., Saitoh, A., Suzuki, T., Misawa, M., Nagase, H., and Kasuya, Y.,
Buprenorphine exerts its antinociceptive activity via mu1-opioid receptors Life
Sciences 1995. 56(15): p. 285-290.
18. Kryger, M., Roth, T., and Dement, W., Principles and practice of sleep medicine
2017, Philadelphia, PA: El Sevier.
19. Lee, L., Caplan, R., Stephens, L., Posner, K., Terman, G., Voepel-Lewis, T., and
Domino, K., Postoperative opioid-induced respiratory depression: a closed
claims analysis Anesthesiology 2015. 122(3): p. 659-665.
20. Moody, D., Fang, W., Morrison, J., and McCance-Katz, E., Gender Differences in
Pharmokinetics of Maintenance Dosed Buprenorphine Drug Alcohol Depend,
2011. 118: p. 479-483.
21. Muncey, A., Saulles, A., Koch, L., Britton, S., Baghdoyan, H., and Lydic, R.,
Disrupted sleep and delayed recovery from chronic peripheral neuropathy are
distinct phenotypes in a rat model of metabolic syndrome. Anesthesiology, 2010.
113: p. 1176-85.
22. Rosenblum, A., Marsch, L., Joseph, H., and Portenoy, R., Opioids and the
treatments of chroni pain: controversies, current status, and future directions.
Exp Clin Psychopharmacol, 2008. 16(5): p. 405-416.
23. Rudd, R., Aleshire, N., Zibbell, J., and Gladden, R. Increases in drug and opioid
overdose deaths- United States, 2000-2014. 2016. 64, 1378-82.
24. Saponjic, J., Miodrag, R., and Carley, D., Injection of glutamate into the
pedunculopontine tegmental nuclei of anesthetized rat causes respiratory
dysrhythmia and alters EEG and EMG power. . Sleep Breath, 2005(9): p. 82-91.
25. Zdziarski, L., Wasser, J., and Vincent, H., Chronic pain management in the obese
patient: a focused review of key challenges and potential excercise solutions
Journal of Pain Research, 2015. 8: p. 63-77.