
Using Piezoelectric Generation To Harvest Energy From ...
67
Purdue University Purdue e-Pubs College of Technology Masters eses College of Technology eses and Projects 3-5-2010 Using Piezoelectric Generation To Harvest Energy From Turbulent Air Flow Joshua M. Nelson Purdue University - Main Campus, [email protected] Follow this and additional works at: hp://docs.lib.purdue.edu/techmasters is document has been made available through Purdue e-Pubs, a service of the Purdue University Libraries. Please contact [email protected] for additional information. Nelson, Joshua M., "Using Piezoelectric Generation To Harvest Energy From Turbulent Air Flow" (2010). College of Technology Masters eses. Paper 2. hp://docs.lib.purdue.edu/techmasters/2
Transcript of Using Piezoelectric Generation To Harvest Energy From ...

Purdue UniversityPurdue e-Pubs
College of Technology Masters Theses College of Technology Theses and Projects
3-5-2010
Using Piezoelectric Generation To Harvest EnergyFrom Turbulent Air FlowJoshua M. NelsonPurdue University - Main Campus, [email protected]
Follow this and additional works at: http://docs.lib.purdue.edu/techmasters
This document has been made available through Purdue e-Pubs, a service of the Purdue University Libraries. Please contact [email protected] foradditional information.
Nelson, Joshua M., "Using Piezoelectric Generation To Harvest Energy From Turbulent Air Flow" (2010). College of TechnologyMasters Theses. Paper 2.http://docs.lib.purdue.edu/techmasters/2

Graduate School ETD Form 9 (Revised 12/07)
PURDUE UNIVERSITY GRADUATE SCHOOL
Thesis/Dissertation Acceptance
This is to certify that the thesis/dissertation prepared
By
Entitled
For the degree of
Is approved by the final examining committee:
Chair
To the best of my knowledge and as understood by the student in the Research Integrity and Copyright Disclaimer (Graduate School Form 20), this thesis/dissertation adheres to the provisions of Purdue University’s “Policy on Integrity in Research” and the use of copyrighted material.
Approved by Major Professor(s): ____________________________________
____________________________________
Approved by: Head of the Graduate Program Date
Joshua M. Goysich Nelson
USING PIEZOELECTRIC GENERATION TO HARVEST ENERGY FROM TURBULENT AIRFLOW
Master's of Science
Mark French
Jeffrey J. Evans
William J. Hutzel
Mark French
Gary Bertoline 3/5/10

Graduate School Form 20 (Revised 1/10)
PURDUE UNIVERSITY GRADUATE SCHOOL
Research Integrity and Copyright Disclaimer
Title of Thesis/Dissertation:
For the degree of ________________________________________________________________
I certify that in the preparation of this thesis, I have observed the provisions of Purdue University Teaching, Research, and Outreach Policy on Research Misconduct (VIII.3.1), October 1, 2008.* Further, I certify that this work is free of plagiarism and all materials appearing in this thesis/dissertation have been properly quoted and attributed.
I certify that all copyrighted material incorporated into this thesis/dissertation is in compliance with the United States’ copyright law and that I have received written permission from the copyright owners for my use of their work, which is beyond the scope of the law. I agree to indemnify and save harmless Purdue University from any and all claims that may be asserted or that may arise from any copyright violation.
______________________________________ Printed Name and Signature of Candidate
______________________________________ Date (month/day/year)
*Located at http://www.purdue.edu/policies/pages/teach_res_outreach/viii_3_1.html
USING PIEZOELECTRIC GENERATION TO HARVEST ENERGY FROM TURBULENT AIRFLOW
Master's of Science
Joshua M. Goysich Nelson
03-05-2010

USING PIEZOELECTRIC GENERATION TO HARVEST ENERGY FROM
TURBULENT AIR FLOW
A Thesis
Submitted to the Faculty
of
Purdue University
by
Joshua M. Goysich Nelson
In Partial Fulfillment of the
Requirements for the Degree
of
Master of Science
May 2010
Purdue University
West Lafayette, Indiana

ii
To my wife, Nicole, who has been an excellent example of grace and strength while
allowing me to begin and complete this work.
And to my Savior, without whose grace I would not even exist.

iii
ACKNOWLEDGMENTS
The author would like to thank Dr. R. Mark French, Dr. Jeffrey J. Evans, and Prof.
William J. Hutzel for their guidance, the use of equipment and facilities, advice, and the
encouragement to thoroughly understand.

iv
TABLE OF CONTENTS
Page LIST OF TABLES ................................................................................................... vi LIST OF FIGURES.................................................................................................... viii GLOSSARY ............................................................................................................ ix ABSTRACT ............................................................................................................ x CHAPTER 1. INTRODUCTION ............................................................................. 1 1.1. Objectives............................................................................................... 1 1.2. Organization ........................................................................................... 1 1.3. Scope ...................................................................................................... 2 1.4. Significance ............................................................................................ 2 1.5. Study Design .......................................................................................... 3 1.5.1. Hypotheses .............................................................................. 4 1.5.2. Considerations......................................................................... 4 1.5.3. Variables and the Measurement Thereof................................. 4 1.6. Assumptions, Limitations, and Delimitations ........................................ 4 1.6.1. Assumptions ............................................................................ 5 1.6.2. Limitations .............................................................................. 5 1.6.3. Delimitations ........................................................................... 5 CHAPTER 2. LITERATURE REVIEW .................................................................. 6 2.1. Past Studies............................................................................................. 6 2.1.1. Applications of PEG ............................................................... 6 2.1.2. Physical PEG Optimization..................................................... 8 2.1.3. PEG Circuit Optimization ....................................................... 9 2.2. Inferences ............................................................................................... 10 CHAPTER 3. THEORETICAL POTENTIAL ......................................................... 11 3.1. Analysis of Experiment.......................................................................... 11 3.2. Maximum Power Available ................................................................... 11

v
Page 3.3. Von Karman Vortex Shedding............................................................... 14 3.4. Von Karman Application ....................................................................... 15 CHAPTER 4. EXPERIMENTS ................................................................................ 16 4.1. Explanation of Experiment .................................................................... 16 4.1.1. Test Rig ................................................................................... 17 4.1.2. Initial Circuit Design............................................................... 18
4.2. Bench Testing Procedure ....................................................................... 19 4.3. Pre-Experimental Set-up and Measurements ......................................... 20 4.4. Initial Test .............................................................................................. 23 4.5. Road Test ............................................................................................... 23 CHAPTER 5. RESULTS AND DISCUSSION ........................................................ 25 5.1. Initial Test Results ................................................................................. 25 5.2. Road Test Results .................................................................................. 31 5.2.1. System Noise .......................................................................... 32 5.2.2. Piezoelectric OCV Characteristics .......................................... 33 5.2.3. Piezoelectric CCV Characteristics .......................................... 35 5.2.4. RMS Values ............................................................................ 38 5.2.5. Voltage Frequency Characteristics ......................................... 39 5.3. Series and Parallel Circuit Issues ........................................................... 42 5.4. Power Considerations ............................................................................ 42 5.5. Effect on Drag ........................................................................................ 44 CHAPTER 6. CONCLUSION.................................................................................. 45 BIBLIOGRAPHY ...................................................................................................... 48 APPENDIX ............................................................................................................ 51

vi
LIST OF TABLES
Table Page Table 4.1. Wind tunnel velocities (given in m/s) ....................................................... 21
Table 4.2. LCR measurements for piezoelectric elements ........................................ 22
Table 5.1. OCV and calculated RMS, CCC, and power values ................................. 38
Appendix Table Table A-1. Maximum power data .............................................................................. 51
Table A-2. Piezoelectric element efficiency .............................................................. 52

vii
LIST OF FIGURES
Figure Page Figure 3.1. Drag force as a function of velocity (CD = 0.34, A = 0.1479 m2) ........... 12
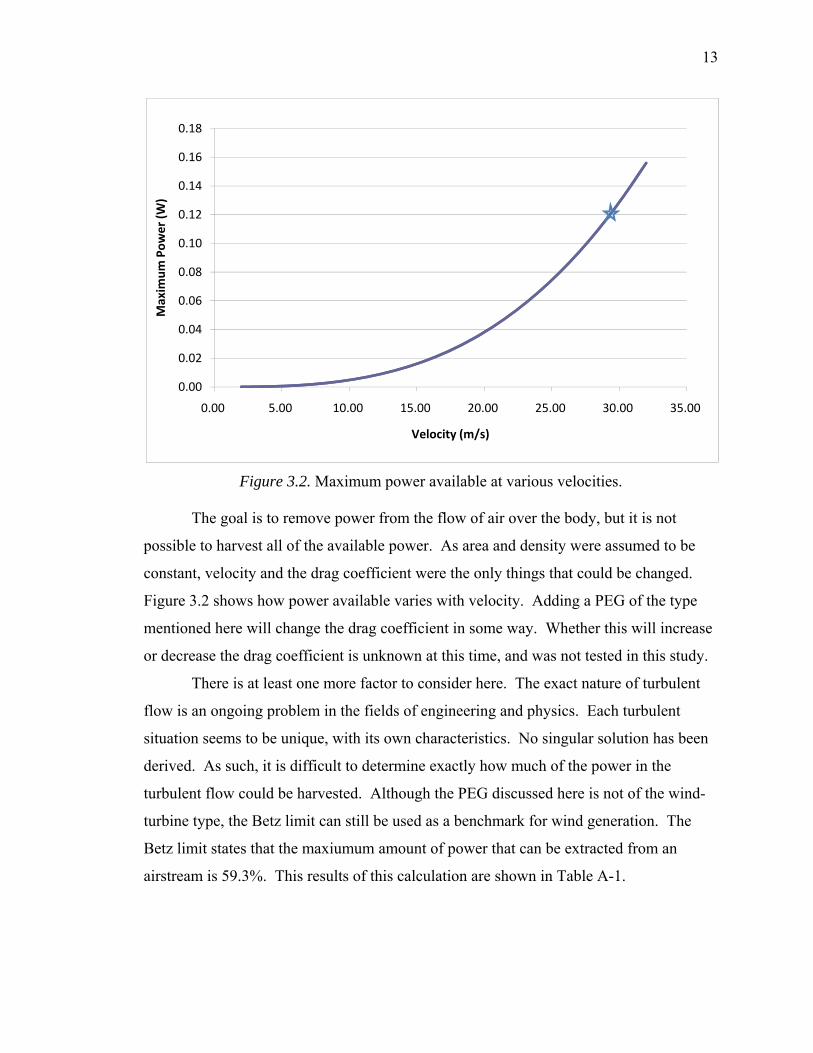
Figure 3.2. Maximum power available at various velocities ..................................... 13
Figure 4.1. Assembled wind tunnel ........................................................................... 16
Figure 4.2. Various PEG design ideas ....................................................................... 18
Figure 4.3. Charge pump circuitry ............................................................................. 19
Figure 4.4. Square nozzle ........................................................................................... 20
Figure 4.5. Round nozzle ........................................................................................... 21
Figure 4.6. Piezoelectric circuit representation .......................................................... 22
Figure 4.7. Road test piezoelectric element mounting ............................................... 23
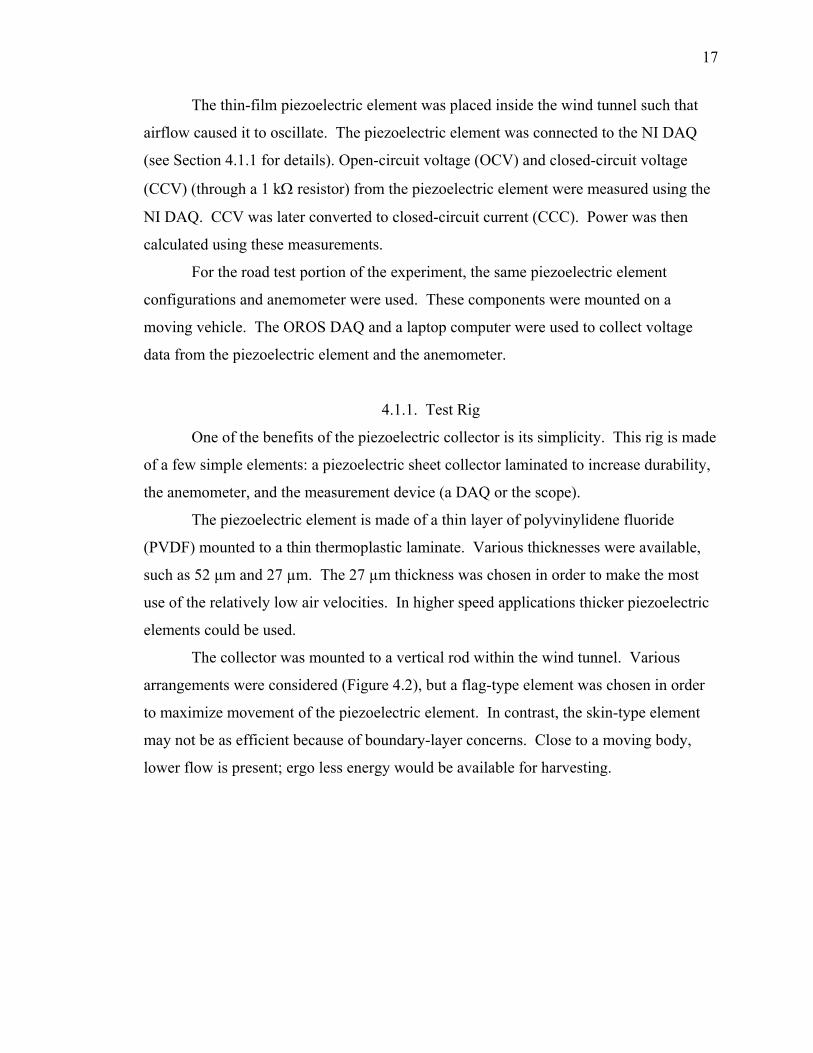
Figure 5.1. OCV for a single piezoelectric at 15 m/s ................................................ 25
Figure 5.2. CCV for a single piezoelectric at 15 m/s across a 1 kΩ resistor.............. 26
Figure 5.3. OCV for two series piezoelectric elements at 15 m/s ............................. 26
Figure 5.4. CCV for two series piezoelectric elements at 15 m/s across a 1 kΩ resistor 27
Figure 5.5. OCV for two parallel piezoelectric elements at 15 m/s ........................... 27
Figure 5.6. CCV for two parallel piezoelectric elements at 15 m/s across a 1 kΩ
resistor ............................................................................................................ 28
Figure 5.7. Instantaneous power from a single piezoelectric element using LabVIEW 29
Figure 5.8. Instantaneous power from two series piezoelectric elements using
LabVIEW ....................................................................................................... 30
Figure 5.9. Instantaneous power from two parallel piezoelectric elements using LabVIEW ....................................................................................................... 30
Figure 5.10. Sample velocity vs. time for road test ................................................... 31
Figure 5.11. Welch power spectral density estimate for OCV from one element at
0 m/s ............................................................................................................ 32

viii
Figure Page Figure 5.12. OCV vs. velocity for a single piezoelectric element ............................ 33
Figure 5.13. OCV vs. velocity for two piezoelectric elements in series ................... 34
Figure 5.14. OCV vs. velocity for two piezoelectric elements in parallel ................ 35
Figure 5.15. CCV vs. velocity for a single piezoelectric element ............................. 36
Figure 5.16. CCV vs. velocity for two piezoelectric elements in series ................... 37
Figure 5.17. CCV vs. velocity for two piezoelectric elements in parallel ................. 38
Figure 5.18. Welch power spectral density estimate for a single element ................. 39
Figure 5.19. Welch power spectral density estimate for two elements in series ....... 40
Figure 5.20. Welch power spectral density estimate for two elements in parallel .... 41

ix
GLOSSARY
MEMS - Micro Electromechanical System
OCV – Open-circuit voltage
PEG - Piezoelectric Generator or Piezoelectric Generation- A device that utilizes the piezoelectric effect to the end of creating electricity to be used by another device or the application of said device
Piezoelectric – A material that exhibits the property of creating a voltage when stressed (Sodano, Inman, & Park, 2005)
CCC – Closed-circuit current (through a 1 k resistor)
CCV – Closed-circuit voltage (across a 1 k resistor)

x
ABSTRACT
Nelson, Joshua M. G. M.S., Purdue University, May, 2010. Using Piezoelectric Generation to Harvest Energy from Turbulent Air Flow. Major Professor: Dr. R. Mark French The tasks of generating, harvesting, and converting energy have long been ones
crucial to the human race. As such, environmental concerns, population increase,
personal energy consumption, and diminishing resources have led to a focus on new
methods and possibilities. A set of factors has influenced this research, among which
was a desire to steward resources better, the inefficiencies of many current generation
technologies, and the rising cost of fuel.
Although piezoelectric generation (PEG) has been researched and used to power
small devices, this generation technique is undeveloped, especially on a large scale. This
research focuses on the conversion of air turbulence to electrical energy via a
piezoelectric generator.
After a literature review was conducted, calculations were performed to determine
energy potential. Bench tests were performed to determine the characteristics of the
material. Road tests were then carried out utilizing a thin-film piezoelectric material.
Data such as air velocity and voltage were collected. It was found that the piezoelectric
effect can be used to harvest energy from turbulent air flow. However, with the method
and material used, this is not an efficient means of energy harvesting; power generated
was less than 1 microwatt.

1
CHAPTER 1. INTRODUCTION
This chapter defines the purpose of the study and sets out its objectives. Layout
of this thesis, possible hypotheses, and other considerations are also discussed.
1.1. Objectives
This research was designed to investigate whether piezoelectric elements could be
used on a moving body (such as an automobile) to harvest and convert wind energy.
Presumably, this energy could then be used to power some device onboard the body, but
this study was limited to exploring the concept of such harvesting. This experiment was
performed in a wind tunnel in order to establish a controlled environment and then
carried out in detail in a series of road tests.
Specific objectives included:
1. Determine theoretical power potential
2. Quantify amount of power experimentally observed
3. Observe power density and efficiency
1.2. Organization
This thesis contains six chapters. This first introduces the topic of piezoelectric
generation and the scope of the project. The second chapter looks at relevant literature
and applies it to the topic at hand. The third analyzes the experiment from a
mathematical perspective and the experiment itself is discussed in the fourth chapter.
Results and discussions follow in the fifth chapter, while the final chapter concludes the
study.

2
1.3. Scope
The intent of this project was to research, measure, and document the amount of
power that can be harvested through the use of a piezoelectric sheet on a moving vehicle
actuated by turbulent airflow. Although many materials are available, sheets of
polyvinylidene fluoride (PVDF) were used. PVDF is relatively low in cost and can be
made in a variety of physical sizes. As harnessing wind energy was the focus, a sheet-
type piezoelectric element was selected. This format offers a high surface-to-volume
ratio, and thus can be moved by air easily.
It was not practical at this point, nor was it the focus of this research to determine
the most efficient placement of the piezoelectric collector, only to determine the
possibilities. It is likely that efficiency will be higher at some spots than others; this,
however, will be left to future work.
Optimum circuit designs was also not covered. Other researchers have studied
this topic (Ottoman & Lesieutre (2003), Han, et al (2004)), and have begun to optimize
the power conditioning circuitry for PEG.
Although material strength and durability are general concerns, they were not
dealt with at this point.
As power generated greatly depends on air velocity, various velocities were taken
into account.
1.4. Significance
New power generation techniques are of great value. As population increases, so
do its energy demands, if simply because of numbers. Current technologies such as coal
and petroleum engines are not indefinitely sustainable. Thus, it is profitable to research
new methods of producing energy that have the ability to replace or at least alleviate
reliance on these limited forms.
Research regarding macro piezoelectric generation (PEG) is largely absent.
According to Kim (2002), PEG is a largely un-researched topic. Many piezoelectric
materials are able to output a large amount of voltage, but a relatively small amount of

3
current. Because of this characteristic and others, PEG has only recently been considered
as a power source.
However, PEG offers many advantages. First, it is a solid-state technology.
These devices can be compact and durable. This is an advantage over other generation
technologies, as it leads to a more robust device that may also have lower manufacturing
costs. Second, this application of PEG focuses on utilizing energy that is usually ignored,
such as vibrations or turbulent airflow. These sources of energy are usually dissipated as
heat. This may be thought of as ‘free’ energy within a closed system. Third, although
PEG offers low current, the voltage potential and efficiency are notable. Recent studies
have shown piezoelectric efficiency to be as high as 70%.
Batteries are another reason to consider PEG. In installations that are difficult to
reach or explore a battery that needs to be replaced is a complicating factor. Many new
types of batteries, while technologically advanced, are also constrained by cost, size, or
weight. In addition, every PEG replacement power cell could mean one less battery
needing disposal at the end of its comparatively short life.
Perhaps the strongest reason to pursue PEG lies with the type of energy it utilizes.
Vibrations are present in many bodies, such as humans, buildings, and vehicles. Many
times these vibrations are ignored or even dissipated, as is the case with shock absorbers.
Whether it be a wristwatch or a transmitter on a tower PEG offers the possibility of
converting this untapped source.
Current piezoelectric technology and materials would not allow one to replace all
batteries or other power sources. Although characteristic piezoelectric voltage output is
high, the current is quite low. As technology progresses and new materials are found or
formulated, however, PEG may be able to replace conventional generation systems. This
may even be possible on a device as complicated as a vehicle.
1.5. Study Design
A quasi-experimental study was used to determine how much power could be
harvested from airflow using a piezoelectric sheet mounted inside a wind tunnel and on a
vehicle. The exploratory nature of this study and the small sample size made statistical

4
inference less practical. Therefore, the quasi-experimental study method was chosen.
The quasi-experimental study is described by Sekaran (2002). In a study of this type,
null and alternative hypotheses are set, but the hypothesis is selected at the end based not
on statistical analysis, but on what the individual results of the study show.
1.5.1. Hypotheses
Null and alternative hypotheses were established, as shown below.
H0: No useable power can be harvested from this setup
Ha: Useable power can be harvested from this setup
1.5.2. Considerations
One problem with this approach is the definition of “usable power.” Certain
devices require little power, while others require much. As one of the intended final
applications of this research is to power on-board vehicle electronics (specifically LED
lights), “usable power” is defined here as enough power to activate a single, low-power
LED (around 20 mW).
1.5.3. Variables and the Measurement Thereof
The dependant variable was air velocity. The independent variable was voltage.
In order to measure the variables, a National Instruments USB-6215 data
acquisition system, an OROS OR24 data acquisition system, and a Tecktronix TDS 380
oscilloscope were used (NI DAQ, OROS DAQ, and scope hereafter, respectively).
Measurements included volts from the PEG, and voltage from the anemometer (later
converted to m/s—see Chapter 4).
1.6. Assumptions, Limitations, Delimitations
This section further focuses the study by stating assumptions, limitations, and
delimitations.

5
1.6.1. Assumptions
Piezoelectric element representative of all materials
Resistance from wires was negligible
Interference from ambient sources was negligible
Test velocities were a representative sample (approximately 0 m/s – 22 m/s)
Air velocity was only in one direction
Air density was constant at 1.233 kg/m3
Air dynamic viscosity was constant at 1.807 x 10⁻⁵ kg/(m*s)
1.6.2. Limitations
Since wind and airflow are chaotic, destructive interference may have been
present
Cross-sectional area of wind tunnel fixed
Maximum wind tunnel air velocity approximately 16 m/s
Maximum anemometer velocity approximately 22 m/s
1.6.3. Delimitations
Difference in piezoelectric materials and their generation capabilities were not
covered
Optimum piezoelectric placement was not covered
Effect on aerodynamic drag was not measured
Durability was not a factor in this study
Various PEG circuitry and optimization techniques thereof were not covered
Optimum poling was not discussed
Optimum piezoelectric electrode placement was not covered

6
CHAPTER 2. LITERATURE REVIEW In order to develop a solid foundation from which to build this study, a literature
review has been conducted. This review is presented below, focused on three main
topics: Applications of PEG, Physical PEG Optimization, and PEG Circuit Optimization.
2.1. Past Studies
A piezoelectric material is one that creates voltage when force is applied to it and
vice-versa. This effect was discovered by Pierre and Jacques Curie in 1880.
Piezoelectric materials are both man-made and naturally occurring. Much research has
been done on the topic of piezoelectric devices as actuators (those devices that send
vibrations or signals) and receivers (devices that receive vibrations or signals).
2.1.1. Applications of PEG
Research surrounding piezoelectrics is numerous. However, piezoelectric
generation is a fairly recent concept. Some of the earliest research found dealt with
powering portable computers via human movement (Starner (1996)). Starner investigated
various activities (such as breathing and walking), quantified the amount of energy
available, looked at various harvesting technologies, and suggested whether or not it was
practical to harvest energy from this activity. It was found that walking seemed to be the
best method for harvesting energy and that two technologies provided a way to harvest
this energy: piezoelectric and magneto electric generation (Starner (1996)).
Small-scale harvesting from human activity is a concept that others have
investigated as well. Using a piezoelectric transducer, Ramsey and Clark collected
energy from blood pressure fluctuations (2001). Using a circular thin-plate transducer
and a piezoelectric element with a 31- poling direction, they were able to obtain 2.5 µW.

7
While this was well below their goal of 10 µW, they did show that ample power was
available from the source (blood pressure). In addition, mathematical analysis seems to
indicate that given a cyclical changing force, power output is exponentially related to area
of the sensor and also exponentially related to thickness. However, as the force and
fluctuations were relatively small (1Hz cyclic pressure of 5333 N/m2), these results may
not be generalizable to larger applications.
Numerous studies have been performed regarding power harvesting for MEMS
and wireless sensor networks. Roundy and Wright (2004) used a PEG of less than 1 cm3
to power a wireless transmitter, although only with a 1.6% duty cycle. Song, et al (2007)
found that the impedance of the PEG was lowered with multiple layers and hypothesized
that a PEG of this type could power a sensor without additional electronics.
It is not only power generation for MEMS that benefits from the use of
piezoelectric materials. Dong, et al (2004) built a piezoelectric transformer with an out-
to-in voltage ratio higher than that of some electromagnetic transformers (the more
conventional design). These studies and others point to the possibility of high
piezoelectric efficiency, which is imperative to energy conversion and generation.
Ogando (2007) researched various uses of active vibration control technology,
sometimes labeled "adaptronics." Although the field of adaptronics includes more than
piezoelectrics, they play an important role. Ogando states, "As part of a vibration control
system, these actuators can be designed to address a wide range of frequencies--from 50
to 1,000 Hz--depending on the application needs." The characteristics of piezoelectric
devices enable them to operate over a large range.
The practicality of piezoelectric devices varies widely from inexpensive sensors
to costly actuators. Grove & Ehle (2002) developed a simple device that could measure
force and energy utilizing the voltage output from a piezoelectric cell in order to
demonstrate the difference between the two to physics classes. This device could be built
by a layperson at a low cost. In contrast, Friedman, et al (2007) used an array of
piezoelectric actuators and receivers to counteract vibrations in textile machinery.
Although comparatively expensive at the time of this writing, such technology may prove
useful, as increased output may outweigh implementation. In addition, the vibrations

8
produced by this system were substantial; enough to reduce machine vibration by as
much as 80% using large voltage. Given this, in an environment where many vibrations
are present (such as on a moving vehicle), it may be possible to generate a large voltage.
2.1.2. Physical PEG Optimization
Smith, et al (1984) showed that small, cylindrical piezoelectric cells embedded in
a matrix can act as a single unit. This may provide the possibility of creating a low-cost
piezoelectric paint, although this theory is yet untested.
Piezoelectric device efficiency is a topic mentioned by Friedmann, et al (2007),
Kim, et al (2005), and Dong, et al (2006). Friedmann, et al showed that simply by
changing the location of a piezoelectric actuator, vibrations could be reduced by as much
as 80%. This reduction in vibration could be related to energy available for harvesting.
Kim, et al calculated that the amount of energy output by the PEG is directly related to
the ratio of substrate thickness to piezoelectric thickness. Dong, et al, in studying a
former design, found that the magnetoelectric/piezoelectric transformer had a higher
voltage gain and larger bandwidth than current data. These data show that piezoelectric
generation can be an efficient mode of generation.
Tantamount to device efficiency is material efficiency. Funasaka, et al (1998)
studied PEG in two devices, one using lead zirconate titanate (PZT), the other lithium
niobate (LiNbO3). LiNbO3 was found to have higher conversion efficiency than PZT,
which is the conventional material. In cases such as the one at hand, materials may be
developed, discovered, or utilized because they provide specific characteristics, such as
durability, manufacturability, and power generation efficiency.
Kim (2002) studied another area of PEG efficiency: electrode placement. Three
devices were tested, each of the same material and dimensions. Two underwent a
repoling and reapplying of electrodes; the third remained unchanged. The repoling
method used here is named the interdigitated method. In this method, one begins with a
piezoelectric element that has the poling direction perpendicular to its surface. The
electrodes are removed or created in such a fashion that they resemble the teeth of a
comb. Next high voltage is applied to the electrodes while the temperature is held above

9
the Curie temperature. The electric field changes the poling direction and after cooling
down, the piezoelectric element has approximately the same poling direction. In addition
to repoling, the electrodes were placed in accord with calculated optimum placement. All
three were placed in a test apparatus with their edges fixed and subject to a changing air
pressure on one side. Data about air pressure and voltage were collected via separate
boards and computers and then graphed and analyzed. Regrouping and repoling of the
PEG in the 33 direction (interdigitated method) produces more efficiency, as did the
change in electrode placement.
Frequency of driving vibrations is another factor in PEG efficiency (Poulin, et al
(2003)). As a basic rule, the closer the driving vibrations are to the natural frequency of
the device, the more efficient it will be. Lu, et al (2002), however, showed that some
devices will increase in output as frequency increases. But even to this suggestion there
is a limit, as their research also shows that above a certain point, efficiency actually
decreases.
2.1.3. PEG Circuit Optimization
In addition to optimizing the physical design of the PEG, the power conditioning
circuitry can also be improved. As the physical design of this experiment is different
than that of one for MEMS, circuit design is more relevant to this study.
One of the many interesting studies determined that the energy generated by a
piezoelectric device subject to random vibrations could be stored via a battery or
capacitor for later use (Sodano, et al (2005)). Other investigation shows that circuits with
very high efficiencies can be designed for PEG. Han, et al (2004) used a charge pump,
composed of a bank of capacitors and switches, to increase the efficiency of a PEG
circuit. Efficiencies of this new circuit were as much as 92% higher than previous
designs, leaving more power available for use outside of the PEG.
Of interesting note is the research cited by and expounded on by Makihara, et al
(2006). Because of the power generating capabilities of piezoelectric devices, they can
be used not only to control vibrations, but to power themselves while doing so.
Guyomar, et al (2000) showed a similar concept. In their research, a device was designed

10
that used a piezoelectric element and circuit to provide mechanical damping while
powering itself. Three designs were studied: a piezoelectric element with an open circuit,
a piezoelectric element with a switch on a short circuit, and a piezoelectric element with a
switch on an inductor. Whereas the first two designs had a narrow frequency within
which their damping was most effective, the damping of the switched inductor circuit had
a wider effective range. From this, one may note that this design harvested more energy
from the mechanical system. Although PEG was not the focus of this research, the same
design could be used for generation.
Priya (2007) conducted a survey of various advances in PEG. Various studies
were cited, yielding gains in efficiency from adding multiple layers, increasing mass (for
cantilever-type PEG), and increasing damping. Novel ideas were also discussed, such as
using an “eel” design for hydroelectric PEG and a wind turbine that generated electricity
using piezoelectric elements.
2.2. Inferences
The background information seems to point to PEG as a possible replacement
power source for batteries on a small scale. As size of the piezoelectric element can be
related to the power output of the PEG, this technology may be scalable for use in larger
applications. Because it utilizes dissipated energy, PEG could greatly improve efficiency
and decrease waste in many applications. High-energy conversion efficiencies (greater
than 90%) are possible given the optimum circuit and overall PEG design. It is the hope
of the author that these theories could be applied to transportation in such a way that
would alleviate current fuel consumption and avail itself of use on the next generation of
vehicles or as a retrofit on current ones.

11
CHAPTER 3. THEORETICAL POTENTIAL
In order to build validity, a mathematical analysis of the maximum power
available from the flow has been conducted.
3.1. Analysis of Experiment
Because of the pioneer nature of this application, a mathematical analysis is
worthwhile in not only the design of the experiment, but the conclusions drawn from it.
Maximum power available from the turbulent flow aided determining the feasibility of
this research. Material efficiency was also taken into consideration.
3.2. Maximum Power Available
Figure 3.1 below shows the calculated relationship between velocity and
aerodynamic drag force available using the formula for drag force:
F = CD * A * ( * v2 ) / 2. (Eq. 3.1)
Here, F is the force of the aerodynamic drag, CD is the dimensionless drag coefficient, A
is the cross-sectional area of the body in question, is the density of the fluid (in this
case air), and v is air velocity.
The frontal swept area of the vehicle used (1993 Acura Legend) was 0.1479 m2.
The drag coefficient for this vehicle was CD = 0.34.

12
Figure 3.1. Drag force as a function of velocity (CD = 0.34, A = 0.1479 m2).
Of the total drag on a vehicle, 70% can be said to occur at the front of the vehicle,
10% occurs along the sides and top, and 20% occurs at the rear; of this drag along the
sides and rear, turbulence only accounts for half (Gillespie (1992)). Using these
guidelines, it is possible to determine the maximum force present along the top of the
moving body:
FTOP = F * 0.50 * 0.10. (Eq. 3.2)
Power can then be found by multiplying this drag force by the air velocity, as the air
velocity acting on the piezoelectric element cannot be greater than the air velocity acting
on the object:
PMAX = FTOP * v. (Eq. 3.3)
Figure 3.2 shows maximum power available along the top of the body as a function
of wind velocity. The data for this figure may be found in Table A-1 in the Appendix.
The star at 30 m/s represents highway speeds (approximately 65 mph).
0.0
5.0
10.0
15.0
20.0
25.0
30.0
35.0
0.00 5.00 10.00 15.00 20.00 25.00 30.00 35.00
Aer
odyn
amic
Dra
g F
orce
(N
)
Velocity (m/s)
13
Figure 3.2. Maximum power available at various velocities.
The goal is to remove power from the flow of air over the body, but it is not
possible to harvest all of the available power. As area and density were assumed to be
constant, velocity and the drag coefficient were the only things that could be changed.
Figure 3.2 shows how power available varies with velocity. Adding a PEG of the type
mentioned here will change the drag coefficient in some way. Whether this will increase
or decrease the drag coefficient is unknown at this time, and was not tested in this study.
There is at least one more factor to consider here. The exact nature of turbulent
flow is an ongoing problem in the fields of engineering and physics. Each turbulent
situation seems to be unique, with its own characteristics. No singular solution has been
derived. As such, it is difficult to determine exactly how much of the power in the
turbulent flow could be harvested. Although the PEG discussed here is not of the wind-
turbine type, the Betz limit can still be used as a benchmark for wind generation. The
Betz limit states that the maxiumum amount of power that can be extracted from an
airstream is 59.3%. This results of this calculation are shown in Table A-1.
0.00
0.02
0.04
0.06
0.08
0.10
0.12
0.14
0.16
0.18
0.00 5.00 10.00 15.00 20.00 25.00 30.00 35.00
Maxim
um Power (W
)
Velocity (m/s)

14
The final factor to consider here is the mechanical-to-electrical conversion
efficiency of the piezoelectric material. According to manufacturer data, PVDF has a
maximum mechanical-to-electrical efficiency, k33, of 12%. The 33 subscript here
indicates that the force applied passes through the surface of the electrodes on the
piezoelectric element. Much higher conversion efficiencies (70% and higher) are
available with rigid, crystal-type piezoelectric materials, such as PZT. However, these do
not lend themselves well to the application used in this study. Therefore, the maximum
power possible from this material in this situation is given by:
PPEG = PMAX * k33. (Eq. 3.3)
This calculation is reflected in the last column of Table A-1. Thus, the maximum power
at the speeds tested in this study (22 m/s) is 0.0507 W (507 mW). Based on the
hypotheses discussed in section 1.5, there is enough power available.
3.3. Von Karman Vortex Shedding
As turbulent flow is chaotic in nature, many frequencies are present. However, as
the most power may be obtained at the resonant frequency, it is beneficial to excite the
piezoelectric element at this resonant frequency. One way to do this is to induce von
Karman vortex shedding using a cylinder. Von Karman vortex shedding is a
phenomenon in which vortices are produced on either side of a cylinder placed inside a
free-flow stream. These vortices are produced in an alternating fashion at a specific
frequency that is dependent upon the stream velocity and the diameter of the cylinder,
among other things.
The diameter of a cylinder needed to produce vortex shedding of a certain
frequency is given by:
d = 0.198 * [ 1 - ( 19.7 / Re ) ] * v / ƒ, (Eq. 3.4)
where d is the diameter of the cylinder in meters, Re is the Reynolds number, v is the
flow velocity in meters per second, and ƒ is the frequency in hertz. Given that:
Re = ( v * d * ) / µ, (Eq. 3.5)
Equation 3.4 then becomes:
d = ( 0.198 * v ) / [ ƒ + ( 3.9006 * µ) / ]. (Eq. 3.6)

15
3.4. Von Karman Application
The original intent was to use this information inside the wind tunnel. However,
after performing calculations and inspecting the wind tunnel, the idea was dismissed; the
area of the wind tunnel was so small that a cylinder would have taken up the bulk of the
tunnel, serving not produce the desired effect, but only to disrupt the flow of air. A larger
wind tunnel would have alleviated this issue. A smaller cylinder could also have been
used had higher velocities been available.

16
CHAPTER 4. EXPERIMENTS
In this chapter, the physical experiments are presented. Both the bench test and
the road test are explained in detail.
4.1. Explanation of Experiment
As this study is of an experimental nature, bench testing was chosen as the initial
experiment. A 0.56 m long wind tunnel with a cross-sectional area of 0.0232 m2 was
employed to this end (see Figure 4.1). The wind tunnel was measured to produce wind at
a maximum air velocity of approximately 16 m/s.
Figure 4.1. Assembled wind tunnel.
Air velocity was measured using a hot-wire anemometer which sent a 0-5 VDC
signal to the NI DAQ; the software then converted this voltage signal to an air velocity
measurement in meters per second.
17
The thin-film piezoelectric element was placed inside the wind tunnel such that
airflow caused it to oscillate. The piezoelectric element was connected to the NI DAQ
(see Section 4.1.1 for details). Open-circuit voltage (OCV) and closed-circuit voltage
(CCV) (through a 1 k resistor) from the piezoelectric element were measured using the
NI DAQ. CCV was later converted to closed-circuit current (CCC). Power was then
calculated using these measurements.
For the road test portion of the experiment, the same piezoelectric element
configurations and anemometer were used. These components were mounted on a
moving vehicle. The OROS DAQ and a laptop computer were used to collect voltage
data from the piezoelectric element and the anemometer.
4.1.1. Test Rig
One of the benefits of the piezoelectric collector is its simplicity. This rig is made
of a few simple elements: a piezoelectric sheet collector laminated to increase durability,
the anemometer, and the measurement device (a DAQ or the scope).
The piezoelectric element is made of a thin layer of polyvinylidene fluoride
(PVDF) mounted to a thin thermoplastic laminate. Various thicknesses were available,
such as 52 µm and 27 µm. The 27 µm thickness was chosen in order to make the most
use of the relatively low air velocities. In higher speed applications thicker piezoelectric
elements could be used.
The collector was mounted to a vertical rod within the wind tunnel. Various
arrangements were considered (Figure 4.2), but a flag-type element was chosen in order
to maximize movement of the piezoelectric element. In contrast, the skin-type element
may not be as efficient because of boundary-layer concerns. Close to a moving body,
lower flow is present; ergo less energy would be available for harvesting.

18
Figure 4.2. Various PEG design ideas.
4.1.2. Initial Circuit Design
As mentioned in Chapter 2, the charge pump is one of the most efficient PEG
circuit designs. This circuit was adapted for this study; the diagram for this charge pump
is shown in Figure 4.3. In this design, the piezoelectric element charges all four
capacitors in parallel. The switches are then manually switched and the capacitors can be
used in a parallel-series combination to power the LED. Note that here the piezoelectric
element is represented by an AC voltage source.

19
Figure 4.3. Charge pump circuitry.
This circuitry is operated manually as follows. First, the piezoelectric element is
used to charge the four capacitors (C1-C4) in parallel by closing switches S1, S2, and S3.
Once charged to maximum piezoelectric voltage, these switches are then opened. Next,
switches S4 and S5 are closed. This allows capacitors C1 and C2 to be arranged in
parallel; capacitors C3 and C4 are likewise arranged in parallel. These two parallel sets
are then arranged in series. The capacitors then light the LED (D2).
After measuring the output of the piezoelectric element with the scope, it was
found that the piezoelectric element did not produce enough voltage to switch the diodes.
Therefore, this design was abandoned in favor of the piezoelectric element by itself.
4.2. Bench Testing Procedure
Using LabVIEW software, a program was created to measure OCV and CCV
coming from the piezoelectric element as well as voltage from the anemometer. The
signal range of the NI DAQ was 10 V with a resolution of 16 bits. After reading the

20
values, the software displayed all values graphically. The user could choose for the
program to output the measurements to a text file. The data was checked against the
scope to ensure accuracy.
4.3. Pre-Experimental Set-up and Measurements
In order to gather accurate data about each trial, pre-experiment readings were
taken. Air velocity within the wind tunnel was first measured. Two nozzle options were
available: a square nozzle and a smaller, round one (Figures 4.4 and 4.5). Velocities
were taken from a nine-point grid pattern inside the tunnel and are reported in Table 4.1.
In this table, rows and columns are labeled with physical locations (top, middle, etc).
These locations graphically represent the points measured within the tunnel.
Figure 4.4. Square nozzle.

21
Figure 4.5. Round nozzle.
Table 4.1. Wind tunnel maximum velocities (given in m/s).
Square Nozzle Circular Nozzle
Left Center Right Left Center RightTop 7.92 8.94 8.03 Top 3.35 11.79 2.31
Middle 11.68 9.04 9.04 Middle 5.89 13.21 2.54 Bottom 8.84 10.26 8.74 Bottom 2.74 5.59 1.47
From Table 4.1 it can be seen that the smaller, round nozzle provided the highest
wind velocity (13 m/s—approximately 30 mph). Although this velocity is more
concentrated, the profile of the piezoelectric element fits well within the diameter of the
nozzle.
An LCR meter (Protek LCR Meter Z8200) was used to measure the capacitance
and AC resistance of the piezoelectric element at 1 kHz. All six piezoelectric elements
were measured in order to obtain accurate results. The results are displayed in Table 4.2.
Note the capacitive nature of the piezoelectric material.

22
Table 4.2. LCR measurements for piezoelectric elements.
XC (kΩ; at 1kHz) C (nF) R (Ω)
1 7.643 20.82 120
2 7.600 20.95 116
3 7.593 20.97 114
4 7.554 21.06 117
5 7.523 21.15 116
6 7.600 21.30 131
Averages 7.586 21.04 119
These values can be of use when looking at the circuit representation of a
piezoelectric element. This is shown In figure 4.6. Note that the piezoelectric element is
represented by an AC voltage source, a capacitor, and a resistor in series. This is
representation is consistent with the literature (e.g. Priya (2007)). The values for RPEG
and CPEG are those shown in Table 4.2. For the OCV measurements, the circuit was
connected directly to the DAQ at points 1 and 2. For the CCV measurements, a 1 kΩ
resistor was also attached at points 1 and 2, in parallel with the piezoelectric element.
Figure 4.6. Piezoelectric circuit representation.

23
4.4. Initial Test
For the initial test, OCV and CCV were obtained at various air velocities using
the scope. The test was then repeated using the LabVIEW software. CCC was found by
measuring the voltage across a 1 kΩ resistor. The test was performed with a single
piezoelectric element, two elements in series, and two elements in parallel. The results
for this test can be found in section 5.1.
4.5. Road Test
For the road test, the piezoelectric element was mounted to the top of a moving
vehicle (see Figure 4.7). This placement simulated the placement in the wind tunnel—
one with little interference from other objects. Once again, OCV and CCV were
measured for three different scenarios: a single piezoelectric element, two elements in
series, and two elements in parallel. The same anemometer was used for the road test.
CCV was converted to CCC after the data was collected.
Figure 4.7. Road test piezoelectric element mounting.
The OROS DAQ was utilized for the road test. This allowed for simpler
measurements than the NI DAQ and reduced the computing requirements.
For each of the six tests (OCV and CCV for each of the following: the single
element, two elements in series, and two elements in parallel), the vehicle was brought to

24
above 22 m/s and then measurements were taken. The vehicle was then brought to a stop
during the 30 second test, thereby reducing the air velocity.
In addition to obtaining the Root-mean-square (RMS) values for each of these
tests, the OROS DAQ allowed the frequency content of the piezoelectric output to be
observed.
25
CHAPTER 5. RESULTS AND DISCUSSION
Results of each test and inferences from them are discussed in this chapter.
5.1. Initial Test Results
In the initial test, OCV and CCC values were obtained. Figures 5.1 – 5.6 show
scope screen shots at the maximum air velocity tested (15 m/s—approximately 34 mph).
It should be noted that this setup had an RMS noise of 0.002 V and a PP noise of 0.014 V
with the air velocity at 0 m/s, rendering any readings at or below these values unusable.
This could be due to a number of factors, including movement of people within the room
and the HVAC system. Although the wind tunnel was an enclosed space, a vent for the
HVAC system was located directly above the bench. A piezoelectric is a very sensitive
device and can pick up pressure variations as small as those mentioned here. This effect
is most evident in the CCV figures.
Figure 5.1. OCV for a single piezoelectric at 15 m/s.

26
Figure 5.2. CCV for a single piezoelectric at 15 m/s across a 1 kΩ resistor.
Figure 5.3. OCV for two series piezoelectric elements at 15 m/s.

27
Figure 5.4. CCV for two series piezoelectric elements at 15 m/s across a 1 kΩ resistor.
Figure 5.5. OCV for two parallel piezoelectric elements at 15 m/s.

28
Figure 5.6. CCV for two parallel piezoelectric elements at 15 m/s across a 1 kΩ resistor.
The voltage was highest for the two elements in series. This is logical, as
capacitors are similar to voltage sources within a circuit—when in series, voltages are
additive; when in parallel, current is additive.
Note that the sample rate here was 500 Hz—much too low to capture all of the
signal, as is mentioned in section 5.2.
After viewing these signals with the scope, LabVIEW software and the NI DAQ
were used to measure and record air velocity, OCV, and CCV. These results are graphed
in Figures 5.7-5.9.
It should be noted that these graphs show the results of measuring the peak-to-
peak (PP) OCV and CCC. The sample rate for this first test was 0.25 Hz—too low to
draw many conclusions about the material or the test.
However, this initial test showed a number of things. First, the concept of this
study is correct; power can be harvested from turbulent airflow using PEG. Second, the
voltage and current characteristics were shown to be alternating between positive and
negative values, but at no constant frequency. Third, the frequency content was above
that which was measured using LabVIEW (0.25 Hz). As such, a much higher sampling
rate was used for the road test (see below). Fourth, the relationship between power and
air velocity is shown. Figures 5.7 – 5.9 show power as a function of air velocity for the

29
single piezoelectric element, two elements in series, and two elements in parallel. Power
in these figures was obtained by using the OCV and the CCC as measured using
LabVIEW. All figures show instantaneous power values calculated from RMS OCV and
CCC values. Note that these graphs closely match the power function shown in Figure
3.1.
Figure 5.7. Instantaneous power from a single piezoelectric element using LabVIEW.
0.00
20.00
40.00
60.00
80.00
100.00
120.00
140.00
0 2 4 6 8 10 12 14 16 18
Pow
er (micro W)
Air Velocity (m/s)

30
Figure 5.8. Instantaneous power from two series piezoelectric elements using LabVIEW.
Figure 5.9. Instantaneous power from two parallel piezoelectric elements using
LabVIEW.
0.00
10.00
20.00
30.00
40.00
50.00
60.00
70.00
0 2 4 6 8 10 12 14 16 18
Pow
er (micro W)
Air Velocity (m/s)
0.00
10.00
20.00
30.00
40.00
50.00
60.00
0 2 4 6 8 10 12 14 16 18
Pow
er (micro W)
Air Velocity (m/s)

31
RMS voltage and current were quite low—not enough to rectify the signal using a
diode. It should be noted that higher air velocities would lead to higher forces on the
piezoelectric elements and thus higher power. This can be clearly seen from the
relationships shown in the figures above.
5.2. Road Test Results
After performing these basic measurements with the bench test, the experiment
was then performed using a vehicle on the road. The size and material of the
piezoelectric element were the same as in the wind tunnel test. Although more power
could have been obtained, as a larger area was possible, it was deemed wise to hold these
variables constant.
For each test, the vehicle was brought to above 22 m/s. The data collection then
began and the vehicle was brought to a stop. Figure 5.13 shows a representative graph of
velocity versus time for one of these tests. There was a 23% variation for this slope
between tests. Note that each test run was 30 seconds long.
Figure 5.10. Sample velocity vs. time for road test.

32
As the data previously collected was at the 0.25 Hz range, the sampling rate was
increased—first to 4 kHz, then to 20 kHz, and finally to 40 kHz. The OROS DAQ
allowed for the measurement of OCV and CCV (across the 1 k resistor) from the
piezoelectric element, as well as the frequency content of both these signals. The OROS
DAQ had an input range of 15 V and a resolution of 16 bits. The CCV was then
converted to CCC by dividing by the resistance across which the measurement was taken
(1 k).
5.2.1. System Noise
In order to determine the noise in the data, trial runs at 0 m/s were taken to view
the frequency content and the noise present. The noise in the system was very low—less
than -125 dB/Hz. The frequency content of this test can be seen in Figure 5.14.
Figure 5.11. Welch power spectral density estimate for OCV from one element at 0 m/s.

33
5.2.2. Piezoelectric OCV Characteristics
In each of the tests, no voltage was produced below an air velocity of 15 m/s.
This can easily be seen as an almost instantaneous drop in voltage. Figure 5.15 shows
this effect in detail. Below this velocity, the force of the air upon the element is not
enough to generate much measurable voltage. If one were to use a larger or thicker
element, this velocity may be expected to increase.
Figure 5.12. OCV vs. velocity for a single piezoelectric element.
Velocity (m/s)

34
Figure 5.13. OCV vs. velocity for two piezoelectric elements in series.
Velocity (m/s)

35
Figure 5.14. OCV vs. velocity for two piezoelectric elements in parallel.
5.2.3. Piezoelectric CCV Characteristics
In order to measure the current output of the piezoelectric element, CCV was
measured across a series connected 1 k resistor. The measured values can be seen in
Figures 5.18 – 5.20. Once again, as with OCV, very little was observed below an air
velocity of 15 m/s.
The spike in voltage shown in Figure 5.18 was a brief increase in air velocity at
the end of the test.
Velocity (m/s)

36
Figure 5.15. CCV vs. velocity for a single piezoelectric element.
Velocity (m/s)

37
Figure 5.16. CCV vs. velocity for two piezoelectric elements in series.
Velocity (m/s)

38
Figure 5.17. CCV vs. velocity for two piezoelectric elements in parallel.
5.2.4. RMS Values
In order to obtain an accurate power output, RMS OCV and CCV were calculated
for the portion of the data that had a signal; including the entire trial would have led to
erroneously low RMS values. RMS values for OCV, CCC, and power for each of the
three test set-ups are shown in Table 5.1.
Table 5.1. OCV and calculated RMS, CCC, and power values.
Arrangement OCV (V) CCC (A) Power (W)
1 Piezo 1.96E‐02 2.80E‐06 5.49E‐08
2 Series 1.22E‐02 2.30E‐06 2.81E‐08
2 Parallel 3.50E‐03 6.40E‐06 2.24E‐08
Velocity (m/s)

39
While proving that the concept works, these numbers do not come close to the
aforementioned target of 20 mW.
5.2.5. Voltage Frequency Characteristics
Perhaps one of the most interesting facets of this study was the frequency
generated by the piezoelectric element. It was the original thought of the author that
these frequencies generated would be rather low (less than 1 kHz), due to the fact that it
is difficult for a physical object of this size to oscillate at high frequencies. However, as
can be seen in Figure 5.16, there was a large portion of high-frequency voltage with a
distinct spike at 3.5 kHz.
Figure 5.18. Welch power spectral density estimate for a single element.
The same was found to be true in all three cases. Although this spike was shifted
slightly for the case with two elements in series to 2.5 kHz (Figure 5.19), this was still

40
higher than the expected. This change in frequency may have multiple sources. One
could be that one element’s output was cancelled by the other’s, thereby reducing the
content at that particular frequency. This possibility is further discussed in section 5.3.
Figure 5.19. Welch power spectral density estimate for two elements in series.
It should also be noted that although each of the power spectral density figures
have a similar shape, the quantity of frequencies present in each changed. For example,
for the single piezoelectric element, the frequency content was about -79 dB/Hz at
resonance (Figure 5.18). Compare this to the series combination, -75 dB/Hz (Figure
5.19), and the parallel combination, -90 dB/Hz (Figure 5.20).

41
Figure 5.20. Welch power spectral density estimate for two elements in parallel.
This high-frequency power content has a few possible explanations. First, as the
force applied by the air was randomly changing, the voltage produced by the
piezoelectric element was randomly changing. These random and rapid changes lead to
higher frequency content. Second, although this study was focused on horizontal, flag-
type motion, there were other stresses being applied to the element. For example, there
may have been force components that applied tension to the flag along both its vertical
and horizontal axes. There may have been compressive forces, as well.
These forces combined could have produced frequencies much higher than the
simple flapping that was assumed here. Future study may be focused on which of these
components contributed the most to power generation and how to maximize this affect.
In order to determine whether this was indeed physically possible, the
piezoelectric element was then attached to a function generator. A Wavetek 182A was
used. This device had the capabilities of producing frequencies from 0.004 Hz to 4 MHz.

42
The function generator was first attached to a scope to check its accuracy. After this was
confirmed, the piezoelectric element was attached to the function generator. A 20 V PP
signal was sent to the piezoelectric element. The frequency of this signal was adjusted.
Although no physical movement was visible, the vibrations produced were audible.
Frequencies as high as 1.7 kHz could be easily heard, indicating that vibrations at these
high levels are possible. These vibrations, however, were not the flag-type movement
discussed here, but some form of compressive and tensile forces, perhaps along the
element’s horizontal axis.
5.3. Series & Parallel Circuit Issues
Although voltage should be additive when the elements are in series, and thus
approximately twice as large as the single element values, the data does not reflect this.
In fact, the single piezoelectric element produced the largest RMS voltage and power.
The OCV voltage for the two elements in series was only 62% of the single element’s
voltage. This could be caused by the elements bending in opposite directions, producing
voltages of opposing signs, and thus canceling each other.
In the case of CCC, the two elements in parallel did produce what was expected—
approximately twice as much current as the single piezoelectric element (229%).
However, the voltage here was lower by 83%. This could also be due to the
aforementioned cancelling effect.
5.4. Power Considerations
The power produced by the piezoelectric is not the only concern. Power density
is an important consideration as well. As the piezoelectric flag could be considered a
two-dimensional object if thickness is ignored, the following equation gives the
maximum power density per unit area:
PD = PMEAS / A, (Eq. 5.1)
where PD is the power density (W/m2), PMEAS is the experimentally measured
piezoelectric power output (W), and A is the area of the piezoelectric element (m2). Note
that the area of one piezoelectric element was 0.00638 m2. Using the data obtained from

43
the road test, power density for the single piezoelectric was the highest at 8.61 W/m2.
The power densities of the series and parallel combinations were 2.20 W/m2 and 1.76
W/m2, respectively. The data for these calculations can be found in Table A-2 in the
Appendix.
Efficiency of the element can be found as:
= PMEAS / PPEG, (Eq. 5.2)
where is the efficiency of the element in question and PPEG is the theoretical maximum
power for this setup. The single piezoelectric element yielded the highest numbers, with
an efficiency of 1.08 x 10⁻⁶ %. The series combination had an efficiency of 5.54 x 10⁻⁷ %.
The parallel combination had an efficiency of 4.42 x 10⁻⁷ %.
The micro-scale efficiencies are due in part to the fact that the maximum power
was calculated at a constant air velocity, whereas the RMS values mentioned here were
measured at decreasing air velocities. In addition, although the overall velocity as
measured was as high as 22 m/s, the nature of turbulence dictates that some of the
velocity components acting on the piezoelectric material were lower. Therefore, the
forces acting on the piezoelectric were smaller than the estimated theoretical maximum.
Another possibility is due to the nature of the piezoelectric material. When a
force is applied to a piezoelectric material in one direction, a voltage of a certain
magnitude and sign is created. If a force of the same magnitude but the opposite
direction is placed on the piezoelectric material, a voltage of the same magnitude as
before, but with the opposite sign, will be produced. A piezoelectric material that is
flapping (such as the ones used in this study) is undergoing various forces in various
directions. It is possible that some of these forces are opposing others. Thus, voltages
produced may cancel each other out before they leave the material.
Although power produced by the wind tunnel seemed to be higher, this power was
calculated on an instantaneous basis, thus taking into account the PP values, rather than
the RMS. The data, therefore, show much higher power generated.

44
5.5. Effect on Drag
The actual effect on drag was not determined. Three possibilities exist: increase,
no influence, or decrease. Although it may seem that this will add drag to the overall
design, this is not necessarily the case. Regardless of whether the energy is captured or
not, the moving body must give up energy to the air in order to move it. Once the air
passes the body, there is still energy present in the form of turbulence. This turbulence
adds to the overall aerodynamic drag. If this turbulence were to be reduced, the overall
drag will also decrease. Thus, harvesting energy from the wind has the two-fold
possibility of making useable electric power as well as reducing drag.

45
CHAPTER 6. CONCLUSIONS
In light of rising energy costs and increasing demand, new technologies such as
PEG can be of great benefit. Research surrounding these may lead to new sources for
energy harvesting. In addition, the flexibility and simplicity of PEG allow for installation
in areas where other generation techniques might not be feasible.
The technique used in this research generated acceptable voltage. Although
small, this voltage could be used for other applications, had the current generated been
high enough. The nature of the piezoelectric element, as a capacitive device, lends itself
to small current generation.
Based on the null and alternative hypotheses set forth at the beginning of this
experiment, this application did not yield enough power to meet the requirements. The
null hypothesis—H0: No useable power can be harvested from this setup—cannot be
rejected based on this data. To remind the reader, no statistical analysis was used for this
evaluation, as this was a quasi-experimental study (see section 1.5).
Although the power produced did not meet the 20 mW requirement, a few
phenomena were observed. First, the chaotic AC nature of the piezoelectric voltage was
observed. These observations would be useful in future studies, as the signal would need
to be rectified in order to be of much use in this application. To this end, more efficient
rectification techniques would be needed. Second, although adding multiple piezoelectric
elements in series or parallel seemed to be a good solution to low power production, this
only exacerbated the problem. As the voltages varied, they often cancelled each other
out, producing a lowered voltage. Thus, as above, an efficient rectification technique
would be required before combining the signals. After this, however, the signals could
be combined for increased output. Third, the frequency content of the voltage signal was
quite high. This may be looked at as a positive or a negative finding; in many instances it

46
is easier to produce high frequency forces. However, in wind applications, it is often low
frequency forces that produce much power.
The findings here could make a basis for future study. Rectification for PEG is a
topic studied by many researchers, but there is still much work to be done in this area.
More efficient rectification techniques would lead to more usable power, as the signals
could be rectified first and then combined.
Further investigation of the dynamic interaction between the piezoelectric element
and the air currents could also lead to interesting developments. A study on placement
and the effect on aerodynamic drag would be of great help were one to attempt to further
this technology. As more turbulent flow is present in some areas than others (under the
vehicle and behind it), the placement could be varied to observe power output and the
effect on the drag coefficient.
In addition to placement, it would be interesting and helpful to view the various
forces acting on the piezoelectric element within the flow. By doing this, one could more
accurately predict the maximum amount of power harvestable. This may also lead to a
better understanding of the interaction between the element and the flow. In order for
this to be of much use, a large number of sensors would be required, as well as a more
sophisticated DAQ system.
Another possibility for future study would be the use of other types of
piezoelectric materials. While the k33 constant for PVDF is 12%, other materials have
much higher k33 values; one such material is PZT, which has a k33 of around 70%. This
would lead to higher power output.
Future study could also investigate the relationship of power and velocity shown
here. Although this relationship seems generalizable to higher velocities, there may be
findings otherwise at much higher velocities. In general, higher velocities will lead to
higher forces on the piezoelectric element, which should lead to higher voltage, current,
and power output.
The limited current understanding of turbulent flow also is an interesting aspect of
this study. No current research allows one to compute the amount of energy in a given
turbulent situation. As such, it is difficult to quantify the theoretical maximum power

47
harvestable in a situation such as this. As mentioned in Chapter 5, this could be part of
the reason for the low efficiencies found here.

BIBLIOGRAPHY

48
BIBLIOGRAPHY Dong, Shuxiang, Li, J. F., Viehland, D., Cheng, J., Cross, L. E. (2004). A Strong
Magnetoelectric Voltage Gain Effect in Magnetostrictive-piezoelectric Composite. Applied Physics Letters, 85, 3534-3536.
Dong, Shuxiang, Li, Jie-Fang, Viehland, D. (2006). Magnetoelectric coupling, efficiency,
and voltage gain effect in piezoelectric-piezomagnetic laminate composites. Journal of Materials Science, 41, 97-106.
Friedmann, H., Petricevic, R., Ries, M. (2007). On the way to active systems: AVR Rotor
– active vibration reduction for a textile bobbin. Computers and Structures, 86, 447-453.
Funasaka, Tsukasa, Furuhata, Makoto, Hashimoto, Yasuharu, & Nakamura, Kiyoshi.
(1998). Piezoelectric Generator Using a LiNbO, Plate with an Inverted Domain. IEEE Ultrasonics Sypmosium, 1998, 959-962.
Gillespie, Thomas D. (1992). Fundamentals of Vehicle Dynamics. Society of
Automotive Engineers (1992) Warrendale, PA. Grove, T. T., Ehle, A. (2002). Impulse, momentum, and energy of human strikes using
inexpensive piezo disks. American Journal of Physics, 72, 281-284. Jifeng Han, Annette von Jouanne, Triet Le, K. Mayaram, T. S. Fiez. (2003). Novel Power
Conditioning Circuits for Piezoelectric Micro Power Generators. Applied Power Electronics Conference and Exposition, 2004. APEC '04. Nineteenth Annual IEEE, 3, 1541- 1546.
Kim, Sunghwan. (2002). Low power energy harvesting with piezoelectric generators
(Doctoral dissertation, University of Pittsburgh, 2002). Dissertation Abstracts International, 64/02, 920.
Kim, Sunghwan, Clark, William W., & Wang, Qing-Ming. (2005). Piezoelectric Energy
Harvesting with a Clamped Circular Plate: Analysis. Journal of Intelligent Material Systems and Structures, 16, 847-854

49
Lu, F., Lee, H. P., & Lim, S. P. (2002). Modeling and analysis of micro piezoelectric power generators for micro-electromechanical-systems applications. Smart Materials and Structures, 13, 57-63.
Makihara, Kanjuro, Onoda, Junjiro, & Minesugi, Kenji (2006). Behavior of Piezoelectric
Transducer on Energy-Recycling Semiactive Vibration Suppression. AIAA Journal, 44, 411-413.
Ogando, Joseph (2007, June 25). Adaptronic Vibration Control. Design News, 2007,
June, 33-35. Ottman, Geffrey K., Hofmann, Heath F., and Lesieutre, George A.. (2003). Optimized
Piezoelectric Energy Harvesting Circuit Using Step-Down Converter in Discontinuous Conduction Mode. IEEE Transactions on Power Electronics, 18, No. 2.
Poulin, G., Sarraute, E., & Costa, F. (2003). Generation of electrical energy for portable
devices Comparative study of an electromagnetic and a piezoelectric system. Sensors and Actuators, A 116, 461-471.
Priya, Shashank. (2007). Advances in energy harvesting using low profile piezoelectric
transducers. Journal of Electroceramics (2007), 19:165-182 Ramsey, M.J. and Clark, W.W. 2001. ‘‘Piezoelectric Energy Harvesting for Bio MEMS
Applications,’’ Proceedings of SPIE’s 8th Annual Smart Materials and Structures Conference, Newport Beach, CA, 4332–2001, 429–438.
Richard, C., Guyomar, D., Audigier, D., and Bassaler, H., “Enhanced Semi Passive
Damping Using Continuous Switching of a Piezoelectric Device on an Inductor,” Proceedings of the SPIE Smart Structures and Materials Conference, 3989, Society of Photo-Optical Instrumentation Engineers, Bellingham, WA, 2000, 288–299.
Roundy, S. and Wright, P. K. (2004). A piezoelectric vibration based generator for
wireless electronics. Smart Materials and Structures, 13, 1131-1142. Sekaran, Uma. (2002). Research Methods for Business: A Skill Building Approach (2002)
New York, NY. Smith, W. A., Shaulov, A. A., Singer, B. M. (1984). Properties of composite piezoelectric
materials for ultrasonic transducers. Ultrasonics Symposium, 1984, 539-544. Sodano, Henry A., Inman, Daniel J., Park, Gyuhae (2005). Generation and Storage of
Electricity from Power Harvesting Devices. Journal of Intelligent Material Systems and Structures, 16, 67-75.

50
Song, Hyun-Cheol, Kim, Hyung-Chan, Kang, Chong-Yun, Kim, Hyun-Jai, Yoon, Seok-Jin, & Jeong, Dae-Yong (2007). Multilayer piezoelectric energy scavenger for large current generation. Journal of Electrocermaics, 23, 301-304.
Starner, T. 1996, ‘‘Human-Powered Wearable Computing,’’ IBM Systems Journal,
35:618–629.

APPENDIX

51
APPENDIX
Table A-1. Maximum power data.
Drag coeff.
Air density Velocity
Piezo area
Vehicle frontal
area
Drag force on vehicle
Drag force
at sides (10%)
Turbulent drag force acting on
piezo
Max. power at sides
Max. power with Betz limit
Max. power with k33
(12%)
CD p (kg/m3) v (m/s) APEG(m2) A (m2) F (N) (N) (N) (W) (W) (W)
1.05 1.233 2.00 0.00638 0.14790 0.3831 0.0383 0.0008 0.0017 0.0010 0.0001
1.05 1.233 4.00 0.00638 0.14790 1.5324 0.1532 0.0033 0.0132 0.0078 0.0009
1.05 1.233 6.00 0.00638 0.14790 3.4478 0.3448 0.0074 0.0446 0.0265 0.0032
1.05 1.233 8.00 0.00638 0.14790 6.1294 0.6129 0.0132 0.1058 0.0627 0.0075
1.05 1.233 10.00 0.00638 0.14790 9.5772 0.9577 0.0207 0.2066 0.1225 0.0147
1.05 1.233 12.00 0.00638 0.14790 13.7912 1.3791 0.0297 0.3569 0.2117 0.0254
1.05 1.233 14.00 0.00638 0.14790 18.7713 1.8771 0.0405 0.5668 0.3361 0.0403
1.05 1.233 16.00 0.00638 0.14790 24.5176 2.4518 0.0529 0.8461 0.5017 0.0602
1.05 1.233 18.00 0.00638 0.14790 31.0301 3.1030 0.0669 1.2047 0.7144 0.0857
1.05 1.233 20.00 0.00638 0.14790 38.3088 3.8309 0.0826 1.6525 0.9800 0.1176
1.05 1.233 22.00 0.00638 0.14790 46.3536 4.6354 0.1000 2.1995 1.3043 0.1565
1.05 1.233 24.00 0.00638 0.14790 55.1647 5.5165 0.1190 2.8556 1.6934 0.2032
1.05 1.233 26.00 0.00638 0.14790 64.7419 6.4742 0.1396 3.6306 2.1530 0.2584
1.05 1.233 28.00 0.00638 0.14790 75.0852 7.5085 0.1619 4.5346 2.6890 0.3227
1.05 1.233 30.00 0.00638 0.14790 86.1948 8.6195 0.1859 5.5773 3.3073 0.3969
1.05 1.233 32.00 0.00638 0.14790 98.0705 9.8071 0.2115 6.7688 4.0139 0.4817

52
Table A-2. Piezoelectric element efficiency.
Arrangement Power
Generated Power
Density Maximum Theoretical
Power Harvestable Efficiency (W) (W/m2) (W) (%)
Single Piezoelectric 5.49E-08 8.61E-06 5.07E-02 1.08E-06
Series Piezoelectric 2.81E-08 2.20E-06 5.07E-02 5.54E-07
Parallel Piezoelectric 2.24E-08 1.76E-06 5.07E-02 4.42E-07