Using patient data for improvement work
70
Using patient data for improvement work Record reviews versus quality registries: What do we achieve with each method?
Transcript of Using patient data for improvement work

Using patient data for improvement
work
Record reviews versus quality registries:What do we achieve with each method?

Kjersti MevikPhd student, MD
Patient safety advisor
Regional patient safety resource center Nordland Hospital trust
Bodø, Norway
13.04.16
Experiences from a Norwegian hospital trust

1. Fracture after patient falls in the bathroom
2. Wound infection after surgery
3. Blood transfusion after hip replacement
4. Urinary tract infections when using catheter
5. Gastroenteritis while admitted to hospital
Foreseeable complications
Adverse events
or

ERRORBLAME
HARM
SUFFERING

GTT definition of harm
”Unintended physical injury resulting from or contributed to by medical care that requiresadditional monitoring, treatment or hospitalization, or that results in death. ”

C1 Transfusion or use of blood products
C2 Code/arrest/rapid response team
C3 Acute dialysis
C4 Positive blood culture
C5 X-ray or Doppler studies for emboli or DVT
C6 Decrease of greater than 25% in hemoglobin or hematocrit
C7 Patient fall
C8 Pressure ulcers
C9 Readmission within 30 days
C10 Restraint use
C11 Healthcare-associated infection
C12 In-hospital stroke
C13 Transfer to higher level of care
C14 Any procedure complication
C15 Other
S1 Return to surgery
S2 Change in procedure
S3 Admission to intensive care post-op
S4 Intubation/reintubation/BiPap in PACU
S5 X-ray intra-op or in PACU
S6 Intra-op or post-op death
S7 Mechanical ventilation greater than 24 hours post-op
S8 Intra-op epinephrine, norepinephrine, naloxone, or romazicon
S9 Post-op troponin level greater than 40 ng/l
S10 Injury, repair, or removal of organ because of accidental injury
S11 Change in anesthesia procedure
S12 Insertion of artery catheter or central venous catheter
S13 Surgery more than 6 hours
S14 Any operative complication
M1 Clostridium difficile positive stool
M3 INR greater than 6
M4 Glucose less than 50 mg/dl
M5 Rising BUN or serum creatinine greater than 2 times baseline
M6 Vitamin K administration
M7 Benadryl (Diphenhydramine) use
M8 Romazicon (Flumazenil) use
M9 Naloxone (Narcan) use
M10 Anti-emetic use
M11 Over-sedation/hypotension
M12 Abrupt medication stop
M13 Other
I1 Pneumonia onset
I2 Readmission to intensive care
I3 In-unit procedure
I4 Intubation/reintubation
P1 Terbutaline use
P2 3rd- or 4th-degree lacerations
P3 Platelet count less than 50,000
P4 Estimated blood loss > 500 ml (vaginal) or > 1,000 ml (C-section)
P5 Specialty consult
P6 Oxytocic agents
P7 Instrumented delivery
P8 General anesthesia
P9 Apcar score <7 after 5 minute
P10 Induced labour
E1 Readmission to ED within 48 hours
E2 Time in ED greater than 6 hours
Triggers used in Global Trigger Tool

Categorization of adverse events
Types
Hospital acquired infections
Urinary tract infection
CVC infection
Ventilator associated pneumonia
Other infection
Lower respiratory infection
Surgical complications
Infection after surgery
Respiratory complications after surgery
Return to surgery
Injury, repair or removal of organ
Occurrence of any operative complication
Switch in surgery
Other
Bleeding/thrombosis
Thrombosis/Embolism
Bleeding
Bleeding after surgery
Patient fall /fracture
Patient fall
Fracture
Other
Allergy
Medical technical harm
Deterioration and chronic illness
Medication harm
Obstetric harm
Pressure ulcer
Severity
E- Temporary harm requiring intervention
F- Temporary harm requiring initial or prolonged hospitalization
G- Permanent patient harm
H- Intervention required to sustain life
I- Patient death
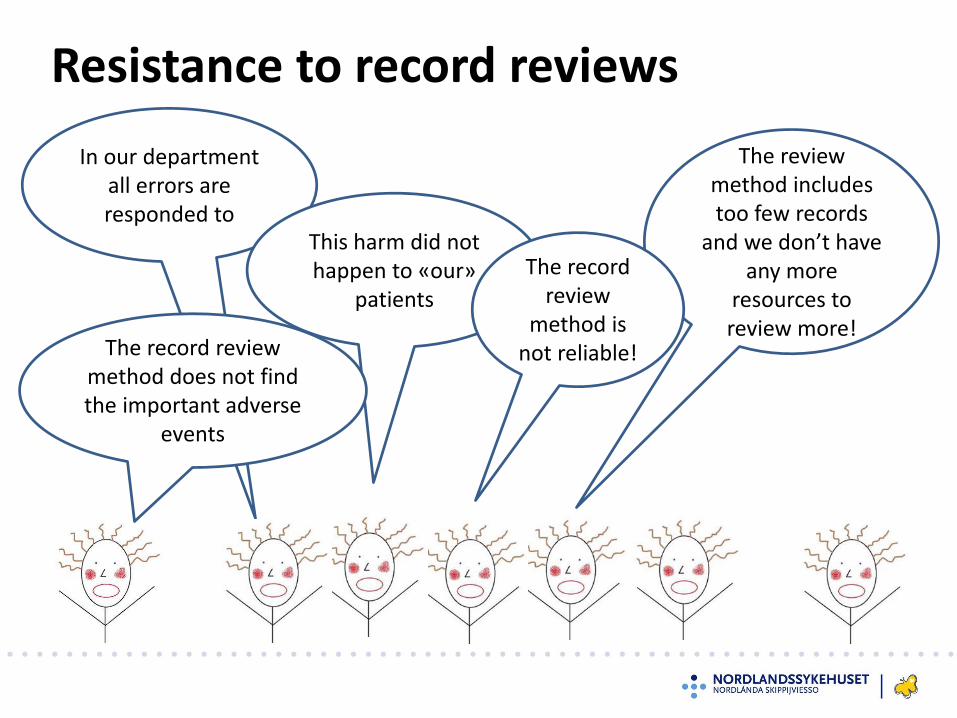
In our department all errors are responded to
Resistance to record reviews
The review method includes too few records
and we don’t have any more
resources to review more!
This harm did not happen to «our»
patients
The recordreview
method is not reliable!The record review
method does not findthe important adverse
events

What we did to overcome the resistance
• Involved the clincial staff
• The clinical staff analysed their «own» patients
• Developed an automatic search for triggers
• Adjusted the sample size
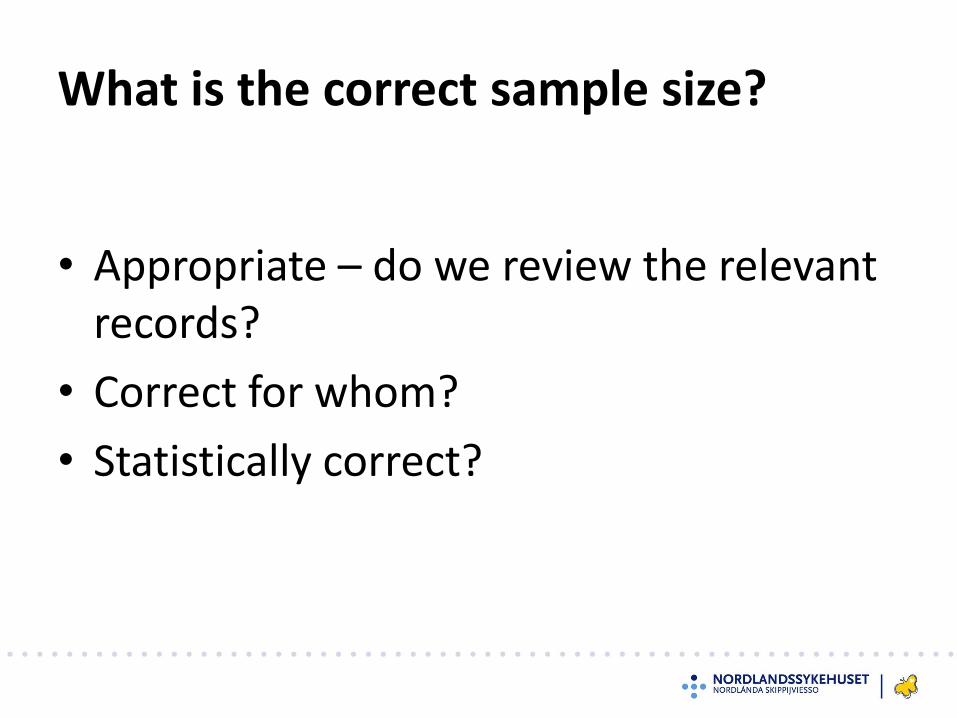
What is the correct sample size?
• Appropriate – do we review the relevant records?
• Correct for whom?
• Statistically correct?

Research is always good!
Evaluating the sample size:
Our sample size:70 records/bi-weekly
Recommended sample size: 10 records/bi-weekly
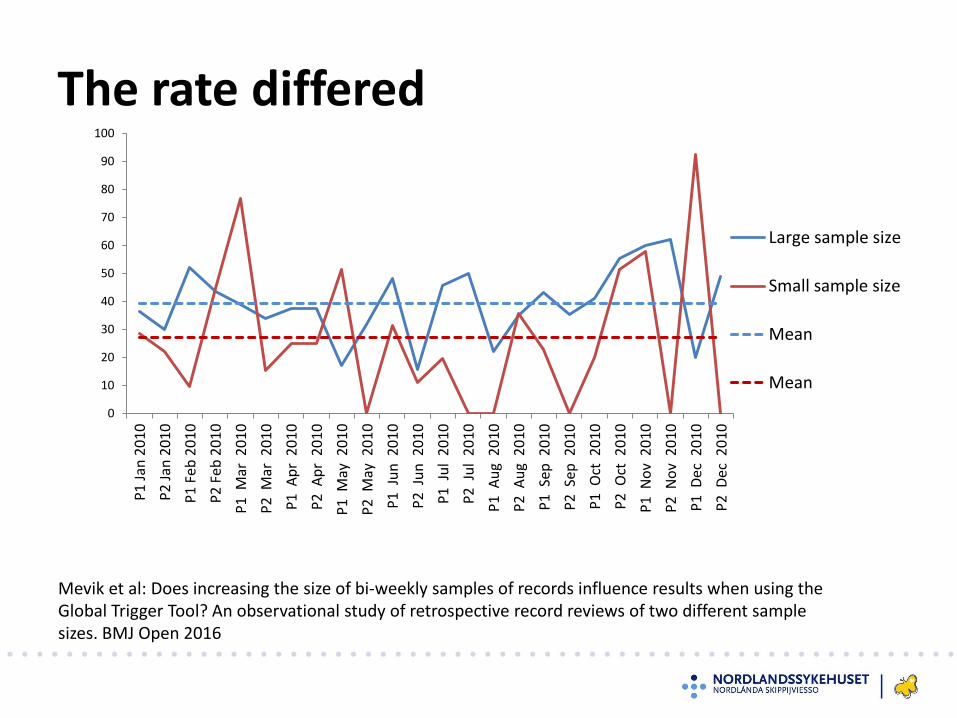
The rate differed
Mevik et al: Does increasing the size of bi-weekly samples of records influence results when using theGlobal Trigger Tool? An observational study of retrospective record reviews of two different sample sizes. BMJ Open 2016
0
10
20
30
40
50
60
70
80
90
100P
1 J
an 2
01
0
P2
Jan
20
10
P1
Feb
20
10
P2
Feb
20
10
P1
Mar
20
10
P2
Mar
20
10
P1
Ap
r 2
01
0
P2
Ap
r 2
01
0
P1
May
20
10
P2
May
20
10
P1
Ju
n 2
01
0
P2
Ju
n 2
01
0
P1
Ju
l 2
010
P2
Ju
l 2
010
P1
Au
g 2
010
P2
Au
g 2
010
P1
Sep
20
10
P2
Sep
20
10
P1
Oct
20
10
P2
Oct
20
10
P1
No
v 2
010
P2
No
v 2
010
P1
Dec
20
10
P2
Dec
20
10
Large sample size
Small sample size
Mean
Mean
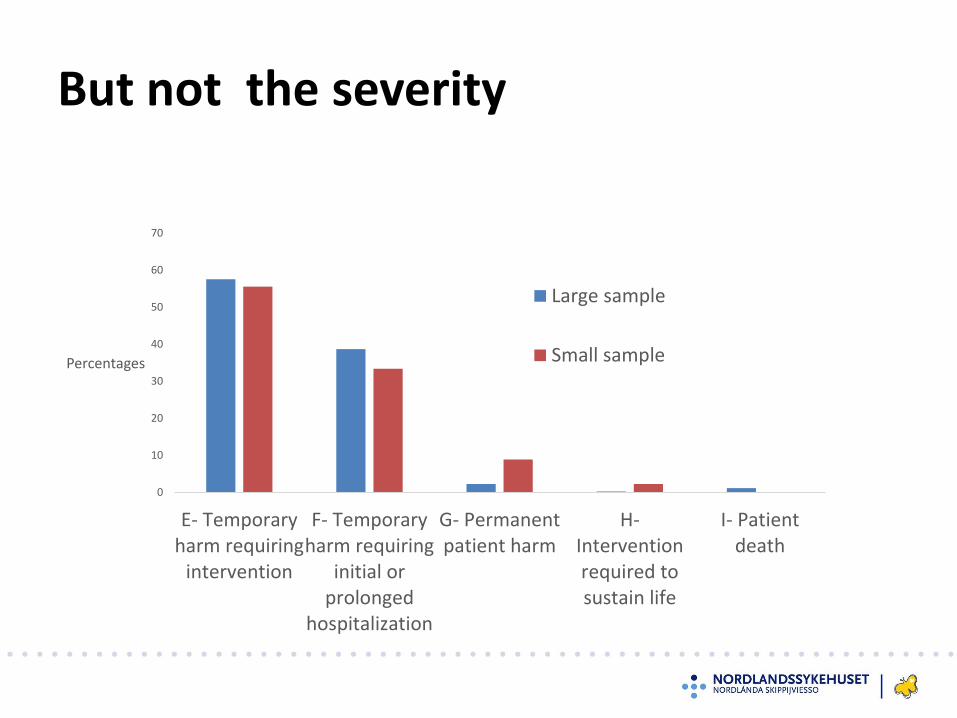
But not the severity
0
10
20
30
40
50
60
70
E- Temporaryharm requiring
intervention
F- Temporaryharm requiring
initial orprolonged
hospitalization
G- Permanentpatient harm
H-Interventionrequired tosustain life
I- Patientdeath
Percentages
Large sample
Small sample

Or the types
0
5
10
15
20
25
30
35
40
45
Pe
rce
nta
ges
Large sample size
Small sample size
Implications of the study
To evalute the rate of adverse events:
• Adjusting sample size to hospital size?
• An increased new fixed sample size?
To evalute the types and severity of adverseevents:
• 10 records reviewed bi-weekly is sufficient

How are we using the results from theGTT?
If you don’t use them it is not necessary to measure!

1.Sharing the results
1.Transparency
2.Visible and available for involved staff
3.Simple and clear presentation
4.Updated data – fresh data dont smell
5.Encounters – the more the merrier

Transparent and visible – also for patients

2. Tracking the rate of adverse events over time

3. Evaluating the effects of different initatives
0
2
4
6
8
10
12
14
16
2010 2011 2012 2013 2014
Number of postoperative bleedings
0
5
10
15
20
25
30
35
2011 2012 2013 2014
Number of postoperative infections
0
10
20
30
40
50
2010 2011 2012 2013 2014
Number of adverse drug events

4. GTT results compared to other methods
Voluntary incident reporting:
How many percent of the adverse events identified in the GTT was also reported by the voluntary incident reporting system:
0-1 % 10-40 % 80 -100 %

5. Getting the boards on board

Record reviews
• Identifies types and severity of adverse events
• Tracking rate of adverse events over time
• Evaluate the effects of improvement work
• Understandable results
• All cause harm- includes the whole patient population

Meetbaar Beter
Dr. Jan-Henk Dambrink, MD
Member Advisory Board Meetbaar Beter
Interventional Cardiologist
Isala Zwolle, The Netherlands
Dr. Paul van der Nat
Manager Development & Implementation
Meetbaar Beter

Meetbaar Beter | International Forum on Quality & Safety in Healthcare 2016
“You will hear how Meetbaar Beter, an
initiative of 19 heart centers, uses outcomes
measures to realize improvements in care
delivery – even for medical conditions with
low patient volumes.”
26

Meetbaar Beter | International Forum on Quality & Safety in Healthcare 2016
The Meetbaar Beter centers
Participating heart centers
Participating intervention centers

Meetbaar Beter | International Forum on Quality & Safety in Healthcare 2016
Part 1: Introducing Meetbaar Beter
(Paul van der Nat)
Part 2: Physicians perspective: how
Meetbaar Beter has enabled us to improve (Jan-Henk Dambrink)
Content
28

Meetbaar Beter | International Forum on Quality & Safety in Healthcare 2016
Statement 1
A quality registry
without
connected improvement initiatives
has little value

Meetbaar Beter | International Forum on Quality & Safety in Healthcare 2016
Aim of Meetbaar Beter
By using a solid scientific basis, Meetbaar Beter defines and
measures relevant outcomes of cardiovascular treatments
to improve transparency and quality of healthcare delivery
for heart patients.
30

#1 Transparent outcome reporting
Showing all heart centers no matter what the results….
31
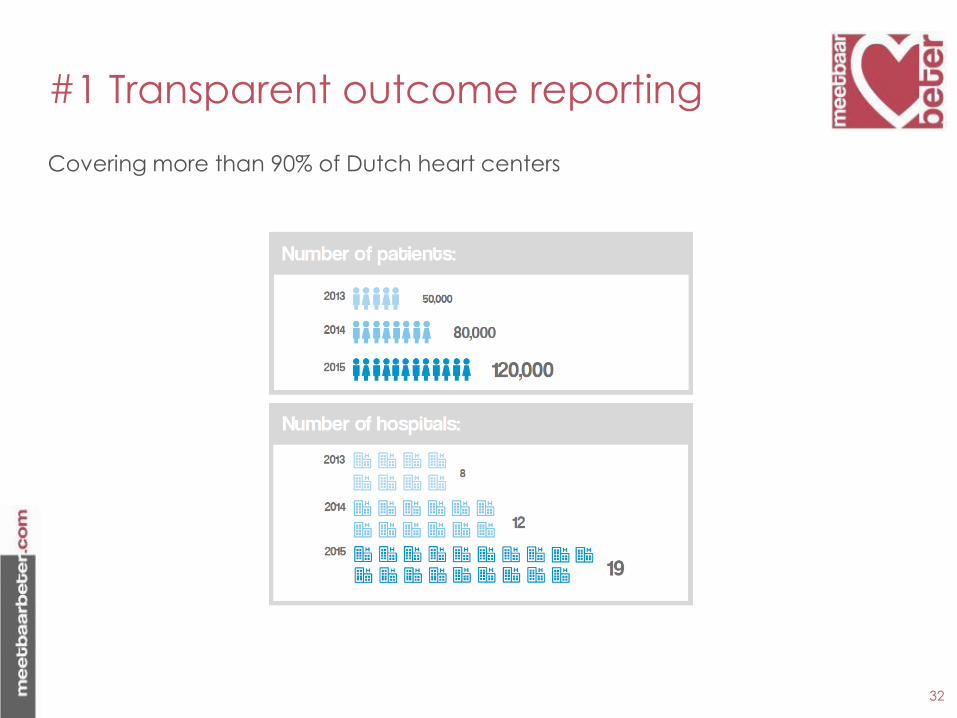
#1 Transparent outcome reporting
Covering more than 90% of Dutch heart centers
32

#1 Transparent outcome reporting
For the four main medical conditions including all treatment options (99% completeness in 2015).
33

Meetbaar Beter | International Forum on Quality & Safety in Healthcare 2016
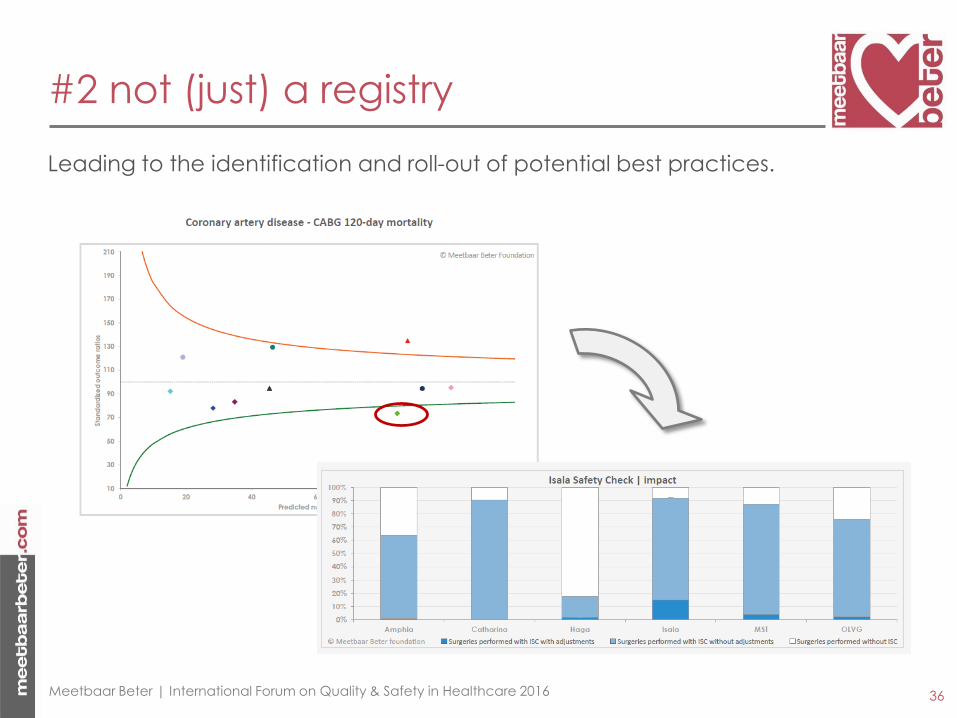
#2 not (just) a registry
Outcomes are used as starting point for improvements
34
Year
Nu
mb
er
2010 2011 2012 2013 2014 2015 2016
0
2
4
6
8
10
12
14 Improvement initiativesIndicator sets

Meetbaar Beter | International Forum on Quality & Safety in Healthcare 2016
#2 not (just) a registry
Outcome reports are used to create a learning & sharing platform
35
Meetbaar Beter | International Forum on Quality & Safety in Healthcare 2016
#2 not (just) a registry
Leading to the identification and roll-out of potential best practices.
36

#3 physicians in the lead
Medical leadership arranged within: board of directors, advisory board, Outcomes Teams (development), Medical experts (data audits).
37
Meetbaar Beter | International Forum on Quality & Safety in Healthcare 2016

#4 Complete patient populations
Outcome measures sets are defined for medical condition, including all treatment options, thus avoided unwanted risk selection.
38
Coronary Artery Disease
Treatment independent outcomes
CABG
Outcomes related to treatment
PCI
Outcomes related to treatment
Conservative
Outcomes related to treatment
Meetbaar Beter | International Forum on Quality & Safety in Healthcare 2016

#5 Patients at the center
Outcomes are presented for patients using infographics
39
Meetbaar Beter | International Forum on Quality & Safety in Healthcare 2016

#5 Patients at the center
Outcomes are selected within the Hierarchy of Porter including clinical outcomes as well as PROMs.
40
Meetbaar Beter | International Forum on Quality & Safety in Healthcare 2016
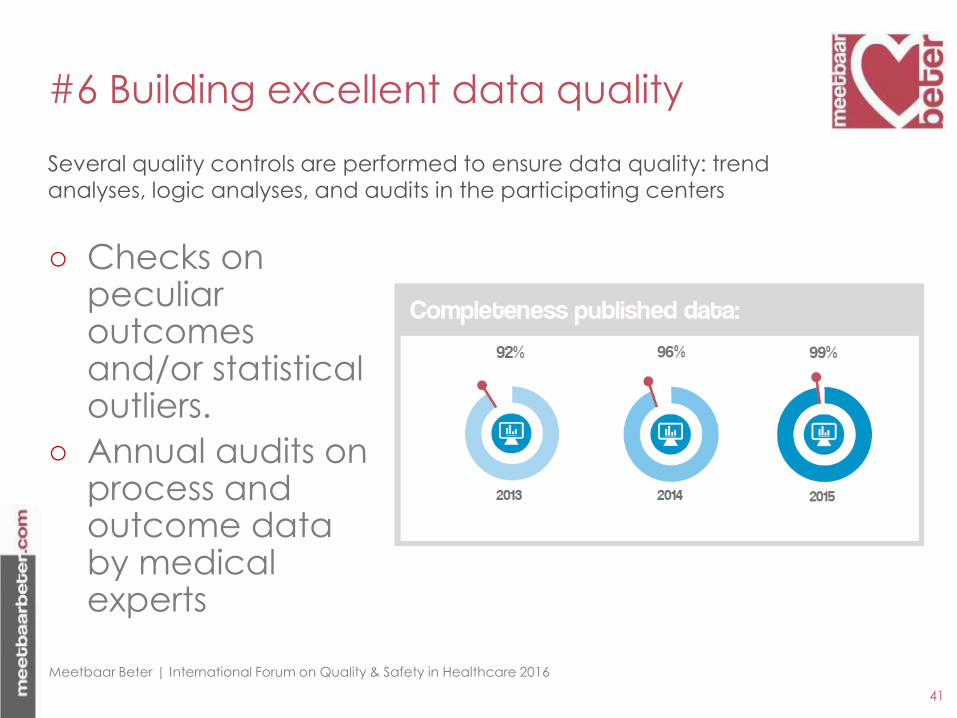
○ Checks on peculiar outcomes and/or statistical outliers.
○ Annual audits on process and outcome data by medical experts
#6 Building excellent data quality
Several quality controls are performed to ensure data quality: trend analyses, logic analyses, and audits in the participating centers
41
Meetbaar Beter | International Forum on Quality & Safety in Healthcare 2016

#7 Continuous innovation
Meetbaar Beter has defined the outcomes-based improvement cycle and supports realization in each of the heart centers.
42
3. Selection improvement
initiatives
1. Monitoring of
outcomes
4. Implementation of
improvements
2. Identification
improvement potential
a. Development outcome
measures sets
b. Maintenance of sets based on
physician and patient use of data
c. Data quality audits
d. Outcome reporting
a. Identify internal improvement potential
b. Identfiy external learning potential
c. Data mining, additional statistical analyses
a. Internal improvement cycles
b. Sharing best practices
c. Platform for learning&sharing
a. Roll-out of best practices
b. Monitoring of progress
c. Scientific evaluation of best
practices
Meetbaar Beter | International Forum on Quality & Safety in Healthcare 2016

Content
43
Part 1: Introducing Meetbaar Beter
(Paul van der Nat)
Part 2: Physicians perspective: how
Meetbaar Beter has enabled us to improve (Jan-Henk Dambrink)
44
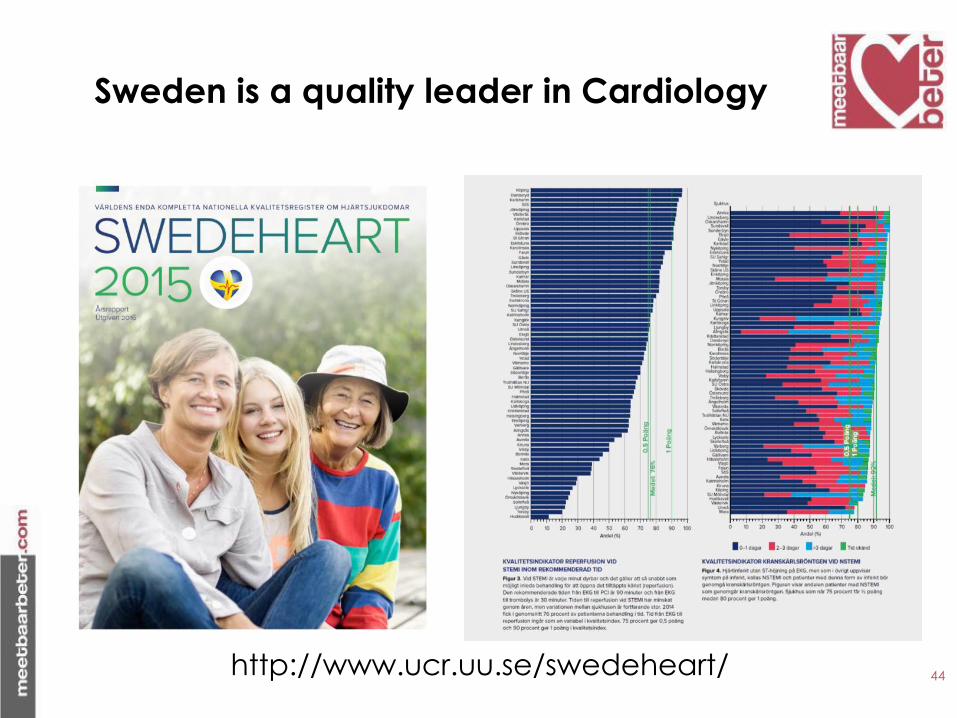
Sweden is a quality leader in Cardiology
http://www.ucr.uu.se/swedeheart/

European CARDS initiative - 2004
Eur Heart J. 2005 Feb;26(3):308-13
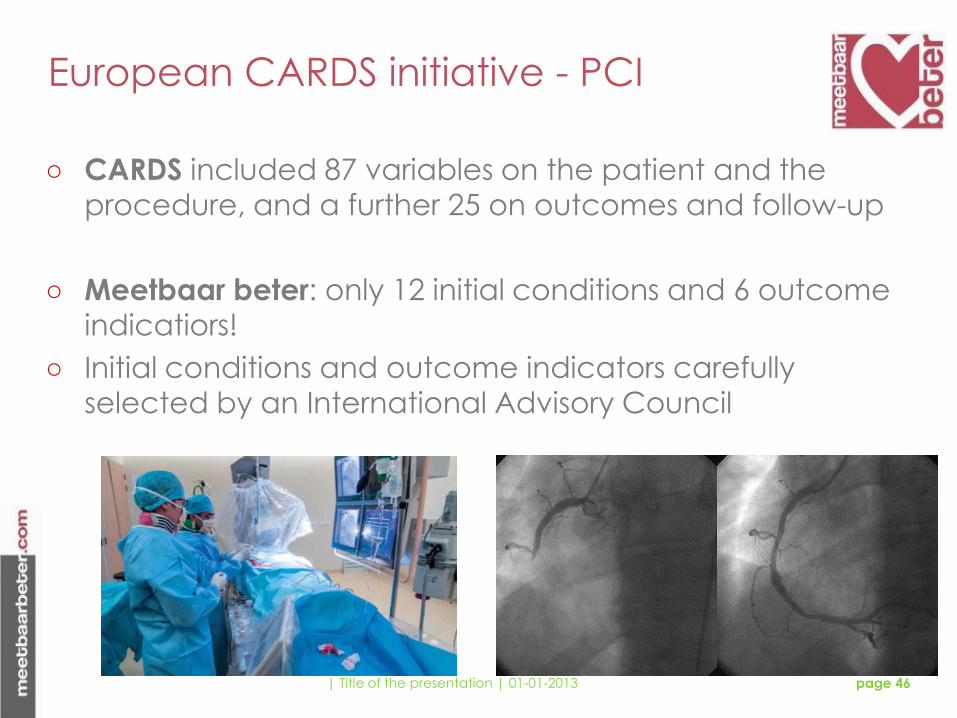
European CARDS initiative - PCI
○ CARDS included 87 variables on the patient and the procedure, and a further 25 on outcomes and follow-up
○ Meetbaar beter: only 12 initial conditions and 6 outcome indicatiors!
○ Initial conditions and outcome indicators carefully selected by an International Advisory Council
| Title of the presentation | 01-01-2013 page 46
○ Result: near complete dataset (published data > 90% complete)
○ Clinically relevant outcomes
○ Reliable statistical models. • Example: predictive power 30-day mortality after PCI
C-statistic 0.89.
○ Detect improvement potential – reveal ‘champions’ in the field
Meetbaar Beter
47
Meetbaar Beter | International Forum on Quality & Safety in Healthcare 2016

Statement 2
Quality improvements
should only be based
on
statistically significant data
Meetbaar Beter | International Forum on Quality & Safety in Healthcare 2016

Presentation of data:
allowing maximum learning potential
49
(1) Raw outcomes
(2) Segmented figures (3) Risk-corrected funnelplots
Meetbaar Beter | International Forum on Quality & Safety in Healthcare 2016

○ Mortality after PCI in kidney failure
○ Vascular complications in TAVI
○ Isala Safety Check
Examples of improvement projects
50
Meetbaar Beter | International Forum on Quality & Safety in Healthcare 2016

Segmented figures: Mortality PCI for
patients with kidney failure.
51
30-days mortality after PCI - 2013
1.4% 9.2% 1.9%
0%
2%
4%
6%
8%
10%
12%
14%
51/3629
no kidney insufficiency
21/228
kidney insufficiency
0/6
unknown
72/3863
overall
Relative Risk 6.6 (3.9 – 10.9)
2.0% 6.3% 3.2%
0%
2%
4%
6%
8%
10%
12%
14%
89/4363 57/910 26/92 172/5365
Relative Risk 3.1 (2.2 – 4.3)
OLVG vs Catharina p=0.115
Amsterdam
Eindhoven
52
○ Stop diabetes medication 48 hours before PCI
○ Give additional fluids before and after procedure
○ Limit contrast agent to max. 300 ml
○ No additional PCI procedures < 1 week
Standard measures already in place (before 2013):
Mortality after PCI in patients with kidney
failure: improvement program
Meetbaar Beter | International Forum on Quality & Safety in Healthcare 2016

53
○ No planning of PCI procedures without recent knowledge
of kidney function.
○ Differentiation in severity of kidney failure with regards to additional fluids
○ Weight related formula for max. amount of contrast agent
○ No additional PCI’s < 4 weeks
○ Encouragement to use smaller catheters, leading to less contrast use.
Mortality after PCI in patients with kidney
failure: improvement program
Additional measures (after 2013):
Meetbaar Beter | International Forum on Quality & Safety in Healthcare 2016

54
9.20%
5.00%
0%
2%
4%
6%
8%
10%
Voor Na
30-days mortality for patients
with kidney failure
Segmented figures: Mortality PCI for
patients with kidney failure.
Before After
Absolute mortality reduction of – 4.2%

55
Segmented figures (2): Mortality PCI for
patients with kidney failure.
30-days mortality after PCI - 2015
0%
2%
4%
6%
8%
10%
12%
14%
AMC
(n=5387)
Amphia
(n=0)
Antonius
(n=5517)
Catharina
(n=8589)
Erasmus
(n=1229)
Haga
(n=3237)
Isala
(n=6400)
MCL
(n=4259)
MST
(n=5092)
MUMC
(n=0)
OLVG
(n=4411)
Radboud
(n=1498)
UMCG
(n=0)
UMCU
(n=2141)
Coronary artery disease | PCI | 30-days mortality | kidney insufficiency
no kidney insufficiency kidney insufficiency© Stichting Meetbaar Beter
OLVG: Relative Risk kidney failure < 2
○ Mortality after PCI in kidney failure
○ Vascular complications in TAVI
○ Isala Safety Check
Examples of improvement projects
56

57
Transfemoral
Transcutaneous Aortic Valve
Implantation
58
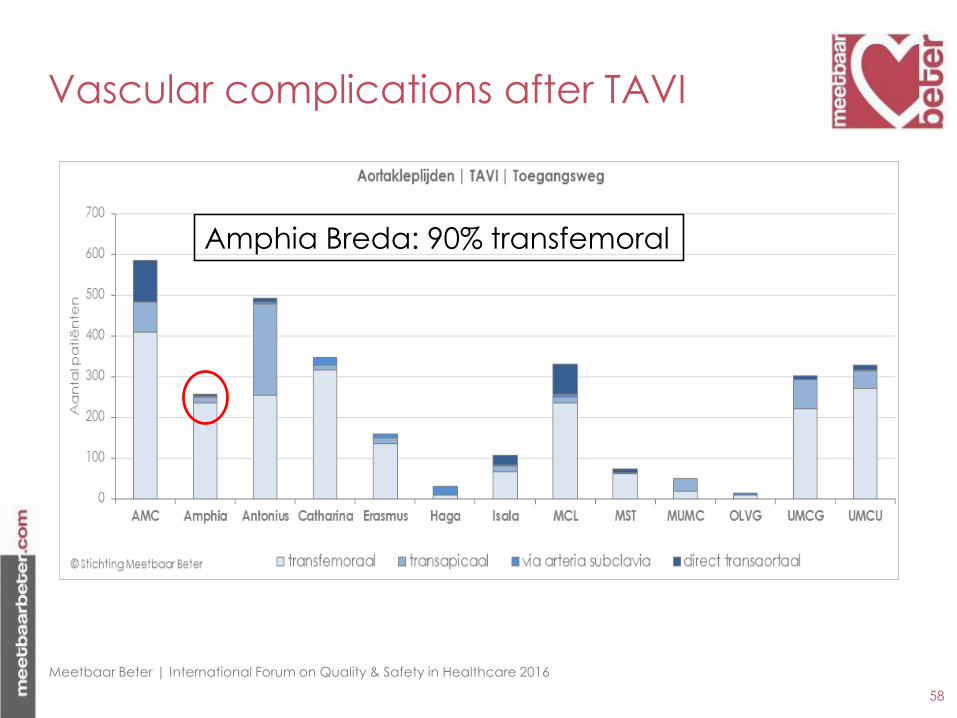
Vascular complications after TAVI
Amphia Breda: 90% transfemoral
Meetbaar Beter | International Forum on Quality & Safety in Healthcare 2016
59
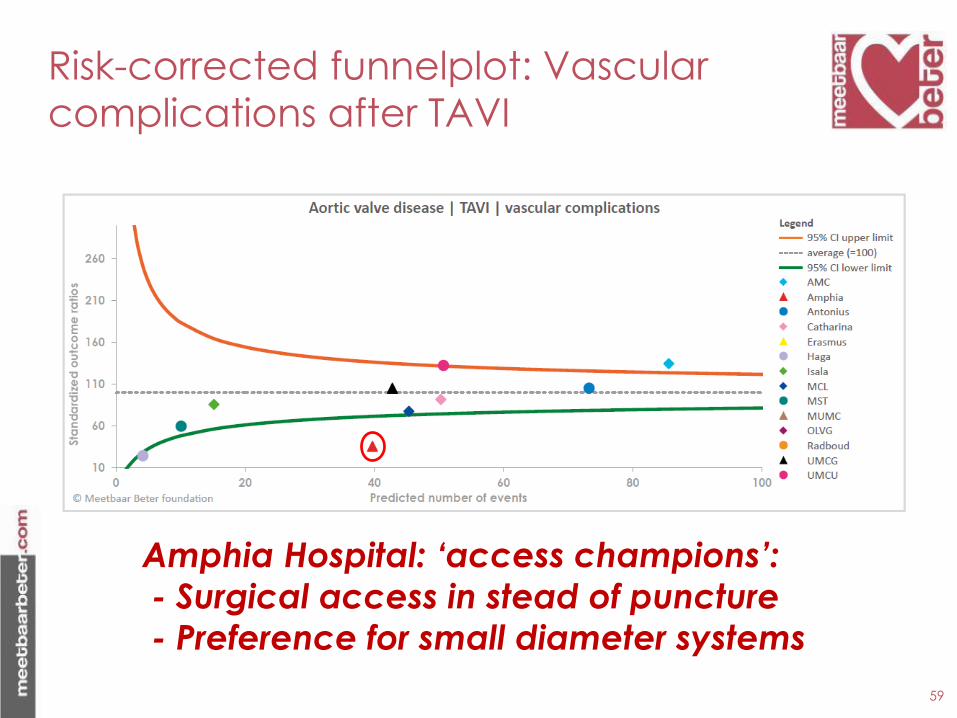
Risk-corrected funnelplot: Vascular
complications after TAVI
Amphia Hospital: ‘access champions’:
- Surgical access in stead of puncture
- Preference for small diameter systems
○ Mortality after PCI in kidney failure
○ Vascular complications in TAVI
○ Isala Safety Check
Examples of improvement projects
60
Meetbaar Beter | International Forum on Quality & Safety in Healthcare 2016

Isala safety check
61
Significantly reduced mortality after bypass surgery:
What was their secret?
Meetbaar Beter | International Forum on Quality & Safety in Healthcare 2016

62
Isala Safety Check in 5 rules (2 min)
1. Time out
2. EuroSCORE: Risk stratification
3. Assess cardiac, pulmonary, renal, neurological risk; infections, bleeding risk
4. Echocardiographic findings (transoesophageal)
5. Adjust treatment plan if indicated
Veiligheidscheck cardiochirurgie versie 8-14032013
VEILIGHEIDSCHECK
Regelvan5TeamApproach
Cardiochirurgie……………….
1 VOORINLEIDING:……………….SAFETYITEMS“ALGEMEEN”………………………………………………
TimeOutproceduregevolgd Ja Nee
2 VOORINCISIE…………………….Safetyitems“SPECIFIEK”…………………………………………………
EuroSCORE(Standaard) Laag0-2 Gemiddeld3-5 Hoog≥6
3 ….…VERHOOGDRISICOt.a.v.:………. Nee Ja Bespreek
1.Cardiaal2.Pulmonaal3.Renaal4.Neurologisch5.Infectieus6.Bloedingsstatus
4 …………Safetyitems“TEE”……………… Normaal Afwijkend Bespreek
1.LV-Functie/LAA/OFO2.Kleppen
3.Atheroscleroseascendensetc.
5 ……AANPASSINGPROCEDURE….. Nee Ja Bespreek1-8hieronder
1.IABPinbrengen:chirurgisch/percutaan2.Epi-aorticscanningnaTEE3.Geenchirurgie:onvoldoende-geenindicatie/ernstigverkalkteaortaasc./“in-operabel”4.Klem:andereplaatsaorta5Canulatie:andereplaatsopaortaascendens/andereplaatselders/anderecanule6.Pomp:oppomp-zonderAOXklem/off-pump7.Intracardialeaanpasssing:+/-MVP,+/-AVR,+/-TVP,LV-LAAthrombus,+OFO8.Proximaleanastomose:geensidebitingklem/andereplaatsaortaasc/LIMA-T/Ygraft9.Extracardialeaanpassing:patchin–ofvervangingaortaascendens10.Anders:beschrijf
….TEAM:CARDIOTHORACICSURGEONS-CARDIOTHORACICANESTHESIOLOGISTS….
BBB RL TM GS HS SS WS Other
EE JE CK MK BM AN CR WS FS HS SSP Other
Patiëntsticker
What is the Isala safety check?
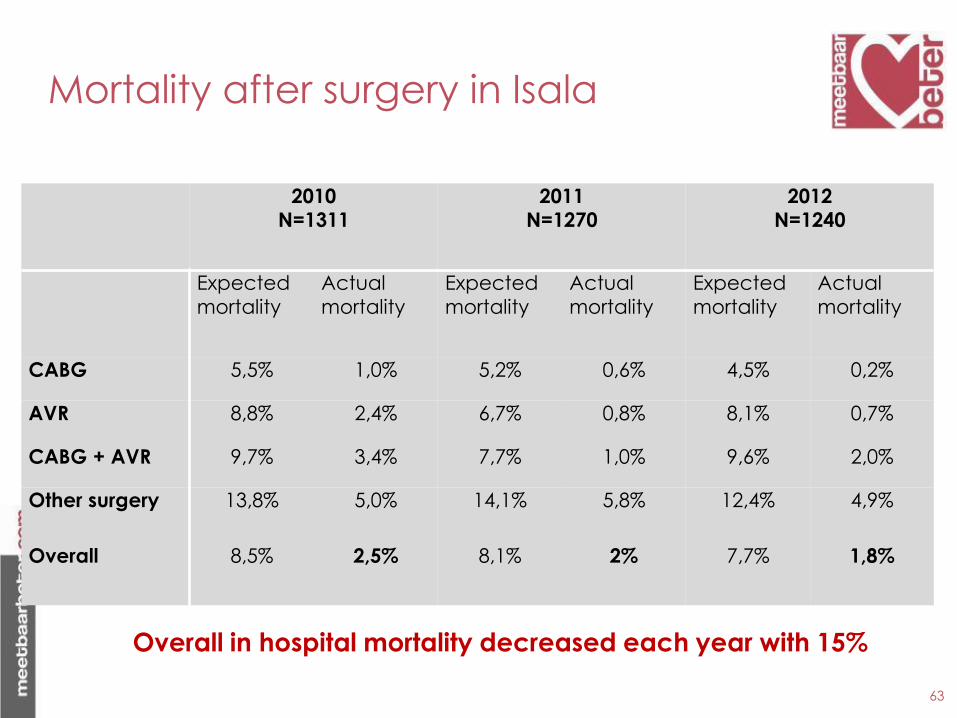
2010N=1311
2011N=1270
2012N=1240
Expected
mortality
Actual
mortality
Expected
mortality
Actual
mortality
Expected
mortality
Actual
mortality
CABG 5,5% 1,0% 5,2% 0,6% 4,5% 0,2%
AVR 8,8% 2,4% 6,7% 0,8% 8,1% 0,7%
CABG + AVR 9,7% 3,4% 7,7% 1,0% 9,6% 2,0%
Other surgery 13,8% 5,0% 14,1% 5,8% 12,4% 4,9%
Overall 8,5% 2,5% 8,1% 2% 7,7% 1,8%
Overall in hospital mortality decreased each year with 15%
63
Mortality after surgery in Isala
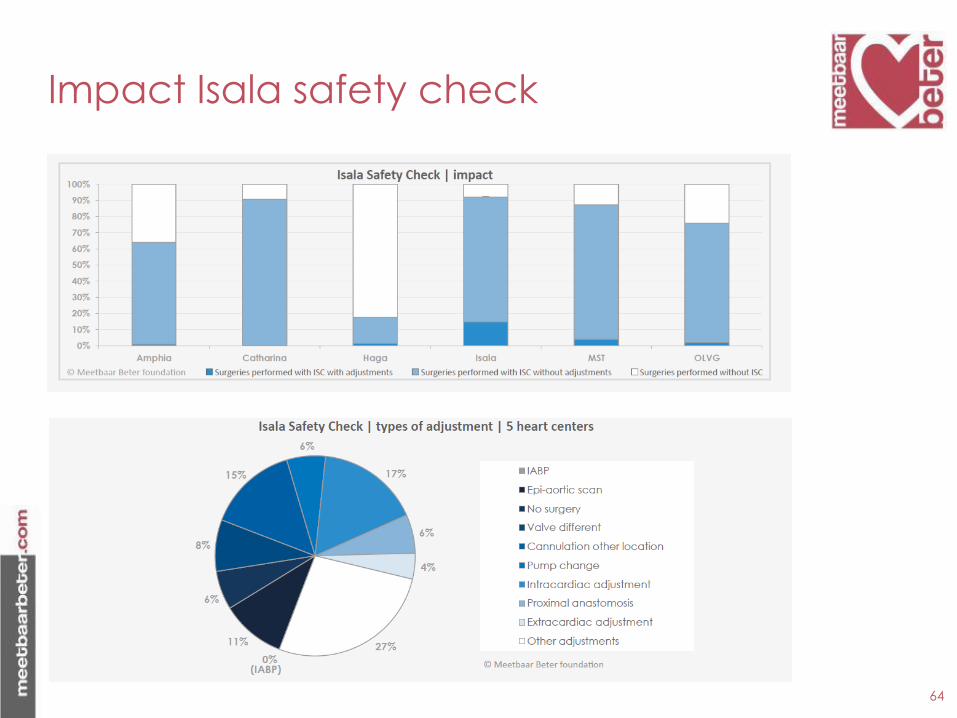
64
Impact Isala safety check

○ Meetbaar Beter has developed a
comprehensive and near complete database of
patients with heart disease that receive invasive
treatment in The Netherlands
○ This database allows for benchmarking between
centres and for a comparison with data from the
literature using weighted results
Conclusions (1)
65
Meetbaar Beter | International Forum on Quality & Safety in Healthcare 2016

○ The examples shown demonstrate that:
• Even non-significant differences using segmented results can help to identify improvement potential
• a study of outliers in risk-corrected funnelplots can help to identify champions in the field or improvement potential in individual centres
○ Sharing these results can help all centres to improve their patient outcomes.
Conclusions (2)
66
Meetbaar Beter | International Forum on Quality & Safety in Healthcare 2016

Thank you for your
attention!

Meetbaar Beter | International Forum on Quality & Safety in Healthcare 2016
Statement 1
A quality registry
without
connected improvement initiatives
has little value
Meetbaar Beter | International Forum on Quality & Safety in Healthcare 2016
Statement 2
Quality improvements
should only be based
on
statistically significant data
Meetbaar Beter | International Forum on Quality & Safety in Healthcare 2016