
Using paradata to explore item level response times in … paradata...Using Paradata to Explore Item...
16
© 2012 Royal Statistical Society 0964–1998/13/176271 J. R. Statist. Soc. A (2013) 176, Part 1, pp. 271–286 Using paradata to explore item level response times in surveys Mick P. Couper University of Michigan, Ann Arbor, and University of Maryland, College Park, USA and Frauke Kreuter University of Maryland, College Park, USA, Institut für Arbeitsmarkt- und Berufsforschung, Nürnberg, and Ludwig-Maximilians-Universität München, Germany [Received March 2011. Final revision January 2012] Summary. We analyse item level keystroke data from cycle 6 of the National Survey of Family Growth, which is a survey on fertility and related topics that is conducted in the USA. The National Survey of Family Growth is conducted among both males and females by using computer-assisted personal visit interviews and an audio computer-assisted self-interviewing component for the most sensitive topics. Our analyses focus on the time taken to answer a question as a function of item level characteristics, respondent characteristics and interviewer characteristics.Using multilevel models, we explore how these factors influence response times. Our exploratory study suggests that factors at all three levels (item, respondent and inter- viewer) influence response times.These results demonstrate that question features that explain variation in response times can be automatically derived from standard computer-assisted per- sonal interviewing paradata. The effects of respondent characteristics that we observe are in line with prior findings from more controlled studies conducted in supervised telephone facili- ties. Some demographic characteristics of interviewers contributed to the variation in response times, though they failed to explain large portions of the between-interviewer variance. Keywords: Item level times; Measurement error; Paradata 1. Introduction Paradata are widely used to explore non-response in surveys and to manage data collection (e.g. Kreuter et al. (2010), Kreuter and Kohler (2009) and LaFlamme (2009)). A promising area is the use of paradata-driven responsive design (for example, see Groves and Heeringa (2006)). However, the first uses of paradata focused on keystroke level data to explore measurement error in surveys, particularly in terms of the design of the computer-assisted interviewing (CAI) instruments and interviewer use of computers (e.g. Caspar and Couper (1997) and Couper et al. 1997a,b). Since then, relatively little attention has been paid to keystroke or item level para- data, with the exception of Web surveys where paradata have been used extensively to examine respondents’ interaction with the survey instrument (e.g. Heerwegh (2003), Stern (2008) and Yan and Tourangeau (2008)). The absence of research on the large-scale use of measurement-error-related paradata in inter- view surveys is unfortunate, given that the audit trail or keystroke data that are generated from CAI systems provide a rich source of information on the process at little additional cost, as was Address for correspondence: Mick P. Couper, Institute for Social Research, University of Michigan, PO Box 1248, Ann Arbor, MI 48106, USA. E-mail: [email protected]
Transcript of Using paradata to explore item level response times in … paradata...Using Paradata to Explore Item...
© 2012 Royal Statistical Society 0964–1998/13/176271
J. R. Statist. Soc. A (2013)176, Part 1, pp. 271–286
Using paradata to explore item level response timesin surveys
Mick P. Couper
University of Michigan, Ann Arbor, and University of Maryland, College Park, USA
and Frauke Kreuter
University of Maryland, College Park, USA, Institut für Arbeitsmarkt- und Berufsforschung,Nürnberg, and Ludwig-Maximilians-Universität München, Germany
[Received March 2011. Final revision January 2012]
Summary. We analyse item level keystroke data from cycle 6 of the National Survey ofFamily Growth, which is a survey on fertility and related topics that is conducted in the USA.The National Survey of Family Growth is conducted among both males and females by usingcomputer-assisted personal visit interviews and an audio computer-assisted self-interviewingcomponent for the most sensitive topics. Our analyses focus on the time taken to answer aquestion as a function of item level characteristics, respondent characteristics and interviewercharacteristics. Using multilevel models, we explore how these factors influence response times.Our exploratory study suggests that factors at all three levels (item, respondent and inter-viewer) influence response times.These results demonstrate that question features that explainvariation in response times can be automatically derived from standard computer-assisted per-sonal interviewing paradata. The effects of respondent characteristics that we observe are inline with prior findings from more controlled studies conducted in supervised telephone facili-ties. Some demographic characteristics of interviewers contributed to the variation in responsetimes, though they failed to explain large portions of the between-interviewer variance.
Keywords: Item level times; Measurement error; Paradata
1. Introduction
Paradata are widely used to explore non-response in surveys and to manage data collection (e.g.Kreuter et al. (2010), Kreuter and Kohler (2009) and LaFlamme (2009)). A promising area isthe use of paradata-driven responsive design (for example, see Groves and Heeringa (2006)).However, the first uses of paradata focused on keystroke level data to explore measurementerror in surveys, particularly in terms of the design of the computer-assisted interviewing (CAI)instruments and interviewer use of computers (e.g. Caspar and Couper (1997) and Couper et al.1997a,b). Since then, relatively little attention has been paid to keystroke or item level para-data, with the exception of Web surveys where paradata have been used extensively to examinerespondents’ interaction with the survey instrument (e.g. Heerwegh (2003), Stern (2008) andYan and Tourangeau (2008)).
The absence of research on the large-scale use of measurement-error-related paradata in inter-view surveys is unfortunate, given that the audit trail or keystroke data that are generated fromCAI systems provide a rich source of information on the process at little additional cost, as was
Address for correspondence: Mick P. Couper, Institute for Social Research, University of Michigan, PO Box1248, Ann Arbor, MI 48106, USA.E-mail: [email protected]

272 M. P. Couper and F. Kreuter
argued in the early days of paradata analyses (Couper, 1998). In this paper we explore item levelkeystroke data, focusing particularly on response time as a variable of interest.
Why is there interest in response time? Measures of time are readily available from mostCAI systems including both computer-assisted telephone interviewing (CATI) and computer-assisted personal interviewing (CAPI) software. Such measures of time have commonly beenused as indicators of possible measurement errors in surveys. Response times were found to beinversely correlated with the tendency to answer positively, irrespectively of the particular itemcontent (Knowles and Condon, 1999; Bassili, 2003)—a phenomenon which is known as acqui-escence bias. Shorter response times were found to be associated with context effects reflectingassimilation (Tourangeau, 1992) and the lack of motivation to answer accurately as the sur-vey continues (Bassili, 1996; Yan and Tourangeau, 2008). Heerwegh (2003) found that longerresponse times were associated with lower scores on knowledge items, and Draisma and Dijk-stra (2004) found that longer response times were an indictor of uncertainty and response errorand were associated with more non-substantive responses.
Given these findings, a statistical process control perspective on the use of paradata in surveys(see Kreuter et al. (2010)) would suggest using unusually long or unusually short response timesas proxy indicators for measurement error, controlling for other factors that influence responsetimes. Past research on response times has identified such factors on the item and respondentlevel (for a detailed review see Mayerl and Urban (2008)). Studies have found that both thelength of the question (Wagner-Menghin, 2002; Yan and Tourangeau, 2008) and its complex-ity (Bassili and Scott, 1996; Bassili and Krosnick, 2000; Yan and Tourangeau, 2008) increaseresponse times. Practice with survey items, such as the repeated use of the same answer scale orbatteries of similar items, have been found to reduce response times (Smith, 1968; Smith andLerner, 1986; Bassili, 1996; Huckfeldt et al., 1998).
With regard to respondent characteristics, older respondents and those with lower levels ofeducation have been repeatedly found to take longer to answer questions (e.g. Faust et al. (1999),Fisher and Glaser (1996) and Yan and Tourangeau (2008)). Respondents with readily availableattitudes exhibited faster response times (Fazio, 1986, 1990; Fazio and Williams, 1986; Ajzenet al., 1995) than those that required processing of a survey question before an answer canbe given (Smith et al., 1996). Stable effects of gender on response times have not been found(Mayerl and Urban, 2008). All studies report variation in respondents’ baseline speed (Fazio,1990; Mayerl et al., 2005), which is a variance component that is important to consider whenanalysing response times.
In large-scale interview surveys, one additional factor, beyond item and respondentcharacteristics, needs to be taken into account: the interviewer who is responsible for admin-istering the survey. Little is known about interviewer effects on paradata time measures,in part, because a large portion of the response time research has been conducted in self-administered modes with no interviewer present or measures of response time were focused onthe respondent only. There is, however, good reason to assume that interviewers do have aneffect on response times. Interviewers vary naturally in their rate of speech and in the way thatthey react to the respondents’ speech patterns (Schaeffer and Maynard, 2006; Conrad et al.,2010). In doing so, interviewers might (consciously or not) influence respondents’ rate of speechand their response times. Mayerl and Urban (2008) showed, for example, that respondents in-creased their response times in response to explicit instructions on speed and accuracy that theywere given. Interviewers may not directly give such instructions but signal preferences throughtheir behaviour (Cannell et al., 1981). Interviewer variation in overall survey administrationtime has also been studied by survey methodologists (see for example Olson and Peytchev(2007)).
Using Paradata to Explore Item Level Response Times 273
To date, most response time studies have been based on CATI surveys, self-administered Websurveys or self-administered surveys in laboratory settings. In some of these studies responsetimes have been actively captured by the interviewers. With the increase in the use of laptopcomputers for large-scale face-to-face surveys, item administration times are now available ona much broader scale and are captured automatically in the systems. Such item level times canbe used as a proxy for the time that respondents take to answer the question.
Understanding, and potentially controlling for, the interviewer contribution to questionadministration times is important because the time measures that are automatically capturedthrough paradata do not distinguish between the time taken for the interviewer to read thequestion, the time taken by the respondent to formulate and provide an answer and the timetaken by the interviewer to enter the response into the system. Partialing out the contributionof the interviewer in the overall time to administer an item will thus help to isolate effects thatare associated with the respondent or the item.
Taking these three factors—item, respondent and interviewer—into account, this paper inves-tigates the possibilities of using automatically captured item times (as part of the paradata fromCAI instruments) as indicators of potential problems with survey items. We consider this anexploratory analysis to investigate sources of variation at the item, respondent and interviewerlevel. In contrast with prior response time studies, which were mostly based on CATI interviewsand with few exceptions (Mayerl and Urban, 2008) focused on a small number of key items,our analyses examine all the items that were fielded in a CAPI survey.
Using CAI response time paradata from a large-scale CAPI survey, and taking advantage ofthe full hierarchical structure of the data set, we address the following questions.
(a) Are specific syntactical features of the instrument associated with longer or shorterresponse times?
(b) Do item-specific results found in previous studies hold when controlling for the set ofrespondents answering such items? And, in controlling for items and interviewers, can wereplicate the findings about respondent characteristics and response times found in theCATI literature?
(c) Is there a unique interviewer contribution to question administration time? And, if so, towhat extent can this contribution be explained through interviewer characteristics?
Our goal is a set of exploratory analyses to identify the utility of item level times captured fromparadata to gain insight into the process of administering survey questions, and to identify—andto attempt to account for—variation in times across items, respondents and interviewers. Usinga process-control-oriented framework, the results of this research can help to identify potentiallyproblematic questions or types of questions, to obtain more precise estimates of questionnairelength and to identify interviewers who may be having difficulty with the instrument (i.e. slow),administering the items too fast, or even not administering them at all (i.e. implausibly fast).
2. Sources of data and variables
The data that we analyse are from cycle 6 of the National Survey of Family Growth (NSFG) thatwas conducted in 2002–2003 (see Lepkowski et al. (2006)). The survey is based on a nationalprobability sample of women and men 15–44 years of age. Different instruments are used forfemale and male respondents. Fieldwork was carried out by the University of Michigan’s SurveyResearch Center. In-person interviews were conducted by female interviewers using CAPI. Atthe end of the interview, audio computer-assisted self-interviewing (ACASI) was used for themost sensitive questions. The interviewer provided the respondent with a headset and turned the

274 M. P. Couper and F. Kreuter
laptop around so that the respondent could hear and answer the questions directly without theinterviewer observing the respondent’s answers.
The NSFG cycle 6 was designed as a multiphase survey, using responsive design to reducenon-response bias (Groves and Heeringa, 2006). Across all three phases a response rate of 79%for females and 78% for males was achieved. A total of 12571 respondents—7643 females and4928 males—were interviewed (Lepkowski et al., 2006).
The questionnaire contained up to 11 different topical sections, including items about preg-nancies, cohabitations, contraception, attitudinal questions towards parenthood, health insur-ance and related topics. The average total interview time was 80 min for females and 60 min formales. The average time for the ACASI portion was 20 min. Full documentation of the surveyand questionnaires can be found at http://www.cdc.gov/nchs/nsfg/nsfg-cycle6.htm.
Earlier analyses of NSFG response times focused on the ACASI component (see Couper et al.(2009)) which contains roughly a 10th of all items in the questionnaire. In the present analyseswe focus on the full survey instrument, including an indicator for the two response modes, CAPIand ACASI. Given that the questionnaires for men and women are quite different, we analysethe data separately by gender.
Both the CAPI and the ACASI portions of the survey were administered using Blaise, whichis a CAI system and survey processing tool developed by Statistics Netherlands. Blaise, likeother CAI packages, produces trace or audit trail files that capture the time that an interviewerentered and exited each input field or item (Hansen and Marvin, 2001). In addition to the Blaiseaudit trails, the Blaise data model contains information on the items (fields) in the instrumentand their interrelationships (rules) in a text file that can be electronically parsed (see StatisticsNetherlands (2002)). From this file we automatically generate item level characteristics that mayaffect response times.
2.1. Description of variables and sources of dataWe merged data from four different sources:
(a) the paradata, extracted from the Blaise files,(b) characteristics of the items, extracted from the Blaise data model,(c) respondent characteristics from the interview data sets and(d) interviewer characteristics from a questionnaire administered to all interviewers working
on the project.
The distributions of variables that were included in the final multilevel models from each ofthese sources are listed in Table 1.
The main goal of our exploratory study was to compare the explanatory power of automat-ically derived question characteristics from the Blaise audit trails and Blaise instrument. Thuswe created a set of field level variables, extracted from the Blaise instrument by using an auto-mated SAS script. Each of these characteristics is hypothesized to influence the response time.The field type variable identifies four different types of response that are permissible in Blaise.Fixed choice questions are those where one response is selected from a list (for example yes–noquestions), as opposed to questions where multiple responses are possible (e.g. ‘Does (NAME)have a physical disability, an emotional disturbance, or mental retardation?’), those that allowfor a numeric answer (e.g. ‘How old were you when you had your first menstrual period?’) andquestions with open answers. Although these simplified categorizations do not capture ques-tion types as well as manual coding would, they do reflect different cognitive processes that are

Using Paradata to Explore Item Level Response Times 275
Table 1. Summary of field, respondent and interviewer variables used in the final multilevel models
Variable Description Females Males(% of fields) (% of fields)
Field characteristicsWord count Number of words in field (including interviewer Mean: 36.3 Mean: 28.9
instructions, but excluding fills)Field type 1, fixed choice (single response) 58.9 69.3
2, integer 26.9 17.33, multiple response 7.8 3.94, open 6.4 9.5
Field sequence number Counter for where the item was asked in each Mean: 302 Mean: 172interview, (1, 1st question; 2, 2nd, etc.)
ACASI 1, ACASI (self administered) 24.4 38.40, CAPI (interviewer administered) 75.6 61.6
Flag: interviewer instruction 1, interviewer instruction 69.3 57.60, no interviewer instruction 30.7 42.4
Flag: fill 1, field contains fill text 49.3 38.30, field does not contain fill text 50.7 61.7
Flag: show card 1, show card for field 12.9 14.10, no show card 87.1 85.9
Flag: help 1, question help available 24.5 25.80, no question help available 75.5 74.2
Respondent characteristics% of respondents
Race 1, black 21.8 20.42, other 9.1 12.33, white 21.8 67.3
Marital status 1, married 39.5 24.82, cohabiting 9.8 8.23, separated, or widowed or divorced 11.9 9.24, never married 38.8 57.8
Education 1, less than high school 22.6 28.02, high school 28.6 30.73, some college 28.6 25.04, college graduate 20.0 16.2
Language of interview 1, English 93.0 92.40, Spanish 7.0 7.6
Interviewer characteristics% of interviewers
Education 0, unknown 4.1 4.11, high school or less 40.1 39.62, college 40.1 40.13, graduate school 15.7 16.2
Spanish speaker 1, speaks Spanish 24.4 25.00, does not speak Spanish 75.6 75.0
Race 0, unknown 3.1 3.11, black 25.9 25.52, other 3.6 3.73, white 67.5 67.7
Prior CAI experience 1, yes 46.7 46.40, no 53.3 53.6
necessary to derive answers (i.e. numeric recall or the judgement of which answer category bestfits the desired answer; see Tourangeau et al. (2000)). We expect all three closed question formatsto be answered faster than open questions, and fixed choice questions to be answered faster thanthose with multiple-response categories. We also expect items requiring numeric responses totake longer than fixed choice questions given the likely recall task that is involved.
276 M. P. Couper and F. Kreuter
The field sequence number does not reflect the position of a particular question in the ques-tionnaire but the actual number of questions answered by the respondent up to that particularfield. Unlike the position of an item in the questionnaire this indicator matches the respon-dent’s experience given the varying number of conditional questions and loops (e.g. a seriesof questions for each pregnancy or partner) that are asked of each respondent. The mean fieldsequence number in Table 1 clearly shows the difference in length (the number of items) betweenthe female and male interviews.
Because reading and listening time are part of our time measure, the word count serves asan important control. A specific word count is difficult for questions that contain fill text—i.e.customized wording based on prior answers or respondent characteristics. Given that these varyacross respondents, we could not derive the length of the fills for each item as administered toeach respondent. Thus, the fill flag serves as a proxy measure for the additional text containedin fills.
Interviewer instructions and show cards both indicate actions that are needed to be taken bythe interviewer. Although show cards add reading time (for the show card), interviewer instruc-tions may be read in early administrations of the survey but used less as the interviewer becomesmore familiar with the instrument.
Information on respondent characteristics was added from the NSFG cycle 6 questionnaireitself. Although the questionnaire contains plenty of data, we restricted ourselves to variablesthat were previously found to be related to response times. Respondents’ age is correlated withcognitive decline and reduced working memory capacity (see Salthouse (1991) and Schwarzet al. (1999)). Respondents’ education has been found to influence response times, with reducedtimes for more educated people (Salthouse, 1991; Yan and Tourangeau, 2008). Interviews thatwere conducted in Spanish have been found to take longer than those conducted in English (e.g.Wells et al. (2010)), so we use this rather than whether the respondent is of Hispanic origin.Marital status was added as a control, because of its close substantive relation to many of theNSFG questions.
Less is known about the effect of interviewer characteristics on response times. Similarly tothe respondent characteristics, we expect age and education to play a role in the question admin-istration speed. Similarly, we expect interviewer experience to be associated with response times,with more experienced interviewers being faster in administering the questionnaire (see Olsonand Peytchev (2007)), reflecting familiarity with the task of administering survey questions ona computer. We had measures of both general interviewing experience and specific experiencewith CAI. Given that these variables are strongly correlated, preliminary analysis (which is notshown) led us to pick the latter for subsequent analyses.
We explore several interactions, e.g. to see whether respondent and interviewer educationor age might interact in affecting item level times. Similarly we examine interactions betweeninterviewer experience and field types, with the expectation that more experienced interviewersmay have less difficulty with longer or more complex questions (e.g. those involving fills orinterviewer instructions).
Our dependent variable measures the time that is spent on each field in the questionnaire.Time measures are recorded in milliseconds in the Blaise audit trails. To increase readability wereport time in seconds. We report unadjusted measures of time without controlling for base-line speed, as is done in many response time studies. For one, the NSFG does not begin witha common set of questions asked of all respondents. Furthermore, in our statistical models wecompare average response times for different items and are interested in identifying items withunusual performance rather than identifying respondents with unusual response times. Typicalrespondent features that affect baseline response time are captured through the demographic

Using Paradata to Explore Item Level Response Times 277
characteristics that were discussed above. The interviewer contribution to any variation in base-line speed is captured through a separate variance component, which we describe in Section 3.
2.2. Data preparationA variety of data cleaning and exclusion activities were undertaken before the analysis. First,fields with unusually low and unusually high response times were removed from the analysis.Specifically, we removed fields with a response time that was shorter than 1s, given that it is notpossible to administer a question in that short a time. As is common in response time analyses,fields with response times that are greater than 2 standard deviations above the mean (morethan 172 s), based on combined analyses for females and males, were also removed.
Second, missing data were present at all three levels. Most of the missing data are due tothe lack of interviewer information. Over 260 interviewers were asked to complete and returna questionnaire after training, but not all did so. Among 256 interviewers who conducted atleast one female interview, 54 did not complete the interviewer questionnaire (representingabout 19.7% of the total fields). Five interviewers completed only one interview and were alsoexcluded from the analyses to avoid confounding with respondent characteristics. Among 248interviewers completing at least one male questionnaire, 47 did not complete the interviewerquestionnaire (representing 19.1% of the fields), and a further 11 completed only one interview.The field level and respondent level models did not differ on the basis of these exclusions, so weremoved the cases without interviewer information from all models described below, to facilitatecomparison of effects across models. On the respondent level we also lost some cases because ofitem missing data on some of the respondent covariates. A small number of completed interviewcases did not have complete Blaise files. These were also excluded from our analyses, as werepartial interviews (breakoffs).
Finally, we excluded for conceptual reasons fields that contained no questions (i.e. items forinterviewer review or verification) and the household roster items (section A of the survey).
With all of these exclusions, the number of fields that were used in the analysis drops from2.97 million for females and 1.25 million for males to 2.2 million and 870000 respectively. Table2 shows the final count of observations that were used in subsequent analyses.
As is implied by Table 2, there is a hierarchy of observations, with items nested within respon-dents, and respondents nested within interviewers. A single interview contains an average of 354
Table 2. Number of observations available for responsetime analysis
Results for Resultsfemales for males
Number of fields (items) 2155499 872500Number of respondents 6096 3953Number of interviewers 197 192Fields (items) per respondent
Mean 353.59 220.72Minimum 7 29Maximum 755 391
Respondents per interviewerMean 30.94 20.59Minimum 1 1Maximum 147 103
278 M. P. Couper and F. Kreuter
fields for the females file and 221 for the males file. The variation in the number of items perrespondent is due to different filtering through the questionnaire.
3. Analysis methods
Unweighted multilevel linear mixed models (see West et al. (2007)) are used to explore theeffect of the field indicators on response times. Such multilevel models allow for correlationin response times for items answered by the same respondent and respondents interviewed bythe same interviewer. Failure to account for such clustering would probably underestimate thestandard errors and bias inference that is made from the analyses. Furthermore, the multilevelmodels allow us to examine and control for the contribution of respondent and interviewercharacteristics on response times. Our goal is to uncover and explore systematic variation incompletion time that can be accounted for by characteristics of these three sources.
We first fit two (one for females and one for males) random-intercept-only models (null mod-els), not including any covariates, to ascertain the proportion of variance that is accounted forby each of the levels in the hierarchy. The model can be specified as
yijk =β0 +μk +μjk + "ijk, .1/
where yijk is the field time (expressed in seconds) for item i nested within respondent j inter-viewed by interviewer k, μk is the random effect that is associated with the interviewer, μjk isthe random effect that is associated with the respondent and "ijk is the residual variability thatis associated with each item i, again nested within respondent j interviewed by interviewer k.Again, all random effects are assumed to follow a normal distribution with ujk ∼N(0, σ2
u/ and"ijk ∼N(0, σ2
" /.Using this, we estimate the intraclass correlation coefficient for each level of the model, as
follows:
ICCk = σ2k
σ2k +σ2
jk +σ2ijk
for interviewers and
ICCjk = σ2k +σ2
jk
σ2k +σ2
jk +σ2ijk
for respondents, where σ2k is the variance of the random effects that are associated with inter-
viewers, σ2jk is the variance that is associated with respondents and σ2
ijk the variance that isassociated with items. ICCk is an estimate of the unexplained (random) variation in responsetime at the interviewer level, and ICCjk is an estimate of the proportion of unexplained variationat the respondent level.
To explore the sources of this variation in more detail, we then fit three successive modelsfor each of the females and males data sets, first examining field characteristics then addingrespondent characteristics and finally adding interviewer characteristics. The full model can beexpressed as
yijk =β0 +β1xijk +β2vjk +β3zk +μk +μjk + "ijk, .2/
where xijk are a vector of covariates at the field level, vjk are respondent level covariates and zk
are interviewer level covariates.

Using Paradata to Explore Item Level Response Times 279
It should be noted that NSFG interviewers are largely assigned to a single primary samplingunit. Therefore variation at the interviewer level could also be interpreted as variation at thearea level. Given that we control for respondent characteristics it is difficult to imagine whicharea level features—beyond the distinct composition of respondents within an area—wouldinfluence the response time. We thus interpret variation at the interviewer level as interviewereffects although some of this may be area level effects. We return to this point later.
All models were fitted by using the PROC MIXED procedure in SAS. Using restricted maxi-mum likelihood estimation and maximum likelihood estimation yielded equivalent results (seeWest et al. (2007)). We present results of estimated coefficients by using the latter method. We usethe Akaike information criterion (AIC) and the log-likelihood ratio tests for model comparison(McLachlan and Peel, 2000).
4. Results
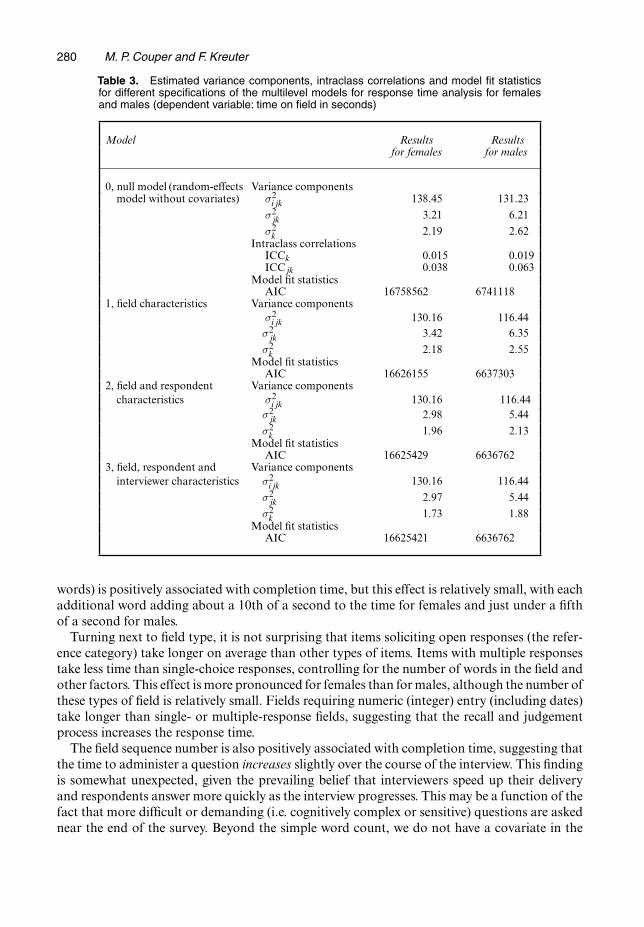
4.1. Model fit and estimated random effectsThe results of various specifications of random-intercept models without and with covari-ates (estimated random-effect components, intraclass correlations and model fit statistics) arepresented in Table 3. From the intraclass correlations, it can be seen that interviewers contributeabout 1.5% of the variation and respondents about 3.8% of the variation in the females model,with the corresponding values for the males model being 1.9% and 6.3% respectively. The intr-aclass correlations in Table 3 suggest that most of the variation (96% for females and 94% formales) is at the individual field or item level, with respondents and interviewers accounting formodest amounts of the variation in field times.
Also presented in Table 3 are the AIC values as a measure of goodness of fit for each successivemodel. Reductions in the AIC show improvements in model fit. Examining the Bayes informa-tion criterion or log-likelihoods of the models (which are not shown) yields similar conclusions.Adding a set of fixed effects for field characteristics (see model 1) accounts for about 6% of thevariation at the field level for females and about 11% for males (comparing σ2
ijk for model 1 withσ2
ijk for model 0). Likelihood ratio tests reveal that the addition of these covariates producesstatistically significant .p< 0:0001/ improvements in model fit.
Model 2 adds a set of respondent level fixed effects. As can be seen from Table 3, these vari-ables again account for a modest proportion of the variation at the respondent level (about 13%for females and about 14% for males). However, given the large number of cases, the model fitis significantly .p< 0:0001/ improved over model 1 for both females and males.
Finally we add a set of interviewer level fixed effects to the models. Here the reductions inthe residual interviewer level variance are modest, implying that not much of the variationdue to interviewers is explained by the interviewer level variables. The likelihood ratio testsfor the addition of these fixed effects are significant for females .p= 0:0065/ but not for males.p=0:082/.
An examination of the coefficients for the fixed effects across the nested models reveals littlechange in values with the addition of the respondent and interviewer level effects. We thus pre-sent estimated coefficients for only the two final models, including covariates at all three levels(Table 4). We describe the effects of each set of variables below.
4.2. Item or field characteristicsGiven the large number of observations, it is not surprising that all field level variables reachstatistical significance in both the females and males models. Looking at the item level pre-dictors, we can see from Table 4 that the length of the question (measured in the number of
280 M. P. Couper and F. Kreuter
Table 3. Estimated variance components, intraclass correlations and model fit statisticsfor different specifications of the multilevel models for response time analysis for femalesand males (dependent variable: time on field in seconds)
Model Results Resultsfor females for males
0, null model (random-effects Variance componentsmodel without covariates) σ2
ijk 138.45 131.23
σ2jk 3.21 6.21
σ2k 2.19 2.62
Intraclass correlationsICCk 0.015 0.019ICCjk 0.038 0.063
Model fit statisticsAIC 16758562 6741118
1, field characteristics Variance componentsσ2
ijk 130.16 116.44σ2
jk 3.42 6.35
σ2k 2.18 2.55
Model fit statisticsAIC 16626155 6637303
2, field and respondent Variance componentscharacteristics σ2
ijk 130.16 116.44σ2
jk 2.98 5.44
σ2k 1.96 2.13
Model fit statisticsAIC 16625429 6636762
3, field, respondent and Variance componentsinterviewer characteristics σ2
ijk 130.16 116.44
σ2jk 2.97 5.44
σ2k 1.73 1.88
Model fit statisticsAIC 16625421 6636762
words) is positively associated with completion time, but this effect is relatively small, with eachadditional word adding about a 10th of a second to the time for females and just under a fifthof a second for males.
Turning next to field type, it is not surprising that items soliciting open responses (the refer-ence category) take longer on average than other types of items. Items with multiple responsestake less time than single-choice responses, controlling for the number of words in the field andother factors. This effect is more pronounced for females than for males, although the number ofthese types of field is relatively small. Fields requiring numeric (integer) entry (including dates)take longer than single- or multiple-response fields, suggesting that the recall and judgementprocess increases the response time.
The field sequence number is also positively associated with completion time, suggesting thatthe time to administer a question increases slightly over the course of the interview. This findingis somewhat unexpected, given the prevailing belief that interviewers speed up their deliveryand respondents answer more quickly as the interview progresses. This may be a function of thefact that more difficult or demanding (i.e. cognitively complex or sensitive) questions are askednear the end of the survey. Beyond the simple word count, we do not have a covariate in the

Using Paradata to Explore Item Level Response Times 281
Table 4. Estimated final multilevel models for females and males including field, respondentand interviewer characteristics (dependent variable: time on field in seconds)
Effect Results for females Results for males
Estimate Standard Estimate Standarderror error
Intercept 8.08† 0.55 5.81† 0.65
Field or item characteristicsWord count 0.089† 0.00033 0.17† 0.00065Field type
Fixed choice −2:67† 0.034 −0:32† 0.042Integer −1:98† 0.037 −0:38† 0.050Multiple response −6:41† 0.047 −0:88† 0.080Open — — — —
Field sequence number 0.0030† 0.000060 0.0046† 0.00026ACASI −0:78† 0.028 −2:57† 0.045Flag: instruction −1:02† 0.025 −1:30† 0.035Flag: fill 0.42† 0.017 −0:32† 0.026Flag: show card 6.12† 0.026 4.46† 0.042Flag: help 0.51† 0.021 0.78† 0.034
Respondent characteristicsRace
Black 0.12† 0.070 0.47† 0.11Other 0.49‡ 0.087 0.81† 0.13White — — — —
Marital statusMarried −0:17‡ 0.066 −0:37‡ 0.11Cohabiting −0:25‡ 0.088 −0:48‡ 0.15Formerly married −0:31† 0.089 −0:41‡ 0.16Never married — — — —
EducationLess than high school 1.43† 0.084 2.12† 0.14High school graduate 0.71† 0.072 1.03† 0.13Some college 0.31† 0.071 0.43† 0.13College graduate — — — —
Age 0.021† 0.0036 0.061† 0.0059Language of interview (1, English) −1:81† 0.12 −2:13† 0.19
Interviewer characteristicsEducation
Unknown 0.27 0.58 0.81 0.64High school graduate −0.18 0.31 −0.12 0.34College graduate −0.49 0.30 −0.49 0.33Graduate school — — — —
Spanish speaker (1, yes) 0.55§ 0.25 0.77‡ 0.28Age 0.031† 0.0087 0.016 0.010Race
Unknown −0.11 0.57 −0.046 0.65Black 0.11 0.25 −0.064 0.29Other −0.00051 0.57 0.52 0.65White — — — —
CAI experience (1, yes) −0:61‡ 0.21 −0.36 0.24
†p< 0:001.‡p< 0:01.§p< 0:05.
282 M. P. Couper and F. Kreuter
set of automatically derived item features that reflects the difficulty or sensitivity of an item. Asa proxy for item content, we tested models with indicators for each of the sections (thematicgroupings of items), rather than a linear measure of field sequence. Those models (which arenot shown) also suggest considerable variation in response times across sections but do notmarkedly improve the fit over the models in Table 4.
It is also interesting to note that the self-administered ACASI items take less time (on average)to complete than the interviewer-administered items. The pace of the recorded ACASI voice filesis fixed and is likely to be slower than the interviewers’ pace (given that encouraging interviewersto slow down delivery is often emphasized in training). This suggests that respondents are notmaking full use of the audio files and are answering before the entire question has been read(see Couper et al. (2009)).
The remaining variables in Table 4 are flags for characteristics of questions that affect theresponse time. First, items containing interviewer instructions take less time on average thanthose that do not. This is somewhat surprising, as we expected that the presence of instructionsindicated a more complex question or the need for further probing by the interviewer. This mayalso suggest that the interviewers may not be reading the instructions as intended.
As noted earlier, we created a flag for questions containing fills (customized question text) aswe could not calculate the exact number of words for each question tailored to an individualrespondent. Questions with fills take longer to administer than those without fills for females,but the opposite effect is found for males. One post hoc explanation is that the fills that areused for the male instrument are less complex than those for the female instrument, but thisdeserves further investigation. It may be that the type of fill (e.g. a specific date, a name or otherpreviously reported information) may affect delivery time in different ways.
As we expected, questions with show cards take significantly longer to deliver (6 s on averagefor females and 4.5 s on average for males). These tend to be longer, more complex questions,but this effect is controlling for the length of the question. This suggests that show cards arebeing used as designed, with respondents taking the time to review the answers that are provided.Finally, fields with question-by-question help take about half a second longer to administer thanthose without such help. We do not have an indicator for whether the help screen was actuallyaccessed, but evidence from other studies suggests that the use of such help by interviewers isquite rare (e.g. Couper et al. (1997a)). This is another area for further exploration.
4.3. Respondent characteristicsThe next set of variables in the models in Table 4 is respondent characteristics. We have alreadynoted that the item level coefficients show little change with the addition of respondent andinterviewer level effects. Our interest here is whether there is systematic variation in administra-tion time by respondent characteristics, controlling for characteristics of the items.
We see that respondent race is significantly associated with response time, with minoritiestaking more time to answer than white respondents. Marital status is also significant for bothfemales and males, with those who are never married taking longer than those who are currentlyor formerly married (controlling for age). This is somewhat surprising, as the latter groups arelikely to have more complex family circumstances (which in turn would lead to a larger numberof complex recall questions).
The findings for education and age are consistent with those reported by Yan and Tourangeau(2008) and support their hypothesis related to cognitive capacity. Older people and those withless education take longer to answer comparable questions than those who are younger or bettereducated. Similar results were reported by Couper et al. (2009) for the ACASI items.
Finally, the significant association of language of interview with time is consistent with the

Using Paradata to Explore Item Level Response Times 283
findings that have been reported elsewhere (e.g. Wells et al. (2010)). Surveys that are adminis-tered in Spanish take longer than those administered in English, in part because it takes morewords to express the same ideas in Spanish than in English. Our word count variable is basedon the English version of the instrument. We also tested a variable for whether the respondentidentified as Hispanic or not. This was significantly associated with time but is highly correlatedwith the language of the interview, which is a more powerful predictor of time.
4.4. Interviewer characteristicsThe final set of covariates in Table 4 relates to interviewer characteristics. As noted earlier,interviewers account for a relatively small proportion of the overall variation in response times,and adding fixed effects at the interviewer level does not explain much of this variation. Thissuggests that interviewers are having relatively little influence on completion times. We find thatinterviewers’ education is not significantly related to completion time. In part this may reflectthe fact that there is less variation in interviewers’ education than in respondents’ education.Interviewers who speak Spanish take about half a second longer to administer each item (con-trolling for language of the interview). Interviewers’ age is associated with longer response timesfor female respondents but not for males (remember that all NSFG interviewers are female).The interviewer’s race has no significant association with time for either females or males. Inter-viewers with prior CAI experience take less time on average (about 0.6 s) to administer thefemale instrument. The effect of CAI experience is in the same direction for males but does notreach significance.
4.5. InteractionsWe explored several cross-level interactions (the results are not shown) but found few note-worthy effects. For example, respondent and interviewer education did not significantly inter-act in affecting response times (p = 0.42 for females and p = 0.35 for males). Similarly,the interactions of interviewer and respondent age on completion times were not significant(p = 0.31 for females and p = 0.53 for males). Several interactions of interviewer experiencewith field characteristics on response times reached significance in one model but not the other,and the effects were not readily interpretable.
5. Discussion
We have presented a set of analyses with item level time as the dependent variable, to explore theitem, respondent and interviewer level correlates of survey administration time. These analysessuggest systematic covariation of characteristics at all three levels with the time that it takes toadminister a survey item in the NSFG male and female instruments.
Our exploratory study has three major findings: first, automatically derived indicators ofitem characteristics are found to vary systematically with response time. The indicators that wecreated from the Blaise audit trail files predominantly captured syntactical features of surveyitems, e.g. the presence of fills and show cards, the available answer categories and word counts.Despite this, much of the variation in item level times remains unaccounted for.
Second, the results that are presented here for observational data from a large-scale produc-tion survey replicate findings on respondent characteristics and response times that have beenfound in prior (mostly CATI) studies, which were explicitly designed to study response timesor in which response time measures were taken in a much more controlled way (e.g. explicitlytimed by the interviewer).
Third, NSFG interviewers also appear to contribute independently to the completion times,

284 M. P. Couper and F. Kreuter
although their measured demographic characteristics and experience explain only a small frac-tion of the interviewer variance component. The NSFG design does not allow us statisticallyto separate interviewer and area effects; thus part of the unexplained higher level variancecomponents could be due to area effects.
Unfortunately the reliance in this study on item level characteristics that could be automat-ically derived from the CAPI questionnaire script limits the number of covariates on the itemlevel available for analysis. Information about the content and nature of the questions asked weretherefore not included in the models. Features such as the complexity of a question, length ofrecall periods or the sensitivity of particular items are known to affect response times. Such indi-cators, however, require human judgement or content analysis of the question text or respondentanswers. Our goal here was to use automatically generated data that can be readily availablewithout manual coding. Some respondent characteristics can serve as a proxy for some of theseitem features. For example, in the NSFG case, information on time since pregnancy could serveas a proxy for recall challenges in reporting details about that pregnancy. For the present anal-ysis, only a limited number of respondent characteristics was available. In their absence there isno straightforward way to take the different filtering rules into account that probably resultedin differences with respect to the sensitivity and complexity of the questions asked.
Future work will need to explore the issue of why the presence of interviewer instructions isassociated with faster completion times. To do so, it will be necessary to augment the automat-ically derived indicators with substantive information about the nature of the questions thatare typically paired with interviewer instructions. Similarly, the finding that items with fills takemore time to administer for females but less time for males needs to be examined further. Theassociation of respondent race and marital status with completion time also suggests that theremay be unmeasured item level covariates that need to be explored. Specifically, with regard tomarital status, it may be that different respondents are being asked different questions basedon marital status, and the differences between these items are not captured in our item levelvariables.
Despite the limitations in the set of automatically generated item features and some unan-swered questions regarding the effect of the substantive nature of the survey questions, thereplication of known effects with this large field-based data set provides encouragement forthose who are interested in a more process-control-oriented approach to survey research. Inaddition to using these data to explore which features of the instrument, respondents and inter-viewers are associated with response time, residuals from these models could be used to identifyitems, respondents or interviewers who take much more (or less) time than expected (e.g. 2 stan-dard deviations below the mean) and to investigate these cases further. The utility of these kindsof analyses for survey design and management lies in using the paradata to identify cases (items,respondents and interviewers) that are outliers efficiently (‘out of control’ in the statistical pro-cess control perspective), and targeting more expensive evaluation methods (such as coding andanalysing digital recordings, conducting reinterviews and conducting laboratory-based or fieldexperiments) at those cases. Items that behave in unexpected ways (i.e. take significantly less timeor more time than expected, given their nature) could be subject to behaviour coding or cognitivelaboratory testing. Respondents or interviews that are outliers could be subject to further dataquality evaluations or verification that the prescribed protocol was followed. Similarly, inter-viewers who perform above or below control limits could have their work more carefully exam-ined, potentially identifying falsified interviews or the need for retraining.
Likewise, if such models are fitted throughout the data collection period, and incoming dataare compared with predicted values and expected distributions, interviewers could receive analert when administering an item above or below certain time thresholds. For example, such

Using Paradata to Explore Item Level Response Times 285
alerts could help to prevent question deliveries that are too fast (given the age of the respectiverespondent), thereby indirectly reducing measurement error. Experimental research on usingsuch interventions in the context of self-administered questionnaires has shown promising re-sults (Conrad et al., 2005); similar experimental research is needed for interviewer-administeredsurveys.
The overall goal is to find ways to use existing data and paradata in an efficient manner tohelp to evaluate and improve the quality of survey data collection. This work represents onestep in that direction.
Acknowledgements
The 2002 NSFG was carried out under a contract with the Centers for Disease Control andPrevention’s National Center for Health Statistics (contract 200-2000-07001, Robert Groves,Project Director). We thank John van Hoewyk and Pat Berglund for assistance with the anal-yses. We also thank William D. Mosher for his review and comments on an earlier draft of thepaper, and Gabriele Durrant, Stephanie Eckman and the reviewers for their helpful comments.
References
Ajzen, I., Nichols, A. J. and Driver, B. C. (1995) Identifying salient beliefs about leisure activities: frequency ofelicitation versus response latency. J. Appl. Socl Psychol., 25, 1391–1410.
Bassili, J. N. (1996) The how and the why of response latency measurement in telephone surveys. In AnsweringQuestions: Methodology for Determining Cognitive and Communicative Processes in Survey Research (eds N.Schwarz and S. Sudman), pp. 319–346. San Francisco: Jossey-Bass.
Bassili, J. N. (2003) The minority slowness effect: subtle inhibitions in the expression of views not shared by others.J. Personlty Socl Psychol., 84, 261–276.
Bassili, J.N. and Krosnick, J. A. (2000) Do strength-related attitude properties determine susceptibility to responseeffects?: new evidence from response latency, attitude extremity, and aggregate indices. Polit. Psychol., 21, 107–132.
Bassili, J. N. and Scott, B. S. (1996) Response latency as a signal to question problems in survey research. Publ.Opin. Q., 60, 390–399.
Cannell, C. F., Miller, P. V. and Oksenberg, L. (1981) Research on interviewing techniques. In Sociological Meth-odology (ed. S. Leinhardt), pp. 389–437. San Francisco: Jossey-Bass.
Caspar, R. A. and Couper, M. P. (1997) Using keystroke files to assess respondent difficulties with an ACASIinstrument. Proc. Surv. Res. Meth. Sect. Am. Statist. Ass., 239–244.
Conrad, F., Broome, J., Benki, J., Groves, R., Kreuter, F. and Vannette, D. (2010) To agree or not to agree?:impact of interview speech and survey participation decisions. In Proc. Jt Statist. Meet. American StatisticalAssociation, pp. 5979–5993. Alexandria: American Statistical Association.
Conrad, F., Couper, M., Tourangeau, R. and Galesic, M. (2005) Interactive feedback can improve the quality ofresponses in web surveys. Proc. Surv. Res. Meth. Sect. Am. Statist. Ass., 3835–3840.
Couper, M. P. (1998) Measuring survey quality in a CASIC environment. Jt Statist. Meet. American StatisticalAssociation, Dallas, Aug.
Couper, M. P., Hansen, S. E. and Sadosky, S. A. (1997a) Evaluating interviewer performance in a CAPI survey.In Survey Measurement and Process Quality (eds L. Lyberg, P. Biemer, M. Collins, E. de Leeuw, C. Dippo, N.Schwarz and D. Trewin), pp. 267–285. New York: Wiley.
Couper, M. P., Horm, J. and Schlegel, J. (1997b) Using trace files to evaluate the National Health Interview SurveyCAPI instrument. Proc. Surv. Res. Meth. Sect. Am. Statist. Ass., 825–829.
Couper, M. P., Tourangeau, R. and Marvin, T. (2009) Taking the audio out of audio-CASI. Publ. Opin. Q., 73,281–303.
Draisma, S. and Dijkstra, W. (2004) Response latency and (para) linguistic expressions as indicators of responseerror. In Methods for Testing and Evaluating Survey Questionnaires (eds S. Presser, J. Rogthgeb, M. Couper, J.Lessler, E. Martin, J. Martin and E. Singer), pp. 131–147. Hoboken: Wiley.
Faust, M. E., Balota, D. A., Spieler, D. H. and Ferraro, F. R. (1999) Individual differences in information-processing rate and amount: implications for group differences in response latency. Psychol. Bull., 126, 777–799.
Fazio, R. H. (1986) How do attitudes guide behavior? In The Handbook of Motivation and Cognition: Foundationof Social Behavior (eds R. M. Sorrentino and E. T. Higgins), pp. 204–243. New York: Guilford.

286 M. P. Couper and F. Kreuter
Fazio, R. H. (1990) A practical guide to the use of response latency in social psychological research. In Reviewof Personality and Social Psychology, vol. 11, Research Methods in Personality and Social Research (eds C.Hendrick and M. S. Clark), pp. 74–97. Newbury Park: Sage.
Fazio, R. H. and Williams, C. J. (1986) Attitude accessibility as a moderator of the attitude-perception and attitudebehavior relations: an investigation of the 1984 Presidential Election. J. Personlty Socl Psychol., 51, 505–514.
Fisher, D. L. and Glaser, R. A. (1996) Molar and latent models of cognitive slowing: implications for aging,dementia, depression, development, and intelligence. Psychonom. Bull. Rev., 3, 458–480.
Groves, R. M. and Heeringa, S. G. (2006) Responsive design for household surveys: tools for actively controllingsurvey errors and costs. J. R. Statist. Soc. A, 169, 439–457.
Hansen, S. E. and Marvin, T. (2001) Reporting on item times and keystroke from Blaise audit trails. Int. BlaiseUser Group Meet., Washington DC. (Available from http://www.blaiseusers.org/2001/papers/Hansen-Marvin--IBUC-Paper-FINAL.pdf.)
Heerwegh, D. (2003) Explaining response latencies and changing answers using client-side paradata from a websurvey. Socl Sci. Comput. Rev., 21, 360–373.
Huckfeldt, R., Levine, J., Morgan, W. and Sprague, J. (1998) Election campaigns, social communication, and theaccessibility of perceived discussant preference. Polit. Behav., 20, 263–294.
Knowles, E. S. and Condon, C. A. (1999) Why people say ‘yes’: a dual-process theory of acquiescence. J. PersonltySocl Psychol., 77, 379–386.
Kreuter, F., Couper, M. P. and Lyberg, L. E. (2010) The use of paradata to monitor and manage survey data collec-tion. In Proc. Jt Statist. Meet. American Statistical Association, pp. 282–296. Alexandria: American StatisticalAssociation.
Kreuter, F. and Kohler, U. (2009) Analyzing contact sequences in call record data: potential and limitation ofsequence indicators for nonresponse adjustment in the European Social Survey. J. Off. Statist., 25, 203–226.
LaFlamme, F. (2009) Data collection research using paradata at Statistics Canada. Modernisation of StatisticsProduction Conf., Stockholm, Nov.
Lepkowski, J. M., Mosher, W. D., Davis, K. E., Groves, R. M., Van Hoewyk, J. and Willem, J. (2006) NationalSurvey of Family Growth, Cycle 6: sample design, weighting, imputation, and variance estimation. Vitl HlthStatist., 2, no. 142.
Mayerl, J., Sellke, P. and Urban, D. (2005) Analyzing cognitive processes in CATI surveys with response latencies:an empirical evaluation of the consequences of using different baseline speed measures. In Schriftenreihe desInstituts fuer Sozialwissenschaften der Universität Stuttgart, no. 2/20005.
Mayerl, J. and Urban, D. (2008) Antwortreaktionszeiten in Survey-Analysen. Wiesbaden: Verlag für Sozialwis-senschaften.
McLachlan, G. and Peel, D. (2000) Finite Mixture Models. New York: Wiley.Olson, K. and Peytchev, A. (2007) Effect of interviewer experience on interview pace and interviewer attitudes.
Publ. Opin. Q., 71, 273–286.Salthouse, T. A. (1991) Theoretical Perspectives on Cognitive Aging. Hillsdale: Erlbaum.Schaeffer, N. C. and Maynard, D. M. (2006) Sounds of silence: response latency in cognitive assessments. A. Meet.
American Association for Public Opinion Research, Montreal, May 18th–21st.Schwarz, N., Park, D., Knäuper, B. and Sudman, S. (1999) Cognition, Aging, and Self-reports. Washington DC:
Psychology Press.Smith, E. E. (1968) Choice reaction time: an analysis of major theoretical positions. Psychol. Bull., 69, 77–110.Smith, E. R., Fazio, R. H. and Ceijka, M. A. (1996) Accessible attitudes influence categorization of multiply
categorizable objects. J. Personlty Socl Psychol., 71, 888–898.Smith, E. R., and Lerner, M. (1986) Development of automatism of social judgments. J. Personlty Socl Psychol.,
50, 246–259.Statistics Netherlands (2002) Blaise Developer’s Guide. Heerlen: Statistics Netherlands.Stern, M. J. (2008) The use of client-side paradata in analyzing the effects of visual layout on changing responses
in web surveys. Fld Meth., 20, 377–398.Tourangeau, R. (1992) Context effects on responses to attitude questions: attitudes as memory structures. In
Context Effects in Social and Psychological Research (eds N. Schwarz and S. Sudman), pp. 35–47. New York:Springer.
Tourangeau, R., Rips, L. and Rasinski, K. (2000) The Psychology of Survey Response. Cambridge: CambridgeUniversity Press.
Wagner-Menghin, M. M. (2002) Towards the identification of non-scalable personality questionnaire respondents:taking response time into account. Psychol. Beitr., 44, 62–77.
Wells, T., Vidalon, M. and DiSogra, C. (2010) Differences in length of survey administration between Spanish-language and English-language survey respondents. Proc. Surv. Res. Meth. Sec. Am. Statist. Ass., 6186–6191.
West, B. T., Welch, K. B. and Galecki, A. T. (2007) Linear Mixed Models; a Practical Guide using StatisticalSoftware. Boca Raton: Chapman and Hall.
Yan, T. and Tourangeau, R. (2008) Fast times and easy questions: the effects of age, experience and questioncomplexity on web survey response times. Appl. Cogn. Psychol., 22, 51–68.


