Using ODR Data for Decision Making
64
Using ODR Data for Decision Making Rob Horner, George Sugai, Anne Todd, Teri Lewis- Palmer Marilyn Nersesian, Jim Watson
-
Upload
lucas-oliver -
Category
Documents
-
view
25 -
download
0
description
Using ODR Data for Decision Making. Rob Horner, George Sugai, Anne Todd, Teri Lewis-Palmer Marilyn Nersesian, Jim Watson. Goals. Define sources of data related to student problem behavior Define a process for initial use of data for active problem solving. Build fluency. Assumptions. - PowerPoint PPT Presentation
Transcript of Using ODR Data for Decision Making
Using ODR Data for Decision Making
Rob Horner, George Sugai,
Anne Todd, Teri Lewis-Palmer Marilyn Nersesian, Jim Watson
Goals
Define sources of data related to student problem behavior
Define a process for initial use of data for active problem solving.
Build fluency
Assumptions
School has team focused on school-wide behavior support.
Team has an action plan Team meets regularly (weekly, every two
weeks) Team has access to information about
student behavior
Why Collect Discipline Information?
Decision making Professional Accountability Decisions made with data (information)
are more likely to be (a) implemented, and (b) effective
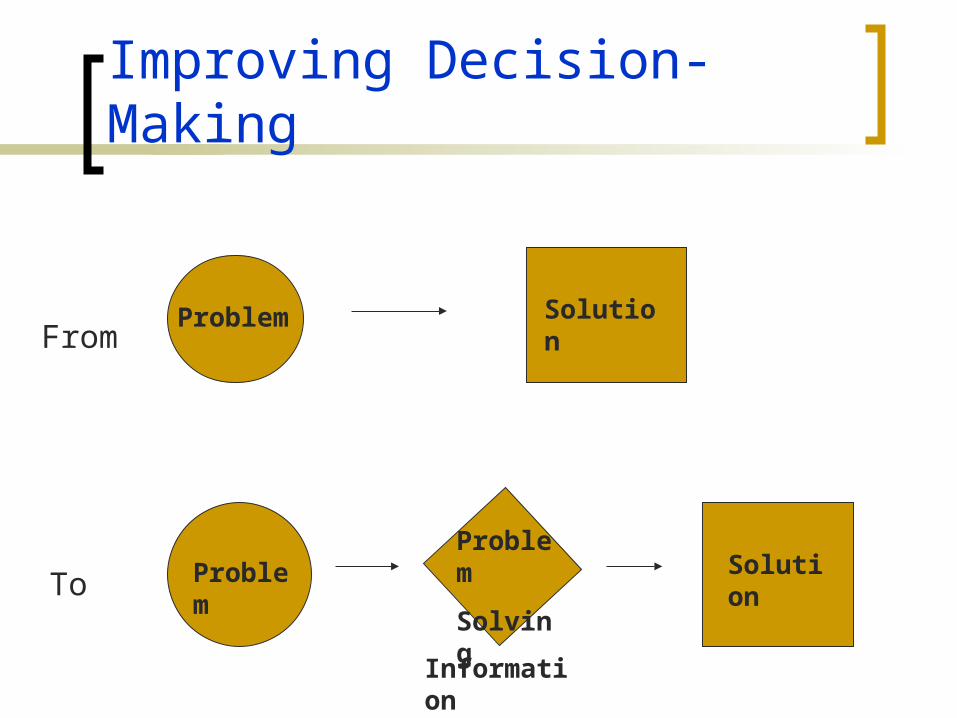
Improving Decision-Making
Problem SolutionFrom
To ProblemProblem
SolvingSolution
Information
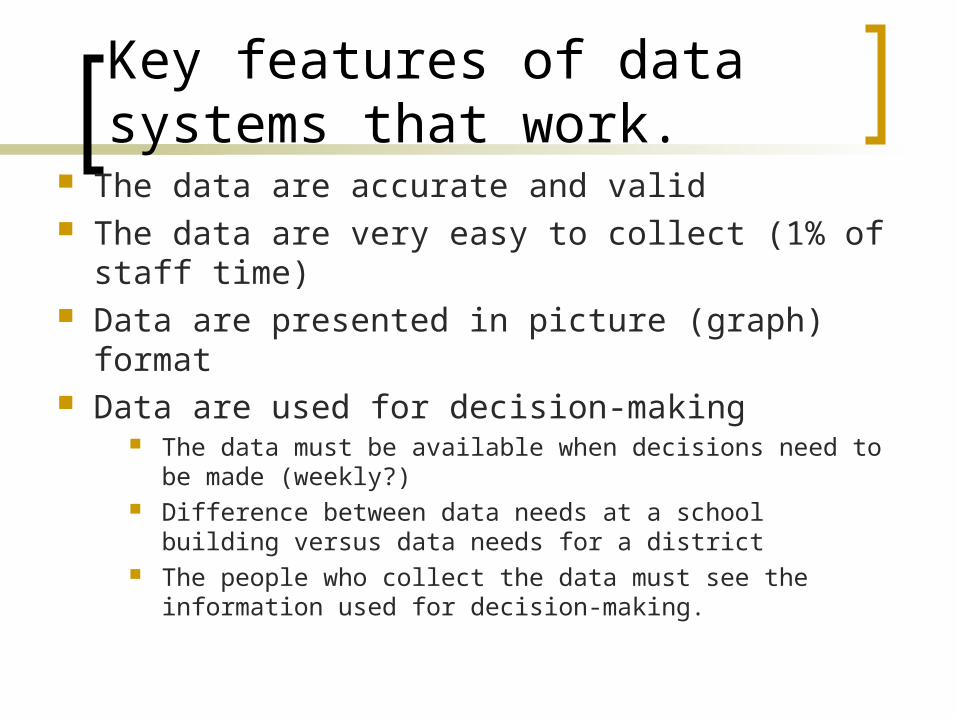
Key features of data systems that work.
The data are accurate and valid The data are very easy to collect (1% of staff time) Data are presented in picture (graph) format Data are used for decision-making
The data must be available when decisions need to be made (weekly?)
Difference between data needs at a school building versus data needs for a district
The people who collect the data must see the information used for decision-making.
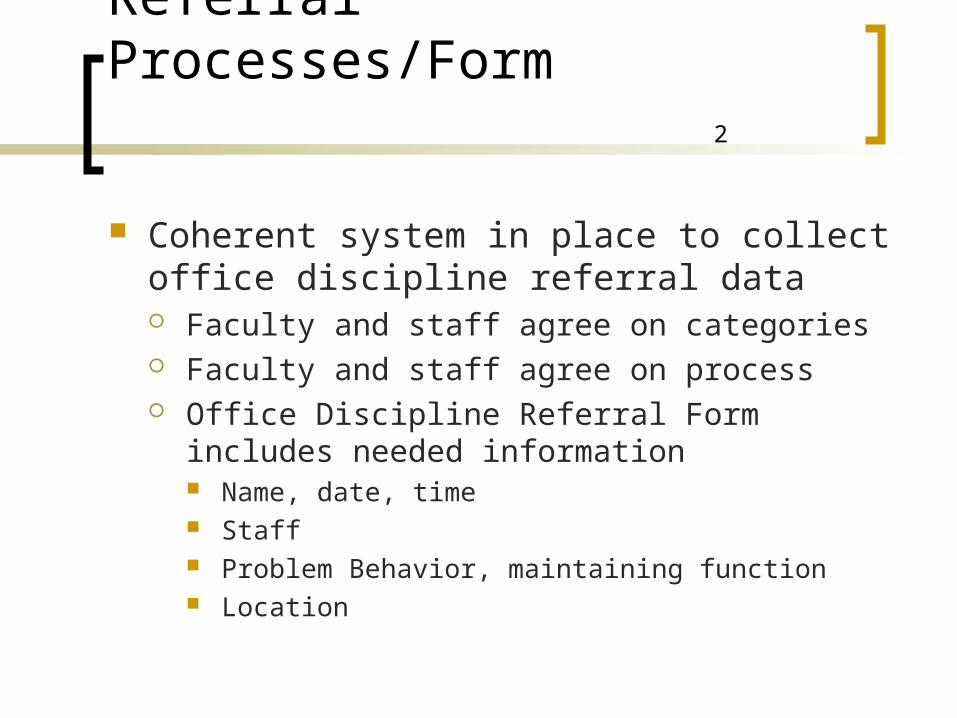
Office Discipline Referral Processes/Form 2
Coherent system in place to collect office discipline referral data Faculty and staff agree on categories Faculty and staff agree on process Office Discipline Referral Form includes needed
information Name, date, time Staff Problem Behavior, maintaining function Location
Organizing Data for “active decision-making”
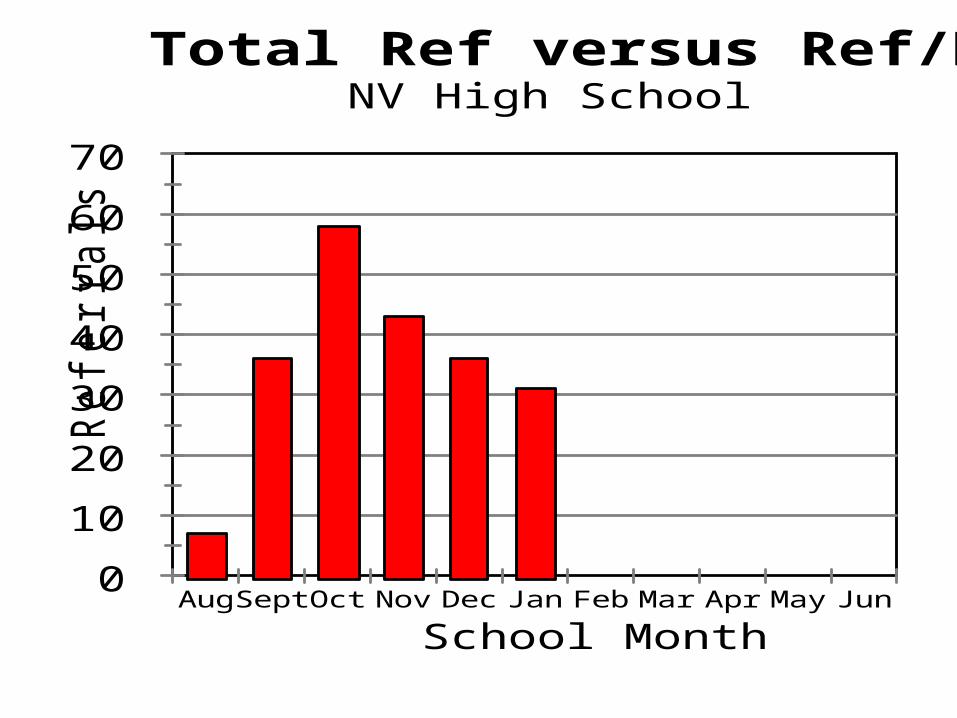
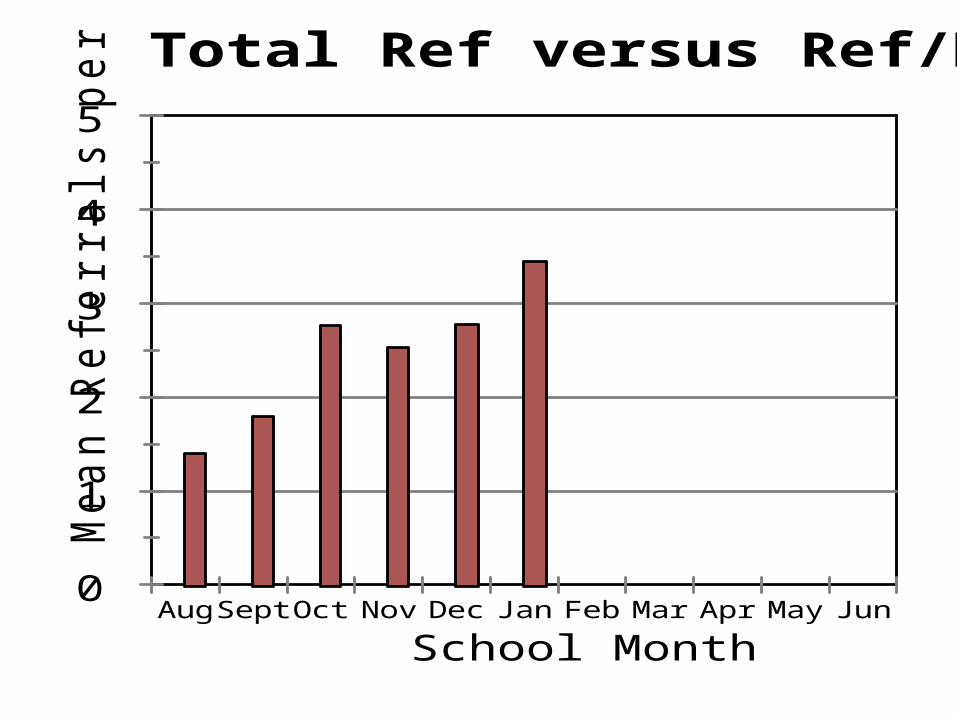
Counts are good, but not always useful To compare across months use “average
office discipline referrals per day per month”
0
10
20
30
40
50
60
70
Refe
rrals
Aug Sept Oct Nov Dec Jan Feb Mar Apr May Jun
School Month
Total Ref versus Ref/Day/MoNV High School
0
1
2
3
4
5 M
ean R
efe
rrals
per
Day
Aug Sept Oct Nov Dec Jan Feb Mar Apr May Jun
School Month
Total Ref versus Ref/Day/Mo
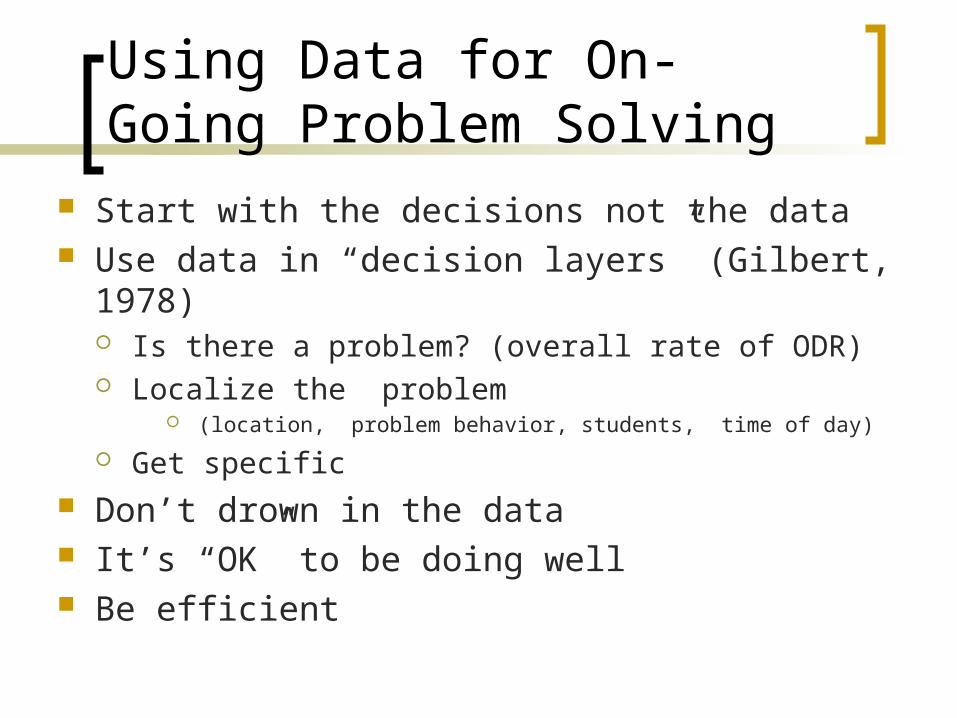
Using Data for On-Going Problem Solving
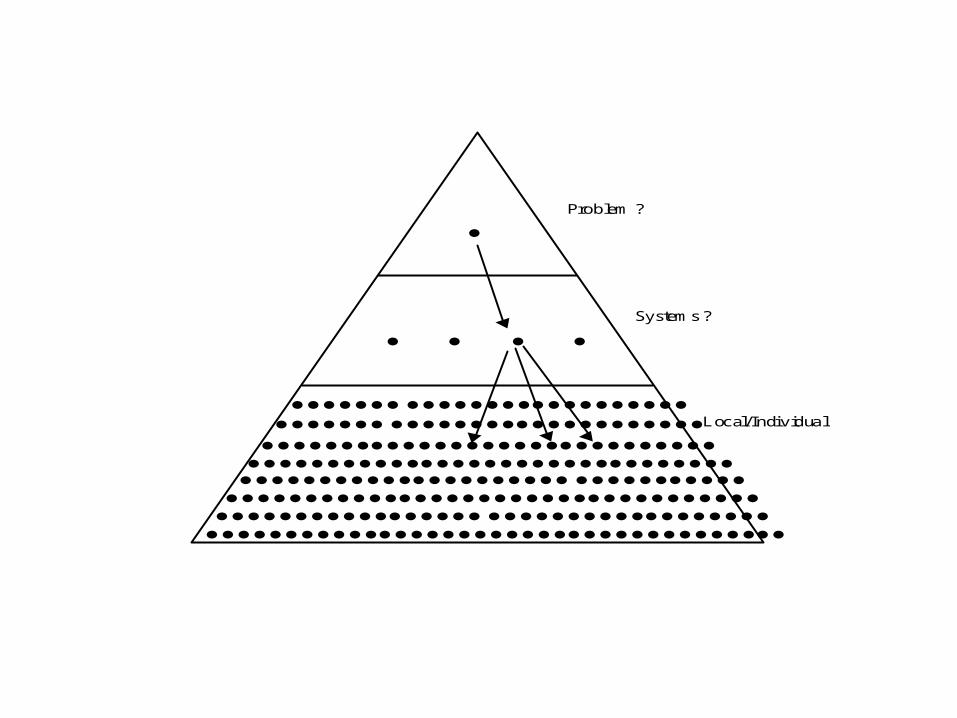
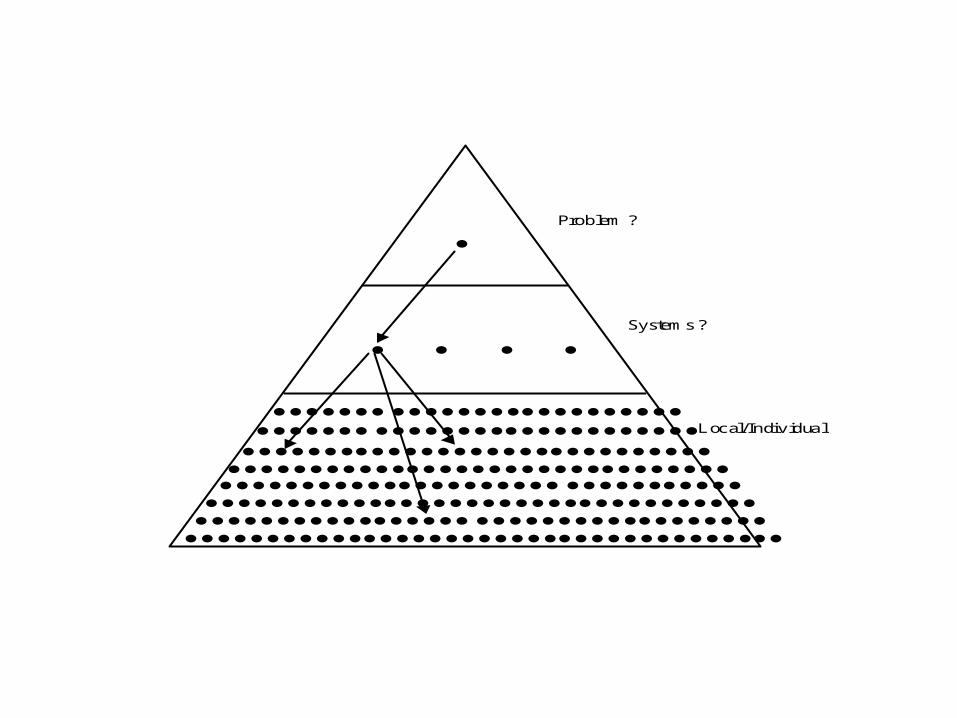
Start with the decisions not the data Use data in “decision layers” (Gilbert, 1978)
Is there a problem? (overall rate of ODR) Localize the problem
(location, problem behavior, students, time of day)
Get specific Don’t drown in the data It’s “OK” to be doing well Be efficient
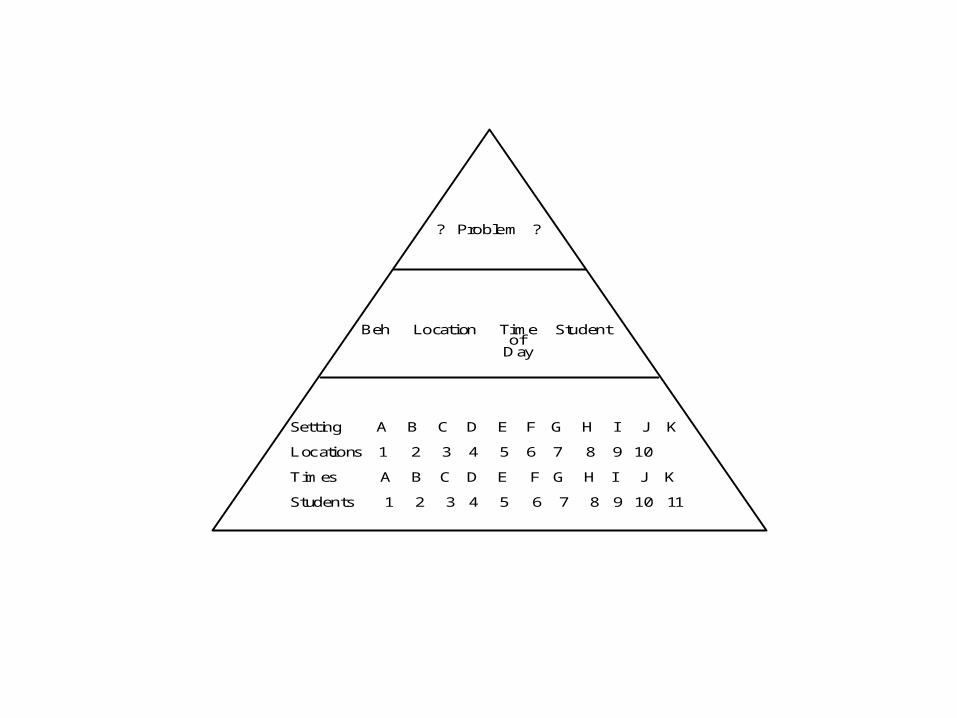
? Problem ?
Beh Location Time Studentof
Day
Setting A B C D E F G H I J K
Locations 1 2 3 4 5 6 7 8 9 10
Times A B C D E F G H I J K
Students 1 2 3 4 5 6 7 8 9 10 11
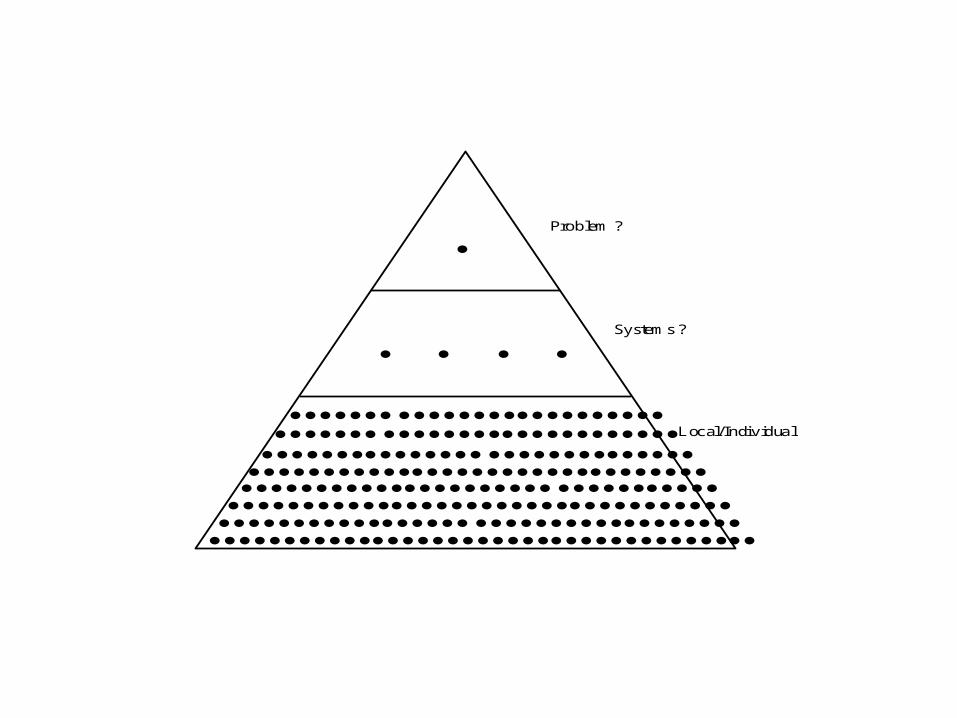
Problem ?
Systems ?
Local/Individual ?
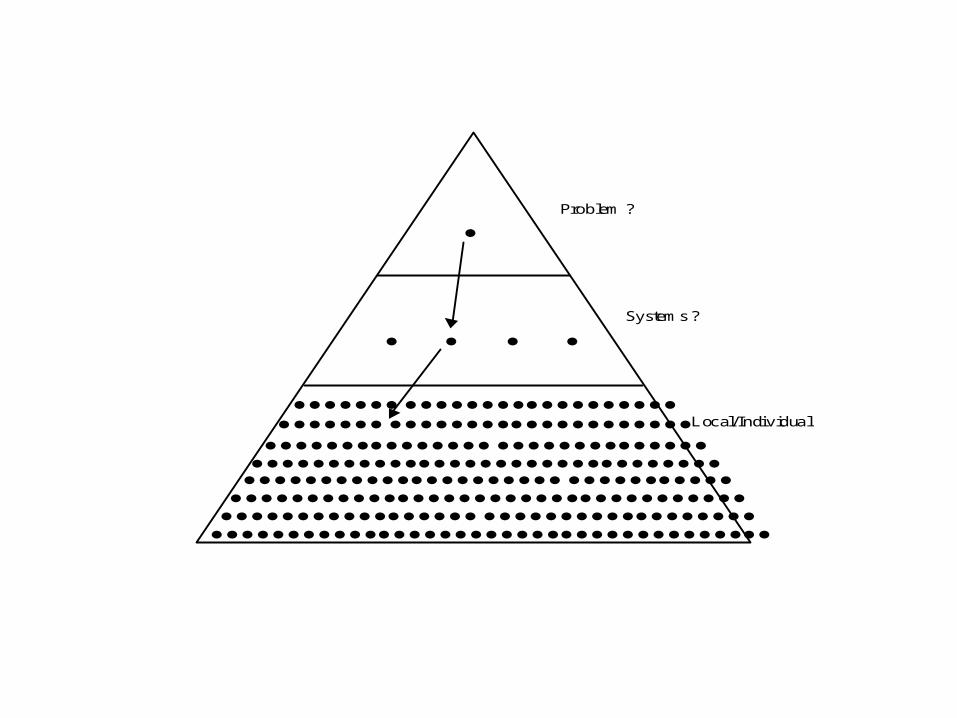
Problem ?
Systems ?
Local/Individua l ?
Problem ?
Systems ?
Local/Individua l ?
Problem ?
Systems ?
Local/Individual ?
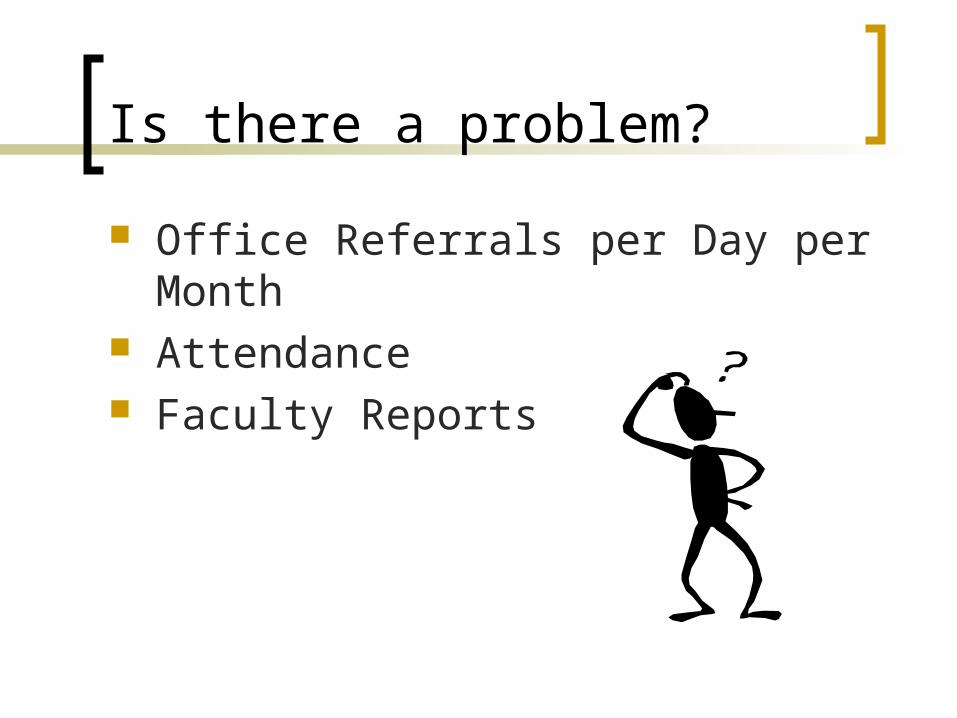
Is there a problem?
Office Referrals per Day per Month Attendance Faculty Reports
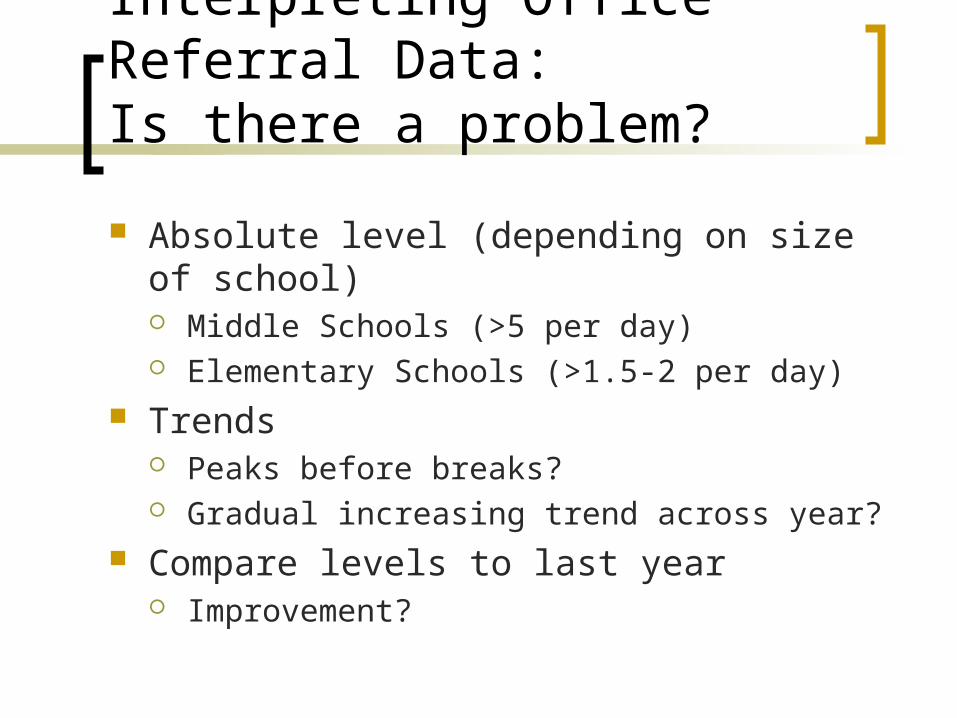
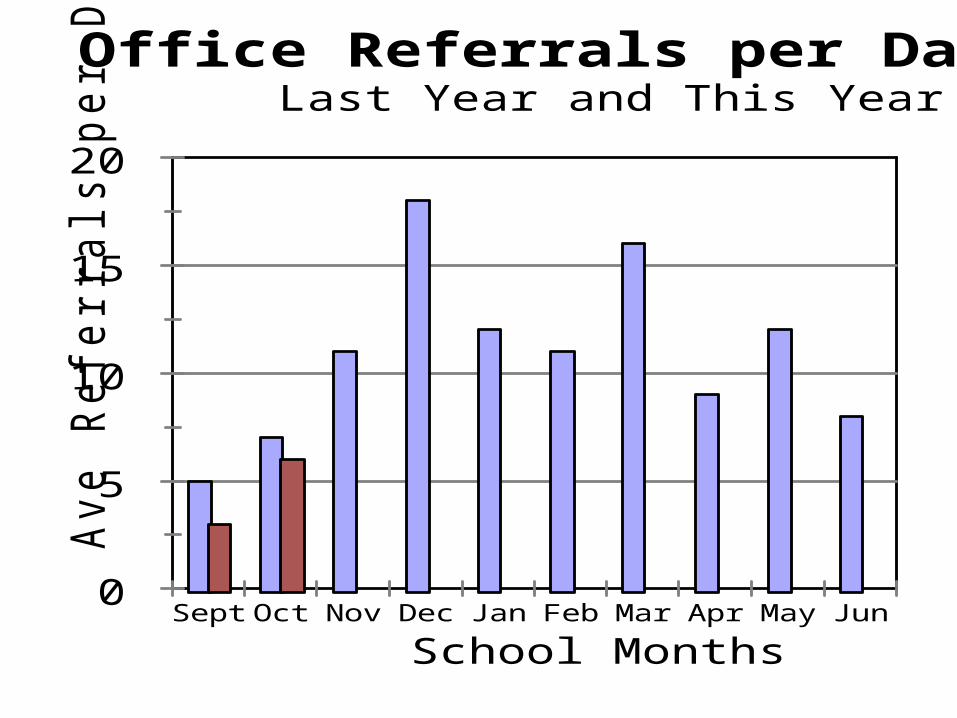
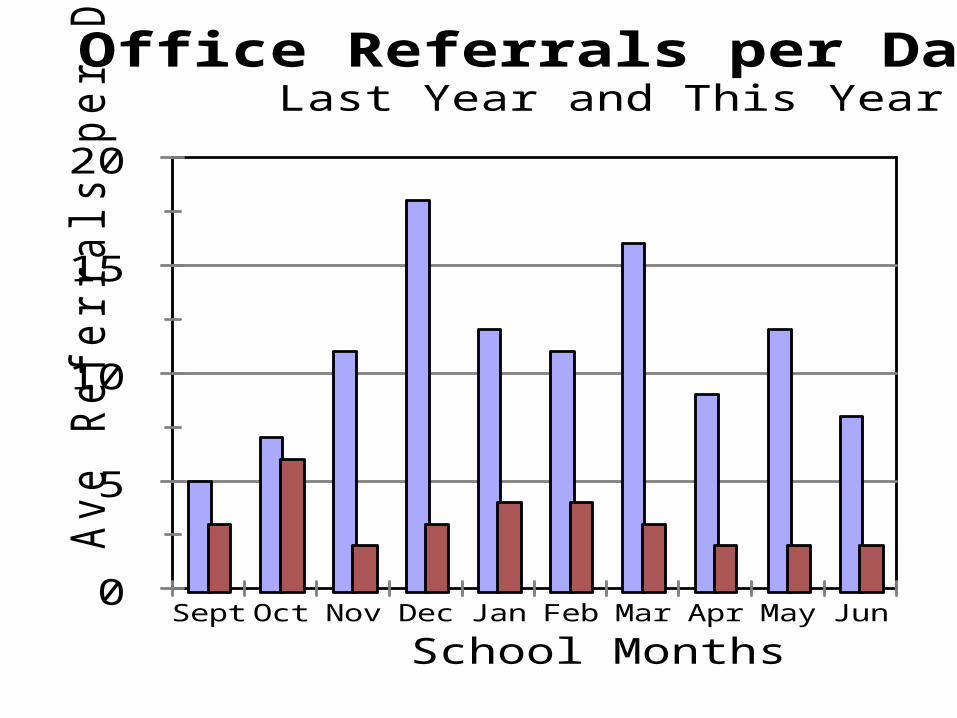
Interpreting Office Referral Data:Is there a problem?
Absolute level (depending on size of school) Middle Schools (>5 per day) Elementary Schools (>1.5-2 per day)
Trends Peaks before breaks? Gradual increasing trend across year?
Compare levels to last year Improvement?
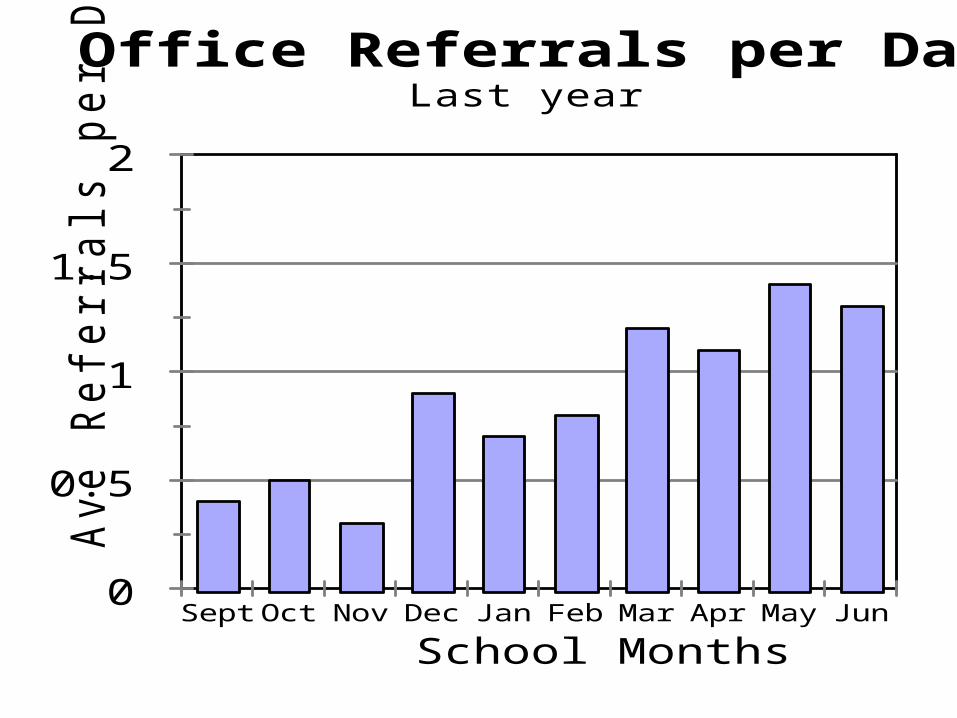
0
0.5
1
1.5
2
Ave R
efe
rrals
per
Day
Sept Oct Nov Dec Jan Feb Mar Apr May Jun
School Months
Office Referrals per Day per MonthLast year
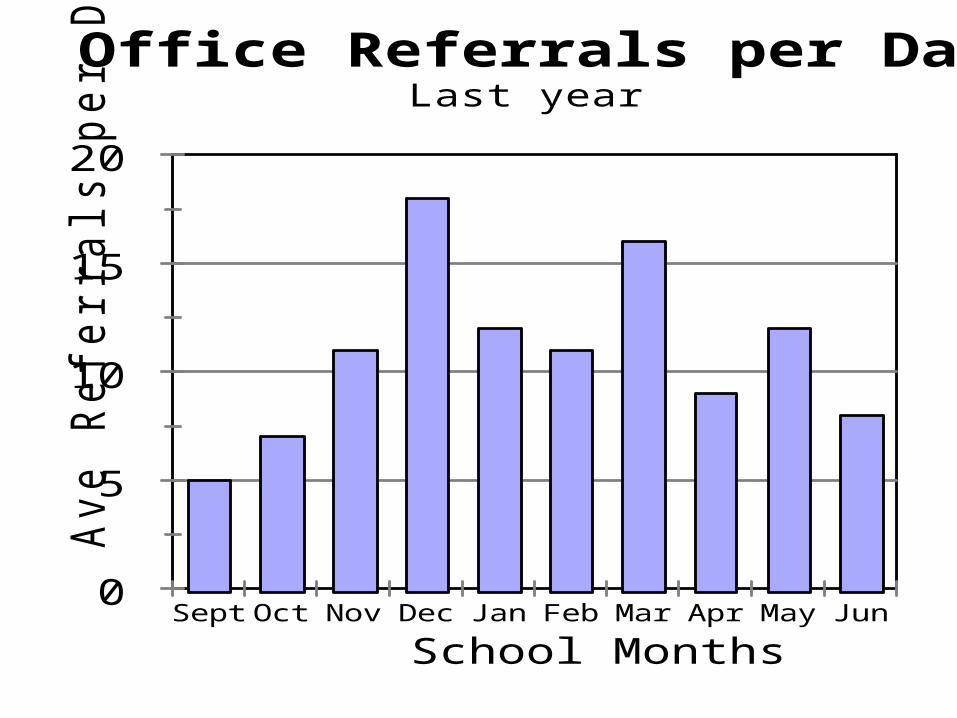
0
5
10
15
20
Ave R
efe
rrals
per
Day
Sept Oct Nov Dec Jan Feb Mar Apr May Jun
School Months
Office Referrals per Day per MonthLast year
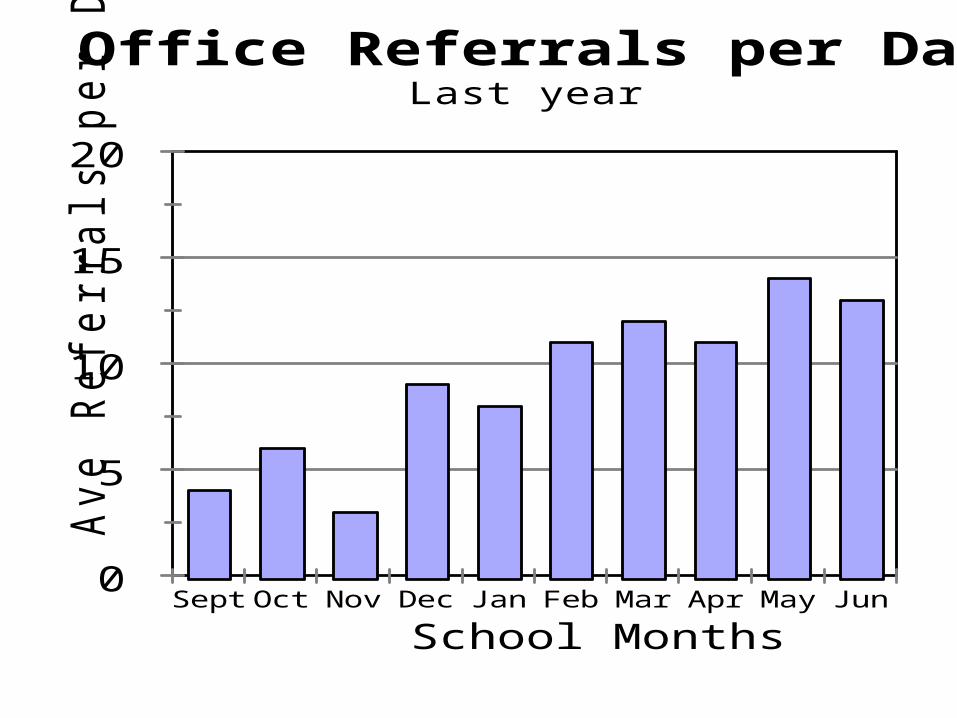
0
5
10
15
20
Ave R
efe
rrals
per
Day
Sept Oct Nov Dec Jan Feb Mar Apr May Jun
School Months
Office Referrals per Day per MonthLast year
0
5
10
15
20
Ave R
efe
rrals
per
Day
Sept Oct Nov Dec Jan Feb Mar Apr May Jun
School Months
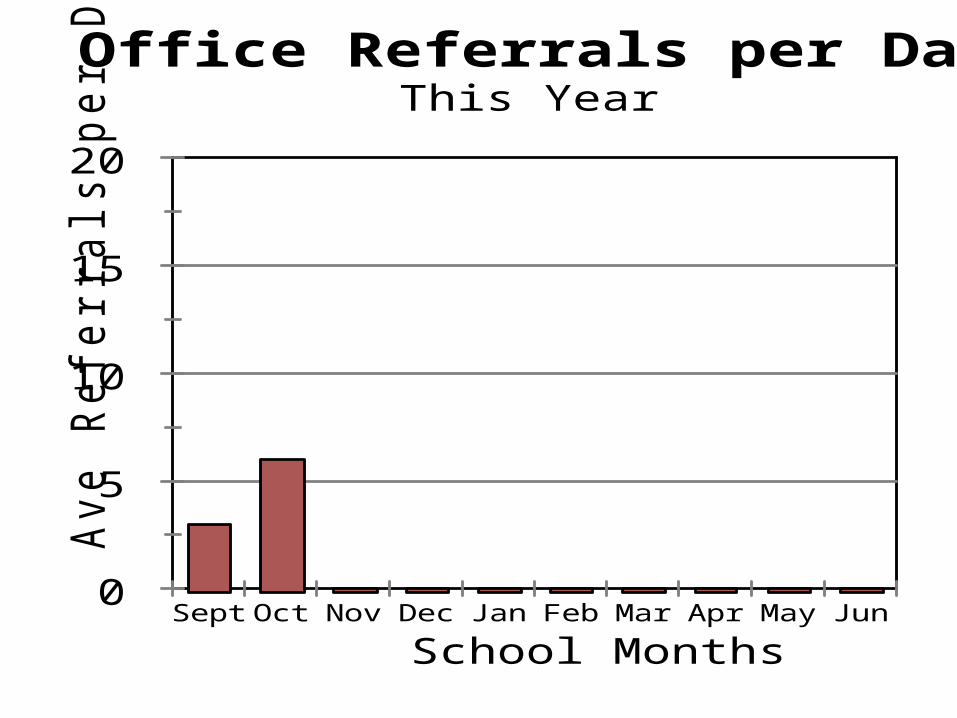
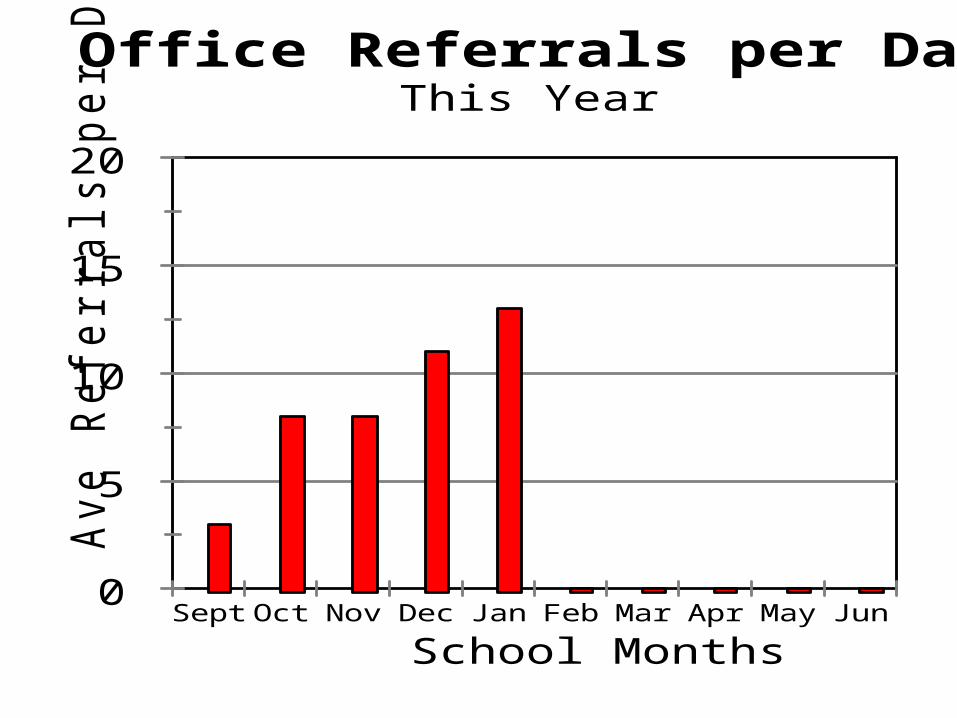
Office Referrals per Day per MonthThis Year
0
5
10
15
20
Ave R
efe
rrals
per
Day
Sept Oct Nov Dec Jan Feb Mar Apr May Jun
School Months
Office Referrals per Day per MonthLast Year and This Year
0
5
10
15
20
Ave R
efe
rrals
per
Day
Sept Oct Nov Dec Jan Feb Mar Apr May Jun
School Months
Office Referrals per Day per MonthLast Year and This Year
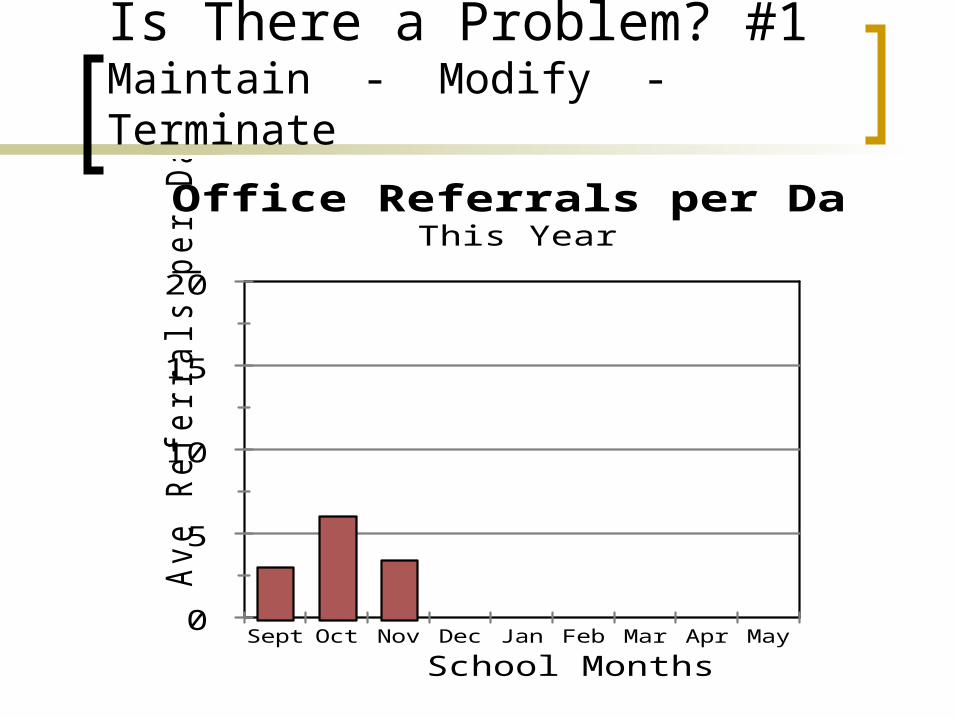
Is There a Problem? #1Maintain - Modify - Terminate
0
5
10
15
20
Ave R
efe
rrals
per
Day
Sept Oct Nov Dec Jan Feb Mar Apr May
School Months
Office Referrals per Day per MonthThis Year
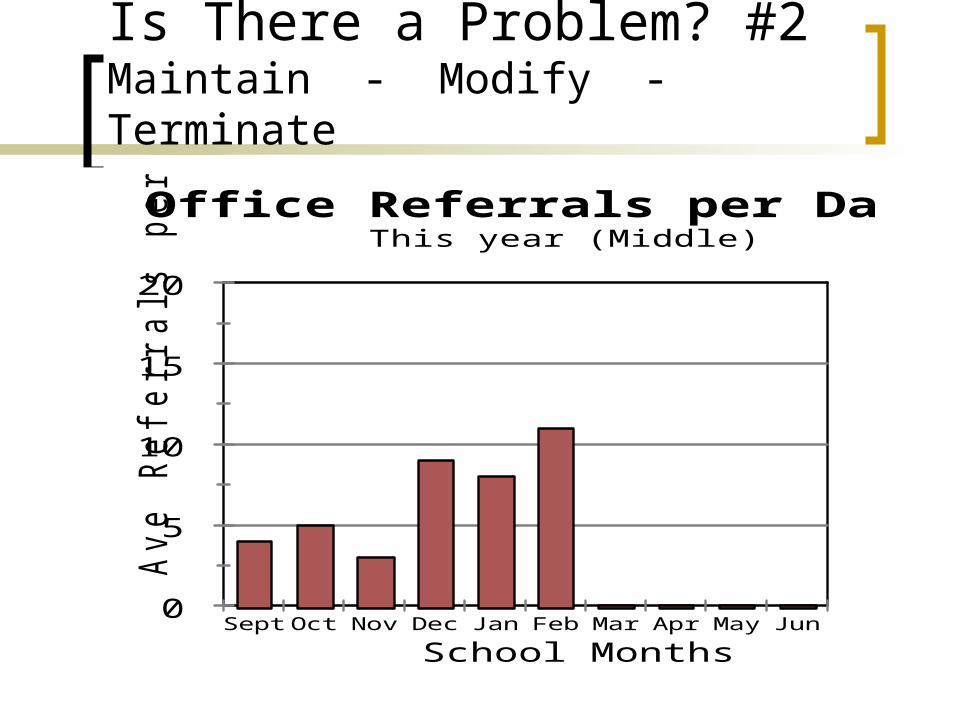
Is There a Problem? #2Maintain - Modify - Terminate
0
5
10
15
20
Ave R
efe
rrals
per
Day
Sept Oct Nov Dec Jan Feb Mar Apr May Jun
School Months
Office Referrals per Day per MonthThis year (Middle)
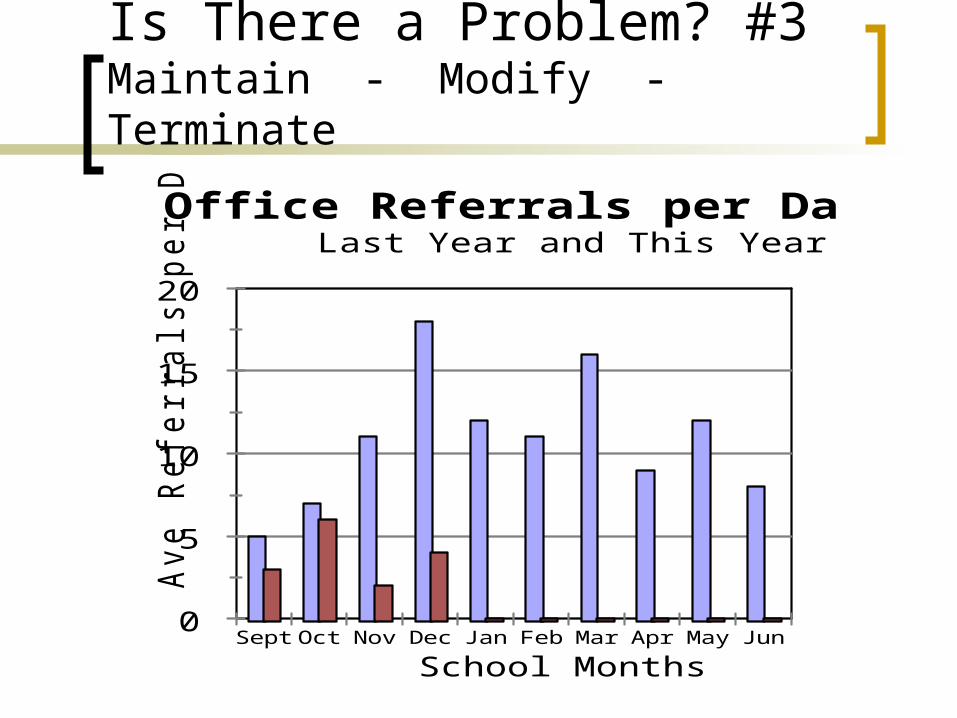
Is There a Problem? #3Maintain - Modify - Terminate
0
5
10
15
20
Ave R
efe
rrals
per
Day
Sept Oct Nov Dec Jan Feb Mar Apr May Jun
School Months
Office Referrals per Day per MonthLast Year and This Year
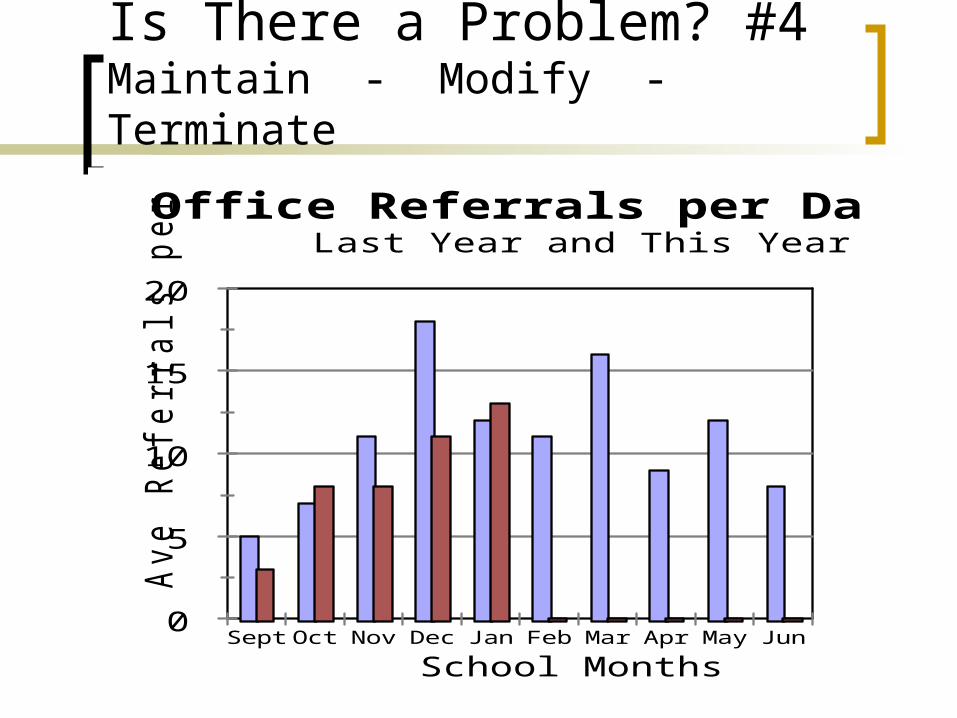
Is There a Problem? #4Maintain - Modify - Terminate
0
5
10
15
20
Ave R
efe
rrals
per
Day
Sept Oct Nov Dec Jan Feb Mar Apr May Jun
School Months
Office Referrals per Day per MonthLast Year and This Year
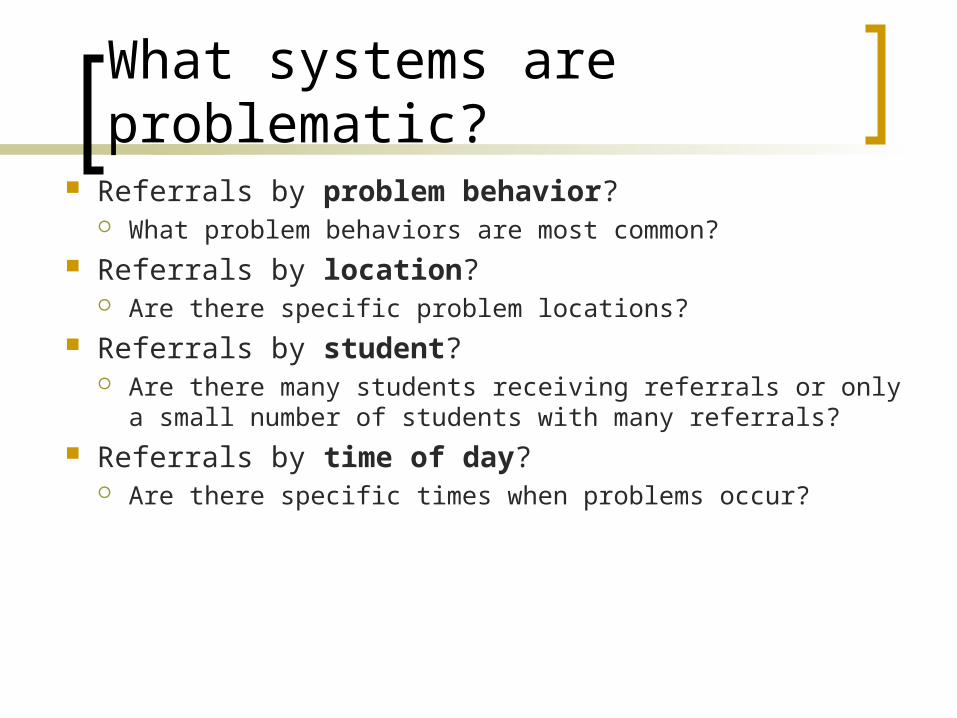
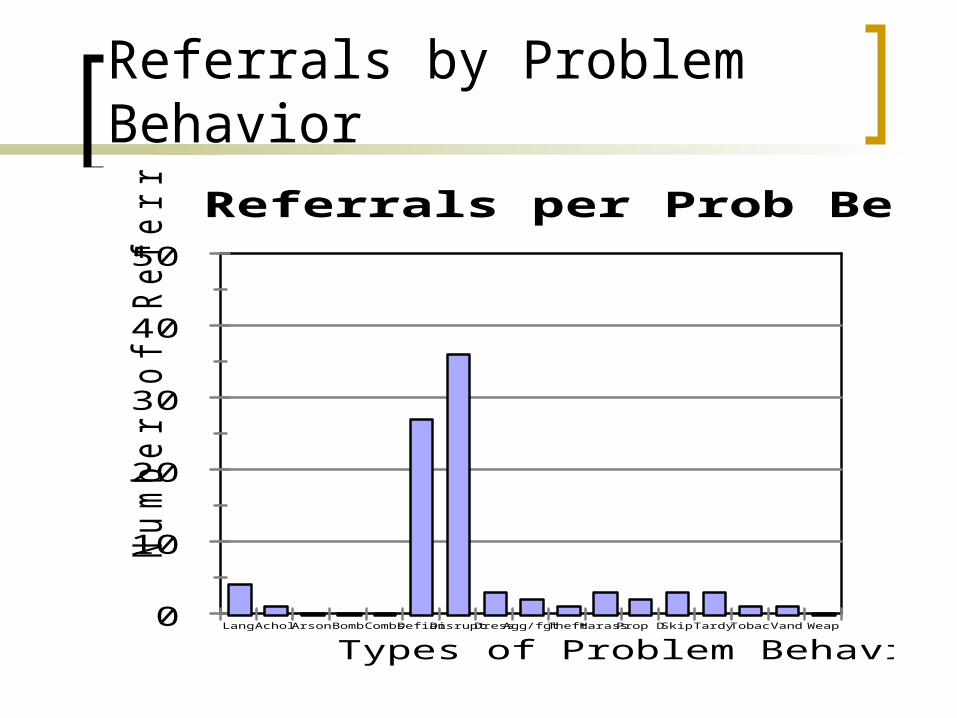
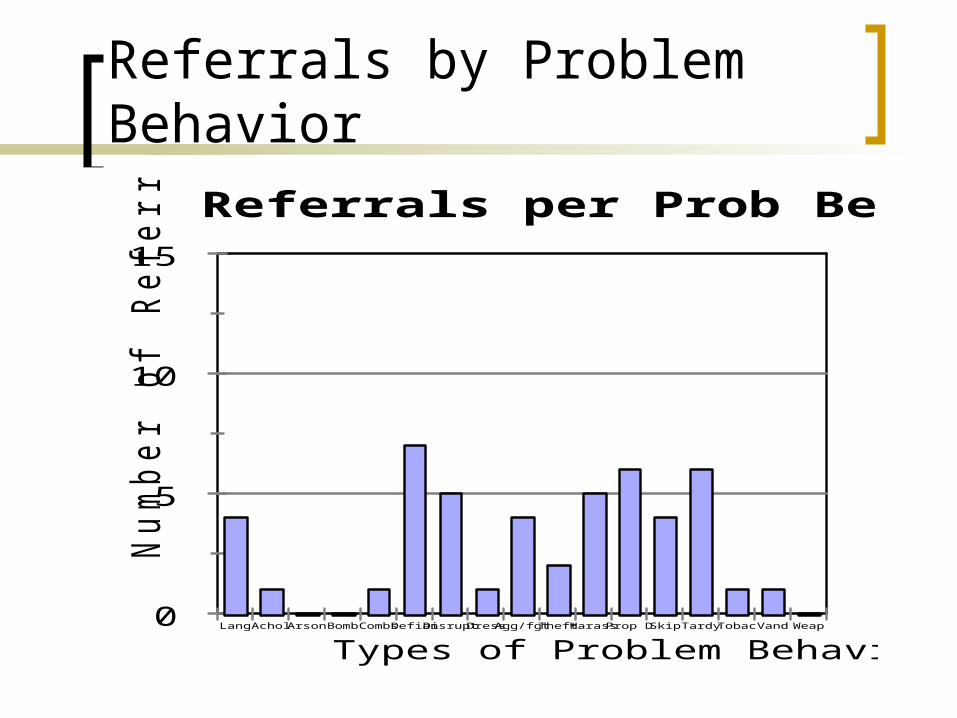
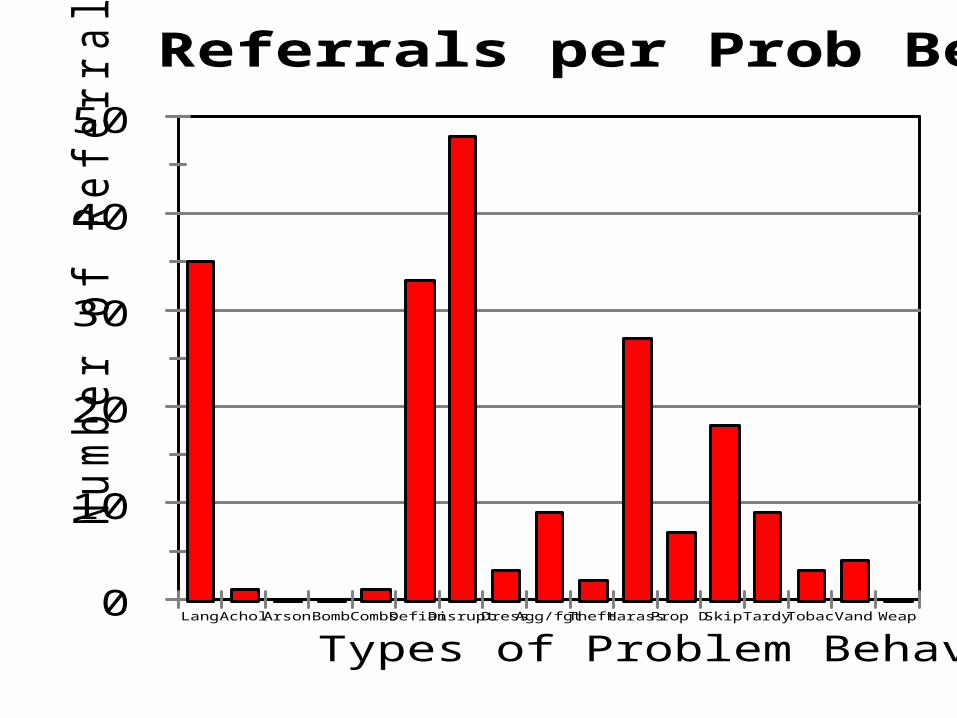
What systems are problematic? Referrals by problem behavior?
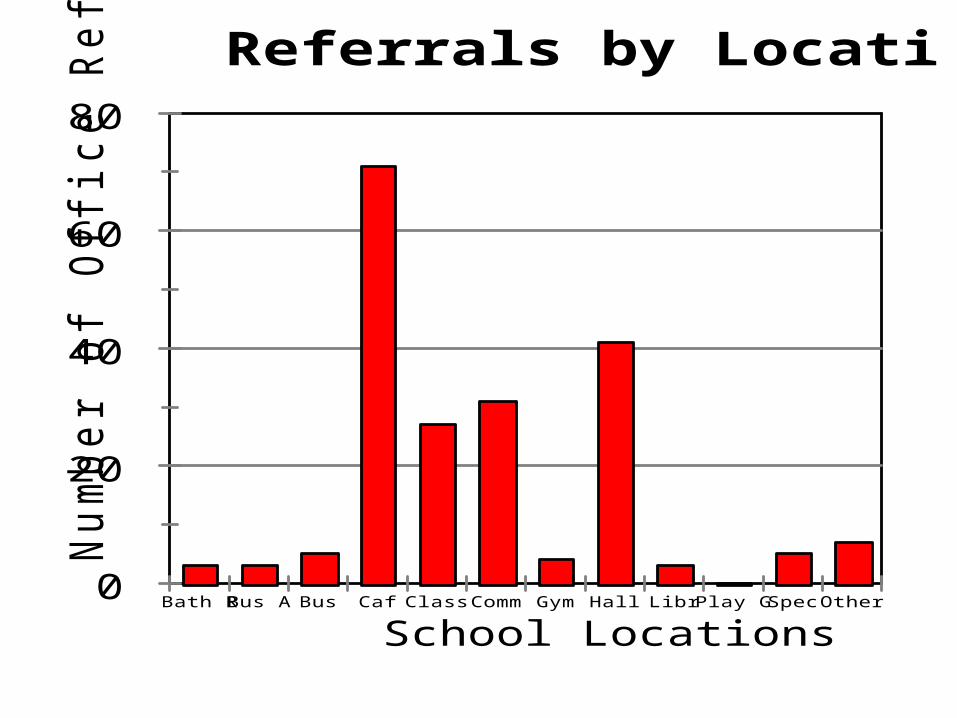
What problem behaviors are most common? Referrals by location?
Are there specific problem locations? Referrals by student?
Are there many students receiving referrals or only a small number of students with many referrals?
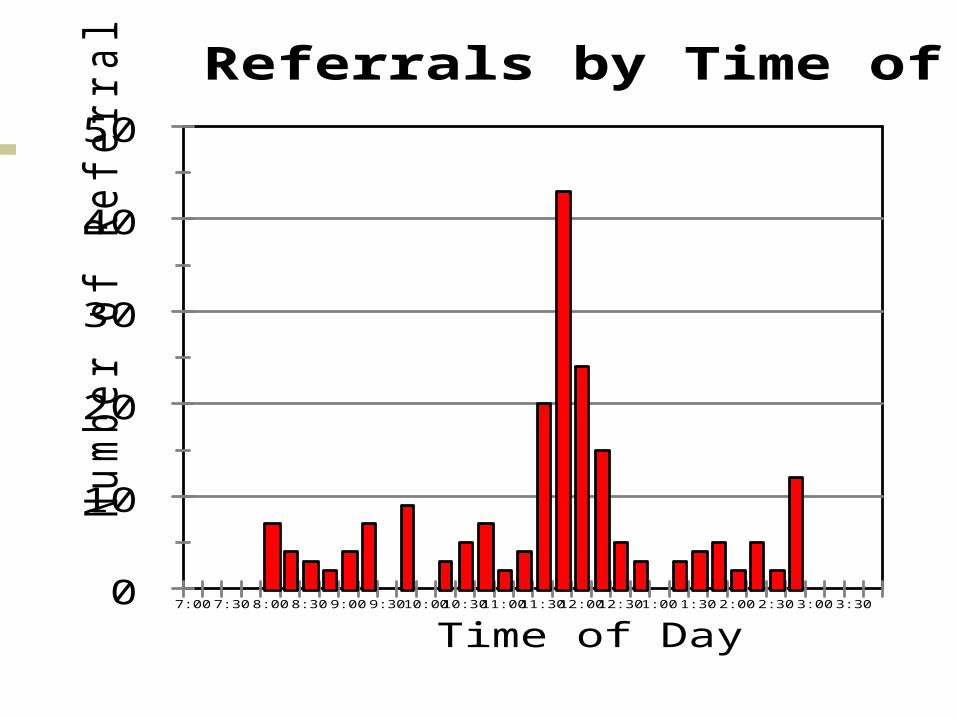
Referrals by time of day? Are there specific times when problems occur?
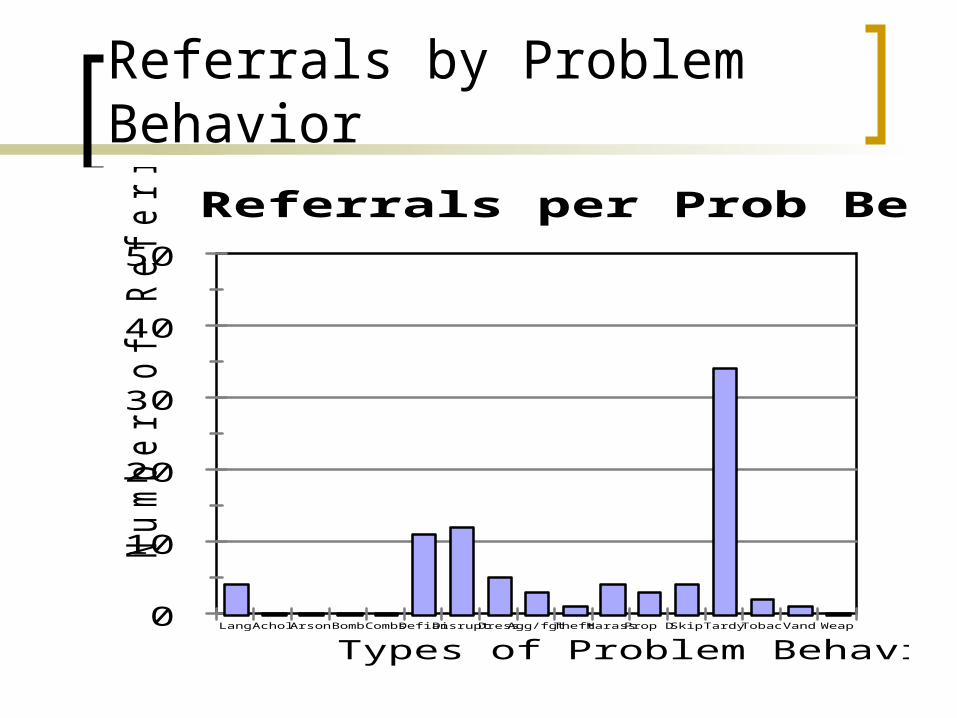
Referrals by Problem Behavior
0
10
20
30
40
50
Num
ber
of R
efe
rrals
Lang Achol ArsonBombCombsDefianDisruptDressAgg/fgtTheftHarassProp D Skip Tardy Tobac Vand Weap
Types of Problem Behavior
Referrals per Prob Behavior
Referrals by Problem Behavior
0
10
20
30
40
50
Num
ber
of R
efe
rrals
Lang Achol ArsonBombCombsDefianDisruptDressAgg/fgtTheftHarassProp D Skip Tardy Tobac Vand Weap
Types of Problem Behavior
Referrals per Prob Behavior

Referrals by Problem Behavior
0
5
10
15
Num
ber
of R
efe
rrals
Lang Achol ArsonBombCombsDefianDisruptDressAgg/fgtTheftHarassProp D Skip Tardy Tobac Vand Weap
Types of Problem Behavior
Referrals per Prob Behavior
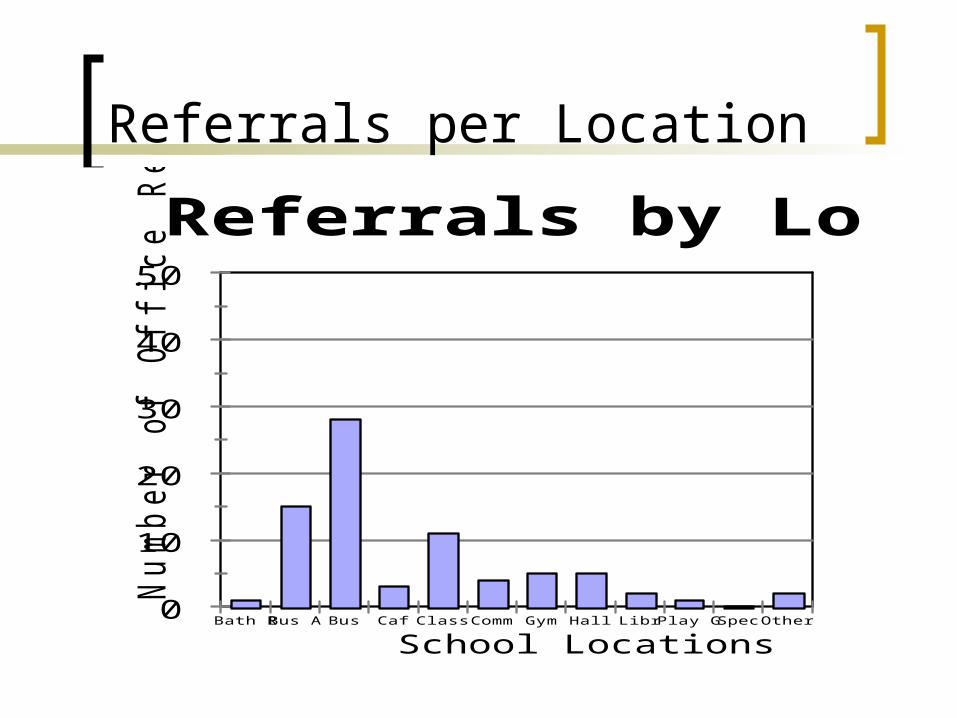
Referrals per Location
0
10
20
30
40
50
Num
ber
of O
ffic
e R
efe
rrals
Bath RBus A Bus Caf ClassComm Gym Hall Libr Play G Spec Other
School Locations
Referrals by Location
Referrals by Problem Behavior
0
5
10
15
Num
ber
of R
efe
rrals
Lang Achol ArsonBombCombsDefianDisruptDressAgg/fgtTheftHarassProp D Skip Tardy Tobac Vand Weap
Types of Problem Behavior
Referrals per Prob Behavior

Referrals by Problem Behavior
0
5
10
15
Num
ber
of R
efe
rrals
Lang Achol ArsonBombCombsDefianDisruptDressAgg/fgtTheftHarassProp D Skip Tardy Tobac Vand Weap
Types of Problem Behavior
Referrals per Prob Behavior
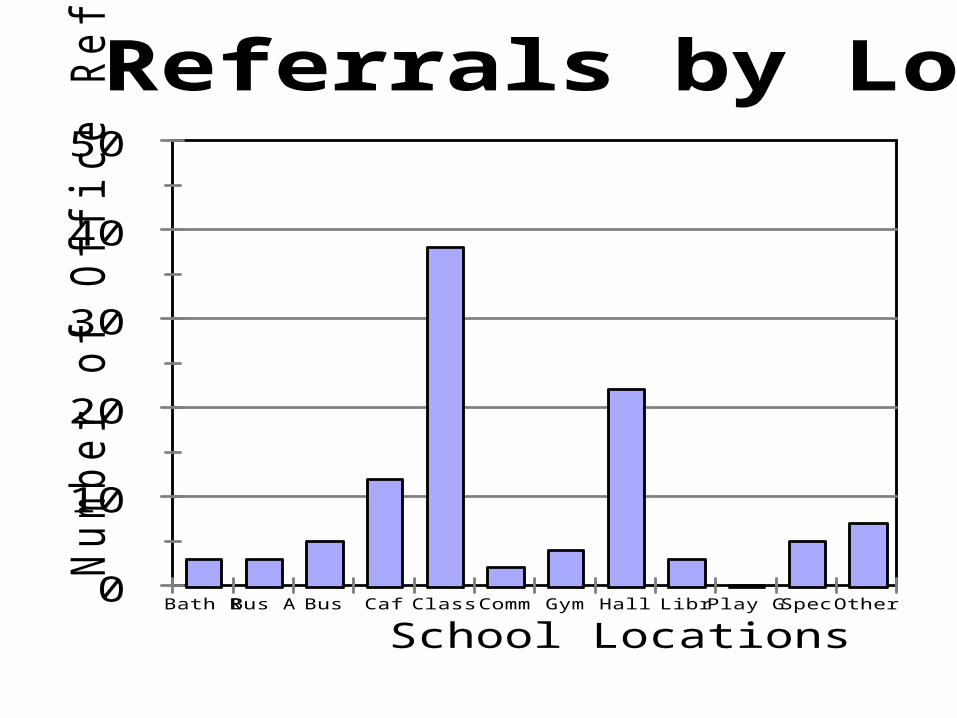
0
10
20
30
40
50
Num
ber
of O
ffic
e R
efe
rrals
Bath RBus A Bus Caf ClassComm Gym Hall Libr Play G Spec Other
School Locations
Referrals by Location
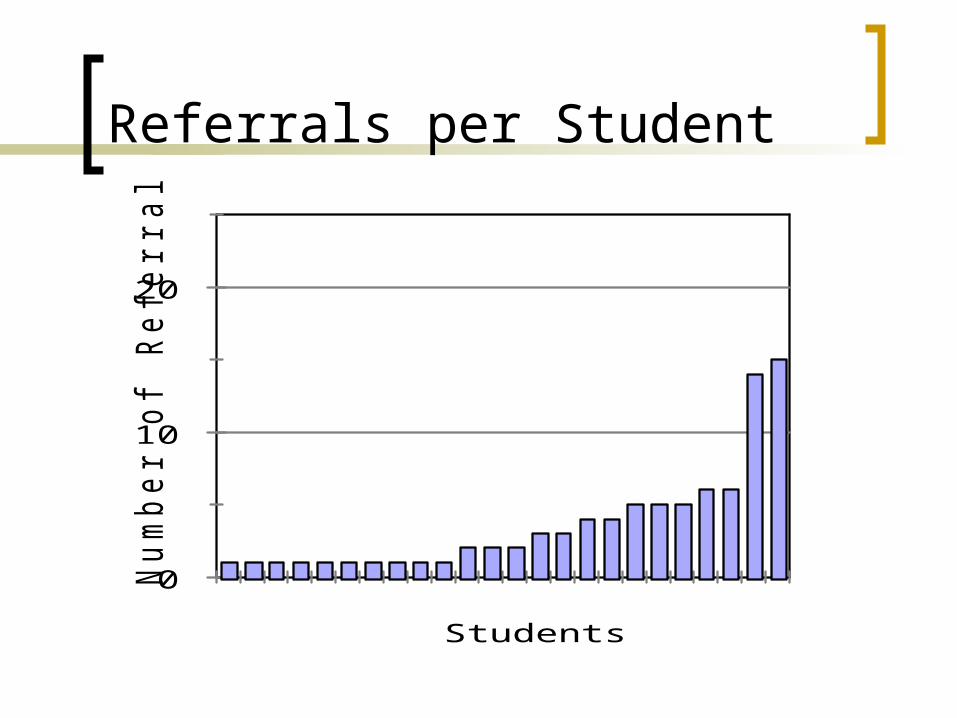
Referrals per Student
0
10
20
Num
ber
of R
efe
rrals
per
Stu
dent
Students
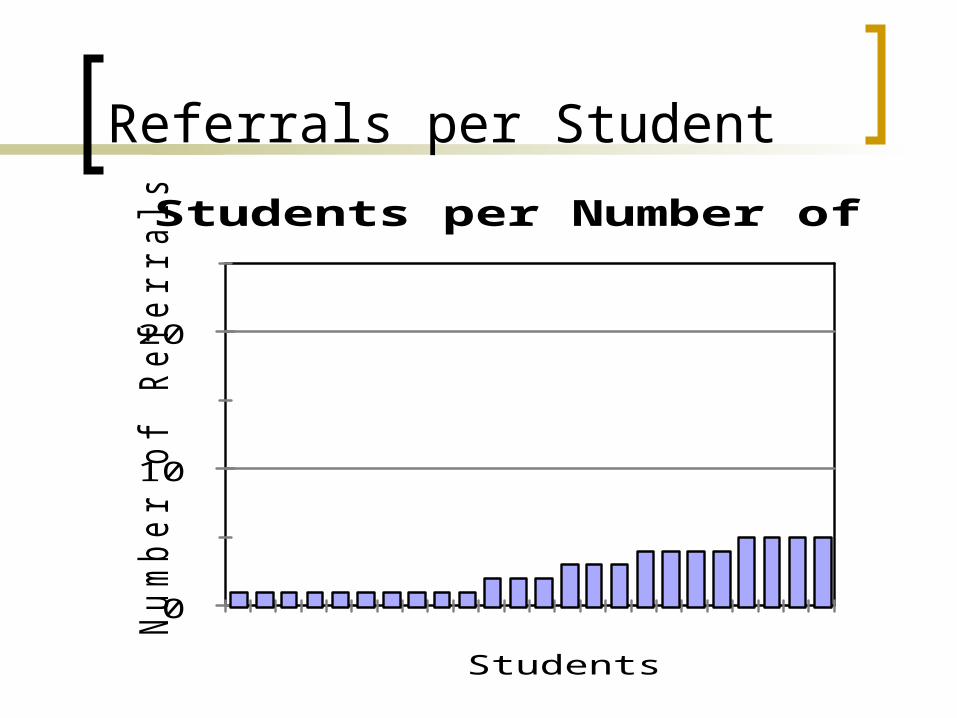
Referrals per Student
0
10
20
Num
ber
of R
efe
rrals
per
Stu
dent
Students
Students per Number of Referrals
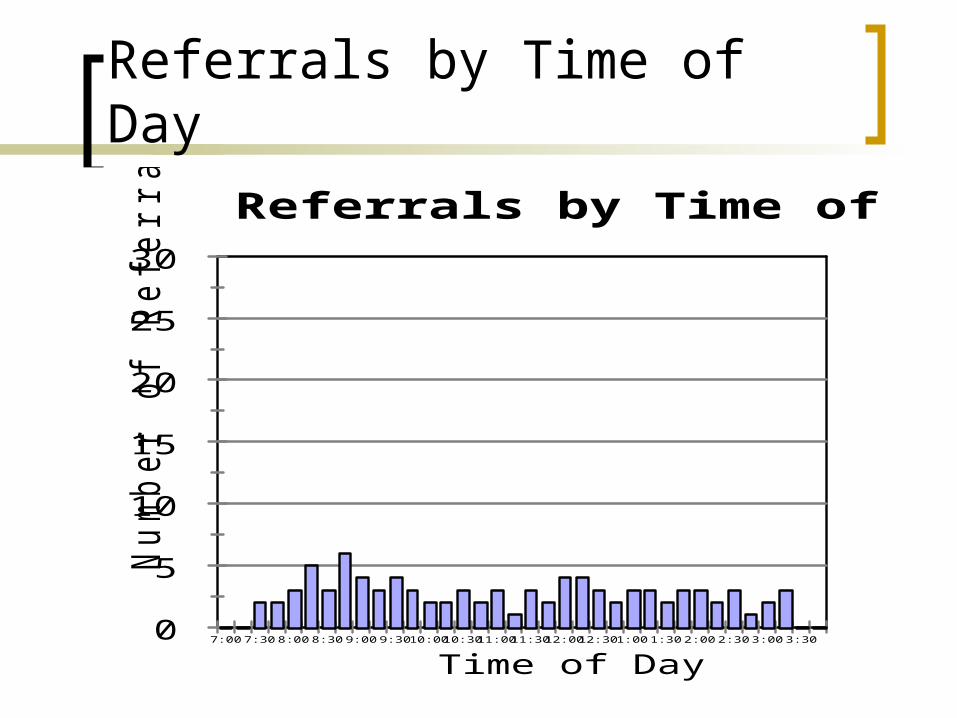
Referrals by Time of Day
0
5
10
15
20
25
30
Num
ber
of R
efe
rrals
7:00 7:30 8:00 8:30 9:00 9:30 10:0010:3011:00 11:3012:0012:30 1:00 1:30 2:00 2:30 3:00 3:30
Time of Day
Referrals by Time of Day
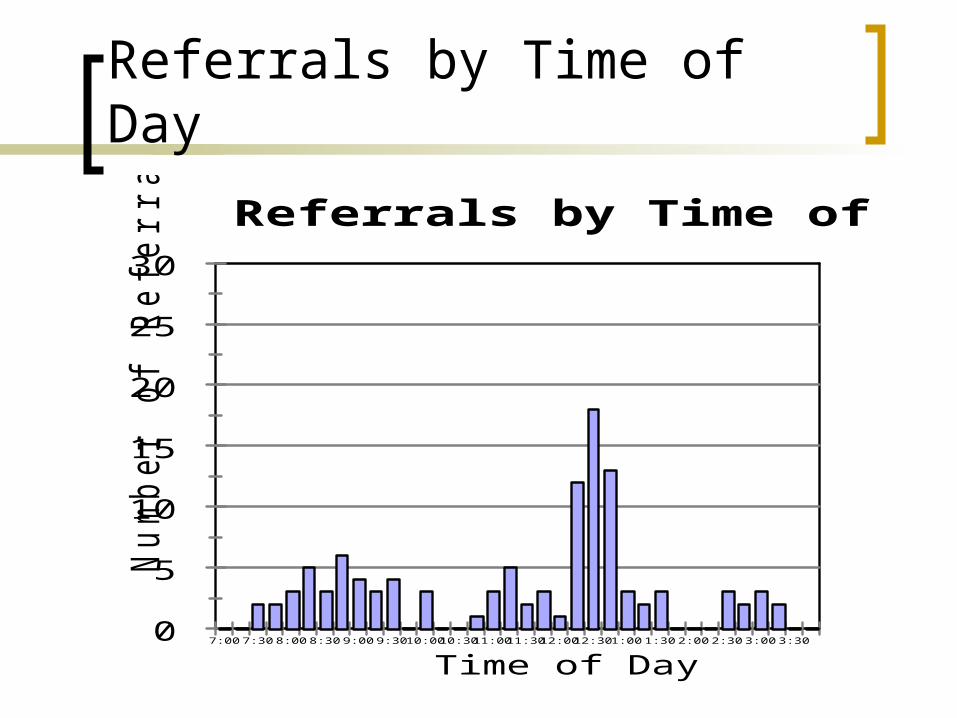
Referrals by Time of Day
0
5
10
15
20
25
30
Num
ber
of R
efe
rrals
7:00 7:30 8:00 8:30 9:00 9:30 10:0010:3011:00 11:3012:0012:30 1:00 1:30 2:00 2:30 3:00 3:30
Time of Day
Referrals by Time of Day
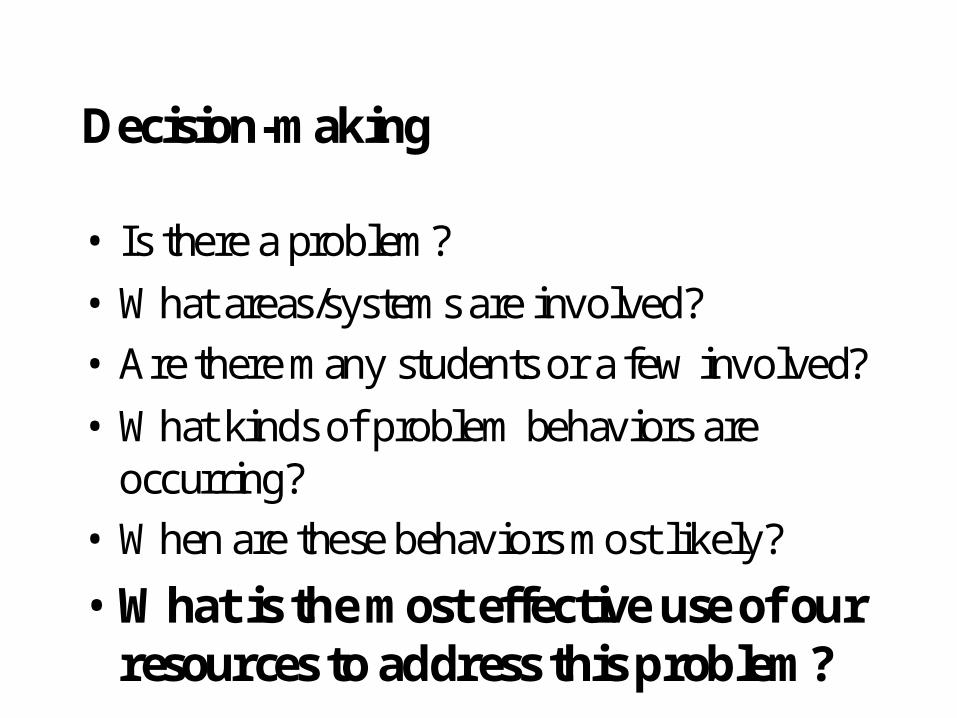
Decision-making
• Is there a problem?
• What areas/systems are involved?
• Are there many students or a few involved?
• What kinds of problem behaviors areoccurring?
• When are these behaviors most likely?
• What is the most effective use of ourresources to address this problem?
Examples
Trevor Test Phoenix Elementary Crone Middle ODR Summary
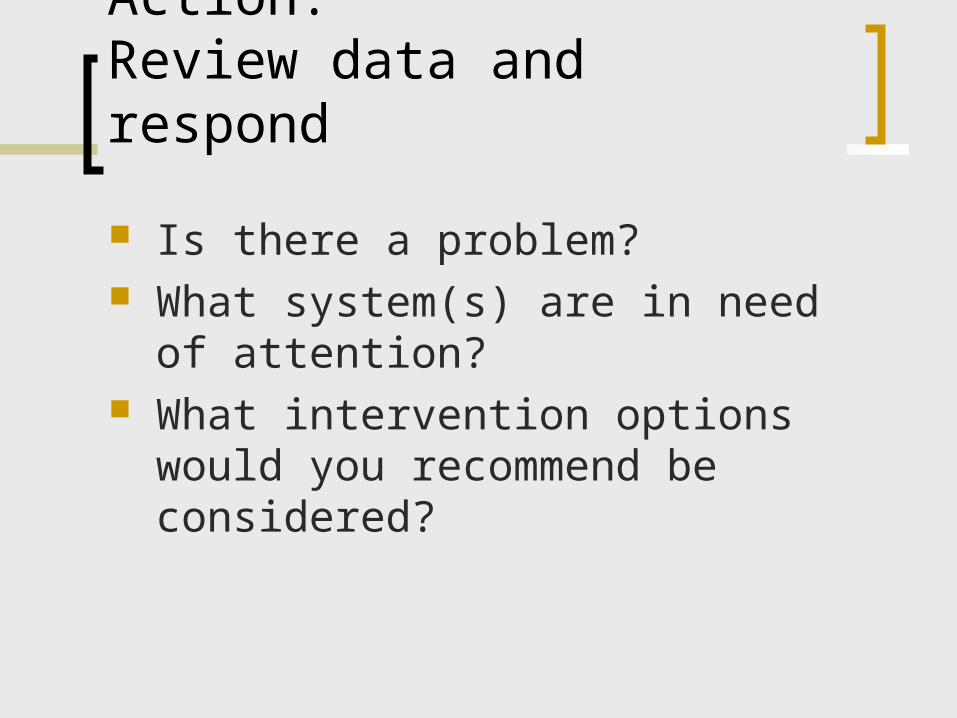
Action: Review data and respond
Is there a problem? What system(s) are in need of
attention? What intervention options would you
recommend be considered?

Trevor Test Middle School
565 students
Grades 6,7,8
0
5
10
15
20
Ave R
efe
rrals
per
Day
Sept Oct Nov Dec Jan Feb Mar Apr May Jun
School Months
Office Referrals per Day per MonthThis Year
0
10
20
30
40
50 N
um
ber
of R
efe
rrals
Lang Achol ArsonBombCombsDefianDisruptDressAgg/fgtTheftHarassProp D Skip Tardy Tobac Vand Weap
Types of Problem Behavior
Referrals per Prob Behavior
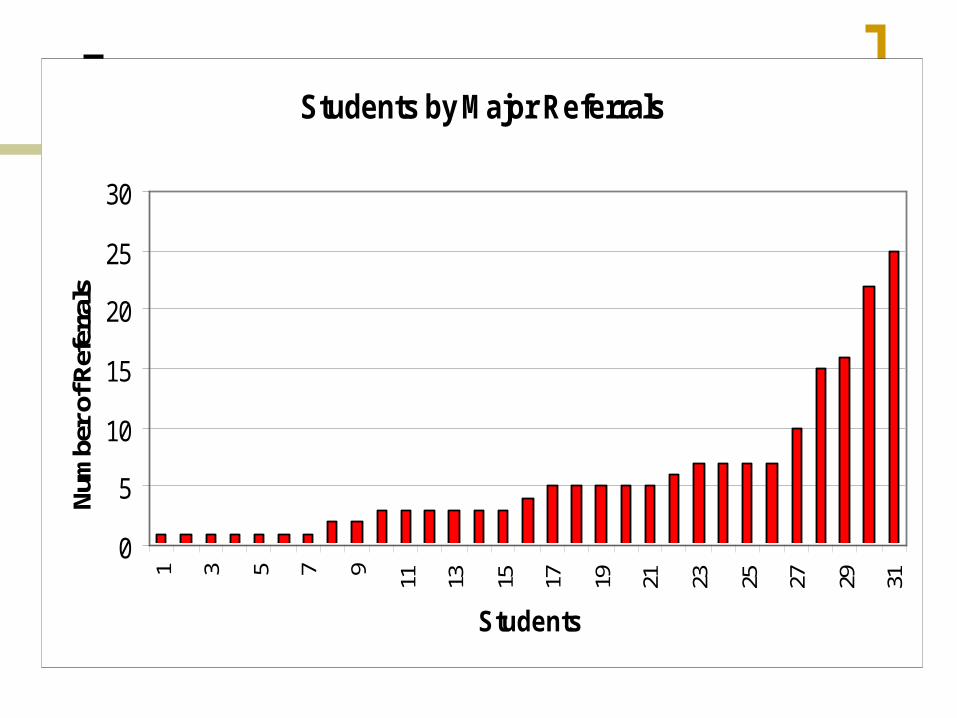
Students by Major Referrals
0
5
10
15
20
25
301 3 5 7 9 11 13 15 17 19 21 23 25 27 29 31
Students
Num
ber
of R
efer
rals
0
20
40
60
80 N
um
ber
of O
ffic
e R
efe
rrals
Bath RBus A Bus Caf ClassComm Gym Hall Libr Play G Spec Other
School Locations
Referrals by Location
0
10
20
30
40
50 N
um
ber
of R
efe
rrals
7:00 7:30 8:00 8:30 9:00 9:30 10:0010:3011:00 11:3012:0012:30 1:00 1:30 2:00 2:30 3:00 3:30
Time of Day
Referrals by Time of Day

Action: Review data and respond
Is there a problem? What system(s) are in need of
attention? What intervention options would you
recommend be considered?
Phoenix Elementary
Using Data For Decision-Making
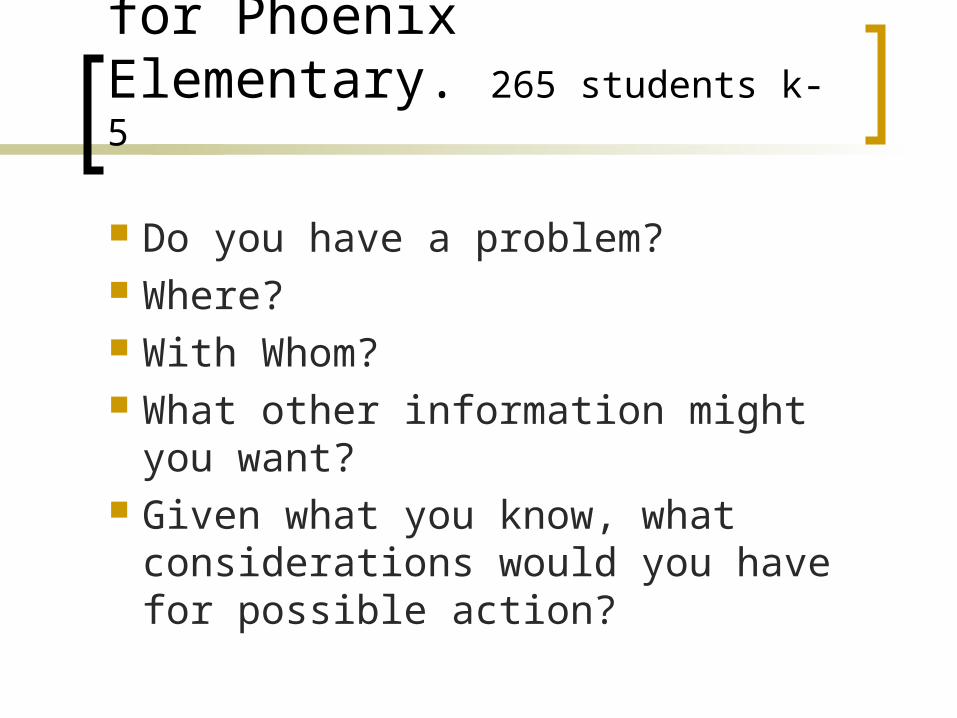
You are the EBS team for Phoenix Elementary. 265 students k-5
Do you have a problem? Where? With Whom? What other information might you want? Given what you know, what considerations
would you have for possible action?
0
1
2
3
4
5
Mean S
tudent C
onta
cts
per
Day
Sept Oct Nov Dec Jan Feb Mar Apr May June
School Months
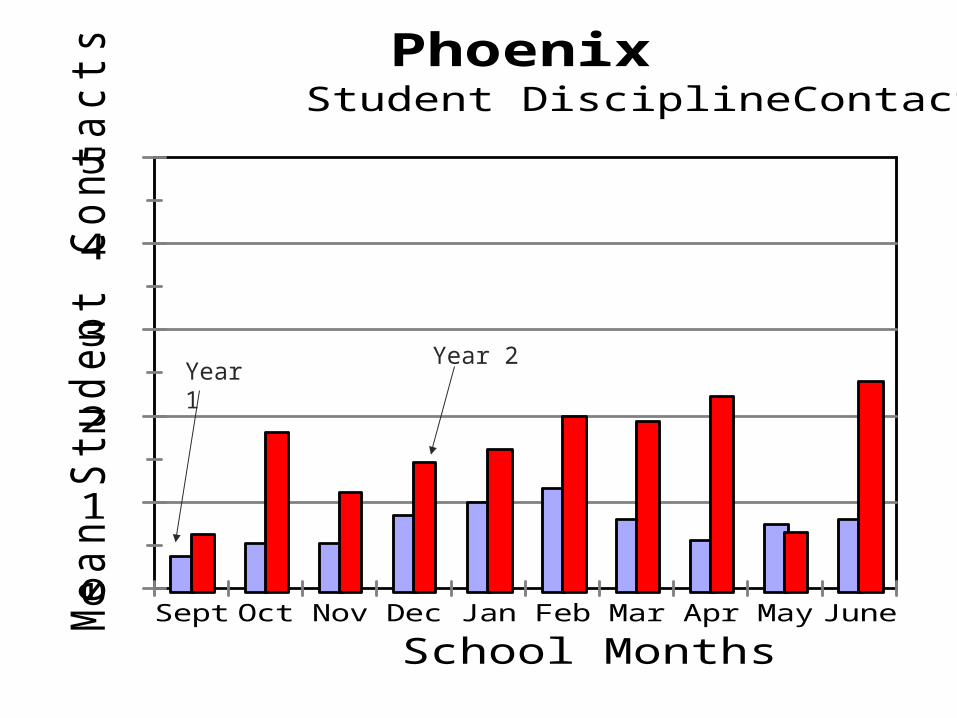
Phoenix Student DisciplineContacts
Year 1Year 2
0
20
40
60
80
100
120
140
Num
ber
of S
tudent C
onta
cts
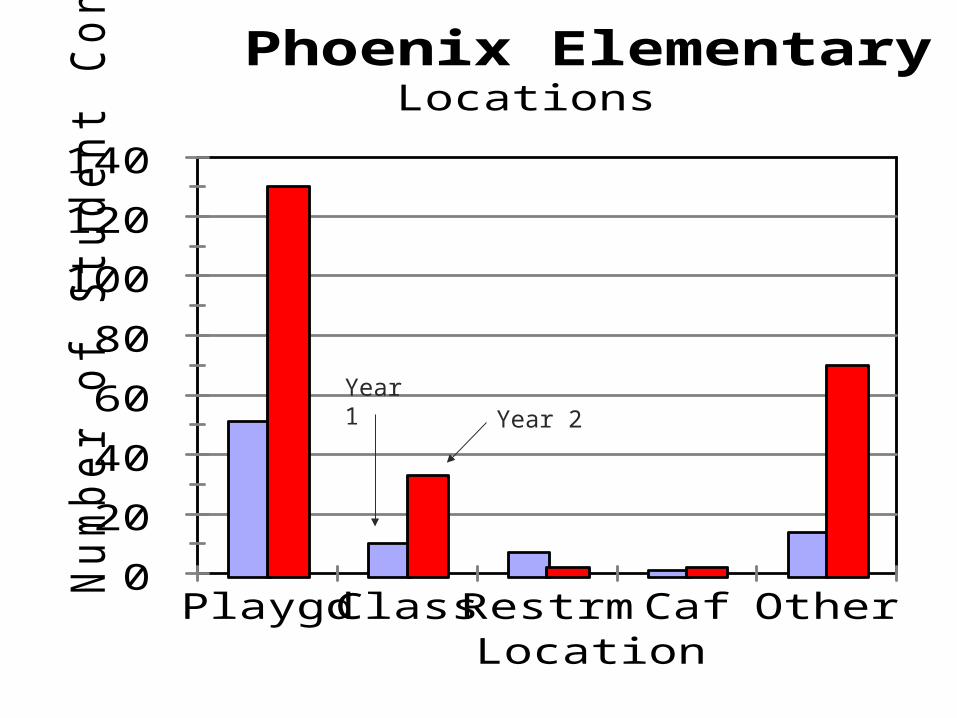
Playgd ClassRestrm Caf OtherLocation
Phoenix ElementaryLocations
Year 1Year 2
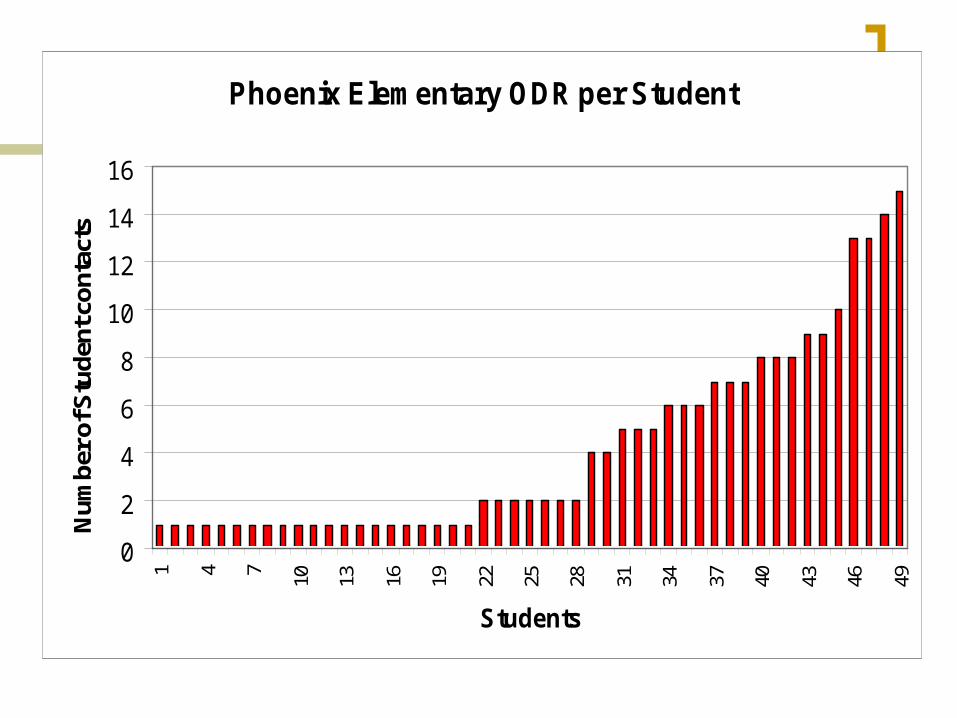
Phoenix Elementary ODR per Student
0
2
4
6
8
10
12
14
161 4 7 10 13 16 19 22 25 28 31 34 37 40 43 46 49
Students
Nu
mbe
r of S
tude
nt c
onta
cts
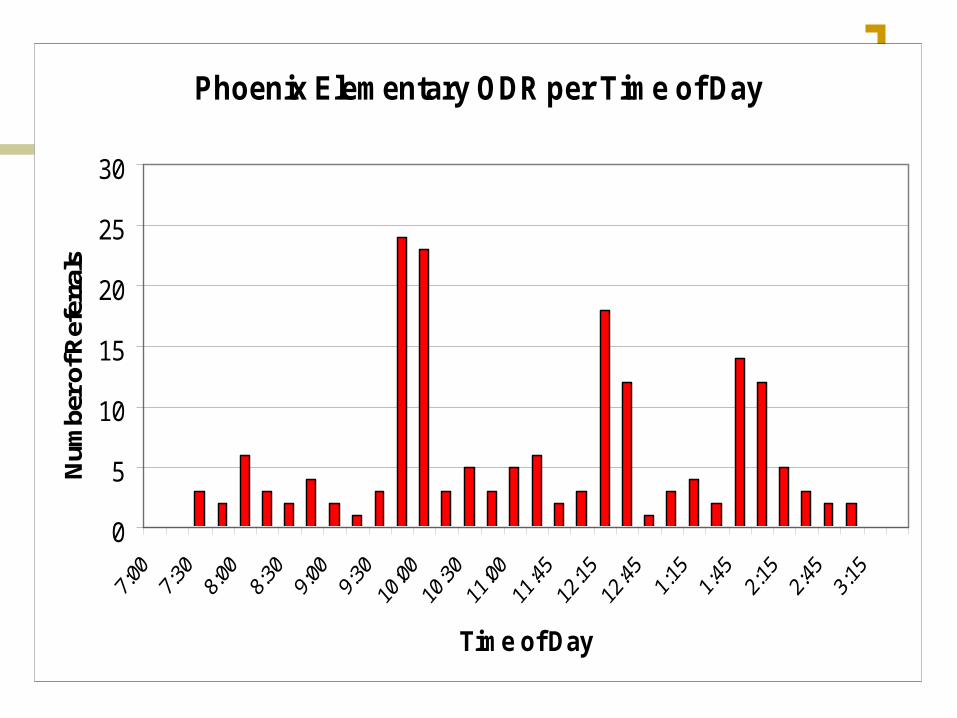
Phoenix Elementary ODR per Time of Day
0
5
10
15
20
25
30
Time of Day
Num
ber o
f Ref
erra
ls

Action: Review data and respond
Is there a problem? What system(s) are in need of
attention? What intervention options would you
recommend be considered?
Crone Middle School Simulation
416 students
6,7, 8th grades
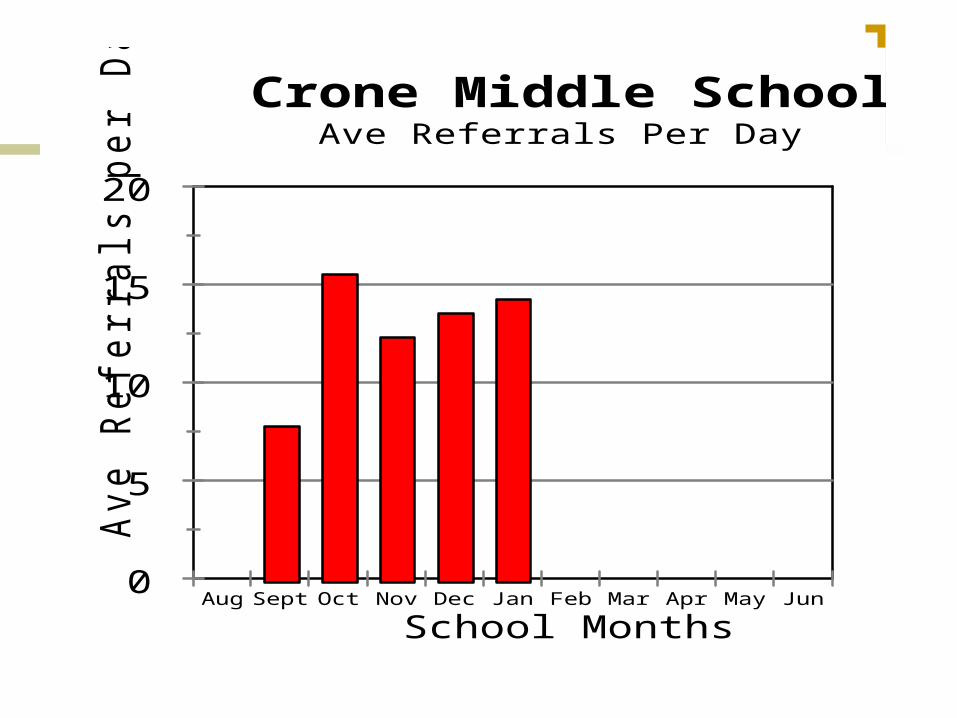
0
5
10
15
20
Ave R
efe
rrals
per
Day
Aug Sept Oct Nov Dec Jan Feb Mar Apr May Jun
School Months
Crone Middle SchoolAve Referrals Per Day
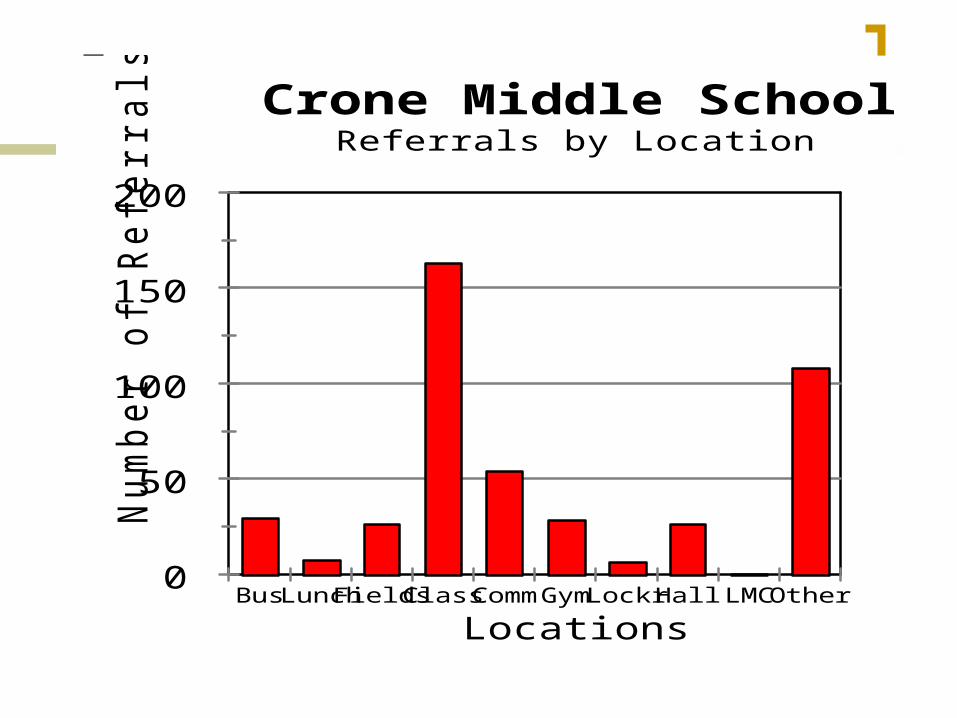
0
50
100
150
200
Num
ber
of R
efe
rrals
BusLunchFieldsClassCommGymLockrHall LMCOther
Locations
Crone Middle SchoolReferrals by Location
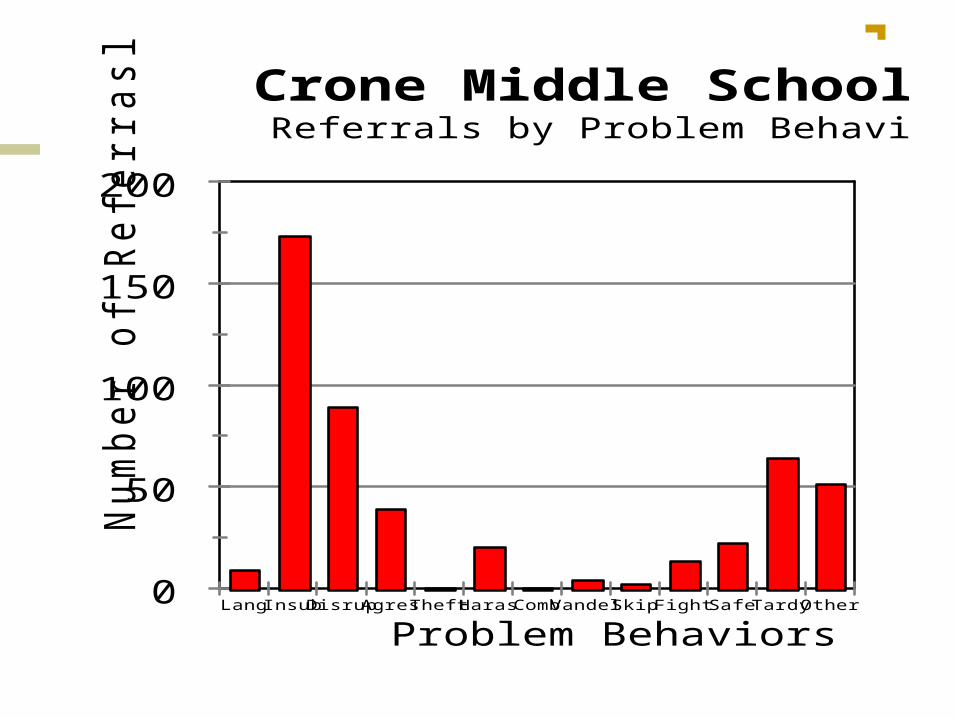
0
50
100
150
200
Num
ber
of R
efe
rrasl
Lang InsubDisrupAgresTheftHarasCombVandelSkip Fight Safe TardyOther
Problem Behaviors
Crone Middle SchoolReferrals by Problem Behavior
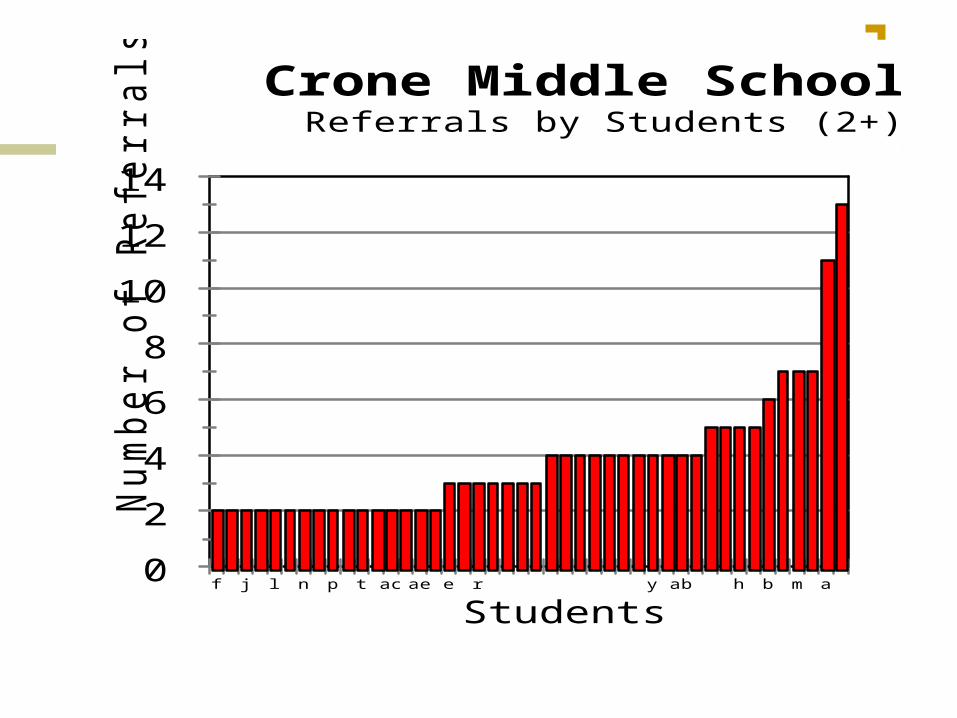
0
2
4
6
8
10
12
14
Num
ber
of R
efe
rrals
f j l n p t ac ae e r y ab h b m a
Students
Crone Middle SchoolReferrals by Students (2+)
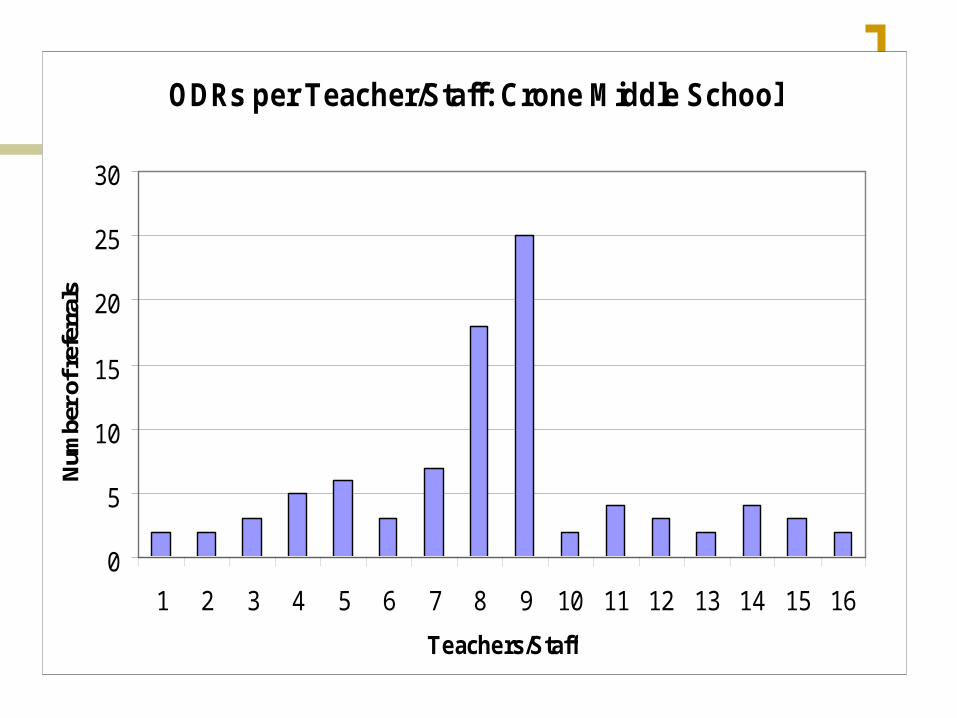
ODRs per Teacher/Staff: Crone Middle School
0
5
10
15
20
25
30
1 2 3 4 5 6 7 8 9 10 11 12 13 14 15 16
Teachers/Staff
Num
ber
of r
efer
rals
Action: Examine your own school data
USE ODR ORGANIZATION TEMPLATE Fill in the data patterns for your school
Is there a problem? What system(s) are in need of attention? What intervention options would you
recommend be considered?