Using Nagios NRPE with Zenoss - Skills 1st · Nagios is an earlier, open source system, network and...
25
1 © Skills 1st Ltd 13 May 2014 Using Nagios NRPE with Zenoss April 2014 Jane Curry Skills 1st Ltd www.skills-1st.co.uk Jane Curry Skills 1st Ltd 2 Cedar Chase Taplow Maidenhead SL6 0EU 01628 782565 [email protected]
Transcript of Using Nagios NRPE with Zenoss - Skills 1st · Nagios is an earlier, open source system, network and...

1 © Skills 1st Ltd 13 May 2014
Using Nagios NRPE with Zenoss April 2014
Jane Curry
Skills 1st Ltd
www.skills-1st.co.uk
Jane CurrySkills 1st Ltd2 Cedar ChaseTaplowMaidenheadSL6 0EU01628 782565
jane.curry@skills1st.co.uk
Synopsis
Zenoss is an agentless systems and network management offering. There are occasions when it is useful to have some form of agent; for example, if ssh is perceived to be too cumbersome or topheavy as an access protocol, or if devices beyond a firewall could be managed through a proxy agent.
Nagios is a wellknown open source systems and network management tool with a huge number of “plugins” available to manage a wide range of devices and applications. Zenoss has the ability to run Nagios plugins outofthebox. Further, Nagios has the concept of a remote agent implemented through the Nagios Remote Plugin Executor (NRPE). NRPE can run any Nagios plugin and report results back to a managing server.
This paper explores using NRPE as a Zenoss agent. Installation on CentOS and an Ubuntu platforms are discussed along with maintenance procedures. Details are provided for a number of examples of driving management from Zenoss, through NRPE, to a remote target.
The Zenoss platform is at 4.2.4. NRPE 2.145 was used on the CentOS 6.3 platform. The Ubuntu platform was 14.04.
2 © Skills 1st Ltd 13 May 2014
Table of Contents1 Introduction......................................................................................................................4
1.1 Zenoss overview.........................................................................................................41.2 Nagios overview........................................................................................................4
2 Installation........................................................................................................................52.1 Installing on RedHat / CentOS target systems.....................................................6
2.1.1 Check / install EPEL.........................................................................................62.1.2 Install NRPE and Nagios plugins....................................................................62.1.3 Configure users and permissions......................................................................72.1.4 Testing NRPE as a standalone daemon...........................................................82.1.5 Install and configure xinetd..............................................................................82.1.6 Configure nrpe.cfg..............................................................................................9
2.2 Installing nagiospluginsnrpe on the Zenoss server............................................102.3 Testing NRPE between Zenoss server and target host........................................102.4 Installing and configuring other plugins...............................................................102.5 Installation differences for an Ubuntu target.......................................................11
3 Collecting performance data with Zenoss's zencommand daemon.............................123.1 Introduction.............................................................................................................123.2 Introducing Zenoss performance monitoring........................................................123.3 Exit codes and event severity.................................................................................143.4 Gathering data with zencommand templates.......................................................17
3.4.1 Thresholds on zencommand data...................................................................194 Using Zenoss to drive NRPE monitoring......................................................................215 Conclusions.....................................................................................................................226 References.......................................................................................................................24
3 © Skills 1st Ltd 13 May 2014
1 Introduction
1.1 Zenoss overviewZenoss is a fullfeatured network and systems management tool providing:
• Device discovery
• Configuration discovery and management
• Availability monitoring
• Performance management
• Problem detection and resolution
• Alerting via email, paging or SNMP TRAPs
• Reports
Originally an open source offering (Zenoss Core), there is now a commercial edition known as Zenoss Enterprise or Zenoss Service Dynamics which includes extra extensions beyond Zenoss Core. The NRPE techniques discussed here are equally applicable to either version.
Fundamentally Zenoss is an agentless technology relying on the presence of SNMP, ssh or WMI (for Windows) on the target device. On some occasions and in some organisations ssh may be unsuitable as a protocol for running remote management. Firewalls may prohibit access; ssh may be viewed as too heavyweight, either in setup and maintenance or because of the resources required on the target machine or the Zenoss server.
1.2 Nagios overviewNagios is an earlier, open source system, network and infrastructure monitoring application offering monitoring and event services for servers, switches, applications, and services. It alerts users when things go wrong and alerts them a second time when the problem has been resolved. Monitoring relies on Nagios “plugins” code that is executed either on the monitoring server or on a remote target. There are a huge number of Nagios plugins available; they may be precompiled or source code in any language, including shellscript.
The NRPE (Nagios Remote Plugin Executor) addon is designed to allow execution of Nagios plugins on remote Linux/Unix machines. The main reason for doing this is to allow Nagios to monitor "local" resources (like CPU load, memory usage, etc) on remote machines. Since these public resources are not usually exposed to external machines, an agent like NRPE must be installed on the remote Linux/Unix machines. Communication between the monitoring server and an NRPE addon is typically
4 © Skills 1st Ltd 13 May 2014
encrypted using Secure Sockets Layer (SSL) but is fundamentally less secure than ssh.
2 InstallationThis paper will not discuss the installation of Zenoss; see http://wiki.zenoss.org/Install_Zenoss for Zenoss download and installation details. It will discuss installation of NRPE and Nagios plugins.
A Zenoss installation will usually install a directory of standard Nagios plugins , typically under /usr/lib64/nagios/plugins, on the Zenoss server. Some of these are used by the default, Zenossprovided ZenPacks; for example ZenPacks.zenoss.HttpMonitor is actually driven by the zencommand daemon running the check_http plugin. The nagios user will also have been created as part of the Zenoss installation.
5 © Skills 1st Ltd 13 May 2014
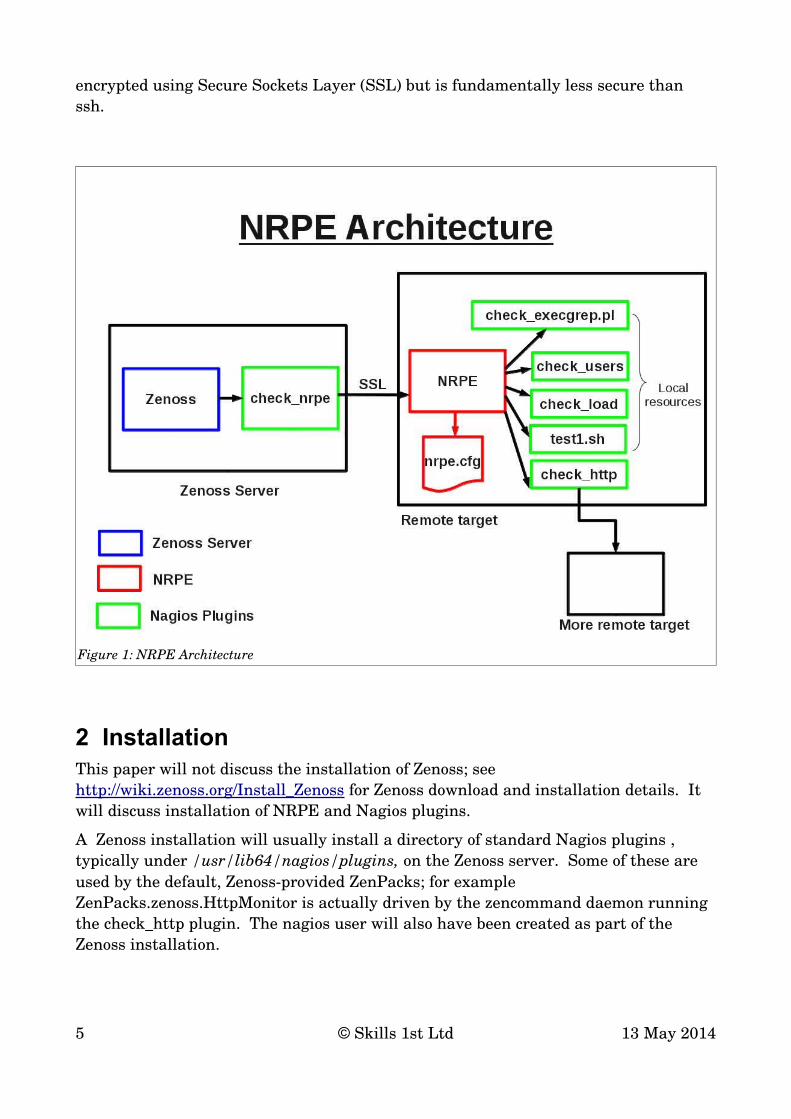
Figure 1: NRPE Architecture
To use NRPE, the nrpe package must be installed on any target system to be managed, along with any Nagios plugins that are required.
On the Zenoss server, the separate package, nagiospluginsnrpe must be installed ( note that this is not included with the nagiosplugins or nagiospluginsall packages).
There is an excellent reference document for installing NRPE at http://nagios.sourceforge.net/docs/nrpe/NRPE.pdf .
Unless otherwise stated, installation and configuration work must be done as root (or via sudo).
2.1 Installing on RedHat / CentOS target systemsRedHat / CentOS uses yum as the package installer. Use:
yum search nagios
to see whether you can find Nagios packages (you may need root or sudo authority to execute this command).
2.1.1 Check / install EPEL
Access to the Extra Packages for Enterprise Linux (EPEL) repository is often required to find Nagios packages. To see whether this is already setup, navigate to /etc/yum.repos.d and see whether there is an epel.repo file. You can inspect this file; it will probably have the epel repository disabled by default with:
enabled = 0
This is fine.
If there is no epel repository then install it.
1. Download the RPM:wget r l1 noparent A 'epel*.rpm' http://dl.fedoraproject.org/pub/epel/5/x86_64/
2. Install the RPM:yum y nogpgcheck localinstall dl.fedoraproject.org/pub/epel/5/x86_64/epel*.rpm
3. Disable automatic use of the EPEL repository by editing the /etc/yum.repos.d/epel.repo file to change the value of "enabled" in the [ epel ] stanza:
enabled = 0
If you have issues with yum, inspect the files in /etc/yum.repos.d.
2.1.2 Install NRPE and Nagios plugins
To see if a package is already installed, use the rpm command and grep:rpm q a | grep nagios
To find packages available for installation, use:yum enablerepo=epel search nagiosyum enablerepo=epel search nrpe
6 © Skills 1st Ltd 13 May 2014
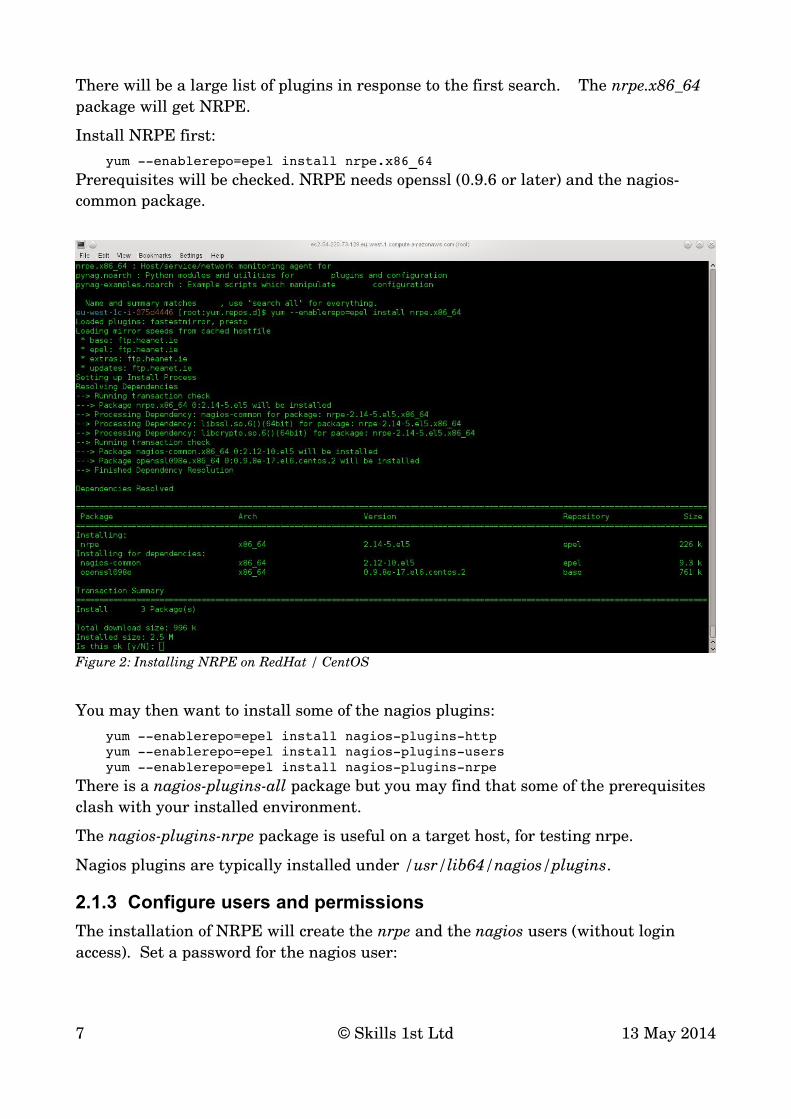
There will be a large list of plugins in response to the first search. The nrpe.x86_64 package will get NRPE.
Install NRPE first:yum enablerepo=epel install nrpe.x86_64
Prerequisites will be checked. NRPE needs openssl (0.9.6 or later) and the nagioscommon package.
You may then want to install some of the nagios plugins:yum enablerepo=epel install nagiospluginshttpyum enablerepo=epel install nagiospluginsusersyum enablerepo=epel install nagiospluginsnrpe
There is a nagiospluginsall package but you may find that some of the prerequisites clash with your installed environment.
The nagiospluginsnrpe package is useful on a target host, for testing nrpe.
Nagios plugins are typically installed under /usr/lib64/nagios/plugins.
2.1.3 Configure users and permissions
The installation of NRPE will create the nrpe and the nagios users (without login access). Set a password for the nagios user:
7 © Skills 1st Ltd 13 May 2014
Figure 2: Installing NRPE on RedHat / CentOS
passwd nagios and supply a password
Ensure that all nagios directories, subdirectories and contents are owned by the nagios user:
chown R nagios:nagios /usr/lib64/nagios
If you install extra plugins at a later stage, ensure you change ownership to nagios:nagios.
2.1.4 Testing NRPE as a standalone daemon
Start the nrpe daemon with:service nrpe start
Check with ps ef | grep nrpe that the process is running.
nrpe should run on TCP/5666 by default. Use lsof to check this:lsof i P | grep 5666
Check that nrpe can talk to itself. Default host access in nrpe.cfg permits communications from 127.0.0.1:
/usr/lib64/nagios/plugins/check_nrpe H localhost
This should return the NRPE version./usr/lib64/nagios/plugins/check_nrpe H localhost c check_users
should return the number of logged in users.
Stop the nrpe daemon with:service nrpe stop
2.1.5 Install and configure xinetd
nrpe can run as a standalone daemon but this would require that the daemon be restarted if any changes are made to the nrpe.cfg configuration file (like adding a new service to check for). Installing xinetd and then running nrpe under xinetd, removes this requirement and also makes some elements of nrpe configuration simpler.
yum install xinetd
xinetd needs a configuration file for nrpe. Create the nrpe file in /etc/xinetd.d: # default: on # description: NRPE service nrpe { flags = REUSE socket_type = stream wait = no user = nrpe server = /usr/sbin/nrpe server_args = c /etc/nagios/nrpe.cfg inetd log_on_failure += USERID disable = no only_from = 127.0.0.1 192.168.10.42
8 © Skills 1st Ltd 13 May 2014

}
The only_from line specifies hosts that may access this NRPE server.
Check that the server and server_args lines do actually reflect the locations of the nrpe binary and nrpe.cfg.
The /etc/services file should be edited to ensure the following line exists:nrpe 5666/tcp # NRPE
Make sure that the standalone nrpe service is not running and then start the xinetd service:
service xinetd start
Repeat the tests to check nrpe. xinetd should now be the process holding port 5666 in the lsof command.
Ensure that xinetd runs and brings up nrpe when the system is rebooted:chkconfig list
If xinetd is not on then turn it on with:chkconfig xinetd on
2.1.6 Configure nrpe.cfg
The configuration file for NRPE is in /etc/nagios/nrpe.cfg; it may require some modifications (though not many if you run nrpe under xinetd). Lines you might alter are:
dont_blame_nrpe=0 # determines whether arguments can be passed to nrpeallowed_hosts=127.0.0.1,192.168.10.42 # hosts that can access nrpe daemondebug=0 # debugging to syslog 1 sets debugging oncommand_timeout=60 # time nrpe allows a plugin to completeinclude_dir=/etc/nrpe.d/ # recursive directory for .cfg files
Towards the end of nrpe.cfg are the commands that nrpe will accept. Those that are active by default are:
# The following examples use hardcoded command arguments...command[check_users]=/usr/lib64/nagios/plugins/check_users w 5 c 10command[check_load]=/usr/lib64/nagios/plugins/check_load w 15,10,5 c 30,25,20command[check_hda1]=/usr/lib64/nagios/plugins/check_disk w 20% c 10% p /dev/hda1command[check_zombie_procs]=/usr/lib64/nagios/plugins/check_procs w 5 c 10 s Zcommand[check_total_procs]=/usr/lib64/nagios/plugins/check_procs w 150 c 200
There is a second set of commands, commented out, that permit arguments to be supplied to nrpe, provided the dont_blame_nrpe parameter is set to 1.#command[check_users]=/usr/lib64/nagios/plugins/check_users w $ARG1$ c $ARG2$#command[check_load]=/usr/lib64/nagios/plugins/check_load w $ARG1$ c $ARG2$#command[check_disk]=/usr/lib64/nagios/plugins/check_disk w $ARG1$ c $ARG2$ p $ARG3$#command[check_procs]=/usr/lib64/nagios/plugins/check_procs w $ARG1$ c $ARG2$ s $ARG3$
To test passing arguments, uncomment this check_users line and comment out the earlier one. You should not need to restart anything as xinetd should handle changes automatically. Test with:
/usr/lib64/nagios/plugins/check_nrpe H localhost c check_users a 10 20
9 © Skills 1st Ltd 13 May 2014
If it fails, do ensure that you have set dont_blame_nrpe to 1.
If you are likely to make changes to the commands that can be run, it would be advantageous to separate the command definitions into a separate include_dir. For example, change nrpe.cfg for:
include_dir=/etc/nagios/commands
Create the commands subdirectory under /etc/nagios and create a new file (that must end in .cfg) in this directory, with all the commands; remove the existing commands from nrpe.cfg.
2.2 Installing nagios-plugins-nrpe on the Zenoss serverTo interact with a target host using NRPE, the Zenoss server simply needs the nagiospluginsnrpe package installed. The /usr/lib64/nagios/plugins directory should already exist. It is likely that the EPEL repository will also be installed. Simply install the plugin, as root, with:
yum enablerepo=epel install nagiospluginsnrpe
Check that check_nrpe exists in /usr/lib64/nagios/plugins and ensure that it is owned by nagios:nagios.
2.3 Testing NRPE between Zenoss server and target hostIf firewalls exist in the environment, ensure access is permitted from the Zenoss server to the target on TCP/5666.
If nrpe is run under xinetd, ensure that the /etc/xinetd.d/nrpe file permits access from the Zenoss server in the only_from line. If nrpe is run standalone, ensure that nrpe.cfg permits access from the Zenoss server in the allowed_hosts line and that the nrpe daemon has been restarted.
As a basic test, if you have telnet on the Zenoss server, try:telnet <target host> 5666
You should get a connection.
Test with:/usr/lib64/nagios/plugins/check_nrpe H <target>
You should get the NRPE version returned./usr/lib64/nagios/plugins/check_nrpe H <target> c check_users a 10 20
You should get the number of users returned.
Note that the c parameter must be the command label in the nrpe configuration file (ie. the entry in square brackets), which is not necessarily the name of the plugin.
2.4 Installing and configuring other pluginsThere are a huge number of Nagios plugins available. Try http://exchange.nagios.org/directory/Plugins#/ as a starting point.
10 © Skills 1st Ltd 13 May 2014
An interesting example is check_execgrep.pl http://exchange.nagios.org/directory/Plugins/OperatingSystems/Linux/checkgrepcommandoutput/details . Download the file from the website into /usr/lib64/nagios/plugins on the target system and ensure that it is owned by nagios and is executable. Usage is provided by:
/usr/lib64/nagios/plugins check_execgrep.pl help
Edit the nrpe.cfg (or the included commands file) and add a sample line like (all on one line):
command[check_grep_test]=/usr/lib64/nagios/plugins/check_execgrep.pl contains NO warning $ARG1$ critical $ARG2$ command /bin/cat parameter $ARG3$
This specifies that three parameters should be supplied. The first is a string that will generate a warning if the string does not exist ( contains NO); the second parameter is a string that will generate a critical error if it does not exist. The third parameter specifies the file to check.
Create a little test file, test_egrep.tx in /usr/lib64/nagios/plugins (it doesn't have to be in this directory; it can be anywhere provided the test command matches it). Edit the file to contain the strings WaRnInG and bad.
Test locally with (all on one line):/usr/lib64/nagios/plugins/check_nrpe H localhost c check_grep_test a WaRnInG bad /usr/lib64/nagios/plugins/test_egrep.tx
You should get an OK status.
Change the test to misspell the file to check you should get an error code.
Check with misspelled WaRnIng and BaD you should get WARNING and CRITICAL return codes respectively.
Test from the Zenoss server. All you need to do is run the same test commands, changing the H localhost to reflect the target device. Nothing needs installing on the Zenoss server.
2.5 Installation differences for an Ubuntu targetThese tests were made on Ubuntu 14.04, Trusty Tahr.
The installation command is aptget rather than yum.
The package names are slightly different for Ubuntu:
• nagiospluginsbasic basic set of plugins
• nagiosnrpeserver the nrpe daemon, with prerequisite of openssl
• nagiosnrpeplugin this has lots of prereqs on Ubuntu
The nagiosnrpeplugin package has a huge number of prerequisites, including most of Nagios itself. It may not be worth installing as it is only used for local testing.
sudo aptget install nagiospluginsbasic
11 © Skills 1st Ltd 13 May 2014
sudo aptget install nagiosnrpeserversudo aptget install xinetd
Installing nagiospluginsbasic does not create any users. The base directory for plugins is /usr/lib/nagios/plugins (note no 64 on the lib).
Installing nagiosnrpeserver creates the nagios user; no nrpe user is created.
When creating the /etc/xinetd.d/nrpe file, make sure you change the user line from nrpe to nagios:
user = nagios
On Ubuntu, services can be stopped and started with:/etc/init.d/nagiosnrpeserver start/etc/init.d/xinetd start
Services can be started and stopped after a reboot using updaterc.d:sudo updaterc.d xinetd defaults
Take care with configuration files when referencing the plugins directory ensure you use lib, not lib64.
Other than these differences, the instructions for the RedHat / CentOS operating system should work for Ubuntu.
3 Collecting performance data with Zenoss's zencommand daemon
3.1 IntroductionThis section provides an introduction to the way Zenoss collects performance data; knowledgeable Zenoss users may care to skip some parts. It also discusses in detail the effect of the exit status of a script, which may be less wellknown material, especially in the context of running Nagios plugins.
This section does not address nrpe; that will be covered in the next section.
3.2 Introducing Zenoss performance monitoringZenoss has a number of daemons designed to gather performance information using different protocols eg:
• zenperfsnmp uses SNMP
• zenwinperf uses WMI
• zencommand uses ssh or local shellscript commands
12 © Skills 1st Ltd 13 May 2014
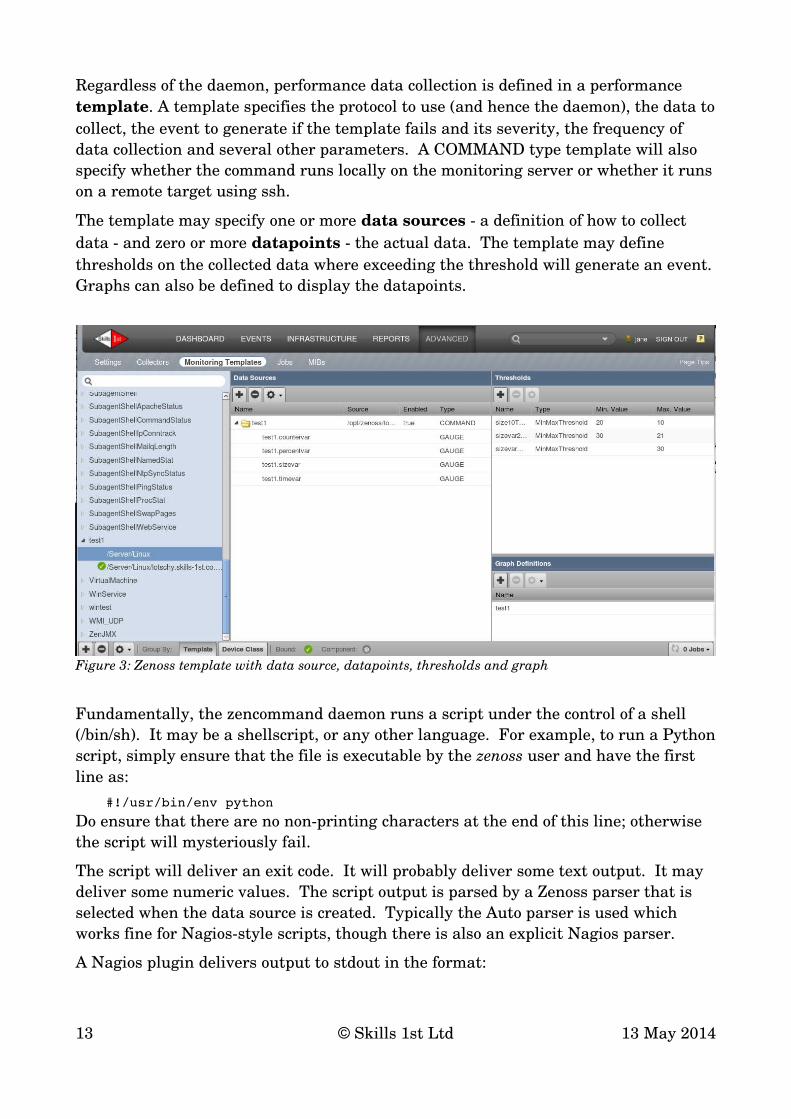
Regardless of the daemon, performance data collection is defined in a performance template. A template specifies the protocol to use (and hence the daemon), the data to collect, the event to generate if the template fails and its severity, the frequency of data collection and several other parameters. A COMMAND type template will also specify whether the command runs locally on the monitoring server or whether it runs on a remote target using ssh.
The template may specify one or more data sources a definition of how to collect data and zero or more datapoints the actual data. The template may define thresholds on the collected data where exceeding the threshold will generate an event. Graphs can also be defined to display the datapoints.
Fundamentally, the zencommand daemon runs a script under the control of a shell (/bin/sh). It may be a shellscript, or any other language. For example, to run a Python script, simply ensure that the file is executable by the zenoss user and have the first line as:
#!/usr/bin/env python
Do ensure that there are no nonprinting characters at the end of this line; otherwise the script will mysteriously fail.
The script will deliver an exit code. It will probably deliver some text output. It may deliver some numeric values. The script output is parsed by a Zenoss parser that is selected when the data source is created. Typically the Auto parser is used which works fine for Nagiosstyle scripts, though there is also an explicit Nagios parser.
A Nagios plugin delivers output to stdout in the format:
13 © Skills 1st Ltd 13 May 2014
Figure 3: Zenoss template with data source, datapoints, thresholds and graph
<text string> | <var1>=<value1> <var2=value2> By convention, the text string would usually include an indication of the success of the script though this does not affect the return code. If you want an explicit return code, it must be coded.
The text string appears in any event that Zenoss generates. The <var>=<value> pairs return data from the script. It is essential that when a Zenoss data source is created with datapoints, that the datapoint names match exactly the var names delivered from the script.
A template is generally defined at a device class so that it may apply to all devices in that class. It can be overridden locally, as desired.
A template must be bound before it actually does anything. If it is bound to a device class then all devices in that class (and any devices subsequently added to that class) will automatically start using the template. Alternatively, a template may only be bound to specific devices.
3.3 Exit codes and event severityConsider this little shellscript:
#!/bin/sh# Nagios return codesSTATE_OK=0STATE_WARNING=1STATE_CRITICAL=2STATE_UNKNOWN=3##exitstatus=$STATE_OK#exitstatus=$STATE_WARNINGexitstatus=$STATE_CRITICAL
# Nagios format echos information and status followed by pipe |# followed by <var name>=<value> tuples# Note that Zenoss datapoints must match these var names exactly##echo "This is a test status OK | timevar=1s sizevar=31B percentvar=10% \ countervar=123c"#echo "This is a test status WARNING | timevar=1s sizevar=22B \ percentvar=10% countervar=123c"echo "This is a test status CRITICAL | timevar=1s sizevar=31B \ percentvar=10% countervar=123c"exit $exitstatus
Four Nagios return codes are defined and the script explicitly exits with one of these. The Zenoss 4 Administrators Guide section 6.3 describes the workings of zencommand and how exit status from a script is treated by Zenoss (as Zenoss severities differ from Nagios severities):
14 © Skills 1st Ltd 13 May 2014
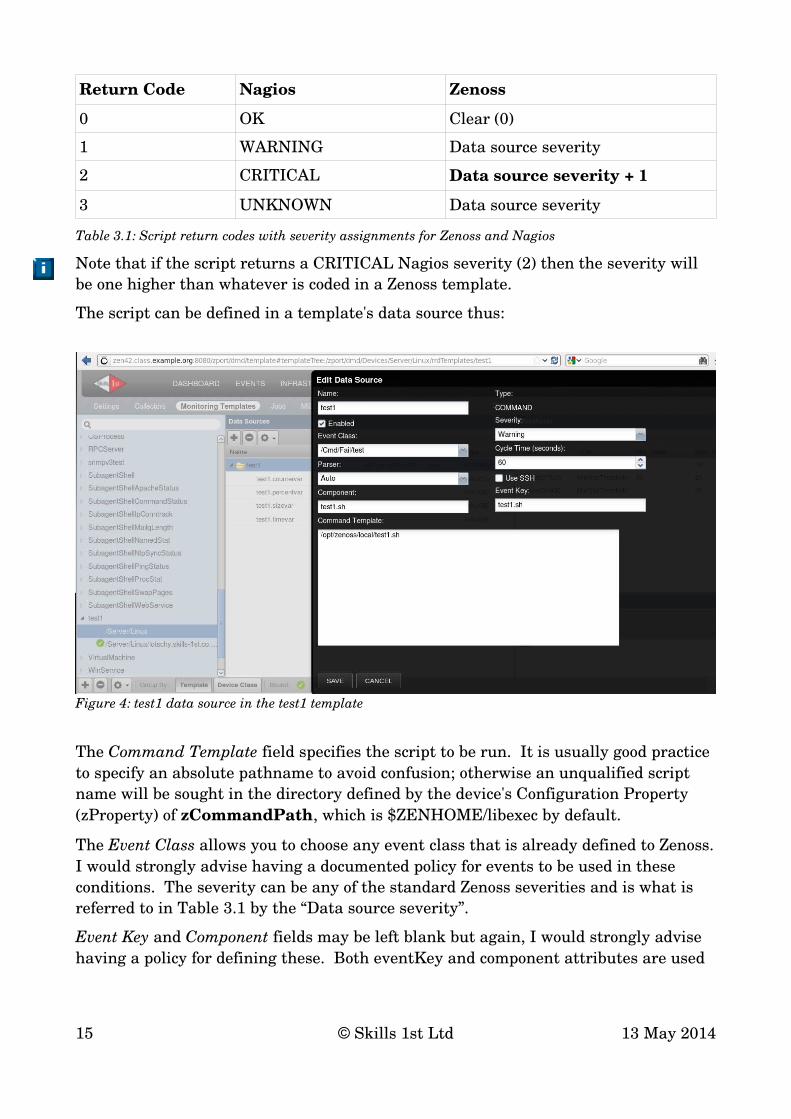
Return Code Nagios Zenoss
0 OK Clear (0)
1 WARNING Data source severity
2 CRITICAL Data source severity + 1
3 UNKNOWN Data source severity
Table 3.1: Script return codes with severity assignments for Zenoss and Nagios
Note that if the script returns a CRITICAL Nagios severity (2) then the severity will be one higher than whatever is coded in a Zenoss template.
The script can be defined in a template's data source thus:
The Command Template field specifies the script to be run. It is usually good practice to specify an absolute pathname to avoid confusion; otherwise an unqualified script name will be sought in the directory defined by the device's Configuration Property (zProperty) of zCommandPath, which is $ZENHOME/libexec by default.
The Event Class allows you to choose any event class that is already defined to Zenoss. I would strongly advise having a documented policy for events to be used in these conditions. The severity can be any of the standard Zenoss severities and is what is referred to in Table 3.1 by the “Data source severity”.
Event Key and Component fields may be left blank but again, I would strongly advise having a policy for defining these. Both eventKey and component attributes are used
15 © Skills 1st Ltd 13 May 2014
Figure 4: test1 data source in the test1 template
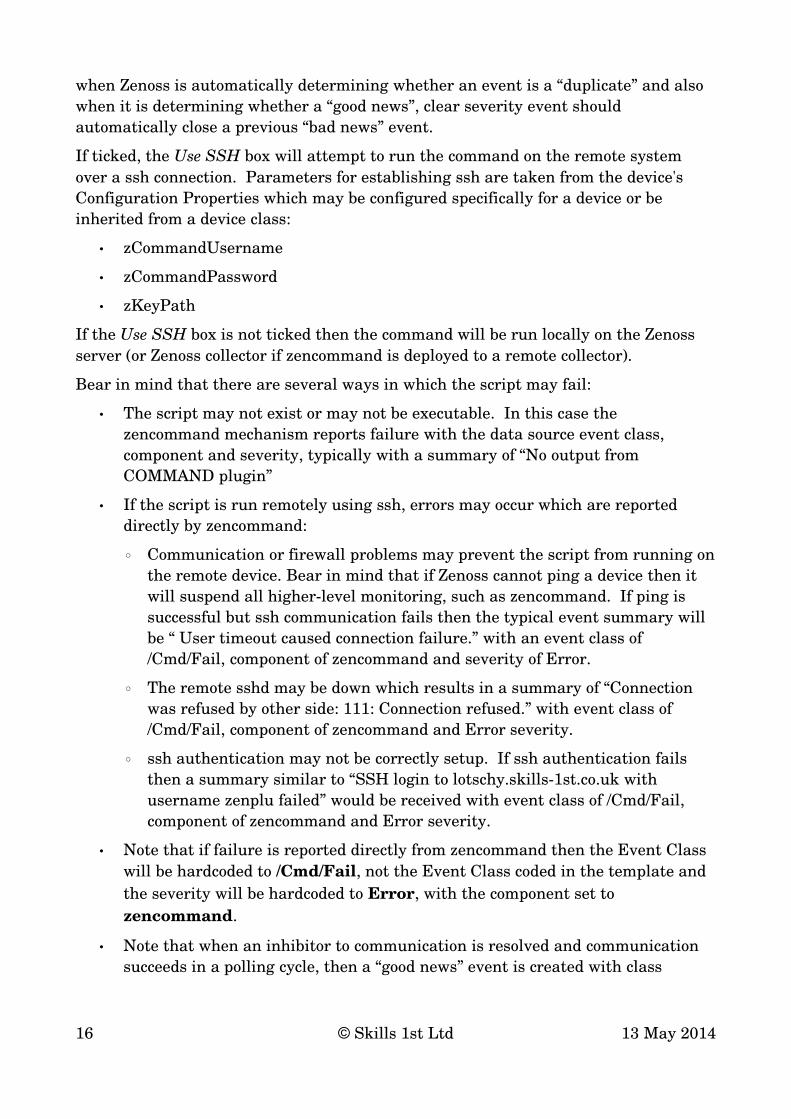
when Zenoss is automatically determining whether an event is a “duplicate” and also when it is determining whether a “good news”, clear severity event should automatically close a previous “bad news” event.
If ticked, the Use SSH box will attempt to run the command on the remote system over a ssh connection. Parameters for establishing ssh are taken from the device's Configuration Properties which may be configured specifically for a device or be inherited from a device class:
• zCommandUsername
• zCommandPassword
• zKeyPath
If the Use SSH box is not ticked then the command will be run locally on the Zenoss server (or Zenoss collector if zencommand is deployed to a remote collector).
Bear in mind that there are several ways in which the script may fail:
• The script may not exist or may not be executable. In this case the zencommand mechanism reports failure with the data source event class, component and severity, typically with a summary of “No output from COMMAND plugin”
• If the script is run remotely using ssh, errors may occur which are reported directly by zencommand:
◦ Communication or firewall problems may prevent the script from running on the remote device. Bear in mind that if Zenoss cannot ping a device then it will suspend all higherlevel monitoring, such as zencommand. If ping is successful but ssh communication fails then the typical event summary will be “ User timeout caused connection failure.” with an event class of /Cmd/Fail, component of zencommand and severity of Error.
◦ The remote sshd may be down which results in a summary of “Connection was refused by other side: 111: Connection refused.” with event class of /Cmd/Fail, component of zencommand and Error severity.
◦ ssh authentication may not be correctly setup. If ssh authentication fails then a summary similar to “SSH login to lotschy.skills1st.co.uk with username zenplu failed” would be received with event class of /Cmd/Fail, component of zencommand and Error severity.
• Note that if failure is reported directly from zencommand then the Event Class will be hardcoded to /Cmd/Fail, not the Event Class coded in the template and the severity will be hardcoded to Error, with the component set to zencommand.
• Note that when an inhibitor to communication is resolved and communication succeeds in a polling cycle, then a “good news” event is created with class
16 © Skills 1st Ltd 13 May 2014
/Cmd/Fail, component of zencommand and severity of Clear; this clearing event will automatically close any “bad news” events with the same device, event class, component and eventKey.
• The script may run but not deliver any result, perhaps because it is a longrunning script; in this case the summary will be similar to “Datasource test1/test1 command timed out” and the event class, component and severity will be that configured in the data source. Note that there is no configurable timeout in a COMMAND template, only a cycle time. The timeout is determined from the zCommandCommandTimeout Configuration Property of the device. The default is 15s.
• The script may run and return an exit code that is nonzero.
◦ If the exit code is WARNING (1) or UNKNOWN (3) then an event will be generated with the event class, severity and component from the template's data source.
◦ If the exit code is CRITICAL (1) then an event will be generated with the event class and component of the data source and with a severity one higher than that coded in the data source.
• If the script runs successfully it will generate an event with the event class and component of the data source and with a severity of Clear (0); its eventState attribute in the Event Console will be Closed. This event will automatically clear any “bad news” events with the same device, event class, component and eventKey. The cleared event will then have an eventState of Cleared (not Closed). Clearing events that do not clear any other event, are silently dropped.
3.4 Gathering data with zencommand templatesA script can deliver numeric data to the zencommand daemon. A Nagios plugin must deliver output to stdout in the format:
<text string> | <var1>=<value1> <var2=value2>where the numeric data follows a vertical bar (pipe symbol) with spaceseparated var=value pairs. Documentation on Nagios plugins output (see https://www.monitoringplugins.org/doc/guidelines.html ) gives a wider definition than this for the values:
'label'=value[UOM];[warn];[crit];[min];[max]where warn,crit, min and max refer to the Nagios critical and warning thresholds that may have been set. Zenoss does not use these Nagios thresholds and will ignore such fields if a plugin provides them.
The UOM is Unit of Measurement and will be interpreted by the Zenoss Nagios (or Auto) parser:
17 © Skills 1st Ltd 13 May 2014

UOM (Unit Of Measurement) is one of:
• No unit specified assume a number (int or float) of things (eg, users, processes, load averages)
• s seconds (also us, ms)
• % percentage
• B bytes (also KB, MB, TB)
• c a continuous counter (such as bytes transmitted on an interface)
When the data source is created in a Zenoss performance template, datapoints must be created with exactly the same names as the variable labels.
Note that when you create these datapoints, you simply specify the variable label name; Zenoss will then “fullyqualify” the name of the datapoint by prepending the data source name to it. The datapoint type must be one of:
• COUNTER
• GAUGE
• DERIVE
• ABSOLUTE
A GAUGE is useful where values may go up or down; a COUNTER is an everincreasing integer (except when it wraps around). DERIVE is strongly recommended to represent COUNTER values provided the RRD Minimum field is set to zero; this caters for a counter which wraps around.
18 © Skills 1st Ltd 13 May 2014
Figure 5: Datapoints for test1 data source in test1 template
These datapoints will then be populated into Round Robin Database (RRD) files by zencommand, when the command script supplies values. The files will be under $ZENHOME/perf/Devices/<device name> where each datapoint has an individual file whose name will be <data source>_<datapoint>.rrd . Note that component templates (such as FileSystem or interface templates) may create rrd files in a lower subdirectory, typically under os or hw.
The datapoints can then be used to create Zenoss thresholds and to graph the data.
3.4.1 Thresholds on zencommand data
Any performance template may have one or more thresholds setup for sampled data; the mechanism is identical regardless of the daemon that collects it.
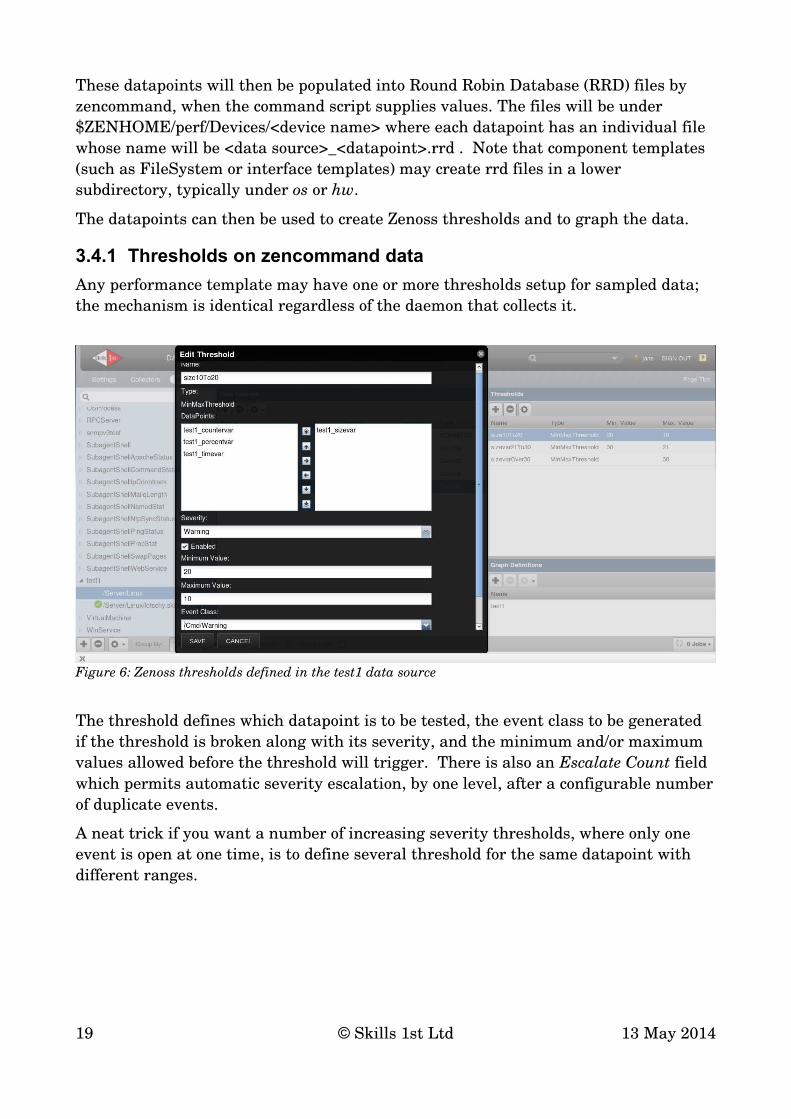
The threshold defines which datapoint is to be tested, the event class to be generated if the threshold is broken along with its severity, and the minimum and/or maximum values allowed before the threshold will trigger. There is also an Escalate Count field which permits automatic severity escalation, by one level, after a configurable number of duplicate events.
A neat trick if you want a number of increasing severity thresholds, where only one event is open at one time, is to define several threshold for the same datapoint with different ranges.
19 © Skills 1st Ltd 13 May 2014
Figure 6: Zenoss thresholds defined in the test1 data source
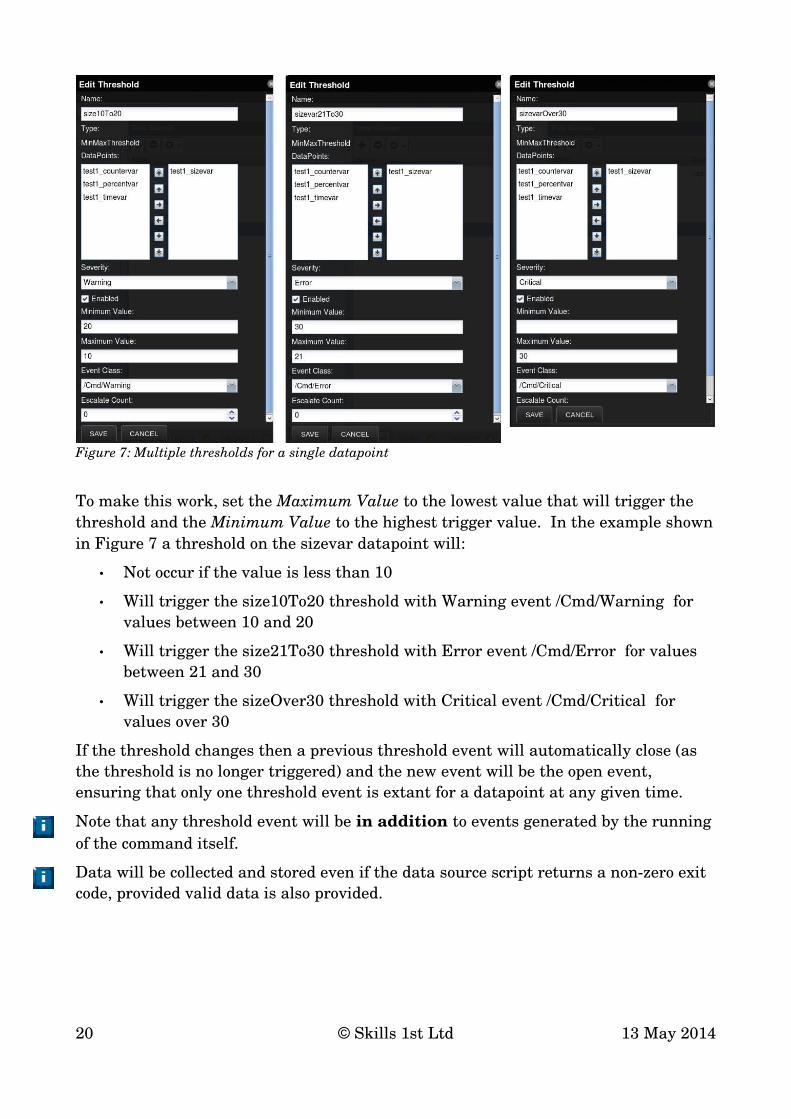
To make this work, set the Maximum Value to the lowest value that will trigger the threshold and the Minimum Value to the highest trigger value. In the example shown in Figure 7 a threshold on the sizevar datapoint will:
• Not occur if the value is less than 10
• Will trigger the size10To20 threshold with Warning event /Cmd/Warning for values between 10 and 20
• Will trigger the size21To30 threshold with Error event /Cmd/Error for values between 21 and 30
• Will trigger the sizeOver30 threshold with Critical event /Cmd/Critical for values over 30
If the threshold changes then a previous threshold event will automatically close (as the threshold is no longer triggered) and the new event will be the open event, ensuring that only one threshold event is extant for a datapoint at any given time.
Note that any threshold event will be in addition to events generated by the running of the command itself.
Data will be collected and stored even if the data source script returns a nonzero exit code, provided valid data is also provided.
20 © Skills 1st Ltd 13 May 2014
Figure 7: Multiple thresholds for a single datapoint
4 Using Zenoss to drive NRPE monitoringThe example performance monitoring discussed in the previous section ran a script either locally on the Zenoss server, or on a remote target host using ssh. If it is felt that ssh is too heavy a mechanism for remote monitoring, NRPE could be used as a remote agent on the target. This section assumes that NRPE communication has been setup and tested between Zenoss server and remote target, as described in section 2.
Performance templates will be very similar to those described earlier but data source commands will all run locally on the Zenoss server and will be an invocation of the check_nrpe plugin.
Copy the little test1.sh script to the remote target into /usr/lib64/nagios/plugins; ensure it is owned by nagios and is executable.
On the remote target, add a line to the NRPE configuration for the new command:command[check_test1]=/usr/lib64/nagios/plugins/test1.sh
Test from the Zenoss server with:/usr/lib64/nagios/plugins/check_nrpe H <target> c check_test1
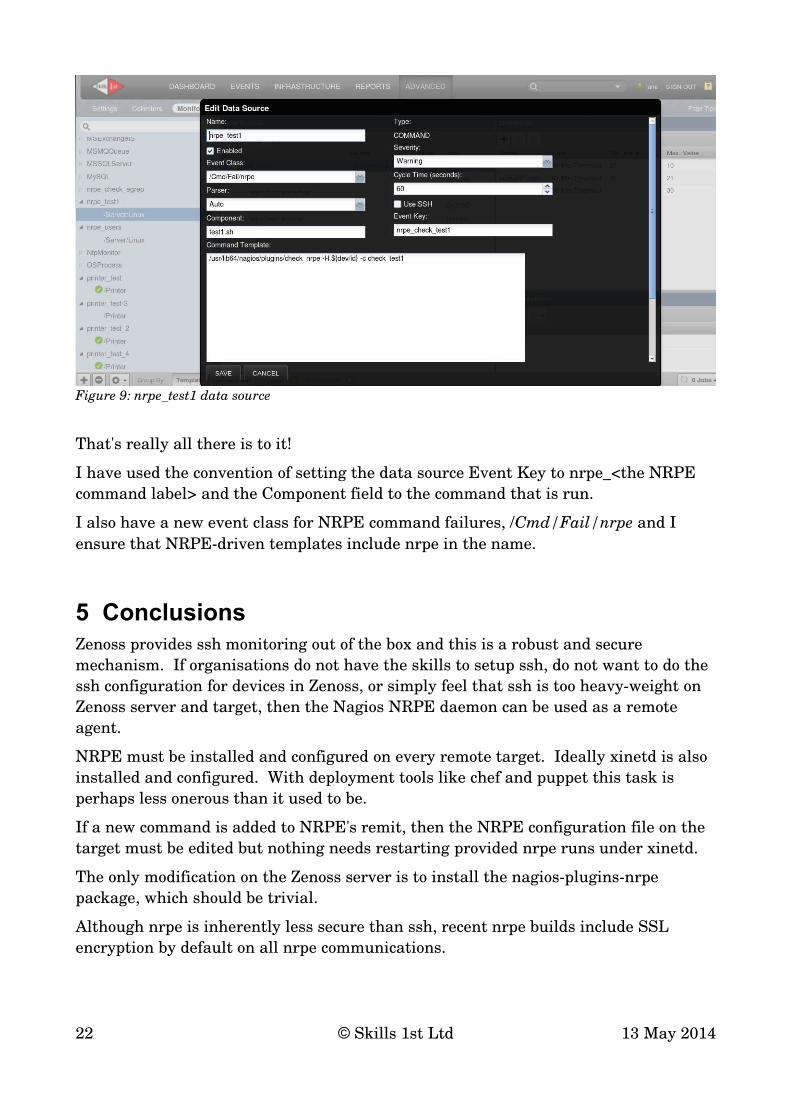
Create a template, nrpe_test1, with a data source nrpe_test1 with the same datapoints, thresholds and graphs as shown in section 3. Note that the fullyqualified datapoint names will be different from the earlier template because the datasource has a different name.
The command will need to drive the check_nrpe plugin and the target device will be provided with the TALES expression ${dev/id} which will substitute the name of the device as the H parameter.
Note that the Use SSH box is not ticked.
21 © Skills 1st Ltd 13 May 2014
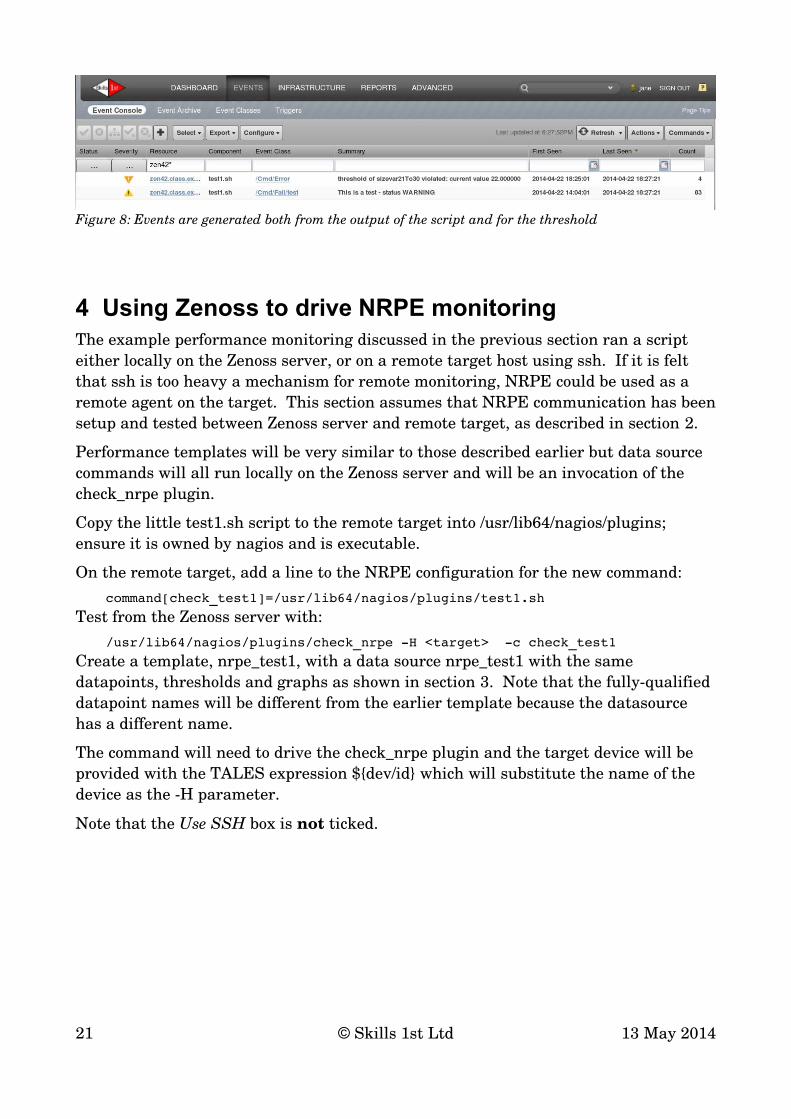
Figure 8: Events are generated both from the output of the script and for the threshold
That's really all there is to it!
I have used the convention of setting the data source Event Key to nrpe_<the NRPE command label> and the Component field to the command that is run.
I also have a new event class for NRPE command failures, /Cmd/Fail/nrpe and I ensure that NRPEdriven templates include nrpe in the name.
5 ConclusionsZenoss provides ssh monitoring out of the box and this is a robust and secure mechanism. If organisations do not have the skills to setup ssh, do not want to do the ssh configuration for devices in Zenoss, or simply feel that ssh is too heavyweight on Zenoss server and target, then the Nagios NRPE daemon can be used as a remote agent.
NRPE must be installed and configured on every remote target. Ideally xinetd is also installed and configured. With deployment tools like chef and puppet this task is perhaps less onerous than it used to be.
If a new command is added to NRPE's remit, then the NRPE configuration file on the target must be edited but nothing needs restarting provided nrpe runs under xinetd.
The only modification on the Zenoss server is to install the nagiospluginsnrpe package, which should be trivial.
Although nrpe is inherently less secure than ssh, recent nrpe builds include SSL encryption by default on all nrpe communications.
22 © Skills 1st Ltd 13 May 2014
Figure 9: nrpe_test1 data source

Care must be taken if nrpe is allowed to process supplied arguments as vulnerabilities can creep in here; see http://www.exploitdb.com/exploits/32925/ .
As a migration tool from Nagios to Zenoss, or as a coexistence tool, NRPE has a lot to offer.
23 © Skills 1st Ltd 13 May 2014
6 References1. Zenoss community site http://www.zenoss.org/ and Zenoss community wiki
http://wiki.zenoss.org/Main_Page
2. Zenoss network, systems and application monitoring commercial site http://www.zenoss.com/
3. Zenoss documentation main page http://wiki.zenoss.org/Zenoss_Core_4.2.x
4. Zenoss Administrators Guide for Zenoss 4 http://sourceforge.net/projects/zenoss/files/Documentation/zenoss4.2.xdocs/zendocs4.2.4/Zenoss_Core_Administration_020620134.2v06.pdf/download
5. Zenoss installation information http://wiki.zenoss.org/Install_Zenoss
6. Nagios main site http://www.nagios.org/
7. Official Nagios plugins site http://nagiosplugins.org/
8. Community Nagios plugins http://exchange.nagios.org/directory/Plugins#/
9. Nagios NRPE documentation http://nagios.sourceforge.net/docs/nrpe/NRPE.pdf
10.NRPE vulnerability notification http://www.exploitdb.com/exploits/32925/
11.Nagios plugin documentation https://www.monitoringplugins.org/doc/guidelines.html
12.
24 © Skills 1st Ltd 13 May 2014
About the authorJane Curry has been a network and systems management technical consultant and trainer for 25 years. During her 11 years working for IBM she fulfilled both presales and consultancy roles spanning the full range of IBM's SystemView products prior to 1996 and then, when IBM bought Tivoli, she specialised in the systems management products of Distributed Monitoring & IBM Tivoli Monitoring (ITM), the network management product, Tivoli NetView and the problem management product Tivoli Enterprise Console (TEC). All are based around the Tivoli Framework architecture.
Since 1997 Jane has been an independent businesswoman working with many companies, both large and small, commercial and public sector, delivering Tivoli consultancy and training. Over the last 6 years her work has been more involved with Open Source offerings, especially Zenoss.
She has developed a number of ZenPack addons to Zenoss Core and has a large number of local and remote consultancy clients for Zenoss customisation and development. She has also created several workshop offerings to augment Zenoss's own educational offerings. She is a frequent contributor to the Zenoss forums and IRC chat conversations and was made a Zenoss Master by Zenoss in February 2009
25 © Skills 1st Ltd 13 May 2014