Using NAFI viewing maps of current · PDF fileUsing NAFI – viewing maps of current fires...
19
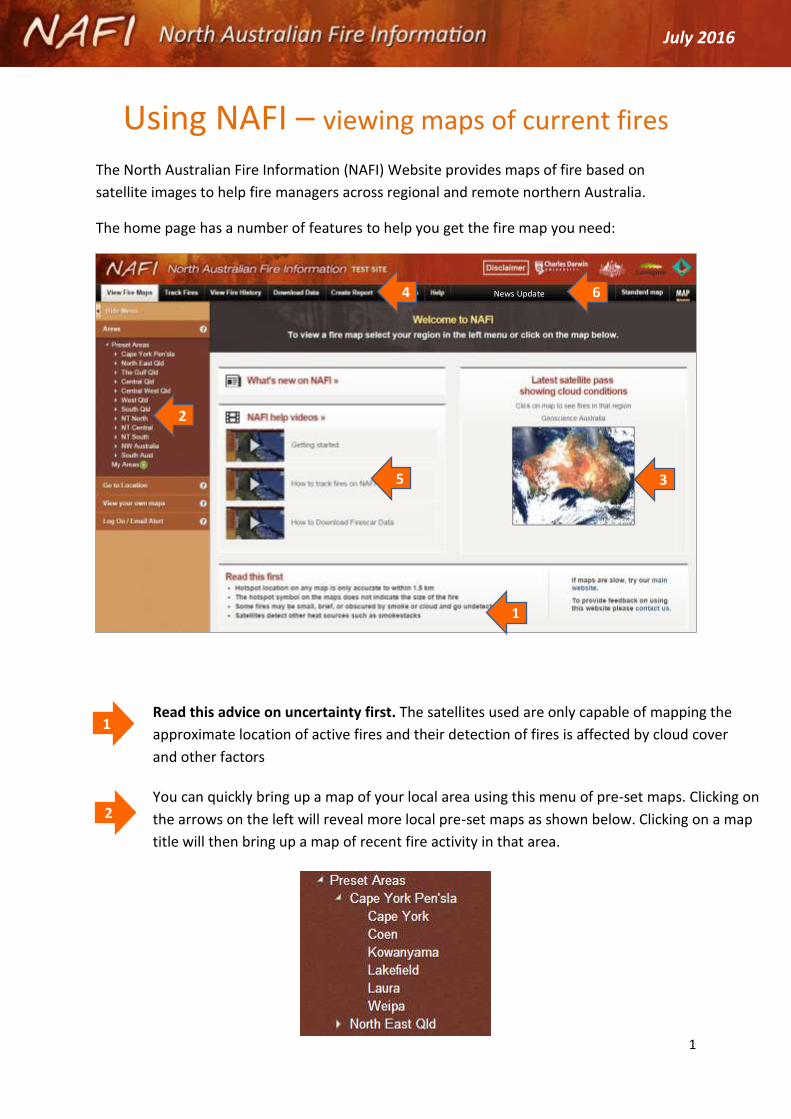
1 Using NAFI – viewing maps of current fires The North Australian Fire Information (NAFI) Website provides maps of fire based on satellite images to help fire managers across regional and remote northern Australia. The home page has a number of features to help you get the fire map you need: 1 2 3 4 5 1 Read this advice on uncertainty first. The satellites used are only capable of mapping the approximate location of active fires and their detection of fires is affected by cloud cover and other factors You can quickly bring up a map of your local area using this menu of pre-set maps. Clicking on the arrows on the left will reveal more local pre-set maps as shown below. Clicking on a map title will then bring up a map of recent fire activity in that area. 6 2 News Update July 2016
Transcript of Using NAFI viewing maps of current · PDF fileUsing NAFI – viewing maps of current fires...
1
Using NAFI – viewing maps of current fires The North Australian Fire Information (NAFI) Website provides maps of fire based on
satellite images to help fire managers across regional and remote northern Australia.
The home page has a number of features to help you get the fire map you need:
1
2
3
4
5
1 Read this advice on uncertainty first. The satellites used are only capable of mapping the
approximate location of active fires and their detection of fires is affected by cloud cover
and other factors
You can quickly bring up a map of your local area using this menu of pre-set maps. Clicking on
the arrows on the left will reveal more local pre-set maps as shown below. Clicking on a map
title will then bring up a map of recent fire activity in that area.
6
2
News Update
July 2016
2
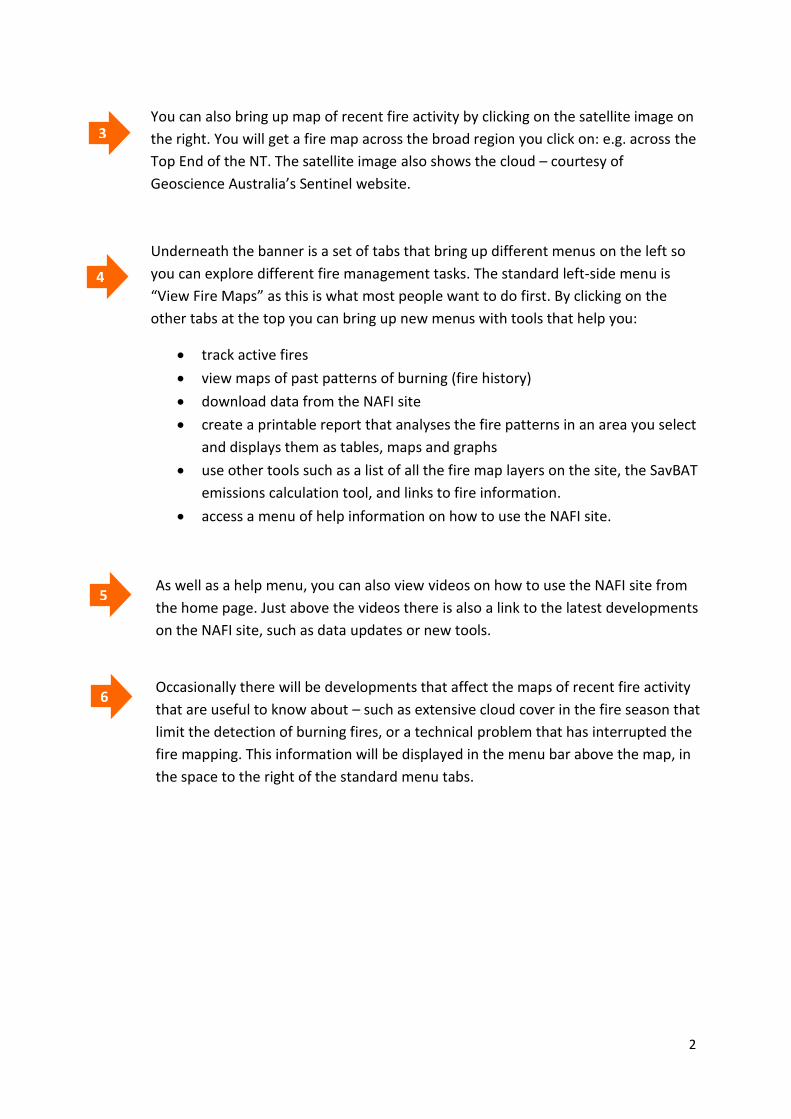
You can also bring up map of recent fire activity by clicking on the satellite image on
the right. You will get a fire map across the broad region you click on: e.g. across the
Top End of the NT. The satellite image also shows the cloud – courtesy of
Geoscience Australia’s Sentinel website.
Underneath the banner is a set of tabs that bring up different menus on the left so
you can explore different fire management tasks. The standard left-side menu is
“View Fire Maps” as this is what most people want to do first. By clicking on the
other tabs at the top you can bring up new menus with tools that help you:
track active fires
view maps of past patterns of burning (fire history)
download data from the NAFI site
create a printable report that analyses the fire patterns in an area you select
and displays them as tables, maps and graphs
use other tools such as a list of all the fire map layers on the site, the SavBAT
emissions calculation tool, and links to fire information.
access a menu of help information on how to use the NAFI site.
As well as a help menu, you can also view videos on how to use the NAFI site from
the home page. Just above the videos there is also a link to the latest developments
on the NAFI site, such as data updates or new tools.
Occasionally there will be developments that affect the maps of recent fire activity
that are useful to know about – such as extensive cloud cover in the fire season that
limit the detection of burning fires, or a technical problem that has interrupted the
fire mapping. This information will be displayed in the menu bar above the map, in
the space to the right of the standard menu tabs.
3
4
5
6
3
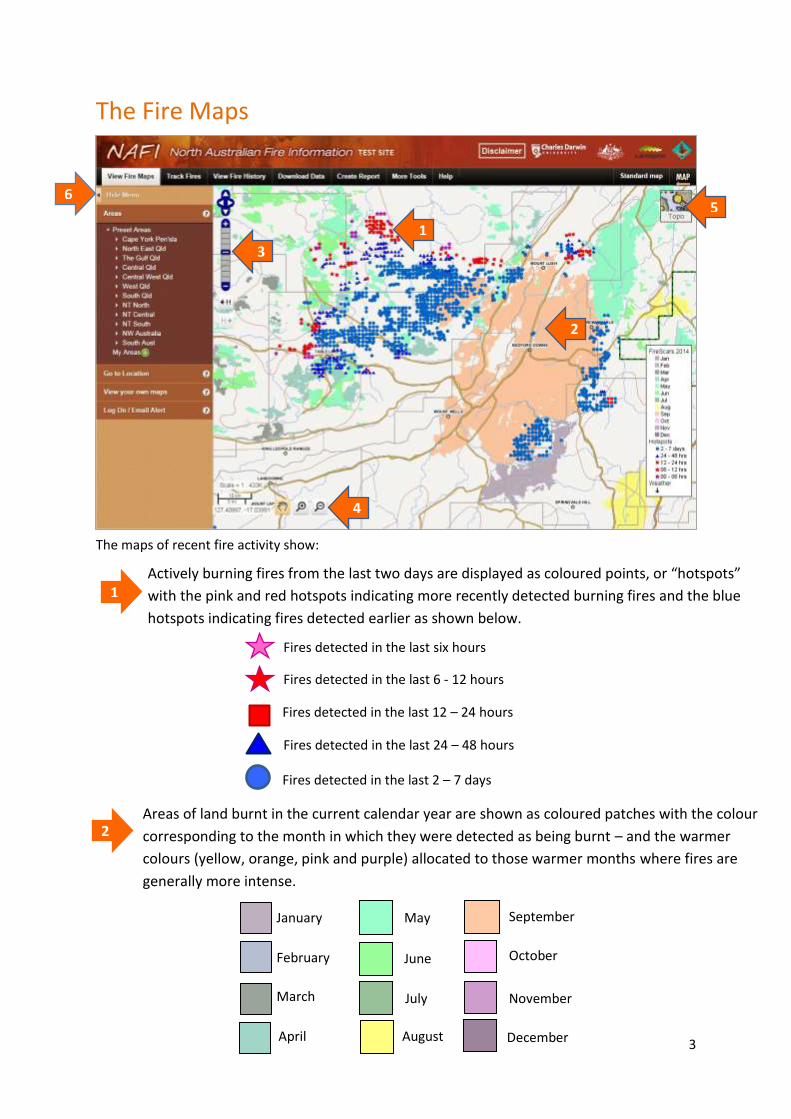
The Fire Maps
The maps of recent fire activity show:
1
1 Actively burning fires from the last two days are displayed as coloured points, or “hotspots”
with the pink and red hotspots indicating more recently detected burning fires and the blue
hotspots indicating fires detected earlier as shown below.
Fires detected in the last six hours
Fires detected in the last 6 - 12 hours
Fires detected in the last 12 – 24 hours
Fires detected in the last 24 – 48 hours
2
2
Areas of land burnt in the current calendar year are shown as coloured patches with the colour
corresponding to the month in which they were detected as being burnt – and the warmer
colours (yellow, orange, pink and purple) allocated to those warmer months where fires are
generally more intense.
April August
January
February
March
May
June
July
September
October
November
December
3
4
6
5
Fires detected in the last 2 – 7 days
4
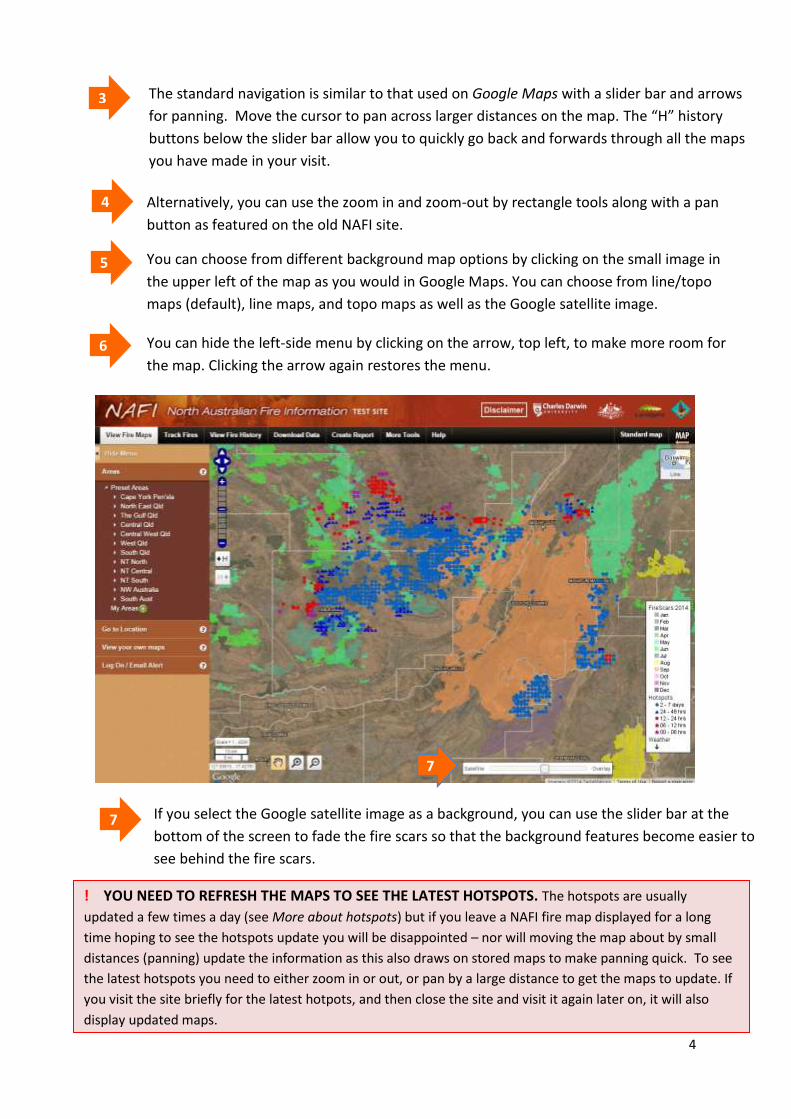
3 The standard navigation is similar to that used on Google Maps with a slider bar and arrows
for panning. Move the cursor to pan across larger distances on the map. The “H” history
buttons below the slider bar allow you to quickly go back and forwards through all the maps
you have made in your visit.
4
You can choose from different background map options by clicking on the small image in
the upper left of the map as you would in Google Maps. You can choose from line/topo
maps (default), line maps, and topo maps as well as the Google satellite image.
5
You can hide the left-side menu by clicking on the arrow, top left, to make more room for
the map. Clicking the arrow again restores the menu.
7
7 If you select the Google satellite image as a background, you can use the slider bar at the
bottom of the screen to fade the fire scars so that the background features become easier to
see behind the fire scars.
! YOU NEED TO REFRESH THE MAPS TO SEE THE LATEST HOTSPOTS. The hotspots are usually
updated a few times a day (see More about hotspots) but if you leave a NAFI fire map displayed for a long
time hoping to see the hotspots update you will be disappointed – nor will moving the map about by small
distances (panning) update the information as this also draws on stored maps to make panning quick. To see
the latest hotspots you need to either zoom in or out, or pan by a large distance to get the maps to update. If
you visit the site briefly for the latest hotpots, and then close the site and visit it again later on, it will also
display updated maps.
6
Alternatively, you can use the zoom in and zoom-out by rectangle tools along with a pan
button as featured on the old NAFI site.
5
More about hotspots
How accurately are the hotspots mapped?
The locations of the hotpots on the map are accurate to within approximately a kilometre of
their actual location. This error may be greater under some conditions.
The great majority of hotspots represent actual fires or heat sources such as smokestacks.
Occasionally hotspots may be triggered by very hot rock surfaces, smoke plumes or errors in the
automated process that detects the hotspots from a satellite image. In the latter case, the
hotspots may appear in a line running diagonally across the map. These are usually removed as
soon as they are detected.
How frequently updated are the hotspots?
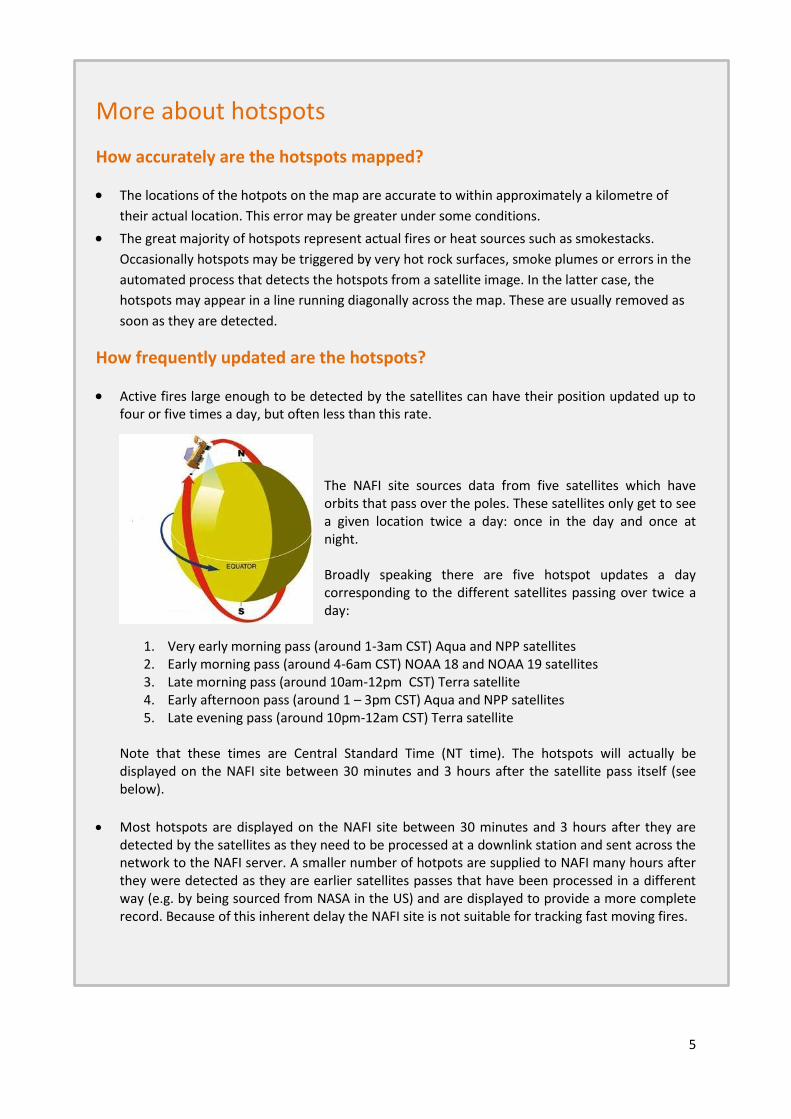
Active fires large enough to be detected by the satellites can have their position updated up to four or five times a day, but often less than this rate.
The NAFI site sources data from five satellites which have orbits that pass over the poles. These satellites only get to see a given location twice a day: once in the day and once at night. Broadly speaking there are five hotspot updates a day corresponding to the different satellites passing over twice a day:
1. Very early morning pass (around 1-3am CST) Aqua and NPP satellites 2. Early morning pass (around 4-6am CST) NOAA 18 and NOAA 19 satellites 3. Late morning pass (around 10am-12pm CST) Terra satellite 4. Early afternoon pass (around 1 – 3pm CST) Aqua and NPP satellites 5. Late evening pass (around 10pm-12am CST) Terra satellite
Note that these times are Central Standard Time (NT time). The hotspots will actually be displayed on the NAFI site between 30 minutes and 3 hours after the satellite pass itself (see below).
Most hotspots are displayed on the NAFI site between 30 minutes and 3 hours after they are
detected by the satellites as they need to be processed at a downlink station and sent across the network to the NAFI server. A smaller number of hotpots are supplied to NAFI many hours after they were detected as they are earlier satellites passes that have been processed in a different way (e.g. by being sourced from NASA in the US) and are displayed to provide a more complete record. Because of this inherent delay the NAFI site is not suitable for tracking fast moving fires.

6
More about fire scars
How accurately are the fire scars mapped?
The mapped fire scars are usually a more comprehensive and accurate record of burning than the
record of hotspots. The burnt areas are mapped from satellite images of fire that have a pixel size of
250m – a recently burnt area is shown in false-colour
red at left. This contrasts with the approx. 1 km.
resolution of the hotspot mapping.
This 250m resolution is suitable for broadly mapping
the areas burnt by large open-country fires, but it
won’t pick up the smaller scale patchiness that often
characterises early dry season fires.
Each year the NAFI fire scar mapping is compared
with the actual burnt areas through aerial surveys
and show that in the savanna landscapes the
mapping is between 85-90% accurate. The accuracy
drops in the more wooded, moister northern and
coastal regions – and in the more developed landscapes further south.
How frequently are the fire scars mapped – and how accurately are they
dated?
In the northern fire season, the fire scar mapping in a given area of the fire-prone far north (north of
20 degrees South) is usually updated once a week – occasionally twice a week.
The mapping is done manually with the operator using software that compares the most recent
satellite image to earlier ones and picks out the changes in dark areas – which may be new burnt
areas. Operator knowledge and pattern-matching software refine the fire scar mapping.
Because there may be a few days to a week between the two images that are compared to detect
new fire scars, it is uncertain exactly when in that interval the new burns detected actually occurred.
If the interval between the two images covers the end of one month and the beginning of the other,
then the fire scar is given the colour corresponding to the month with the most days in the interval.
So, the cut-off date between one month and the next in the fire scar mapping is only approximate
for most months.
July-August cut-off
The exception is the cut-off date between July and August as this is important for Carbon Farming
Initiative Savanna Burning projects. By selecting the appropriate images, the NAFI mappers ensure
that their mapping identifies all July fire scars correctly and does not assign August scars to July.
7
Tracking Fires
Beyond locating fires, the NAFI site can also be used to get more information on the
behaviour of an active fire. The tools for this are found in the Track Fires menu – click the
tab to the right of the View Fire Maps tab. You should then see the left hand menu with the
various tools for tracking fires.
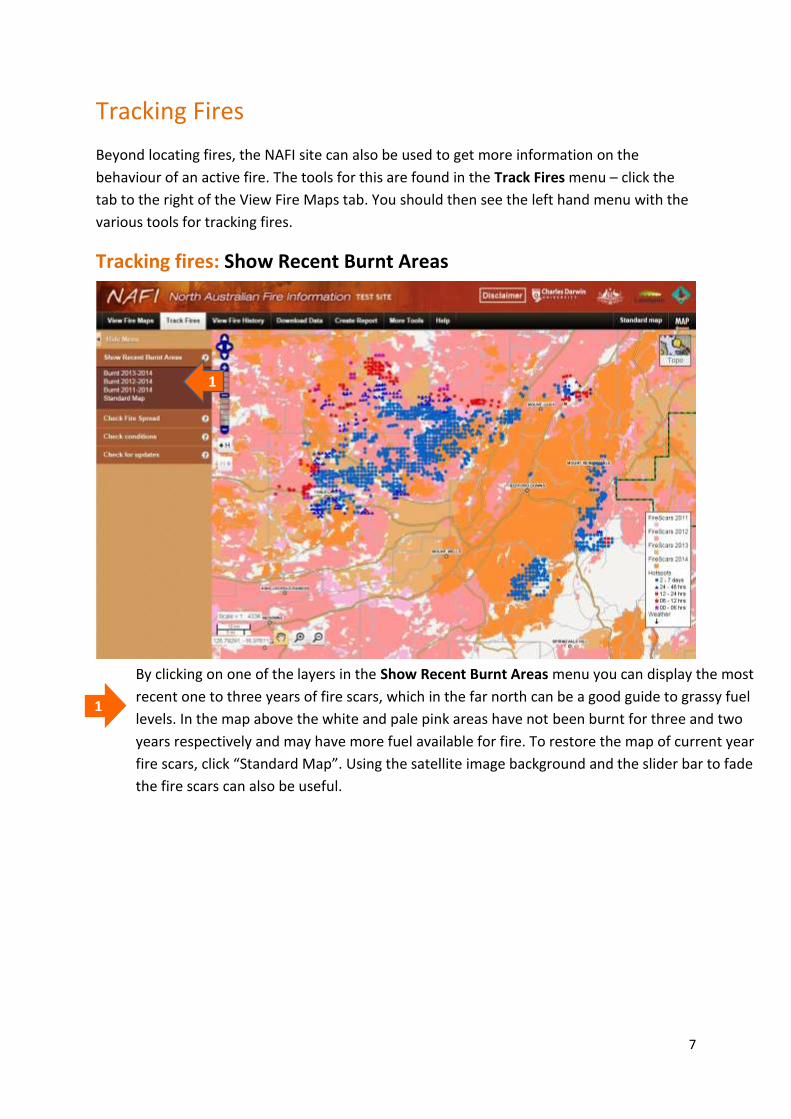
Tracking fires: Show Recent Burnt Areas
1
1
By clicking on one of the layers in the Show Recent Burnt Areas menu you can display the most
recent one to three years of fire scars, which in the far north can be a good guide to grassy fuel
levels. In the map above the white and pale pink areas have not been burnt for three and two
years respectively and may have more fuel available for fire. To restore the map of current year
fire scars, click “Standard Map”. Using the satellite image background and the slider bar to fade
the fire scars can also be useful.
8
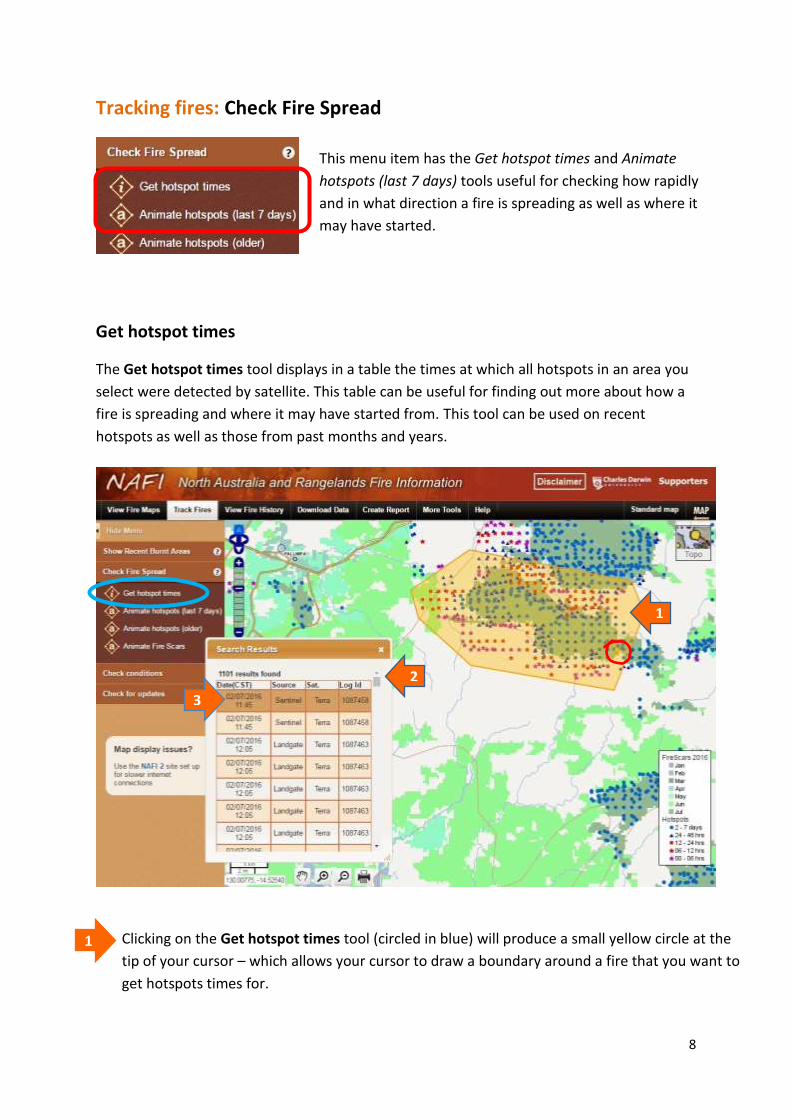
Tracking fires: Check Fire Spread
Get hotspot times
The Get hotspot times tool displays in a table the times at which all hotspots in an area you
select were detected by satellite. This table can be useful for finding out more about how a
fire is spreading and where it may have started from. This tool can be used on recent
hotspots as well as those from past months and years.
This menu item has the Get hotspot times and Animate
hotspots (last 7 days) tools useful for checking how rapidly
and in what direction a fire is spreading as well as where it
may have started.
1
2
3
1 Clicking on the Get hotspot times tool (circled in blue) will produce a small yellow circle at the
tip of your cursor – which allows your cursor to draw a boundary around a fire that you want to
get hotspots times for.
9
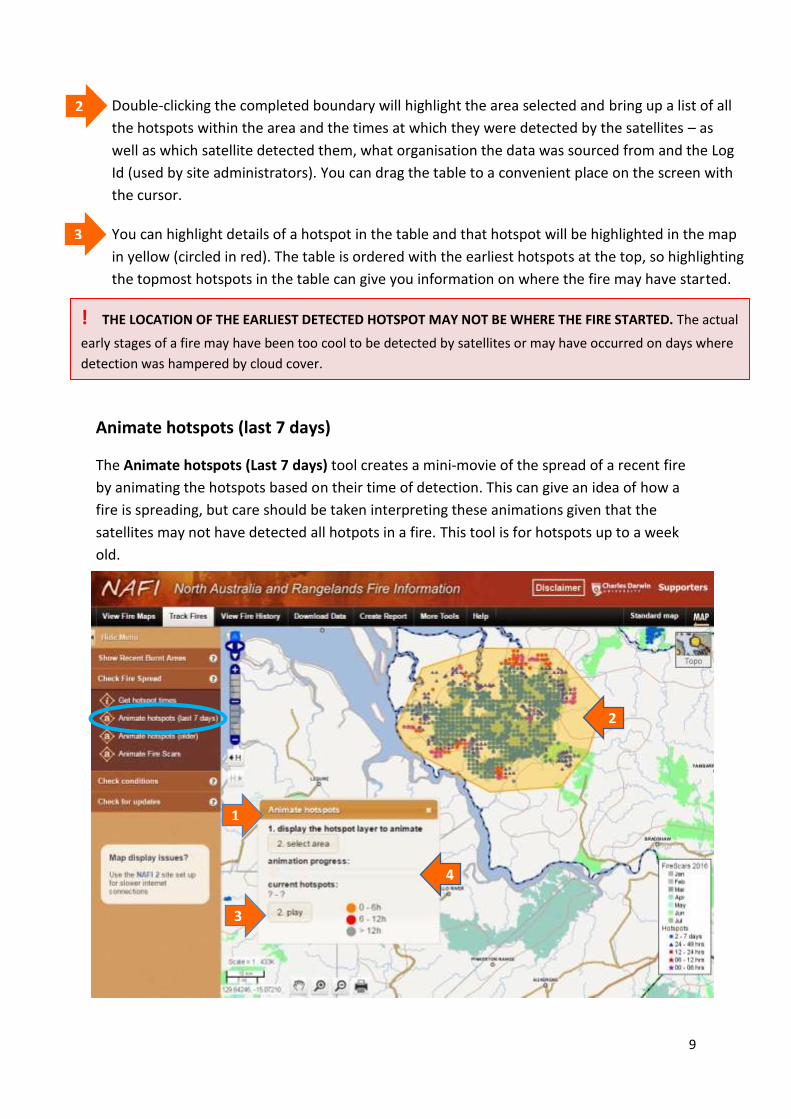
Animate hotspots (last 7 days)
The Animate hotspots (Last 7 days) tool creates a mini-movie of the spread of a recent fire
by animating the hotspots based on their time of detection. This can give an idea of how a
fire is spreading, but care should be taken interpreting these animations given that the
satellites may not have detected all hotpots in a fire. This tool is for hotspots up to a week
old.
2
3
Double-clicking the completed boundary will highlight the area selected and bring up a list of all
the hotspots within the area and the times at which they were detected by the satellites – as
well as which satellite detected them, what organisation the data was sourced from and the Log
Id (used by site administrators). You can drag the table to a convenient place on the screen with
the cursor.
You can highlight details of a hotspot in the table and that hotspot will be highlighted in the map
in yellow (circled in red). The table is ordered with the earliest hotspots at the top, so highlighting
the topmost hotspots in the table can give you information on where the fire may have started.
! THE LOCATION OF THE EARLIEST DETECTED HOTSPOT MAY NOT BE WHERE THE FIRE STARTED. The actual
early stages of a fire may have been too cool to be detected by satellites or may have occurred on days where
detection was hampered by cloud cover.
1
2
3
4
10
1
2
3
4
Clicking on the Animate hotspots (Last 7 days) tool (circled in blue) will bring up a panel at
the bottom of the screen – you can drag this with the cursor if you need to position it next
to your hotspots of interest.
The first step is a link that reminds you to display the appropriate hotspots to animate in
the map window if you haven’t already navigated there.
Next, click the “2. select area” button on the panel and you will be able to draw a boundary
around the hotspots of interest. Double-click to highlight the area.
Then click the “3. play” button on the panel to start the animation of the hotspots in the
highlighted area. This may take a little while as the “loading” symbol displays in the lower right
of the map, but soon you should see the slider bar move across the panel as the hotspots are
cycled through the colours orange (0-6 hours after detection), red (6-12 hours after detection)
and grey (over 12 hours after detection).
After the animation has played you can grab the slider bar with the cursor and move the
animation back in time to analyse the fire spread in more detail.
! THE ANIMATION MAY NOT PROVIDE A FULL VIEW OF FIRE SPREAD. Because the satellites may not have
detected all the hotspots associated with a fire due to cloud cover or other conditions, the animations of fire
spread should be interpreted with caution.
11
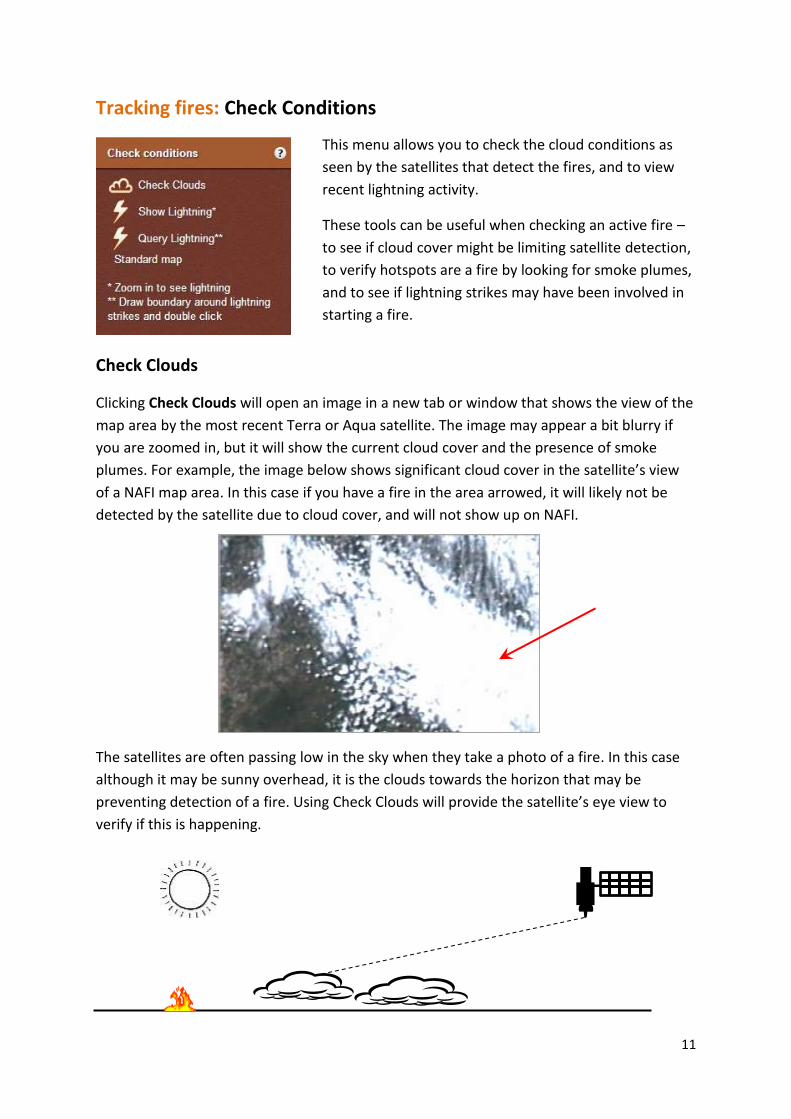
Tracking fires: Check Conditions
Check Clouds
Clicking Check Clouds will open an image in a new tab or window that shows the view of the
map area by the most recent Terra or Aqua satellite. The image may appear a bit blurry if
you are zoomed in, but it will show the current cloud cover and the presence of smoke
plumes. For example, the image below shows significant cloud cover in the satellite’s view
of a NAFI map area. In this case if you have a fire in the area arrowed, it will likely not be
detected by the satellite due to cloud cover, and will not show up on NAFI.
The satellites are often passing low in the sky when they take a photo of a fire. In this case
although it may be sunny overhead, it is the clouds towards the horizon that may be
preventing detection of a fire. Using Check Clouds will provide the satellite’s eye view to
verify if this is happening.
This menu allows you to check the cloud conditions as
seen by the satellites that detect the fires, and to view
recent lightning activity.
These tools can be useful when checking an active fire –
to see if cloud cover might be limiting satellite detection,
to verify hotspots are a fire by looking for smoke plumes,
and to see if lightning strikes may have been involved in
starting a fire.
12
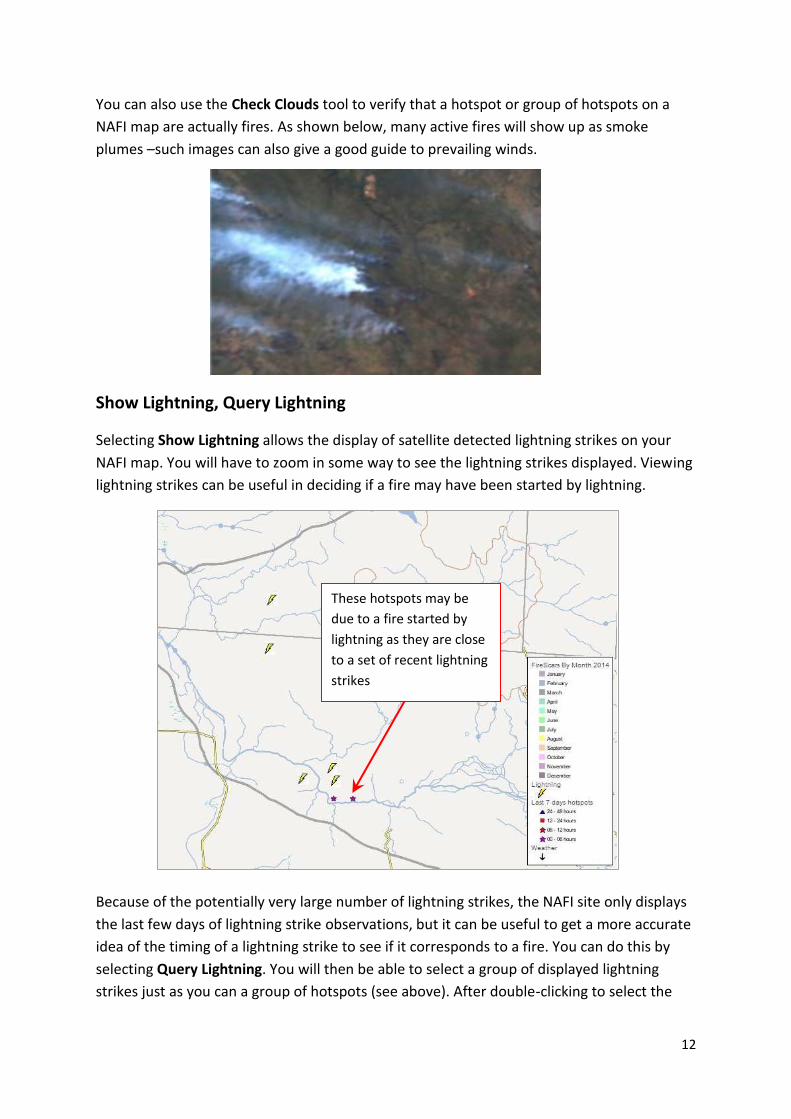
You can also use the Check Clouds tool to verify that a hotspot or group of hotspots on a
NAFI map are actually fires. As shown below, many active fires will show up as smoke
plumes –such images can also give a good guide to prevailing winds.
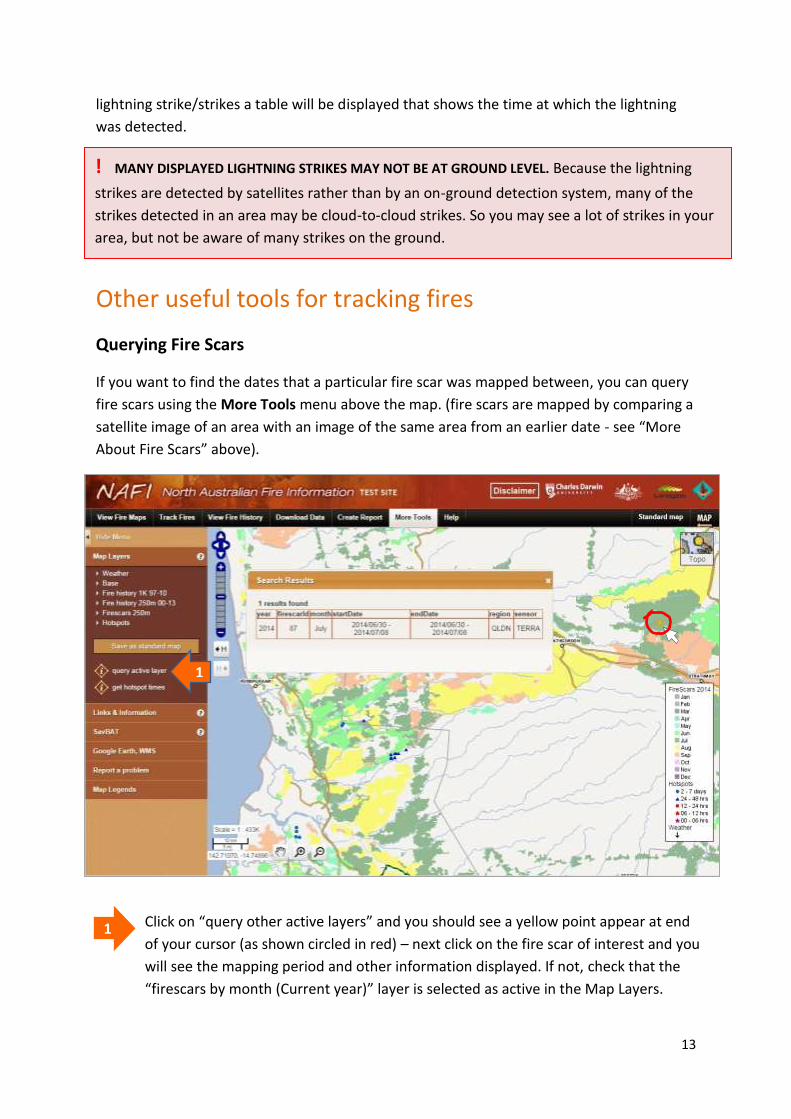
Show Lightning, Query Lightning
Selecting Show Lightning allows the display of satellite detected lightning strikes on your
NAFI map. You will have to zoom in some way to see the lightning strikes displayed. Viewing
lightning strikes can be useful in deciding if a fire may have been started by lightning.
Because of the potentially very large number of lightning strikes, the NAFI site only displays
the last few days of lightning strike observations, but it can be useful to get a more accurate
idea of the timing of a lightning strike to see if it corresponds to a fire. You can do this by
selecting Query Lightning. You will then be able to select a group of displayed lightning
strikes just as you can a group of hotspots (see above). After double-clicking to select the
These hotspots may be
due to a fire started by
lightning as they are close
to a set of recent lightning
strikes
13
lightning strike/strikes a table will be displayed that shows the time at which the lightning
was detected.
Other useful tools for tracking fires
Querying Fire Scars
If you want to find the dates that a particular fire scar was mapped between, you can query
fire scars using the More Tools menu above the map. (fire scars are mapped by comparing a
satellite image of an area with an image of the same area from an earlier date - see “More
About Fire Scars” above).
! MANY DISPLAYED LIGHTNING STRIKES MAY NOT BE AT GROUND LEVEL. Because the lightning
strikes are detected by satellites rather than by an on-ground detection system, many of the
strikes detected in an area may be cloud-to-cloud strikes. So you may see a lot of strikes in your
area, but not be aware of many strikes on the ground.
1 Click on “query other active layers” and you should see a yellow point appear at end
of your cursor (as shown circled in red) – next click on the fire scar of interest and you
will see the mapping period and other information displayed. If not, check that the
“firescars by month (Current year)” layer is selected as active in the Map Layers.
1
14
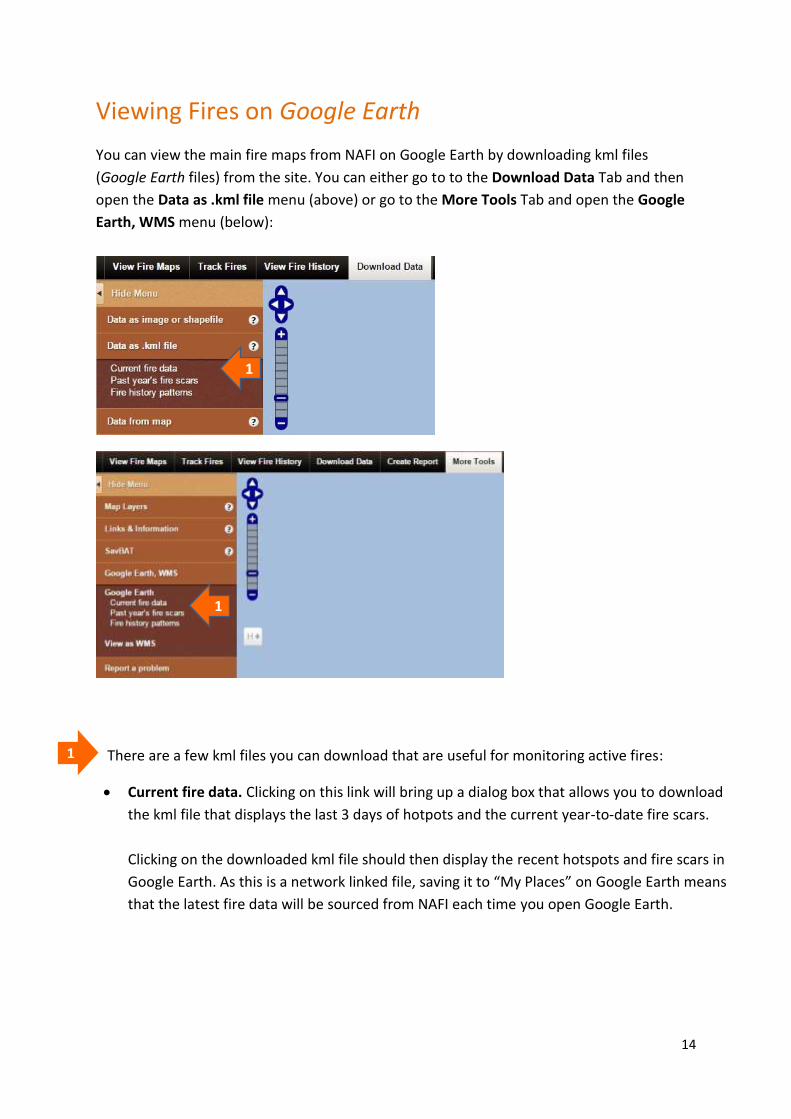
Viewing Fires on Google Earth
You can view the main fire maps from NAFI on Google Earth by downloading kml files
(Google Earth files) from the site. You can either go to to the Download Data Tab and then
open the Data as .kml file menu (above) or go to the More Tools Tab and open the Google
Earth, WMS menu (below):
1 There are a few kml files you can download that are useful for monitoring active fires:
Current fire data. Clicking on this link will bring up a dialog box that allows you to download
the kml file that displays the last 3 days of hotpots and the current year-to-date fire scars.
Clicking on the downloaded kml file should then display the recent hotspots and fire scars in
Google Earth. As this is a network linked file, saving it to “My Places” on Google Earth means
that the latest fire data will be sourced from NAFI each time you open Google Earth.
1
1
15
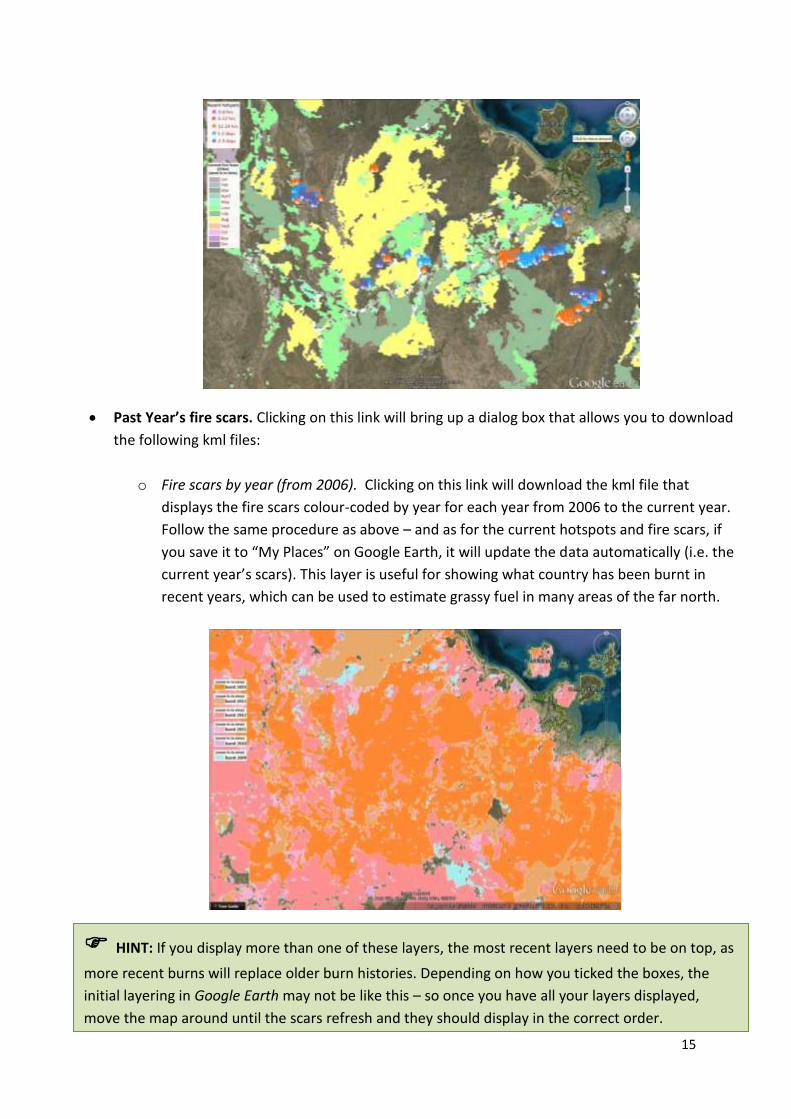
Past Year’s fire scars. Clicking on this link will bring up a dialog box that allows you to download
the following kml files:
o Fire scars by year (from 2006). Clicking on this link will download the kml file that
displays the fire scars colour-coded by year for each year from 2006 to the current year.
Follow the same procedure as above – and as for the current hotspots and fire scars, if
you save it to “My Places” on Google Earth, it will update the data automatically (i.e. the
current year’s scars). This layer is useful for showing what country has been burnt in
recent years, which can be used to estimate grassy fuel in many areas of the far north.
HINT: If you display more than one of these layers, the most recent layers need to be on top, as
more recent burns will replace older burn histories. Depending on how you ticked the boxes, the
initial layering in Google Earth may not be like this – so once you have all your layers displayed,
move the map around until the scars refresh and they should display in the correct order.
16
Printing and other useful tools
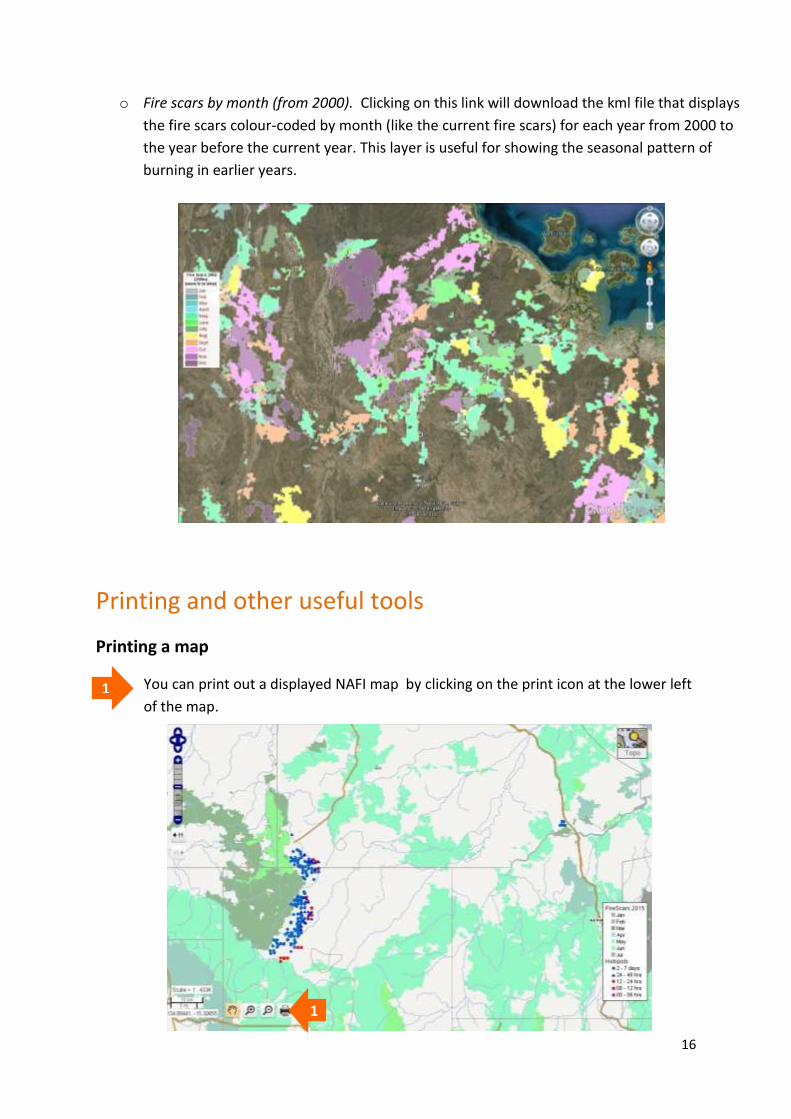
Printing a map
You can print out a displayed NAFI map by clicking on the print icon at the lower left
of the map.
o Fire scars by month (from 2000). Clicking on this link will download the kml file that displays
the fire scars colour-coded by month (like the current fire scars) for each year from 2000 to
the year before the current year. This layer is useful for showing the seasonal pattern of
burning in earlier years.
1
1
17
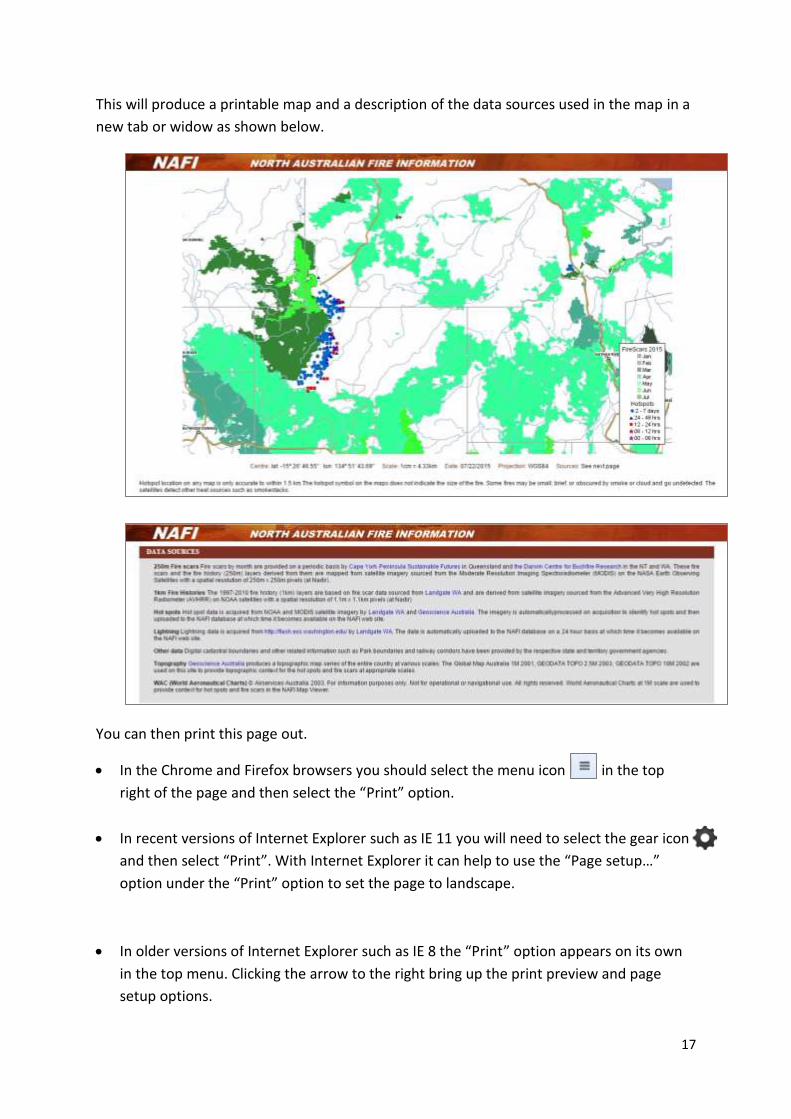
This will produce a printable map and a description of the data sources used in the map in a
new tab or widow as shown below.
You can then print this page out.
In the Chrome and Firefox browsers you should select the menu icon in the top
right of the page and then select the “Print” option.
In recent versions of Internet Explorer such as IE 11 you will need to select the gear icon
and then select “Print”. With Internet Explorer it can help to use the “Page setup…”
option under the “Print” option to set the page to landscape.
In older versions of Internet Explorer such as IE 8 the “Print” option appears on its own
in the top menu. Clicking the arrow to the right bring up the print preview and page
setup options.
18
Measuring distances and areas
You can measure distances and areas on the NAFI maps by going to the More Tools tab and
then the Measure Distance & Area menu.
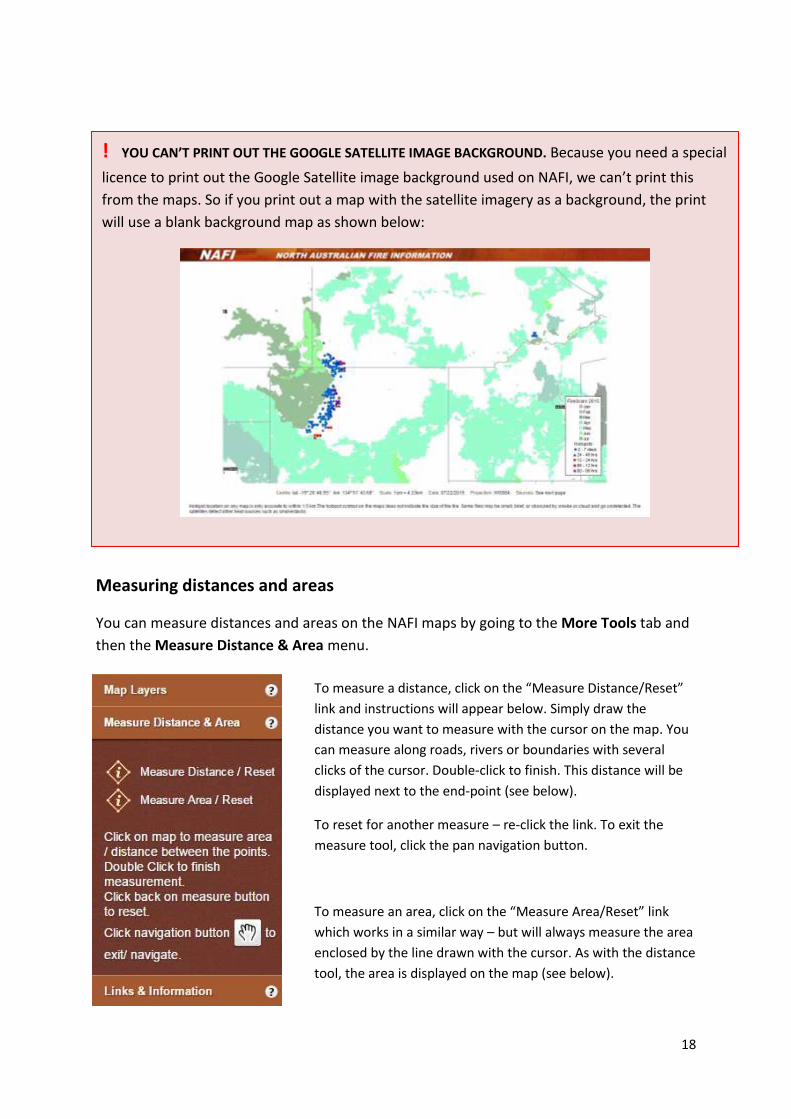
! YOU CAN’T PRINT OUT THE GOOGLE SATELLITE IMAGE BACKGROUND. Because you need a special
licence to print out the Google Satellite image background used on NAFI, we can’t print this
from the maps. So if you print out a map with the satellite imagery as a background, the print
will use a blank background map as shown below:
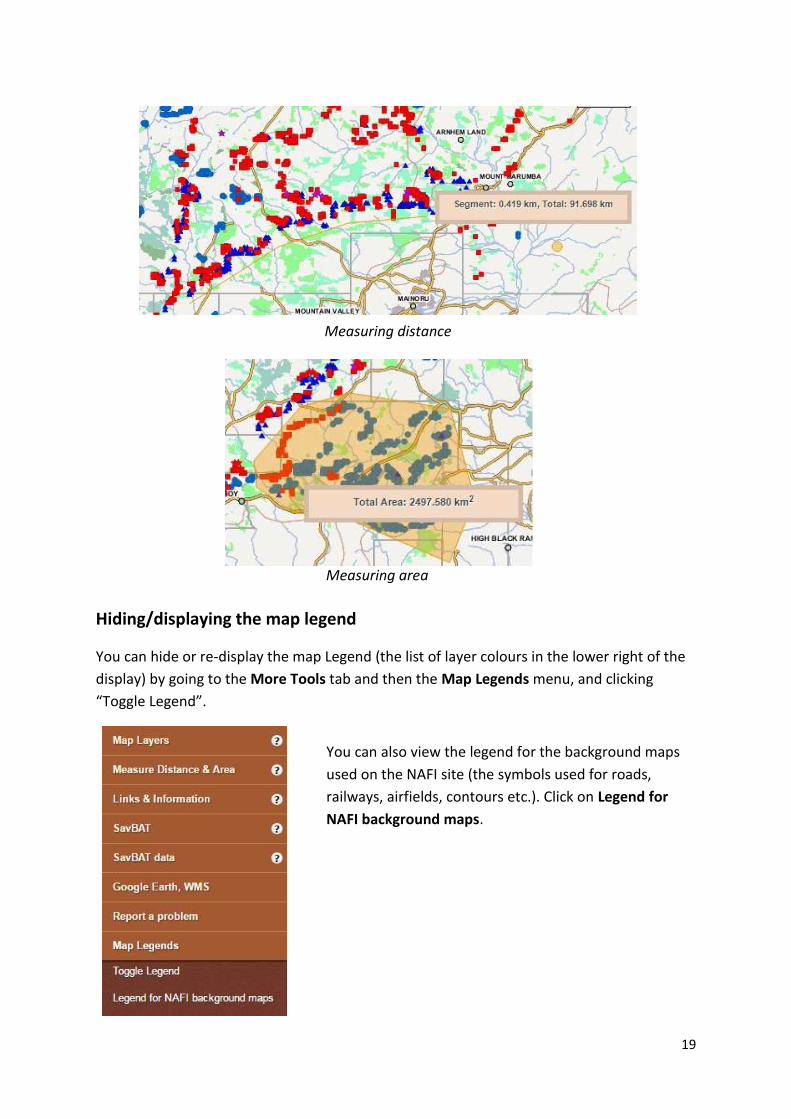
To measure a distance, click on the “Measure Distance/Reset”
link and instructions will appear below. Simply draw the
distance you want to measure with the cursor on the map. You
can measure along roads, rivers or boundaries with several
clicks of the cursor. Double-click to finish. This distance will be
displayed next to the end-point (see below).
To reset for another measure – re-click the link. To exit the
measure tool, click the pan navigation button.
To measure an area, click on the “Measure Area/Reset” link
which works in a similar way – but will always measure the area
enclosed by the line drawn with the cursor. As with the distance
tool, the area is displayed on the map (see below).
19
Hiding/displaying the map legend
You can hide or re-display the map Legend (the list of layer colours in the lower right of the
display) by going to the More Tools tab and then the Map Legends menu, and clicking
“Toggle Legend”.
You can also view the legend for the background maps
used on the NAFI site (the symbols used for roads,
railways, airfields, contours etc.). Click on Legend for
NAFI background maps.
Measuring distance
Measuring area