Using Multiple Data Tools to Identify the Needs of Individual Students: PVAAS Use in Context PVAAS...
132
Using Multiple Data Tools to Identify the Needs of Individual Students: PVAAS Use in Context PVAAS Statewide Team for PDE Fall 2011 Using Multiple Data Tools to Identify Needs of Individual Students 03/22/22 1
-
Upload
arline-mills -
Category
Documents
-
view
213 -
download
0
Transcript of Using Multiple Data Tools to Identify the Needs of Individual Students: PVAAS Use in Context PVAAS...

Using Multiple Data Tools to Identify the Needs of Individual Students:
PVAAS Use in Context
PVAAS Statewide Team for PDEFall 2011
Using Multiple Data Tools to Identify Needs of Individual Students04/19/23 1

Alternative Entry Points
04/19/23 Using Multiple Data Tools to Identify Needs of Individual Students 2
Session 1Identifying Students
Session 2Effectiveness with Student Groups

The PVAAS Fall 2011 Sessions
Session 1Using Multiple Tools to Identify the Needs of Individual Students•What is our current student level data process?•Where do we have students with performance risks?•How do we identify these students?•What data should we gather on students to determine their needs?•What do we do with these data?
Session 2Using Multiple Tools to Evaluate Our School's Effectiveness in Meeting the Needs of Different Groups of Students•What is our current grade level data process?•How do we analyze our success in supporting
– Subgroups?– At risk students?– High achieving students?
•What do we do with these data?
04/19/23 3Using Multiple Data Tools to Identify Needs of Individual Students

AgendaAgenda Item
Introduction
Student Level Data Process
Engaging the Team
The Data
Check for Understanding
Risk Factor Determination
A Data Analysis Process
Building Local Capacity
Data Tools
Supports and Next Steps
3 Hour Session
04/19/23 4
Time for break to be added - in addition to 180 minutes
Using Multiple Data Tools to Identify Needs of Individual Students

Session Materials
• Copy of PowerPoint– For notes
• Participant Workbook– Navigation Guide– Hunt for Evidence Worksheet with Screen Shots of
Reports – Student Profile Template– Additional Resources
04/19/23 5Using Multiple Data Tools to Identify Needs of Individual Students

Flash Drive per District: Contents• All Fall 2011 Professional Development Materials
– PVAAS Face-to-Face Overview, 3 hour session– PVAAS Overview webinar session– PVAAS 90 Minute 1:1 Consultations– ½ Day Individual Student Data Analyses– ½ Day Grade/Course Level Data Analyses– PVAAS NEW Features
• Video Clips: – Student Level Meetings; Grade Level Meetings
• Other PVAAS SY11-12 Professional Development Materials• eMetric Guidebook• All materials are also available on PDE PVAAS webpage
04/19/23 6Using Multiple Data Tools to Identify Needs of Individual Students

Session Approach
• Use multiple data tools to identify students with performance risks AND then determine a student’s needs for one grade/subject level– Create a student profile based on student
performance and growth
• Discussion of strategies for building the capacity of staff in your district/school(s) to conduct these types of data-informed processes
704/19/23 Using Multiple Data Tools to Identify Needs of Individual Students

STUDENT LEVEL DATA ANALYSES AND PLANNING
Using Multiple Tools to Identify the Needs of Individual Students
804/19/23 Using Multiple Data Tools to Identify Needs of Individual Students

School Structures for Data-Informed Decision Making
District-Level Support(Budgetary Support, Professional Development, Resources and Time)
04/19/23 9Using Multiple Data Tools to Identify Needs of Individual Students
Video Clips: #1 & #2

Tier 3: Interventions
forA Few Students
Tier I: Foundation
Standards Aligned Instruction for All Students
Tier 2: Interventions
forSome Students
RtII Framework

Differences Across District and Schools
• There is variation in HOW districts/schools will approach student level planning.
• There is variation in the technology and tools available to manage all of the data for student level data meetings.
• BUT there are some shared practices to consider across districts and schools
04/19/23 11Using Multiple Data Tools to Identify Needs of Individual Students
Video Clip: #3

Shared Practices
Continuous improvement for student level planning (minimizing performance risks) means:
Having the right people, focusing on the right students, using the right data and asking the right questions which results in the most effective plan for individual students.
This is the focus of today’s session!
04/19/23 12Using Multiple Data Tools to Identify Needs of Individual Students

ENGAGING THE TEAMUsing Multiple Tools to Identify the Needs of Individual Students
1304/19/23 Using Multiple Data Tools to Identify Needs of Individual Students

Engaging the Team: Using DataDo 2 quick “whip-arounds” at your table:
Describe the engagement of TEACHERS and BUILDING LEADERS in your school(s) in STUDENT level data
analyses and planning.
What structures are in place to create an ownership of the student results by TEACHERS and ADMINISTRATORS - ownership of the positive results and the results that
indicate a need for improvement?
Be prepared to share with the whole group!1404/19/23
Workbook
Using Multiple Data Tools to Identify Needs of Individual Students

What does YOUR student level data analyses and planning look like now?
Complete this individually or with your team.Question Your Answer
Does the planning occur quarterly, monthly, or more frequently?
Who is at the table? What is the role of the building leader?
Who leads the process?
What data are considered?
Does the process lead to an action plan?
If so, is an action plan followed and monitored?
How is the process monitored to ensure strategic use of time, data, and student plans?
1504/19/23
Workbook
Using Multiple Data Tools to Identify Needs of Individual Students

Engaging the Team• Let’s look at a REAL student level team
meeting**Team process may look different at E, M, HS
• Questions to ask during video clip–Are the teachers engaged? –Is the building leader engaged?–What is your evidence of engagement?
• Student Data Mtg- Clip #4**Team process may look different at E, M, HS
1604/19/23
Workbook
Using Multiple Data Tools to Identify Needs of Individual Students

Team Ownership
• All team members have a chance to participate.
• No one is “presenting” results to the teachers.• Teachers and principal(s) are discussing the
results of individual student performance together.
1704/19/23 Using Multiple Data Tools to Identify Needs of Individual Students

Student Level Data Meeting
• Let’s listen to the building leader’s experiences
• Video Clip: #6
• What structures do building leaders need to have in place to ensure that student level data meetings are successful?
04/19/23 18
Workbook
Using Multiple Data Tools to Identify Needs of Individual Students

Secondary Teams and Engagement
• Strategies for creating ownership at secondary level:– Differences at Middle School and High School
• Who should be “at the table” for individual student planning?– High School?– Middle School?
04/19/23 Using Multiple Data Tools to Identify Needs of Individual Students 19
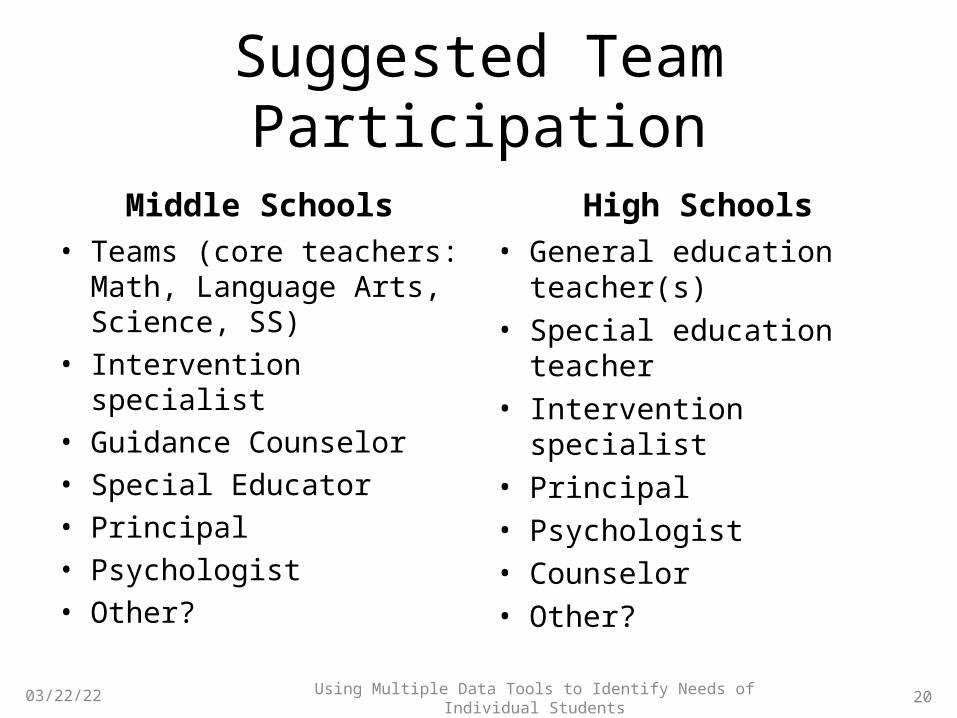
Suggested Team Participation
Middle Schools• Teams (core teachers:
Math, Language Arts, Science, SS)
• Intervention specialist• Guidance Counselor• Special Educator• Principal• Psychologist• Other?
High Schools• General education
teacher(s)• Special education teacher• Intervention specialist• Principal• Psychologist• Counselor• Other?
04/19/23 Using Multiple Data Tools to Identify Needs of Individual Students 20

So, what changes might you make to your student level data analyses and planning as a result of this discussion?
Question Your Answer
Does the planning occur quarterly, monthly, or more frequently?
Who is at the table? What is the role of the building leader?
Who leads the process?
What data are considered?
Does the process lead to an action plan?
If so, is an action plan followed and monitored?
How is the process monitored to ensure strategic use of time, data, and student plans? 2104/19/23
Workbook
Using Multiple Data Tools to Identify Needs of Individual Students

Remember: Shared Practices
Continuous improvement for student level planning (mitigating performance risks) means:
Having the right people, focusing on the right students, using the right data and asking the right questions which results in the most effective plan for individual students.
This is the focus of today’s session!
04/19/23 22Using Multiple Data Tools to Identify Needs of Individual Students

THE DATA: MULTIPLE SOURCES OF EVIDENCE
Using Multiple Tools to Identify the Needs of Individual Students
04/19/23 23Using Multiple Data Tools to Identify Needs of Individual Students

Purpose of Student Level Analysis
Use Data to:
•Create a plan to reach proficiency or beyond•Set goal(s)•Monitor student level learning and response to instruction and intervention•Adjust instructional practices
2404/19/23 Using Multiple Data Tools to Identify Needs of Individual Students

Using Data at the Student Level to Identify Performance Risks
• Turn to a partner and answer both questions1. What data are used by your team to identify “at risk”
students at all performance levels?• “At risk” can be defined many ways
2. What data are currently used by your team to determine the specific needs of the students?
• ONE minute per person to exchange answers to both questions with your partner
04/19/23 25
Workbook
Using Multiple Data Tools to Identify Needs of Individual Students

Hunt for Evidence: The Big Picture!
04/19/23 Using Multiple Data Tools to Identify Needs of Individual Students
26
• In data-driven decision making, we start with questions…
• So, where do we go to find the answers? The evidence?1. Emetric/PSSA2. Classroom Diagnostic Tools3. 4Sight/benchmark assessments4. PVAAS

Student Level Planning ToolsFocus Data Tool Report
Looking Back
Analysis of Data from Prior Year(s)
PSSA Data Interaction:
eMetric
Individual Student Reports•Scaled Scores and Performance Levels•Reporting Categories with PercentagesLongitudinal Individual Performance
4SightRP 3869 Test Results and Graph – Student ListRP 3474 Individual Student Report
Current Status
4Sight Baseline RP 3869 and RP 3474
Classroom Diagnostic
Tools (CDTs)
Student Diagnostic MapLearning Progression Map
Looking ForwardProjection of
Performance on Future Assessments
PVAASStudent Search Individual Student ProjectionsProjection Summary Report – Student Lists
2704/19/23Using Multiple Data Tools to Identify Needs of Individual Students

Hunt for Evidence: The Big Picture
04/19/23 Using Multiple Data Tools to Identify Needs of Individual Students
28
1. Student A’s projection to proficiency on next PSSA?2. Student A’s greatest area of strength on last PSSA?3. Who are our students who tested at the Basic level on
the baseline benchmark assessment?4. How is Student A doing on the Eligible Content for
his/her grade level in Math at the present time?5. How has Student A performed on the last three PSSA
Reading exams?6. What resources are available to assist Student A with a
weakness in Measurement for the PSSA Math exam?

Using Multiple Data Tools
In this activity…•There are 3 profiles:
– Profile A – Elementary– Profile B – Middle School– Profile C – High School
•Pick a partner or trio•Choose Profile A , B or C
04/19/23 29Using Multiple Data Tools to Identify Needs of Individual Students

Exploring Scenarios - InstructionsIn each scenario: •Examine the data that are included in the student profile.•Discuss with your partner or trio the following.
– What findings do these data suggest for the student? – What should be the performance level goal for the
student? – Is the student “at risk”?
•Be ready to share with the group.
04/19/23 30
Workbook
Using Multiple Data Tools to Identify Needs of Individual Students

Multiple Data SourcesElementary Scenario/Reading
Student NOW in 5th GradePSSA
Grade 4 Proficiency Range: 1255-1468 1210
4Sight BaselineGrade 5 Proficiency Range:
1275-1496 1200
PVAAS Projections
To Basic:To Proficient:To Advanced:
93.6%64.8%5.5%
DIBELSORF
Grade 5 – Low Risk104+ at beginning of year
124+ at end of year
89Some Risk
3104/19/23Using Multiple Data Tools to Identify Needs of Individual Students

Multiple Data Sources Middle School Scenario/Math
Student NOW in 7th GradePSSA Grade 6 Proficiency Range:
1298-1475 1304
4Sight Baseline
Grade 7 Proficiency Range: 1298-1471 1297
PVAAS Projections
To Basic:To Proficient:To Advanced:
92.9%70.6%32.1%
3204/19/23Using Multiple Data Tools to Identify Needs of Individual Students

Multiple Data Sources High School Scenario/MathStudent NOW in 9th Grade
PSSAGrade 8 Proficiency Range
1284-1445 1450
4Sight Baseline
Grade 9 Proficiency Range 1304-1508 1507
PVAAS Projections
(11th Grade)
To Basic:To Proficient:To Advanced:
98.7%89.9%45.7%
Grade 8 Final Grades
Final Exam: 91%Course Grade: 87%
3304/19/23Using Multiple Data Tools to Identify Needs of Individual Students
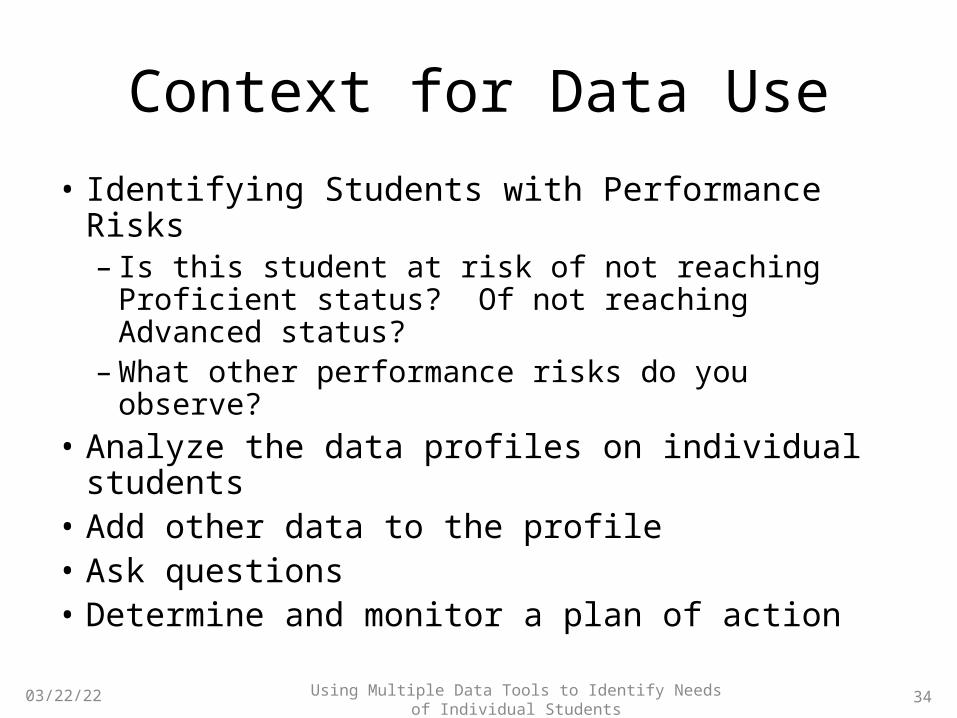
Context for Data Use
• Identifying Students with Performance Risks– Is this student at risk of not reaching Proficient
status? Of not reaching Advanced status?– What other performance risks do you observe?
• Analyze the data profiles on individual students
• Add other data to the profile• Ask questions • Determine and monitor a plan of action
3404/19/23 Using Multiple Data Tools to Identify Needs of Individual Students

PERFORMANCE RISKSUsing Multiple Tools to Identify the Needs of Individual Students
3504/19/23 Using Multiple Data Tools to Identify Needs of Individual Students

Performance Risks• Students with performance risks are at risk of
not reaching or maintaining a specific level of performance– Such as: Proficient or Advanced
• The determination of which students have performance risks must be based on evidence, or DATA!
04/19/23 36Using Multiple Data Tools to Identify Needs of Individual Students

Performance Risks in Your District/School
• Students at risk of not reaching Proficiency
• Students at risk of not staying Proficient
• Students at risk of not reaching an Advanced level of performance
• Students at risk of not staying Advanced
3704/19/23 Using Multiple Data Tools to Identify Needs of Individual Students

An Example of Risk Factor
Suppose you are concerned about students who are presently Proficient (on the most recent PSSA) but may not maintain a level of proficiency in the future.
Possible evidence:– eMetric Student Report
• Low end of Proficient range; Not Proficient on all prior PSSAs– PVAAS Projection Report
• Less than 70% probability of reaching Proficient or above– Other local data?
04/19/23 38Using Multiple Data Tools to Identify Needs of Individual Students

An Example of Risk Factor
Suppose you are concerned about students who are at risk of NOT reaching proficiency.
What might be possible sources of evidence?– To identify students?
– To determine student needs?
04/19/23 39Using Multiple Data Tools to Identify Needs of Individual Students

Possible Sources of Evidence to Identify Students “at risk”
Risk Factor Sources of EvidenceStudents at risk of not reaching proficiency?
eMetric Individual Student Performance ReportPVAAS Projection Summary ReportOther?
Students at risk of not staying Proficient?
eMetric Individual Student Performance ReportPVAAS Projection Summary ReportOther?
Students at risk of not reaching an Advanced level of performance?
eMetric Individual Student Performance ReportPVAAS Projection Summary ReportOther?
Students at risk of not staying Advanced?
eMetric Individual Student Performance ReportPVAAS Projection Summary ReportOther?
04/19/23 40Using Multiple Data Tools to Identify Needs of Individual Students

Evidence of Performance Risks:Other Data Tools
• Websites for Evidence-Based Screening Tools
National Center for Response to Intervention:–http://www.rti4success.org/screeningTools
PATTAN Website:–http://www.pattan.net/category/Resources/PaTTAN%20Publications/Browse/Single/?id=4dc09560cd69f9ac7fbb0000 –http://www.pattan.net/category/Resources/PaTTAN%20Publications/Browse/Single/?id=4dc09560cd69f9ac7fc40000
04/19/23 41Using Multiple Data Tools to Identify Needs of Individual Students

A PROCESS FOR IDENTIFYING NEEDS OF INDIVIDUAL STUDENTS
Using Multiple Tools to Identify the Needs of Individual Students
4204/19/23 Using Multiple Data Tools to Identify Needs of Individual Students

Today’s Shared Focus
Potential Performance Risk•TODAY’S FOCUS: Students at risk of NOT reaching proficiency•Process is the same (or similar) for other risk factors
– Possibly different data– Different “parameters” when using the data– Different questions
04/19/23 43Using Multiple Data Tools to Identify Needs of Individual Students

1st Step: Who ARE the Students?
• What is the “screening” process for determining students meeting the risk criteria?– What is the building level universal screening
process?– How will students be identified in transition years-
how is data shared when students change buildings?• Spring? Fall? What data will be used? • History of interventions? • This should NOT be like starting from square one each time a
student changes buildings!
04/19/23 44Using Multiple Data Tools to Identify Needs of Individual Students

Managing Transitions: High School ExampleUniversal Screening Process and Data Gathering
Using Multiple Data Tools to Identify Needs of Individual Students04/19/23 45
PERSON RESPONSIBLE DESCRIPTION DATA ACCESS (WHEN)
HS Asst. Prin. & MS Asst. Principal
PVAAS Projections: list of Students <70% probability of Prof.
September (current year) for grade 8 to 11; can look back at grade 7 to 8 projections
Psychologist PSSA scores (list of all students - Below Basic & Basic)
Summer/August
MS Principal History of intervention during MS years
May
MS Principal Attendance data (list of students with attendance/truancy issues)
Early June
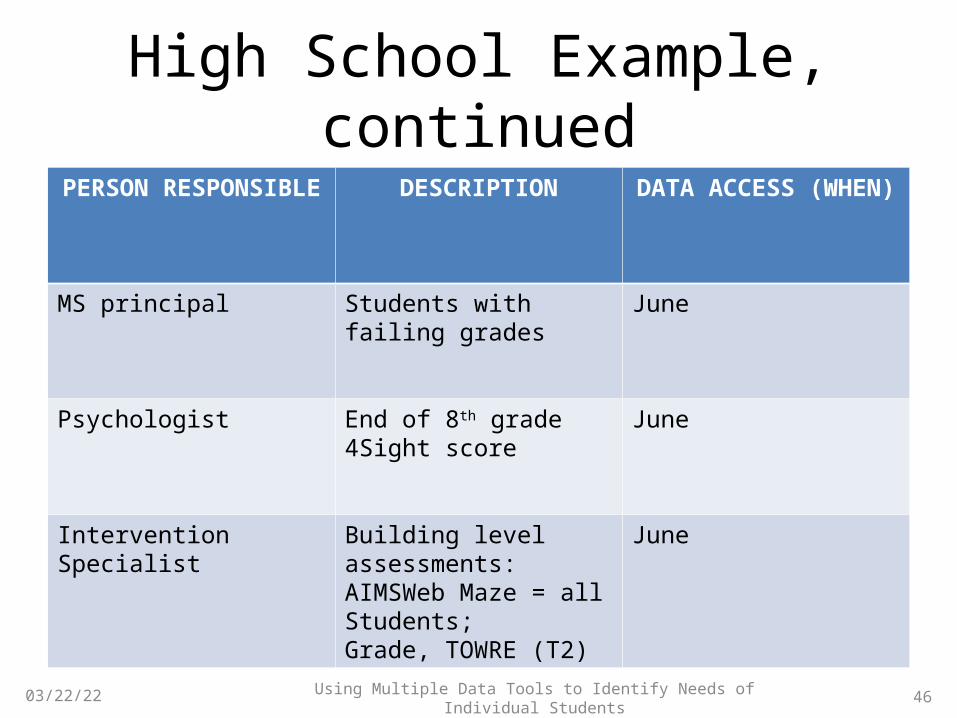
High School Example, continued
04/19/23 Using Multiple Data Tools to Identify Needs of Individual Students 46
PERSON RESPONSIBLE DESCRIPTION DATA ACCESS (WHEN)
MS principal Students with failing grades
June
Psychologist End of 8th grade 4Sight score
June
Intervention Specialist Building level assessments:AIMSWeb Maze = all Students;Grade, TOWRE (T2)
June

Managing the Data
• How does your district/school manage all of the student information?– Need a systematic, documented process that
outlines who enters/gathers which data, when, etc.
• Technology can enhance the merging process.
04/19/23 47Using Multiple Data Tools to Identify Needs of Individual Students

The “Underpinnings”
• Establish a district-wide Assessment Map/Calendar– Break down by building– Break down by grade level
• Identify a universal screening process– Based on targeted performance risk (at risk for not
being proficient? At risk for staying proficient?)• Start with the “big picture”
– PSSA– PVAAS Projections
04/19/23 Using Multiple Data Tools to Identify Needs of Individual Students 48

District Assessment Calendar


Month Assessment K 1 2 3 4 5 6 7 8 9 10 11 12
May
PASA Science (May 1 - May 25, 2012) CDT (Week of May 7, 2012) EasyCBM ( May 7 & 9, 2012) X Benchmark Writing Assessment (May 14 & 15 -Elem #3; May 14-18- HS #2) X X X X X X X X X Math Placement Exams X Keystone Exam: Algebra I, Literature, & Biology (TBD) STAR (Reading) X X AP Exams
Math Placement Exams X June Final Exams X X X X

Middle School Literacy Assessment Map

**Data Entry Psychological
Services** (AIMSweb/BM/PM)
AIMSweb
6th Grade 7th Grade 8th Grade
Tier II (Power
Reading)
Tier I (Classroom)
Tier II (Power Reading)
Tier I (Classroom)
Tier II (Power
Reading)
Tier I (Classroom)
Comprehension
GRADE + (Baseline)
N/A GRADE + (Baseline)
N/A GRADE + (Baseline)
N/A
Benchmark Same as Tier I
AIMSweb Maze-CBM Benchmark – 3X/yr for ALL Kids Homeroom Teacher administers/scores (**enter only those kids below the benchmark)
Same as Tier I
AIMSweb Maze-CBM Benchmark – 3X/yr for ALL Kids English Teacher administers/scores (**enter only those kids below the benchmark
Same as Tier I
AIMSweb Maze-CBM Benchmark – 3X/yr for ALL Kids English Teacher administers/scores (**enter only those kids below the benchmark
Progress Monitoring
AIMSweb Maze-CBM Progress Monitoring – every 3 weeks
Progress Monitor ALL kids below benchmark every 3 weeks (administered by Homeroom Teacher/scored by IST)
AIMSweb Maze-CBM Progress Monitoring – every 3 weeks
Progress Monitor ALL kids below benchmark every 3 weeks (administered by English Teacher/scored by IST)
AIMSweb Maze-CBM Progress Monitoring – every 3 weeks
Progress Monitor ALL kids below benchmark every 3 weeks (administered by English Teacher/scored by IST)

K-5 Literacy Assessment MapCommon Reading Assessments

Assessment Tool Frequency Students Who
Administers K 1 2 3 4 5
DIBELS: Benchmark 3 x/yr. All CORE Team and
Classroom Teacher X X X X X X
DIBELS Progress Monitoring for Strategic
1 x/3wks. Strategic Classroom Teacher X X X X X X
DIBELS Progress Monitoring for Intensive
1x/wk. Intensive Classroom Teacher X X X X X X
Core Phonics Every 4-6 wks. (only
sections not mastered)
All-baseline S&I
Scheduled
Classroom Teacher and/or Reading
Specialist
X All
X All
X All
X All
X All
X All
Concepts of Print Continuous All Classroom Teacher X
Checklists
STARQuarterly All CORE Team and
Classroom Teacher
X 3rd/4th
MP Only
X X X
GRADE +Yearly All-5th Classroom Teacher
(5th)X
(4th MP)
Miscue Analysis (kid catching) Daily All Classroom Teacher Checklists Observation
Charts

Identifying Students “At Risk” of NOT Reaching Proficiency
04/19/23 57
Data Tool Report Possible Parameters
eMetricIndividual Student
Performance ReportNot Proficient on prior PSSA
exam (s)
PVAASStudent Projection
ReportLess than a 70% likelihood of
reaching proficiency
Using Multiple Data Tools to Identify Needs of Individual Students

Determine additional decision points - other data to be considered:
• Teacher recommendations?• Grades? Attendance?
• Other screening tools, assessments or data sources?– CDTs, DIBELS, AIMSweb, STAR, Study Island, 4Sight, GRADE, G-MADE,
TOWRE, MAZE, etc.
– Websites for Evidence-Based Screening ToolsNational Center for Response to Intervention:
•http://www.rti4success.org/screeningToolsPATTAN Website:
•http://www.pattan.net/category/Resources/PaTTAN%20Publications/Browse/Single/?id=4dc09560cd69f9ac7fbb0000
•http://www.pattan.net/category/Resources/PaTTAN%20Publications/Browse/Single/?id=4dc09560cd69f9ac7fc40000
04/19/23 58Using Multiple Data Tools to Identify Needs of Individual Students

2 KEY PHASES IN STUDENT LEVEL PROCESS TO USE DATA
04/19/23 59Using Multiple Data Tools to Identify Needs of Individual Students

Two Phases for Student Level Planning
1. Identify students with a performance risk– What is the definition of the performance risk?
Criteria?– Who meets the criteria in the definition?
2. Determine needs of each student– What data provide insights into needs of the
identified student(s)?– Where do the data appear to point us?
04/19/23 60Using Multiple Data Tools to Identify Needs of Individual Students

Today’s Session:
– Facilitator will walk through/model phase 1– Then you do phase 1– Facilitator will walk through/model phase 2– Then you do phase 2 for ONE student
– Phase One: identifying Ss with performance risk– Phase Two: determining needs of each student within
that list
04/19/23 61Using Multiple Data Tools to Identify Needs of Individual Students

Two Phase Process +
04/19/23
Phase 1: Identify the Students At RiskPhase 2: Determine the Needs of EACH Student
– Are there any system performance issues that may impact meeting students’ needs? (Other ½ day session)
– Is there any way to improve the system that may in turn positively impact MANY students in this “at risk” group? (Other ½ day session)
62Using Multiple Data Tools to Identify Needs of Individual Students

Access to Student Level Data
• Websites– eMetric: https://pssa.emetric.net– PVAAS: https://pvaas.sas.com
• User names/passwords– Assigned by your district/school
• Demo site as a back-up option• Let’s get started!
04/19/23 63Using Multiple Data Tools to Identify Needs of Individual Students

Example…
Your school team is concerned about students in 8th grade who are at risk of not reaching proficiency in Math.
04/19/23 64
Define the parameters for the risk.
Potential Performance Risk
Students at risk of not reaching proficiency?
Students at risk of not staying Proficient?
Students at risk of not reaching an Advanced level of performance?
Students at risk of not staying Advanced?
Using Multiple Data Tools to Identify Needs of Individual Students

Performance Risk to Minimize
Category Decision
Performance Risk Students at risk of NOT reaching proficiency
Grade
Subject
Other Information ?
Other Data Sources?
04/19/23 65Using Multiple Data Tools to Identify Needs of Individual Students

Performance Risk to MinimizeCategory Decision
Performance Risk Students who are at risk of not reaching proficiency
Grade Last PSSA test in 7th Grade (Current 8th graders)
Subject Math
Other Information
Baseline and/or end of year 4Sight indicates Not Proficient; Baseline and/or end of year CDT indicates needs are below grade level standards; Attendance; Discipline
Data Sources
eMetric Individual Student Performance Report: Not Proficient on most recent PSSA(s)PVAAS Student Projection Report: Less than 70% chance of proficiency on 8th grade PSSA in Math
04/19/23 66Using Multiple Data Tools to Identify Needs of Individual Students

YOUR TURN…Performance Risk to Minimize
Category Decision
Performance Risk Students at risk of NOT reaching proficiency
Grade
Subject
Other Information ?
Other Data Sources?
04/19/23 67
Workbook
Using Multiple Data Tools to Identify Needs of Individual Students

Phase 1:Identifying the Students “At Risk”
04/19/23 68
Performance Risk: Students in 8th grade who are at risk of NOT reaching proficiency in Math on the 8th grade PSSA.
Find which of those students fit the projection profile:PVAAS Projection Summary – Less than 70% chance of proficiency on next PSSA Math exam (8th grade PSSA)
Find all students who fit both the achievement and projection profile
Find students who fit the achievement profile:eMetric Individual Performance Report – Not Proficient
on most recent PSSA(s)
Using Multiple Data Tools to Identify Needs of Individual Students

Step 1The Performance Profile
04/19/23 69Using Multiple Data Tools to Identify Needs of Individual Students

Step 1: Identify Students Meeting the Achievement Profile - Can Sort In Ascending Order
Use the eMetric Individual Performance Report to find a list of all students last tested in grade 7 (current 8th graders) who scored below Proficient in Math on the 7th grade PSSA.
04/19/23 70Using Multiple Data Tools to Identify Needs of Individual Students

Step 2The Projection Profile
04/19/23 71Using Multiple Data Tools to Identify Needs of Individual Students

Step 2: Locating PVAAS Projections
Two ways to find what students are in a specific projection profile:
•Projection Summary Report•Student Search Report
04/19/23 72Using Multiple Data Tools to Identify Needs of Individual Students

Projection Summary Report
04/19/23 73Using Multiple Data Tools to Identify Needs of Individual Students

Projection Summary Report to the Projections Results
04/19/23 74Using Multiple Data Tools to Identify Needs of Individual Students

Individual Student Projection Report
7504/19/23 Using Multiple Data Tools to Identify Needs of Individual Students

Option:Use PVAAS Student Search
04/19/23 76Using Multiple Data Tools to Identify Needs of Individual Students

How: The Results
04/19/23 77Using Multiple Data Tools to Identify Needs of Individual Students

Accessing the LIVE site
• Facilitator demonstrates access to reporting:– eMetric Individual Performance Report– PVAAS Projection Summary
• Then, what do I do next??• What do I need to think about?
04/19/23 Using Multiple Data Tools to Identify Needs of Individual Students 78

Step 3: “Merge the Lists”
04/19/23 79
Students“at risk” of not reaching proficiency based on risk parameters
• Into a Data Warehouse?• Into Excel?• Manual comparisons of printouts?
• Benchmark data? (ex., 4Sight)• Diagnostic data? (ex., CDT) • Formative data? (ex. TOWRE, DIBELS,
AimsWeb, R-CBM)• Progress monitoring data
• Other data?• Attendance• Discipline• Report Card Grades• Teacher Feedback
Using Multiple Data Tools to Identify Needs of Individual Students

Step 1
04/19/23 Using Multiple Data Tools to Identify Needs of Individual Students 80
Name
PSSA Peformance Level
ASMONDY, KHENNED Basic ATTERBERRY, ARTARIOU Basic AYMOR, SYNGIN Basic BENIBO, DYQWAN Basic BLAY, PAKINA Basic BOOS, MALONDAA Basic BOUFFET, MARQULO Basic BRECHEEN, TACOA Basic CALF, JAYLNNE Basic CHILON, COVY Basic CHRISME, DOLLISH Basic CVERCKO, ACISHA Basic

The Merge
04/19/23 Using Multiple Data Tools to Identify Needs of Individual Students 81
Name
PSSA Peformance Level
PVAAS Projection
ASMONDY, KHENNED Basic 40.5ATTERBERRY, ARTARIOU Basic 67.4AYMOR, SYNGIN Basic 54.2BENIBO, DYQWAN Basic 62.8BLAY, PAKINA Basic 77.2BOOS, MALONDAA Basic 53.1BOUFFET, MARQULO Basic 61BRECHEEN, TACOA Basic 44.8CALF, JAYLNNE Basic 64.2CHILON, COVY Basic 57.4CHRISME, DOLLISH Basic 60.2CVERCKO, ACISHA Basic 63.4DOULE, MECHLLE Basic 74.5FINNIAN, ROMANIC Basic 65FRALIXAN, JABORIA Basic 69.9GEARHT, JASIRIA Basic 70GURUZAZA, MARNA Basic 72.6HAMIDA, CHRIP Basic 66.6HARER, TILIS Basic 69.3HIRAYAM, DAVIOUN Basic 76.6ISELER, KYMONC Basic 68.7JAJCHIK, TEDRIANN Basic 79.3JARR, MARC Basic 67.5

Other Data to Merge
04/19/23 Using Multiple Data Tools to Identify Needs of Individual Students 82
Name
PSSA Peformance Level
PVAAS Projection 4Sight
ASMONDY, KHENNED Basic 40.5BRECHEEN, TACOA Basic 44.8BOOS, MALONDAA Basic 53.1AYMOR, SYNGIN Basic 54.2CHILON, COVY Basic 57.4CHRISME, DOLLISH Basic 60.2BOUFFET, MARQULO Basic 61BENIBO, DYQWAN Basic 62.8CVERCKO, ACISHA Basic 63.4CALF, JAYLNNE Basic 64.2FINNIAN, ROMANIC Basic 65HAMIDA, CHRIP Basic 66.6ATTERBERRY, ARTARIOU Basic 67.4

PSSA-PVAAS-4SightAn Example of a Merge (spreadsheet)

IPM #1Merge, con’t.

Team Decisions
• What data has more weight in the decision making process?– Reliability of PVAAS Projections- more reliable than most recent PSSA
score at predicting future performance (even 3 years in to the future)• This is not a black and white process!• There will be decisions that need to be made by the team – the
data serves as a guide as indicators of need.• What will drive your decisions?
• The reason to merge the data is to see WHO meets the criteria.
– The criteria are determined by contextual factors in your building.
04/19/23 Using Multiple Data Tools to Identify Needs of Individual Students 85

Your Turn to Try Phase 1:Identifying the Students “At Risk”
04/19/23 86
Risk Factor: Students in grade ___ who are at risk of not reaching proficiency in ___ subject
Find which of those students fit the projection profile:PVAAS Projection Summary – Less than 70% chance
of proficiency on next PSSA ___ exam (grade ___ PSSA)
Find all students who fit both the achievement and projection profile
Find students who fit the achievement profile:eMetric Individual Performance Report – Not Proficient
on most recent PSSA(s)
Workbook
Using Multiple Data Tools to Identify Needs of Individual Students

Phase 1: Time to Report!
• Were you successful in identifying students who fit your performance risk criteria?
• Comments on the process• What do you suppose should be the next step
in our process?– Individual student analysis of needs– Select ONE of your students for focus for Phase 2
of this process• Call them “Student A” for confidentiality in this session
04/19/23 87Using Multiple Data Tools to Identify Needs of Individual Students

Phase 2:Analyze Data for Selected Student
04/19/23 88
Document Student A’s demographics and probabilities of reaching Proficient or Advanced from PVAAS Projection Profile
Add achievement detail using eMetric•Longitudinal Individual Student Report•Individual Student Reporting Category Report
Examples, but not an all inclusive list:•4Sight•CDTs•DIBELS, AIMSWeb, G-MADE, GRADE
Using Multiple Data Tools to Identify Needs of Individual Students

Phase 2: What are we workingtowards in Phase 2?A student profile!
04/19/23 89
This is only an example!
Using Multiple Data Tools to Identify Needs of Individual Students

Phase 2: What are we working towards?
04/19/23 90
• Developing Student Profiles• Data to use for student level data analyses planning
• Which results in differentiating instructions, interventions, and supports at Tiers 1/2/3
• Profiles may have different formats and content for different grade levels• Elementary• Middle• High School• Also may vary by subject and grades (within school)
Using Multiple Data Tools to Identify Needs of Individual Students

Elementary Profile
04/19/23 91Using Multiple Data Tools to Identify Needs of Individual Students

Elementary Profile
Using Multiple Data Tools to Identify Needs of Individual Students04/19/23 92

Elementary Profile Continued on page 2
04/19/23 93Using Multiple Data Tools to Identify Needs of Individual Students

04/19/23 94
Middle School Profile: Math
Using Multiple Data Tools to Identify Needs of Individual Students

Middle School Profile: Reading
04/19/23 95Using Multiple Data Tools to Identify Needs of Individual Students

High School Profile: Reading
Using Multiple Data Tools to Identify Needs of Individual Students04/19/23 96

High School Profile: Math
Using Multiple Data Tools to Identify Needs of Individual Students04/19/23 97

Student Reading Report
Using Multiple Data Tools to Identify Needs of Individual Students04/19/23 98

Student Math Report
Using Multiple Data Tools to Identify Needs of Individual Students04/19/23 99

Student Data Profiles
04/19/23 100
• Any examples to share from your district/schools?
• How the information is managed may vary from district to district, and from school to school.
• See profile in Workbook for Phase 2.
KEY: The shared practice of using multiple measures to determine student needs is the goal!
Using Multiple Data Tools to Identify Needs of Individual Students

Phase 2:Analyze Data from the Selected
Student
04/19/23 101
Document Student A’s demographics and probability to proficiency from PVAAS Projection
Profile
Add achievement detail using eMetric• Longitudinal Individual Student Report•Individual Student Reporting Category Report
Add available district data•4Sight•CDTs•DIBELS
Using Multiple Data Tools to Identify Needs of Individual Students

Step 1:Demographic and Probability to Proficiency
Data from PVAAS
04/19/23 102Using Multiple Data Tools to Identify Needs of Individual Students

Step 2: Achievement DataLongitudinal Achievement
04/19/23 103
STUDENT A
Using Multiple Data Tools to Identify Needs of Individual Students

Step 2: Achievement DataReporting Category Report
04/19/23 104
STUDENT A
Using Multiple Data Tools to Identify Needs of Individual Students

Step 2: A Deeper Look at Reporting
Categories: Show the percentages
04/19/23 105Using Multiple Data Tools to Identify Needs of Individual Students

Step 2: How Shall We Evaluate the Reporting Category Percentages?
• Criteria for evaluation is determined by the district/schools
• We suggest:
04/19/23 106
Reporting Category EvaluationPercentage > 60% StrengthPercentage < 60% Possible Area of Need
Using Multiple Data Tools to Identify Needs of Individual Students

Step 2: A Different View at the Reporting Category Data
04/19/23 107Using Multiple Data Tools to Identify Needs of Individual Students

Step 3: Other Data
• 4Sight Benchmarks or Other Benchmark Assessment Data
• Classroom Diagnostic Tests (CDTs)
• DIBELS, AIMSWeb, G-MADE, GRADE, etc.• Local District Assessments• Report Card Grades• Teacher Feedback/Recommendations
04/19/23 108Using Multiple Data Tools to Identify Needs of Individual Students

Phase 2: So What Do We Know About Student A?
04/19/23 109Using Multiple Data Tools to Identify Needs of Individual Students

YOUR TURN! Phase 2:Analyze Data from the Selected Student
04/19/23 110
Add achievement detail using eMetric• Longitudinal Individual Student Report•Individual Student Reporting Category Report
Add available district data•4 Sight•CDTs•DIBELS
Workbook
Using Multiple Data Tools to Identify Needs of Individual Students
Document Student A’s demographics and probabilities of reaching Proficient or Advanced from PVAAS Projection Profile

Phase 2: Time to Report!
• Were you successful in identifying some of the NEEDS for a student who fit your performance risk criteria?
• Comments on the process• What do you suppose should be the next step
in our process?
04/19/23 111Using Multiple Data Tools to Identify Needs of Individual Students

LINES OF INQUIRY
04/19/23 Using Multiple Data Tools to Identify Needs of Individual Students 112
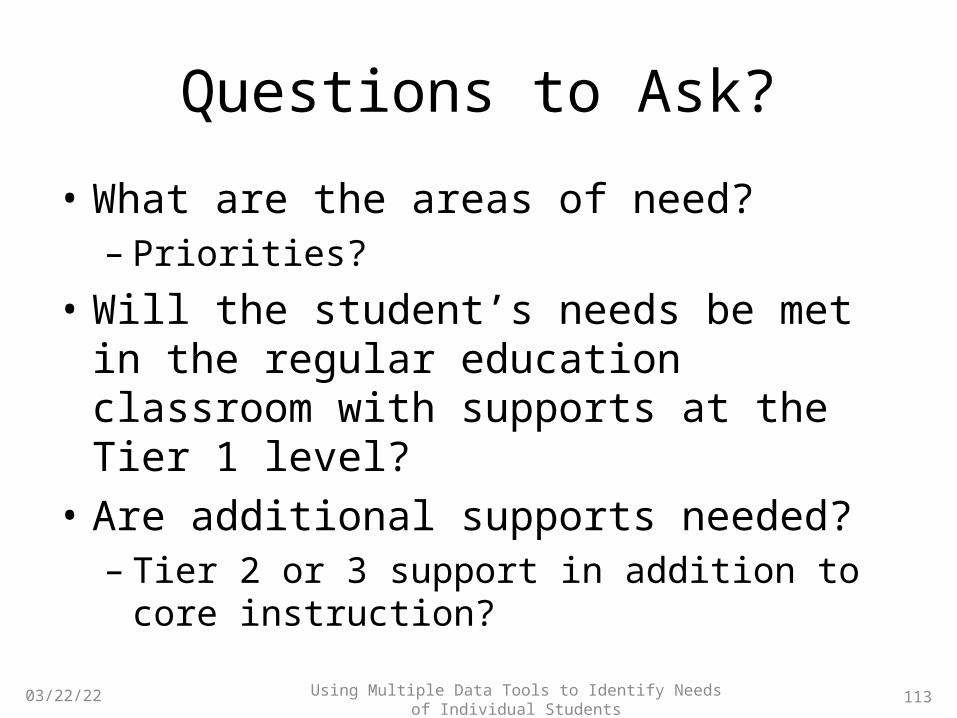
Questions to Ask?
• What are the areas of need?– Priorities?
• Will the student’s needs be met in the regular education classroom with supports at the Tier 1 level?
• Are additional supports needed?– Tier 2 or 3 support in addition to core instruction?
04/19/23 113Using Multiple Data Tools to Identify Needs of Individual Students

Lines of Inquiry
• Elementary• Middle• High
*See flash drive for ‘Lines of Inquiry’ PowerPoint
04/19/23 Using Multiple Data Tools to Identify Needs of Individual Students 114

Next Steps• Determine plan of action to meet student
needs– Who?– What?– Where?– When?– How?
• How will we monitor and evaluate:– the fidelity of the intervention? – the effectiveness of the intervention?
04/19/23 115Using Multiple Data Tools to Identify Needs of Individual Students

Data to Inform Instruction:Evidence-Based Intervention Resource Sites
• Center on Instruction– http://www.centeroninstruction.org/
• Florida Center for Reading Research– http://www.fcrr.org/
• RTI Action Network– http://www.rtinetwork.org/
• PATTAN RtII materials: http://www.pattan.net• Doing What Works
– http://www2.ed.gov/nclb/methods/whatworks/edpicks.jhtml• Improving Adolescent Literacy Effectiveness: Effective Classroom and
Intervention Practices (IES practice guide)– http://ies.ed.gov/ncee/wwc/publications/practiceguides/
04/19/23 116Using Multiple Data Tools to Identify Needs of Individual Students

Next Steps
• Plan for monitoring the progress of students over time?– Assessment measures– Plan to meet to discuss the effectiveness of
action plan and adjust the intervention• Time and intensity of the intervention?• Fidelity of implementation?
04/19/23 117Using Multiple Data Tools to Identify Needs of Individual Students

Focus on Other Performance Risks?POSSIBLE Criteria/Parameters
Performance Risk Parameters for EvidenceStudents at risk of not reaching proficiency?
eMetric Individual Student Performance Report: Not Proficient on recent PSSA(s)PVAAS Student Projection Report: 0-70% probability of proficiencyOther?
Students at risk of not staying Proficient?
eMetric Individual Student Performance Report: Low Proficient range on recent PSSAs; not consistently Proficient on previous PSSA(s)PVAAS Projection Report: 40-70% probability of proficiencyOther?
Students at risk of not reaching an Advanced level of performance?
eMetric Individual Student Performance Report: Proficient on recent PSSAsPVAAS Projection Report: 40-70% probability of Advanced levelOther?
Students at risk of not staying Advanced?
eMetric Individual Student Performance Report: Low Advanced range on recent PSSA(s)PVAAS Projection Report: 40-70% probability of Advanced levelOther?
04/19/23 118Using Multiple Data Tools to Identify Needs of Individual Students

Questions About Your System
Are there system improvements that may decrease the number of students with
performance risks?
04/19/23 119Using Multiple Data Tools to Identify Needs of Individual Students

Tier 3: Interventions
forA Few Students
Tier I: Foundation
Standards Aligned Instruction for All Students
Tier 2: Interventions
forSome Students
RtII Framework

Strategies: Building the Capacity In Your District/School
Questions:
•What professional development is needed for administrators and teachers?•What are teachers’ beliefs regarding all students reaching proficiency?•What infrastructure is needed? Schedules?•Is there any technology that could enhance this work?
04/19/23 121Using Multiple Data Tools to Identify Needs of Individual Students

Strategies: Building the Capacity In Your District/School
Questions to Improve Student Level Planning:
•Who is at the table?
•Who is leading the discussions?
•When and how often?
•What data are currently used? What data needs to be added?
04/19/23 122Using Multiple Data Tools to Identify Needs of Individual Students

Strategies: Building the Capacity In Your District/School
Managing the Process (continued):•How will this information get to the teachers for student level planning?
– How quickly and how soon?– Want teachers to use fresh, relevant, and most
meaningful data•Continued collection of data to monitor progress of students•Data teams established (PLCs) to monitor student results along the way
04/19/23 123Using Multiple Data Tools to Identify Needs of Individual Students

HUNT FOR EVIDENCE: DATA TOOLSA CHECK FOR UNDERSTANDING!
Using Multiple Tools to Identify the Needs of Individual Students
12404/19/23 Using Multiple Data Tools to Identify Needs of Individual Students

Check for Understanding: The HUNT for EVIDENCE
• On the Hunt for Evidence worksheet found in your workbook, match each question with the report(s) that yields evidence to answer the question.
• You can work individually or in pairs.• We will share the possible answers after a few
minutes.
Hunt for Evidence!!!!
04/19/23 125
Workbook
Using Multiple Data Tools to Identify Needs of Individual Students

Hunt for Evidence WorksheetQuestion Report(s)
1. What is the probability that Student A will be proficient on his/her next PSSA Reading exam?
2. How did Student A perform on the content under the 1st anchor of the Geometry reporting category on his/her last PSSA Math exam?
3. How did Student A progress relative to the Comprehension and Reading Skills reporting category during the last school year?
4. What percentage of questions dealing with the content of the Algebraic Concepts anchors did Student A answer correctly on his/her last year’s PSSA Math exam?
5. What is the area of greatest strength for Student A based on last year’s PSSA Reading exam?
04/19/23 126
Workbook
Using Multiple Data Tools to Identify Needs of Individual Students

Hunt for Evidence WorksheetQuestion Report(s)
6. In which reporting category area did Student A show the greatest progress in Reading over the last school year?
7. How is Student A doing on the Eligible Content for his/her grade level in Math at the present time?
8. In which eligible content is Student A having difficulty in Reading at the present time?
9. How has Student A progressed during the last year on Open Ended Items similar to those on the PSSA Math exam?
10. How has Student A performed on the last three PSSA Reading exams?
11. What resources are available to assist Student A with a weakness in Measurement for the PSSA Math exam?
04/19/23 127
Workbook
Using Multiple Data Tools to Identify Needs of Individual Students

Hunt for Evidence WorksheetQuestion Report(s)
12. What data are available to provide insight on how Student A is doing at the current time on every anchor that will be tested in Geometry Reporting Category of the 5th grade PSSA Math exam?
13. If Student A continues on his/her present path, how likely is it that he/she will score Advanced on the next PSSA exam?
14. What was Student A’s scaled score and performance level in Reading on last year’s PSSA exam?
15. Who are our students who tested at the Basic level on the baseline benchmark assessment?
16. Who are the students in our current 5th grade that are likely to be Advanced on the 5th grade PSSA Reading exam next spring?
04/19/23 128
Workbook
Using Multiple Data Tools to Identify Needs of Individual Students

Resources and Supports
Support to:
•facilitate data meetings
•manage multiple data sources
•monitor plans of action
The Sources:– District/Building Administrators/Teacher Leaders– IU/PaTTAN Personnel
04/19/23 129Using Multiple Data Tools to Identify Needs of Individual Students

Resources and Supports
• Replication of this session for a larger group from your district/school
• Materials from today’s session
– PPT slides and trainer notes
• Podcasts
• LIVE and Archived Webinars
04/19/23 130
Workbook
Using Multiple Data Tools to Identify Needs of Individual Students

Questions:
PVAAS Materials or Statewide Implementation
Email: [email protected]: 717-606-1911
PVAAS Reporting Web Sitehttps://pvaas.sas.com
04/19/23 131Using Multiple Data Tools to Identify Needs of Individual Students

www.pde.state.pa.us
132Using Multiple Data Tools to Identify Needs of Individual Students04/19/23