Using Mechanical Turk to Study Family Processes and...
12
ORIGINAL PAPER Using Mechanical Turk to Study Family Processes and Youth Mental Health: A Test of Feasibility Jessica L. Schleider • John R. Weisz Published online: 22 January 2015 Ó Springer Science+Business Media New York 2015 Abstract Extensive evidence links youth mental health to family functioning, highlighting the need to document causal pathways. This will require longitudinal studies, but traditional methods for longitudinal clinical research have several limitations, including high cost and resource demands, underrepresentation of fathers, and attrition bias. We tested whether an online alternative might address limitations of—and thus provide a useful complement to— traditional methods. We used the Mechanical Turk (MTurk) survey program to obtain reports from parents (N = 177) on family functioning, the parents’ own symp- toms, their children’s behavioral and emotional problems, and parenting stress, with assessments in three consecutive months. Parents provided largely high-quality data (e.g., passed consistency checks); measures showed acceptable psychometrics at each time-point; and correlations among study measures paralleled those observed in prior research. Compared to prior studies using traditional longitudinal methods, the MTurk method was (a) much lower in cost and resource requirements, (b) successful in enrolling fathers, (c) comparable in participant attrition, and (c) similar in attrition bias, participant race/ethnicity, and enrollment of single parents. Overall, findings suggest that MTurk is a viable tool with its own set of strengths and limitations, and a potentially useful complement to tradi- tional longitudinal methods. In particular, MTurk might be a cost-effective first step in generating causal hypotheses about family processes and youth mental health, for later testing via more traditional methods. Keywords Mechanical Turk Á Data collection Á Family processes Á Youth mental health Introduction Family environment plays a crucial role in individuals’ well- being, providing a social and psychological foundation that can protect or threaten its members’ mental health. The influence of family processes on the development and maintenance of youth mental health problems is an exciting, growing field of study, with the potential to inform treatment and prevention of youth problems. This area of investigation is increasingly important given dramatic changes in the structure and stability of American families over the last half-century (Bianchi and Milkie 2010; Cooper et al. 2010). Increased rates of divorce, children reared by non-traditional families, and broadening of marriage laws and adoption practices, have contributed to a rich variety of family forms and environments. These changes have produced greater variety in children’s living arrange- ments, and perhaps greater instability as well, especially among low-income families (Ventura and Bachrach 2000). The changing face of American families has raised questions about implications for youth well-being and mental health (Cooper et al. 2010). For instance, research suggests that youths whose parents divorce are more likely to experience subsequent increases in anxiety, depression, and antisocial behavior than youths whose parents remain married, even after accounting for effects of pre-divorce parental socioeconomic status and mental health problems (Strohschein 2005). New research is needed to assess how family functioning, caregiver stress, and parenting styles influence youth problems in the context of increasingly diverse family structures. Existing theoretical models for understanding the development of youth mental health problems stress J. L. Schleider (&) Á J. R. Weisz Psychology Department, Harvard University, 33 Kirkland Street, Cambridge, MA 02138, USA e-mail: [email protected] 123 J Child Fam Stud (2015) 24:3235–3246 DOI 10.1007/s10826-015-0126-6
Transcript of Using Mechanical Turk to Study Family Processes and...
ORIGINAL PAPER
Using Mechanical Turk to Study Family Processes and YouthMental Health: A Test of Feasibility
Jessica L. Schleider • John R. Weisz
Published online: 22 January 2015
� Springer Science+Business Media New York 2015
Abstract Extensive evidence links youth mental health
to family functioning, highlighting the need to document
causal pathways. This will require longitudinal studies, but
traditional methods for longitudinal clinical research have
several limitations, including high cost and resource
demands, underrepresentation of fathers, and attrition bias.
We tested whether an online alternative might address
limitations of—and thus provide a useful complement to—
traditional methods. We used the Mechanical Turk
(MTurk) survey program to obtain reports from parents
(N = 177) on family functioning, the parents’ own symp-
toms, their children’s behavioral and emotional problems,
and parenting stress, with assessments in three consecutive
months. Parents provided largely high-quality data (e.g.,
passed consistency checks); measures showed acceptable
psychometrics at each time-point; and correlations among
study measures paralleled those observed in prior research.
Compared to prior studies using traditional longitudinal
methods, the MTurk method was (a) much lower in cost
and resource requirements, (b) successful in enrolling
fathers, (c) comparable in participant attrition, and
(c) similar in attrition bias, participant race/ethnicity, and
enrollment of single parents. Overall, findings suggest that
MTurk is a viable tool with its own set of strengths and
limitations, and a potentially useful complement to tradi-
tional longitudinal methods. In particular, MTurk might be
a cost-effective first step in generating causal hypotheses
about family processes and youth mental health, for later
testing via more traditional methods.
Keywords Mechanical Turk � Data collection � Family
processes � Youth mental health
Introduction
Family environment plays a crucial role in individuals’ well-
being, providing a social and psychological foundation that can
protect or threaten its members’ mental health. The influence
of family processes on the development and maintenance of
youth mental health problems is an exciting, growing field of
study, with the potential to inform treatment and prevention of
youth problems. This area of investigation is increasingly
important given dramatic changes in the structure and stability
of American families over the last half-century (Bianchi and
Milkie 2010; Cooper et al. 2010). Increased rates of divorce,
children reared by non-traditional families, and broadening of
marriage laws and adoption practices, have contributed to a
rich variety of family forms and environments. These changes
have produced greater variety in children’s living arrange-
ments, and perhaps greater instability as well, especially
among low-income families (Ventura and Bachrach 2000).
The changing face of American families has raised questions
about implications for youth well-being and mental health
(Cooper et al. 2010). For instance, research suggests that
youths whose parents divorce are more likely to experience
subsequent increases in anxiety, depression, and antisocial
behavior than youths whose parents remain married, even after
accounting for effects of pre-divorce parental socioeconomic
status and mental health problems (Strohschein 2005). New
research is needed to assess how family functioning, caregiver
stress, and parenting styles influence youth problems in the
context of increasingly diverse family structures.
Existing theoretical models for understanding the
development of youth mental health problems stress
J. L. Schleider (&) � J. R. Weisz
Psychology Department, Harvard University, 33 Kirkland Street,
Cambridge, MA 02138, USA
e-mail: [email protected]
123
J Child Fam Stud (2015) 24:3235–3246
DOI 10.1007/s10826-015-0126-6

reciprocal links between parent, familial, and youth factors
(Chorpita and Barlow 1998; Chorpita et al. 1998; Ginsburg
et al. 2004; Rapee 1997; Rubin and Mills 1990; Shaffer
et al. 2013; Warren et al. 1997). Understanding these links,
and the causal pathways they represent, will require lon-
gitudinal studies, and diverse samples will be needed to
examine impacts of family-related stressors over time.
However, traditional strategies for collecting longitudi-
nal data from families confront significant challenges.
First, the most accessible populations for these studies tend
to be Caucasian, from dual-parent households, and of
middle-to-upper socioeconomic status, potentially limiting
generalizability of findings (Snowden and Cheung 1990;
Lamb 2010; McQuaid and Barakat 2012; Yancey et al.
2006). Second, fathers (compared to mothers) are routinely
underrepresented in research on family processes and youth
mental health (Phares 1992). Although mothers have his-
torically been perceived as more accurate reporters of their
children’s psychological problems (e.g., Phares 1997), a
meta-analysis on this topic suggested that mothers and
fathers tend to report similar levels of overall problems in
their children (Duhig et al. 2000). Given this finding, the
importance of multiple perspectives in understanding and
treating youth problems, and the need to better understand
the father’s role in youth development, greater paternal
representation in these studies is needed (Day and Lamb
2004; Lamb 2010; Phares 1992). Third, considerable time,
effort, and funding are required to conduct large-scale
longitudinal research while minimizing study attrition.
Large research teams and substantial grants are typically
required, and these may not be readily available during
times of limited extramural funding. Fourth, attrition, or
loss of respondents in second or subsequent waves of data
collection, is a common problem in research with youths
and families (Kessler et al. 1995). Attrition is problematic
for at least two reasons. First, it reduces sample size and
statistical power. Second, it creates the potential for attri-
tion bias: the trend for those who drop out of a study to
systematically differ from those who remain in the study.
Attrition bias is one of the major threats to multiwave
studies, potentially compromising findings’ internal and
external validity. Given these challenges, it may be useful
to consider alternative methods for longitudinal research on
family factors and youth mental health, which may com-
plement current approaches and address some of their
limitations.
One alternative approach that may warrant attention is
online crowd-sourcing, through such tools as Amazon’s
Mechanical Turk (MTurk, http://www.mturk.com; Paolacci
and Chandler 2014; Mason and Suri 2012). MTurk is an
increasingly popular method for recruiting and collecting
survey, experimental, and intervention data online (see e.g.,
Mason and Suri 2012; Chandler et al. 2013). Using MTurk,
‘‘requesters’’ (including researchers) can recruit ‘‘workers’’
(or individuals with an MTurk account) to complete various
‘‘Human Intelligence Tasks’’ (HITs), such as completing
questionnaires or summarizing articles. Requesters pay eli-
gible workers (here, called ‘‘participants’’) upon successful
submission of HITs they choose to complete.
The advantages of using MTurk for large-scale data col-
lection are well-documented (Horton and Chilton 2010; Suri
et al. 2011; Shapiro et al. 2013). For example, MTurk facili-
tates rapid, relatively low-cost data collection (median hourly
wage for MTurk HITs is $1.38; Horton and Chilton 2010,
although this value has increased slightly in recent years, see
Paolacci and Chandler 2014) from diverse participants living
around the world. Further, MTurk includes incentives for
producing high-quality data (i.e., data that pass various
accuracy and reliability checks); MTurk participants are in-
centivized to complete HITs carefully and honestly, as their
‘‘reputation’’ determines how many HITs they are permitted
to complete in the future (Rand 2012). Additionally, partici-
pants are identifiable only by their unique ‘‘Worker ID’’; all
participants’ personal information is stored on a high-security
server, which Requesters cannot access. Therefore, partici-
pants’ confidentiality within the study may be maintained (for
limitations and caveats regarding anonymity of MTurk
workers, see Lease et al. 2013). Participants’ unique ID
numbers also allow requesters (1) to prevent the same indi-
viduals from completing their HITs more than once, and (2) to
track participants over time for the purposes of conducting
longitudinal studies. Additional features of MTurk allow
requesters to specify eligibility requirements for participants
interested in completing their HITs (e.g., country of origin).
Finally, demographic research indicates that MTurk samples
are considerably more diverse and representative of the pop-
ulation, compared to college-student samples and community
samples collected near college towns, across many demo-
graphic dimensions (e.g., gender, age, race/ethnicity,
employment status, number of children) (Berinsky et al. 2012;
Paolacci et al. 2010).
MTurk has been used for data collection by researchers
from widely varying fields, such as linguistics (Gibson
et al. 2011), behavioral economics (Mason and Watts
2009), and experimental social psychology (Eriksson and
Simpson 2010). Despite its advantages, scientists investi-
gating clinically-relevant topics seldom use MTurk for data
collection purposes. This trend might, in part, result from
researchers’ concerns about data security and quality, as
well as questions about participants’ willingness to provide
highly personal information through the internet. However,
Shapiro et al. (2013) recently found that, among an adult
sample recruited via MTurk, mental health measures
demonstrated satisfactory internal reliability and test–retest
reliability. The authors also replicated associations between
psychopathology and established demographic predictors
3236 J Child Fam Stud (2015) 24:3235–3246
123
(e.g., unemployment) within the MTurk population, sug-
gesting criterion validity for their mental health measures
and method. These findings suggest that MTurk may be a
useful, valid resource for accessing and studying research
questions pertinent to clinical science and mental health.
That said, it should also be noted that Shapiro et al.
surveyed participants at only two time-points that were only
1 week apart. Longer lags may well be needed for research
into many causal processes. The feasibility of conducting
longer-term, multi-wave studies via MTurk on topics of
clinical relevance has not been thoroughly assessed. The
three studies that have tried to collect follow-up data from
participants (following single lags of 1–12 months) obtained
response rates between 44 and 60 % (Chandler et al. 2013).
However, further investigation is needed to determine
whether collecting data over longer periods of time via
MTurk tends to increase attrition rates (lags in direct contact
with the research team might make participants less inclined
to participate over time) or leave rates unaffected across
multiple study time-points (online surveys are more conve-
nient and accessible for participants). The presence of
attrition bias in longitudinal MTurk studies is also largely
unexplored. Conducting longitudinal research through
MTurk might carry benefits specific to studies on family
mental health. For instance, this approach might facilitate
(a) recruitment of more demographically diverse parent
samples, and (b) greater participation of fathers in studies on
familial risk and mental health.
To explore these possibilities, the present study tested the
usefulness and viability of MTurk as a tool for longitudinal,
clinically relevant survey research. Specifically, by recruiting
MTurk participants who were also parents, we examined
relations of several familial variables (parenting-related
stress; family dysfunction; low SES; family structure) to
mental health in parents and youths across 3 months (at
baseline, 1-month, and 2-month follow-up points). We
focused on four aspects of MTurk’s utility for studying family
processes and youth mental health. First, we assessed whether
parents recruited via MTurk produced high-quality and reli-
able survey data across time points. Parents were considered
high-quality reporters if they (a) responded correctly to an
attention test item embedded within the study survey,
(b) reported consistent demographic data over the course of
the study, and (c) showed adequate reliability across study
measures. Reliability was determined according to internal
consistency and test–retest reliability of the study variables.
Second, we evaluated attrition trends, noting rates of attrition
compared to those found in prior longitudinal studies and
testing for evidence of attrition bias in the MTurk parent
sample. Third, we assessed whether recruiting parents through
MTurk yielded a more representative proportion of partici-
pating fathers, single-parent families, and ethnic minorities
compared to prior studies. Fourth, we evaluated criterion
validity of the data by comparing previously established
relations between parent symptoms, youth problems, family
functioning, parental stress to those observed in the present
study.
In this study, time lags of 1 month between assessment
points were chosen for several reasons. First, a lag of
1 week seemed too brief to allow for valid assessment of
complex familial processes, especially relations between
family functioning and youth symptomatology, which may
develop over much longer periods of time. Second, the
viability of MTurk as a tool for survey research over
periods much longer than 1 week (e.g., more than 1 year)
has not been formally assessed. Thus, 1 month was chosen
as a conservative extension of previously tested lags, with
greater theoretical relevance than 1-week lags for longi-
tudinal studies of familial processes.
Method
Participants
Participants were recruited through Amazon’s MTurk
under the restrictions that they were current U.S. residents
(determined via (a) MTurk’s built-in settings, which allow
requesters to make HITs visible to U.S. workers only, and
(b) participants’ responding from a U.S. Internet Protocol
address, which were individually checked for each partic-
ipant), had at least a 95 % task approval rate for previous
HITs (i.e., rate of receiving approval for completing pre-
vious HITs; worker reputation of 95 % and above has been
demonstrated as a sufficient condition for high data quality
on MTurk, Pe’er et al. 2014), and were parents of at least
one youth between the ages of 4 and 18.
Procedure
To determine parent-status, MTurk participants interested in
the study completed a 3-item qualifying questionnaire as part
of a linked survey. The three questions were: (1) Are you or
any of your immediate family members fluent in any lan-
guages aside from English? (2) Do you have one or more
children (either biological or non-biological) between the ages
of 4 and 18? and (3) Do you have any siblings (either bio-
logical or non-biological) within 4 years of your age? Worker
IDs were also collected in order to identify individuals who
attempted the screener more than once. Question (2) of the
screener determined participants’ eligibility, while (1) and (3)
were filler questions. Filler questions were included so that
participants did not know which screening item determined
study qualification, reducing the likelihood of false responses
to gain access to the study. For participants selecting ‘‘no’’ for
question 2, the externally-linked survey was programmed to
J Child Fam Stud (2015) 24:3235–3246 3237
123

automatically end, and a message was displayed thanking the
participant for his or her participation. Participants who were
excluded from the study at this point were instructed not to
submit the HIT and therefore did not receive payment. Par-
ticipants who selected ‘‘yes’’ for question 2 were presented
with the first battery of study measures upon completing the
qualifying questionnaire.
Participants who completed the study measures at this
first assessment point (T1) were invited to complete the
same set of measures at 1-month (T2) and 2-month (T3)
follow-ups. Participants received study reminders through
the secure MTurk messaging system, which identifies
participants only by their unique IDs. Participants com-
pleting T1 assessments received three reminders to com-
plete both T2 and T3 assessments, each over the course of
6 days. Participants who did not complete an assessment
within 1 week of receiving the first reminder were con-
sidered non-responders for that time point.
Upon successful completion of the first assessment bat-
tery (i.e., the participant answers at least 80 % of questions
and responds to the ‘‘attention test’’ item correctly), partic-
ipants received $1.00. Upon successful completion of the
second assessment battery (T2; 1 month from baseline),
participants received $1.10, and upon completion of the
third assessment battery (T3; 2 months from baseline),
participants received $1.20. In all, eligible participants who
completed all three assessment batteries earned $3.30.
Payments per hour thus ranged from $2.20 to $2.60, all
above the median hourly wage for tasks performed on
MTurk ($1.38) (Horton and Chilton 2010; notably, the
median hourly wage has increased since the present data
were collected; see Paolacci and Chandler 2014).
Measures
The assessment battery took approximately 20–30 min to
complete, was identical across time points, and included
the following measures:
Demographic Questionnaire
This questionnaire asks participants for basic socioeco-
nomic and demographic information (e.g., age, gender,
number of children, marital status, education, family
income), as well as several items from the Macarthur Scale
of Subjective Social Status (Adler et al. 2000).
For the purposes of this study, it was important to assess
parents’ level of contact with their child(ren), specifically
whether they were living with their child(ren) at the time of
the study. Thus, the demographic questionnaire included the
following questions: ‘‘How many people are living in your
household, including yourself?’’; ‘‘Of the people living in
your house, how many are children (18 or under)?’’; and ‘‘Of
the people living in your house, how many are adults?’’
Based on responses to these questions, we determined that
all parents participating in this study were living with at least
one child at the time of the questionnaire. Further, in all but
four cases, parents’ numerical responses to ‘‘how many
children do you have?’’ were the same as their responses to
‘‘of the people living in your house, how many are children
(18 or under)?’’ Thus, all but four parents were living with
all of their children—including the child they chose to report
on for the questionnaires—when they completed this study.
In the four cases where these two numbers differed, children
older than the age of 18 were also living in participants’
home at the time of the survey.
Mental Health Inventory-18 (MHI; Veit and Ware 1983)
The MHI-18 is an 18-item self-report measure that asks
parents to rate their emotional and behavioral distress
during the past month. Items are rated on a six-point Likert
scale, with higher scores indicating more psychological
distress (items 1, 3, 5, 7, 8, 10, 13, and 15 are reverse-
scored). Sample item include: ‘‘Have you been in firm
control of your behavior, thoughts, and feelings?’’ ‘‘Have
you felt downhearted and blue?’’ and ‘‘Have you been a
very nervous person?’’ The MHI yields four sub-scores
(Anxiety, Depression, Behavioral Control, and Positive
Affect) and one total score representing overall distress.
The total MHI score has shown high internal consistency,
a = .96 (Veit and Ware 1983). Further, total scores on the
measure have correlated highly with other self-reported
measures of psychological health and stressful life events
(Williams, Ware, and Donald 1981), as well as clinically
diagnosed depression (Cassileth et al. 1984), supporting the
MHI’s construct validity. Due to the MHI’s length (18
items, versus 90-items in the more broadly used Symptom
Checklist-90, Derogatis et al. 1973), it was well-suited for
inclusion in a brief, online survey-based study.
Strengths and Difficulties Questionnaire (SDQ; Goodman
1997)
This measure asks parents about their child’s difficulties
regarding behavior, emotions and peer relations. It com-
prises five scales of five items each rated on a 3-point scale.
The scales are emotional symptoms, conduct problems,
hyperactivity, peer problems and pro-social behavior. A
total difficulties score ranging from 0 to 40, representing
increasing difficulties, is derived by summing scores on the
first four of these subscale. Sample items include: ‘‘Many
worries, or always seems worred;’’ ‘‘Has at least one good
friend;’’ ‘‘Often fights with other youth or bullies them;’’
and ‘‘often unhappy, depressed, or tearful.’’ At the first
assessment point, parents were asked to complete the the
3238 J Child Fam Stud (2015) 24:3235–3246
123

SDQ with reference to whichever of their children has
displayed ‘‘the most emotional or behavioral problems in
the last month’’ (it was not feasible to ask parents to report
on their oldest child at each time point because some
parents had adult children well over the age of 18). At the
second and third assessment points, they were asked to
complete the SDQ with reference to the same child as they
did previously. The SDQ total score has shown adequate
internal consistency in a sample of 900 parents, a = .76
(Smedje, Broman, Hetta, and von Knorring 1999). Con-
struct validity for the SDQ Total Score has been shown
through high correlations with other parent-rated measures
of youth problems, including the Child Behavior Checklist
(Achenbach 1991) and the Rutter Quesionnaires (Elander
and Rutter 1996; Goodman and Scott 1999). Because of the
SDQ’s length (25 items, versus the Child Behahior
Checklist’s 118 items), it was well-suited for inclusion in a
brief, online survey-based study.
Family Functioning Style Scale (FFSS; Trivette et al.
1990)
This 26-item self-report measure assesses the extent to
which a parent believes his or her family is characterized by
different strengths, capabilities and competencies. The scale
covers five domains: interactional patterns, family values,
coping strategies, family commitment, and resource mobi-
lization. Items are rated on a 5-point Likert scale from ‘‘not
at all like my family’’ to ‘‘very much like my family.’’
Sample items include: ‘‘We take pride in even the smallest
accomplishments of family members;’’ ‘‘We generally agree
about the things that are important to our family;’’ and
‘‘Even in our busy schedules, we find time to be together.’’
The FFSS total score has shown adequate internal consis-
tency and split-half reliability (a’s = .92) in a sample of 105
parents (Trivette et al. 1990). Lower FFSS total scores,
indicating stronger family functioning and strengths, have
shown relations to fewer family-related health problems and
higher subjective well-being (Dunst et al. 1988).
Parental Stress Scale (PSS; Berry and Jones 1995)
The PSS is a self-report scale that contains 18 items rep-
resenting pleasure or positive themes of parenthood
(emotional benefits, self-enrichment, personal develop-
ment; e.g., ‘‘Having child(ren) gives me a more certain and
optimistic view of the future’’) and negative components
(demands on resources, opportunity costs and restrictions;
e.g., ‘‘Having child(ren) has meant having too few choices
and too little control over my life’’). This measure was
developed in response to the need for a specific measure
targeting the impact of stress associated with the role of
parenting. Higher scores indicate greater parental stress.
The PSS total score has demonstrated adequate internal
consistency, a = .85 (Griffin et al. 2010), and strong
relations with other measures of parenting stress, including
the Parenting Stress Index (Abidin 1995), as well as mea-
sures of subjective well-being, role satisfaction, loneliness,
anxiety, marital and job satisfaction, state-trait guilt, and
perceived social support (Abidin 1986; Cohen et al. 1983).
Within the FFSS, an attention test item was embedded to
ensure participants’ alertness during the assessments. This
questions read as follows: ‘‘Select ‘sometimes like my
family’ as your response to this question.’’ Response
options for the attention test item were identical to those of
all FFSS items. If participants responded incorrectly to the
attention test item, they were excluded from the study.
(Notably, a recent study—which was conducted after the
present study had been completed—found that attention
test items may not improve data quality in MTurk studies
(Paolacci and Chandler 2014). Thus, this tactic may be
unnecessary in future studies).
Data Analyses
Descriptive statistics were run to assess the demographics of
the sample. Reliability of parents’ reporting was assessed via
the consistency of their reported demographic information
and their response to the attention test item. Internal con-
sistency of data was assessed via alpha coefficient calcula-
tions, and test–retest reliability was assessed by examining
correlations within measures across study time points (e.g.,
correlations between T1 SDQ, T2 SDQ, and T3 SDQ
scores). Attrition and attrition bias were assessed via t tests,
which explored possible demographic or related differences
between study completers and non-completers. Criterion
validity of measures was evaluated by examining zero-order
correlations between parent symptoms, youth problems,
family functioning and parental stress, and comparing these
associations to those observed in prior studies on these
topics.
Results
Reliability of Reporting and Demographics
206 parents submitted surveys at T1. Of these parents, 16
(7.77 %) responded incorrectly to the attention test item at
T1 and were excluded from the study. Additionally, 9
parents provided inconsistent demographic information and
6 responded incorrectly to the attention-test item at a
subsequent time-point (two participants fit both of these
exclusion criteria). After excluding these participants, the
total sample was 177 at T1 (i.e., 85.92 %), 107 at T2, and
85 at T3. Of the 206 parents who initially submitted
J Child Fam Stud (2015) 24:3235–3246 3239
123
surveys, 7.77 % were excluded due to failure on the
attention test item at T1, 2.91 % at T2, and none at T3. An
additional 2.91 % of participants were excluded at T2 for
providing inconsistent demographic information, and
0.49 % were excluded for this reason at T3. Failure on the
attention test and inconsistent demographic information
accounted for 23.90 % of study non-completion. All other
attrition in the study occurred due to nonresponse at T2 or
T3.
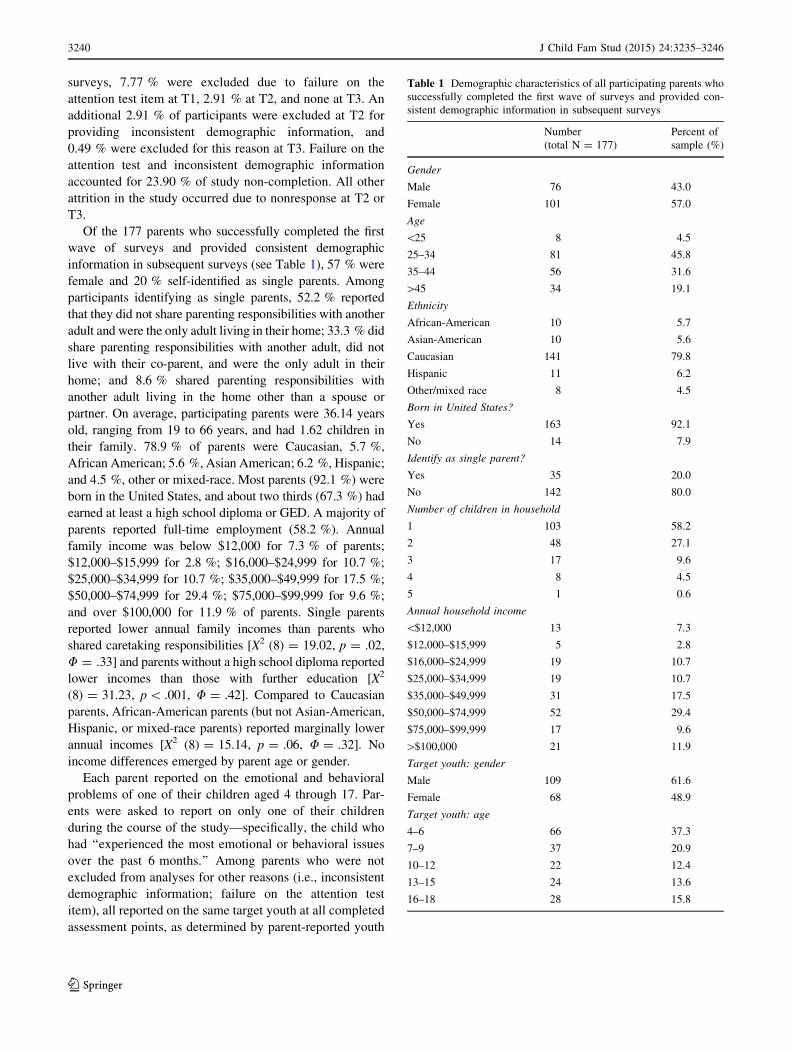
Of the 177 parents who successfully completed the first
wave of surveys and provided consistent demographic
information in subsequent surveys (see Table 1), 57 % were
female and 20 % self-identified as single parents. Among
participants identifying as single parents, 52.2 % reported
that they did not share parenting responsibilities with another
adult and were the only adult living in their home; 33.3 % did
share parenting responsibilities with another adult, did not
live with their co-parent, and were the only adult in their
home; and 8.6 % shared parenting responsibilities with
another adult living in the home other than a spouse or
partner. On average, participating parents were 36.14 years
old, ranging from 19 to 66 years, and had 1.62 children in
their family. 78.9 % of parents were Caucasian, 5.7 %,
African American; 5.6 %, Asian American; 6.2 %, Hispanic;
and 4.5 %, other or mixed-race. Most parents (92.1 %) were
born in the United States, and about two thirds (67.3 %) had
earned at least a high school diploma or GED. A majority of
parents reported full-time employment (58.2 %). Annual
family income was below $12,000 for 7.3 % of parents;
$12,000–$15,999 for 2.8 %; $16,000–$24,999 for 10.7 %;
$25,000–$34,999 for 10.7 %; $35,000–$49,999 for 17.5 %;
$50,000–$74,999 for 29.4 %; $75,000–$99,999 for 9.6 %;
and over $100,000 for 11.9 % of parents. Single parents
reported lower annual family incomes than parents who
shared caretaking responsibilities [X2 (8) = 19.02, p = .02,
U = .33] and parents without a high school diploma reported
lower incomes than those with further education [X2
(8) = 31.23, p\ .001, U = .42]. Compared to Caucasian
parents, African-American parents (but not Asian-American,
Hispanic, or mixed-race parents) reported marginally lower
annual incomes [X2 (8) = 15.14, p = .06, U = .32]. No
income differences emerged by parent age or gender.
Each parent reported on the emotional and behavioral
problems of one of their children aged 4 through 17. Par-
ents were asked to report on only one of their children
during the course of the study—specifically, the child who
had ‘‘experienced the most emotional or behavioral issues
over the past 6 months.’’ Among parents who were not
excluded from analyses for other reasons (i.e., inconsistent
demographic information; failure on the attention test
item), all reported on the same target youth at all completed
assessment points, as determined by parent-reported youth
Table 1 Demographic characteristics of all participating parents who
successfully completed the first wave of surveys and provided con-
sistent demographic information in subsequent surveys
Number
(total N = 177)
Percent of
sample (%)
Gender
Male 76 43.0
Female 101 57.0
Age
\25 8 4.5
25–34 81 45.8
35–44 56 31.6
[45 34 19.1
Ethnicity
African-American 10 5.7
Asian-American 10 5.6
Caucasian 141 79.8
Hispanic 11 6.2
Other/mixed race 8 4.5
Born in United States?
Yes 163 92.1
No 14 7.9
Identify as single parent?
Yes 35 20.0
No 142 80.0
Number of children in household
1 103 58.2
2 48 27.1
3 17 9.6
4 8 4.5
5 1 0.6
Annual household income
\$12,000 13 7.3
$12,000–$15,999 5 2.8
$16,000–$24,999 19 10.7
$25,000–$34,999 19 10.7
$35,000–$49,999 31 17.5
$50,000–$74,999 52 29.4
$75,000–$99,999 17 9.6
[$100,000 21 11.9
Target youth: gender
Male 109 61.6
Female 68 48.9
Target youth: age
4–6 66 37.3
7–9 37 20.9
10–12 22 12.4
13–15 24 13.6
16–18 28 15.8
3240 J Child Fam Stud (2015) 24:3235–3246
123
age. Target youths were 61.6 % boys and ranged in age
from 4 to 18 years at T1, M(SD) = 9.19(5.121).
Data Quality
Psychometrics
As in previous studies using MTurk (e.g., Shapiro et al.
2013), participants in this study produced high-quality
data. Parents’ responses on all study measures demon-
strated good internal consistency at all time points (all
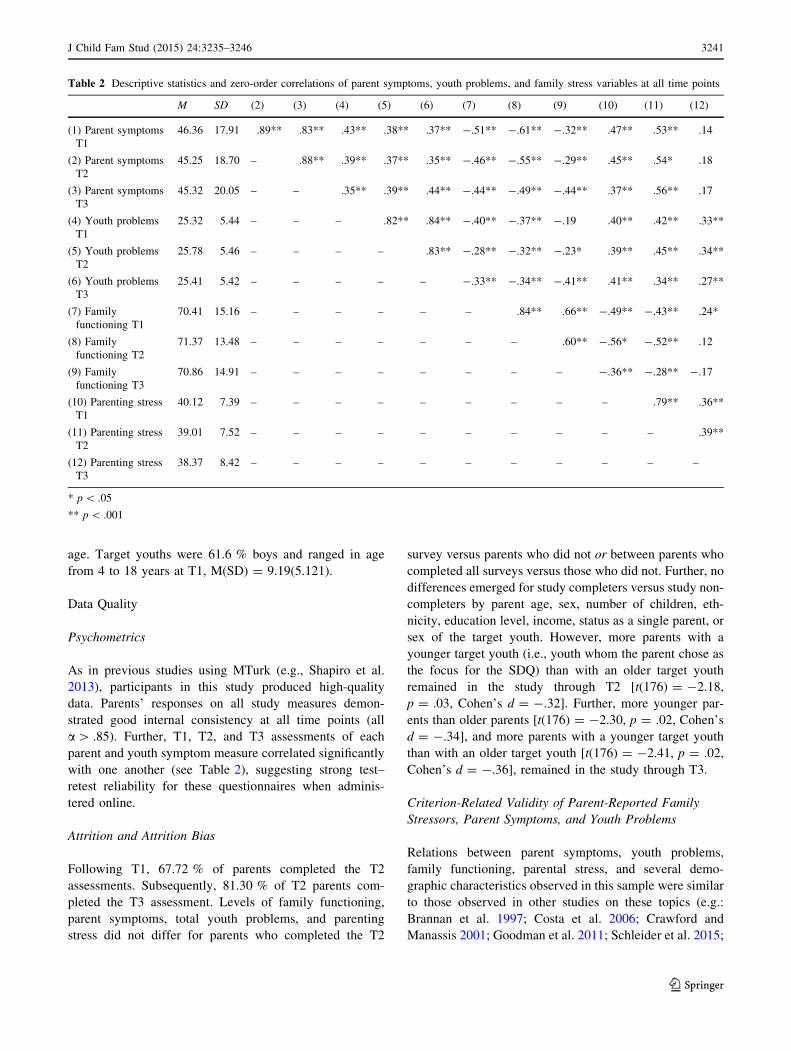
a[ .85). Further, T1, T2, and T3 assessments of each
parent and youth symptom measure correlated significantly
with one another (see Table 2), suggesting strong test–
retest reliability for these questionnaires when adminis-
tered online.
Attrition and Attrition Bias
Following T1, 67.72 % of parents completed the T2
assessments. Subsequently, 81.30 % of T2 parents com-
pleted the T3 assessment. Levels of family functioning,
parent symptoms, total youth problems, and parenting
stress did not differ for parents who completed the T2
survey versus parents who did not or between parents who
completed all surveys versus those who did not. Further, no
differences emerged for study completers versus study non-
completers by parent age, sex, number of children, eth-
nicity, education level, income, status as a single parent, or
sex of the target youth. However, more parents with a
younger target youth (i.e., youth whom the parent chose as
the focus for the SDQ) than with an older target youth
remained in the study through T2 [t(176) = -2.18,
p = .03, Cohen’s d = -.32]. Further, more younger par-
ents than older parents [t(176) = -2.30, p = .02, Cohen’s
d = -.34], and more parents with a younger target youth
than with an older target youth [t(176) = -2.41, p = .02,
Cohen’s d = -.36], remained in the study through T3.
Criterion-Related Validity of Parent-Reported Family
Stressors, Parent Symptoms, and Youth Problems
Relations between parent symptoms, youth problems,
family functioning, parental stress, and several demo-
graphic characteristics observed in this sample were similar
to those observed in other studies on these topics (e.g.:
Brannan et al. 1997; Costa et al. 2006; Crawford and
Manassis 2001; Goodman et al. 2011; Schleider et al. 2015;
Table 2 Descriptive statistics and zero-order correlations of parent symptoms, youth problems, and family stress variables at all time points
M SD (2) (3) (4) (5) (6) (7) (8) (9) (10) (11) (12)
(1) Parent symptoms
T1
46.36 17.91 .89** .83** .43** .38** .37** -.51** -.61** -.32** .47** .53** .14
(2) Parent symptoms
T2
45.25 18.70 – .88** .39** .37** .35** -.46** -.55** -.29** .45** .54* .18
(3) Parent symptoms
T3
45.32 20.05 – – .35** .39** .44** -.44** -.49** -.44** .37** .56** .17
(4) Youth problems
T1
25.32 5.44 – – – .82** .84** -.40** -.37** -.19 .40** .42** .33**
(5) Youth problems
T2
25.78 5.46 – – – – .83** -.28** -.32** -.23* .39** .45** .34**
(6) Youth problems
T3
25.41 5.42 – – – – – -.33** -.34** -.41** .41** .34** .27**
(7) Family
functioning T1
70.41 15.16 – – – – – – .84** .66** -.49** -.43** .24*
(8) Family
functioning T2
71.37 13.48 – – – – – – – .60** -.56* -.52** .12
(9) Family
functioning T3
70.86 14.91 – – – – – – – – -.36** -.28** -.17
(10) Parenting stress
T1
40.12 7.39 – – – – – – – – – .79** .36**
(11) Parenting stress
T2
39.01 7.52 – – – – – – – – – – .39**
(12) Parenting stress
T3
38.37 8.42 – – – – – – – – – – –
* p\ .05
** p\ .001
J Child Fam Stud (2015) 24:3235–3246 3241
123

van Oort et al. 2010). Higher levels of parent symptoms
significantly correlated with weaker family functioning,
greater parenting-related stress, and more youth problems
within and across all time points (with the exception of T3
parenting-related stress, which did not correlate with parent
symptoms). Weaker family functioning was linked with
more youth problems across time points, with the exception
of T2 youth problems with T3 family functioning, which
were not significantly correlated. Higher parent symptoms
showed relations with greater youth problems across time
points. All correlations between main study variables were
consistent with prior research, which has suggested strong,
positive correlations between parent symptoms, parenting-
related stress, youth problems, and family dysfunction in
community and clinical samples (Bogels and Brechman-
Toussaint 2006; Burstein et al. 2010; Hammen 2009;
Schleider et al. 2015; van Oort et al. 2010).
Prior research has suggested that single-parent status and
lower family income correlate with higher parent symptoms
and youth problems (Schleider et al. 2014; Schleider et al.
2015), as well as various familial stressors (Conger et al. 1994;
Costello et al. 2003; Dearing et al. 2004). These findings were
partially replicated in the present study (see Table 3). Lower-
income parents reported more symptoms at T1 and T2, as well
as greater parenting-related stress at T2 and lower family
functioning at T3, than did higher-income parents. Further,
single parents reported more T1 symptoms and marginally
more target youth problems at T1, compared to parents who
shared parenting responsibilities, although these differences
did not persist at T2 and T3. Separately, Asian-American
parents reported higher T1 family functioning [t(176) = 2.85,
p = .01, Cohen’s d = .43] and fewer T1 youth problems
[t(176) = -2.32, p = .04, Cohen’s d = -.34] than Cauca-
sian parents, and Hispanic parents reported lower symptoms at
T1 [t(176) = -2.14, p = .04, Cohen’s d = -.32] and T2
[t(106) = -3.15, p = .01, Cohen’s d = -.61] than Cauca-
sian parents. No other differences in mean study variables by
parent ethnicity were observed. Parents reported greater youth
problems for boys than girls at T1 [t(176) = 3.17, p = .002,
Cohen’s d = .47] but reported similar problem levels for girls
and boys at T2 and T3. Parents’ report of youth problems did
not differ by youth age.
Discussion
The present study evaluated the utility of MTurk as a tool for
longitudinal studies on family processes and youth mental
health. Overall, the findings suggest that MTurk may be a
viable tool for some kinds of longitudinal, clinically-relevant
research in this area, with several advantages and certain
limitations. Participating parents provided largely high-qual-
ity data. Measures of parent symptoms and youth problems
displayed adequate internal consistency and test–retest reli-
ability, and correlations between study measures paralleled
those observed in prior research. Attrition in the present study
was higher than would be ideal, but there was almost no evi-
dence of attrition bias. Further, a substantial proportion of
participating MTurk parents were fathers, and proportions of
the sample that were Caucasian and from single-parent homes
were consistent with rates in prior studies in the field (Seiffge-
Krenke and Kollmar 1998; Eisenberg et al. 2005).
This study demonstrated several strengths of MTurk as a
tool for collecting survey data on familial processes. One
Table 3 Differences in parent
symptoms, parenting-related
stress, family functioning, and
youth problems by (a) annual
income and (b) single-parent
status at all study time-points
(T1, T2, T3)
? p\ .10
* p\ .05
** p\ .001
Variables in t test T1 T2 T3
Annual income; parent symptoms t(176) = -2.75* t(106) = -2.10* t(84) = -1.72
Cohen’s d = -.38 Cohen’s d = -.41 Cohen’s d = -.38
Annual income; parenting stress t(176) = -1.50 t(106) = -2.11* t(84) = -1.40
Cohen’s d = -.23 Cohen’s d = -.41 Cohen’s d = -.31
Annual income; family functioning t(176) = 2.14 t(106) = 1.49 t(84) = 1.79?
Cohen’s d = .32 Cohen’s d = .29 Cohen’s d = .39
Annual income; youth problems t(176) = -.62 t(106) = -2.39 t(84) = -1.68
Cohen’s d = -.10 Cohen’s d = -.46 Cohen’s d = -.37
Single-parent status; parent symptoms t(176) = -2.44* t(106) = -.20 t(84) = -.39
Cohen’s d = -.36 Cohen’s d = -.04 Cohen’s d = -.09
Single-parent status; parenting stress t(176) = -.18 t(106) = -.20 t(84) = .25
Cohen’s d = -.02 Cohen’s d = -.04 Cohen’s d = .05
Single-parent status; family functioning t(176) = -.56 t(106) = -.72 t(84) = .05
Cohen’s d = -.08 Cohen’s d = -.14 Cohen’s d = .01
Single parent status; youth problems t(176) = -1.90? t(106) = -.60 t(84) = -.21
Cohen’s d = -.28 Cohen’s d = -.12 Cohen’s d = -.05
3242 J Child Fam Stud (2015) 24:3235–3246
123

strength was the relative absence of attrition bias, despite
levels of attrition across the study. Attrition rates have varied
widely across studies on community parent and youth
samples. Indeed, attrition rates have ranged from 0 % to
over 90 % in such studies, depending on the methodologies
employed (De Graaf et al. 2000; Yancey et al. 2006). In
studies on family processes with strong retention strategies
(e.g.,[10 attempts to contact each parent at each study time
point, via several means of communication), attrition rates
tend to be lower (Cotter et al. 2005). Because of this wide
variability, attrition bias provides a helpful metric for
retention-related concerns. In the absence of attrition bias,
effects of participant dropout on internal validity of findings
may be attenuated (Miller and Hollist 2007). In this study,
we observed little evidence of attrition bias over the course
of the study. Across time points, study completers versus
non-completers did not differ significantly in mean scores on
any of the main study variables (family functioning, parent
symptoms, youth problems, parenting stress). These groups
also did not differ on the majority of demographic variables.
This finding is encouraging, given the commonality of
attrition bias in multi-wave studies (Goodman 1996)—
especially in such studies assessing clinically-relevant
problems (De Graaf et al. 2000)—methodologies that result
in relatively little attrition bias can be highly valuable tools.
Compared to other recruitment and retention strategies,
using MTurk as a study platform may provide easier
accessibility and built-in incentives conducive to largely
unsystematic dropout trends.
That said, the study was not entirely free of attrition
bias: parents with a younger target youth were less likely to
remain in the study through T2 than were parents with an
older target youth, and younger parents and parents with a
younger target youth were less likely to remain in the study
through T3 than were older parents with an older target
youth. These trends may have occurred because caring for
younger youths often requires more time, resources, and
attention from parents than caring for older youths, who are
able to function more independently. Therefore, parents
with older youths might have more time available for
completing tasks like this study’s survey.
A second strength of using MTurk for research on
family processes, demonstrated by this study, is this
method’s ability to facilitate recruitment of fathers in
addition to mothers. Specifically, 43 % of parent partici-
pants in this study were fathers. This rate is a considerable
departure from prior research related to youth mental
health problems, in which fathers are often underrepre-
sented in or excluded from studies. Historically, fathers
have not been activity recruited for family-based research
as frequently as mothers in studies on family processes and
youth mental health (Phares et al. 2005). For instance, in a
review of 508 articles on psychopathology and abnormal
youth development Phares et al. (2005) found that 45 % of
studies included mothers only, 2 % included fathers only,
25 % included both mothers and fathers and analyzed the
data separately, 28 % included parents without specifying
parental gender. Conducting family-based research via
MTurk increases accessibility of such studies to parents of
both genders, enabling equal recruitment of all MTurk
workers who are parents. Thus, family-based research
conducted via MTurk may yield more participation of
fathers, yielding more gender-balanced samples than
studies conducted in traditional settings and enabling sep-
arate analyses for mothers and fathers.
This study also demonstrated a third strength of using
MTurk to explore family processes and youth mental
health: demographics of parents recruited via MTurk were
comparable to prior, community-based studies’ samples.
For instance, in a meta-analysis on ethnic representation
across participants in 2,536 applied psychology studies,
found that research samples were (on average) 74.10 %
Caucasian, 16.4 % African American, 5.7 % Hispanic,
2.8 % Asian American, and 1.1 % American Indian. In the
present study, parents were 78.9 % Caucasian, 5.7 %
African American, 5.6 % Asian American, 6.2 % Hispanic
or Latino, and 4.5 % mixed race or other. Therefore,
compared to other samples in applied psychology research,
Caucasian and Asian American parents were slightly
overrepresented in this study, whereas all other ethnic
groups were slightly underrepresented. Other investigators
have noted that of Caucasian and Asian American partic-
ipants tend to be overrepresented in studies conducted via
MTurk, which may reflect differential patterns of internet
access (Paolacci and Chandler 2014). Single-parent fami-
lies were also represented comparably in this study and
prior research on family processes (e.g., Seiffge-Krenke
and Kollmar 1998; Eisenberg et al. 2005), and the pro-
portion of participants identifying as single parents (20 %)
was similar to the national average (25.9 %; Vespa et al.
2013). If beneficial for specific research questions,
researchers may aim to increase MTurk sample diversity
by recruiting parents according to demographic features,
such as single-parent status or ethnic identity. However, if
fewer parents using MTurk fall into these groups, selective
recruitment may require longer periods of time.
This study also has limitations that warrant mentions.
First, although attrition bias is more inherently harmful to
internal validity than attrition itself, it is important to note
the relatively high attrition rate in this study from T1 to T3
(44.07 %). Most of this attrition occurred from T1 to T2
(over 80 % of parents who responded to T2 successfully
completed the T3 assessment point); thus, the majority of
dropout occurred in the first month of the study. Further,
attrition in this study was lower than attrition in existing
longitudinal MTurk studies (see Chandler et al. 2013),
J Child Fam Stud (2015) 24:3235–3246 3243
123

suggesting that greater retention may be feasible. Future
research using MTurk for research on familial processes
might (a) begin with larger parent samples—easily and
rapidly recruited via MTurk—to maintain high statistical
power over the course of the study; (b) provide greater
monetary incentives than those offered in this study; and
(c) send more frequent reminder messages regarding sub-
sequent assessment points (three reminders at both T2 and
T3 were sent in this study). Separately, the study is limited
by its sample size, which is limited sample size compared
to other MTurk-based validation studies (e.g., Shapiro et al.
2013). This may limit the generalizability of present find-
ings. Further, this study did not include a formal assess-
ment of participant malingering, or endorsing to response
patterns that are highly unlikely to occur (for more details
on formal assessment of malingering, see Arbisi and Ben-
Porath 1995). Future studies may include additional com-
prehensive strategies for detecting unreliable reporters.
Beyond study-specific limitations, this study highlights
limitations to the MTurk method that should be noted. Data
collection via MTurk is inherently limited to one reporter
per MTurk account. Thus, it would not be feasible to obtain
reliable, verifiable survey data from two co-parents, or a
parent–child pair, in one MTurk study. Given documented
discrepancies between youth and parent reports—and even
between co-parents’ reports—of youth symptoms and family
processes (e.g., De Los Reyes and Kazdin 2005), it is clear
that individual parent informants offer just one of many
views on these factors and their links over time. Certainly,
for some research questions, individual parent-report data
might be sufficient, but candidate methods for any given
study should be thoughtfully assessed and compared. Like
all methods of recruiting subjects and collecting data lon-
gitudinally, the MTurk approach has strengths and limita-
tions that merit careful, study-specific consideration.
Overall, present findings point to potential benefits and
drawbacks of MTurk as a tool for conducting longitudinal
research on family mental health. MTurk might be a useful
tool for hypothesis-generating longitudinal studies. First-
step research of this kind could be an integral part of an
efficient strategy for initially identifying candidate causal
mechanisms among family factors and youth mental health
trajectories and then testing them more definitively.
Because large-scale longitudinal studies are time-consum-
ing and costly, it makes good sense to design them in the
best-informed way possible, with strong empirical bases
for selecting candidate models. One way to identify such
models is through a longitudinal online study, like the one
described here, which allows rapid collection of high-
quality parent data at a low cost (e.g., the total cost of the
present study was less than $500). As the first step in a two-
step strategy, longitudinal online studies may inform the
development and enhance the productivity of larger-scale,
clinically relevant research on youths and families.
References
Abidin, R. (1986). Parenting stress index (2nd ed.). Charlottesville,
VA: Pediatric Psychology Press.
Abidin, R. R. (1995). Parenting stress index: Professional manual
(3rd ed.). Odessa, FL: Psychological Assessment Resources.
Achenbach, T. M. (1991). Integrative guide for the 1991 CBCL/4-18,
YSR, and TRF profiles. Burlington: Department of Psychiatry,
University of Vermont.
Adler, N. E., Epel, E. S., Castellazzo, G., & Ickovics, J. R. (2000).
Relationship of subjective and objective social status with
psychological and physiological functioning: Preliminary data in
healthy, White women. Health Psychology, 19, 586–592.
Arbisi, P. A., & Ben-Porath, Y. S. (1995). An MMPI-2 infrequent
response scale for use with psychopathological populations: The
infrequency-psychopathology scale. Psychological Assessment,
7, 424.
Berinsky, A. J., Huber, G. A., & Lenz, G. S. (2012). Evaluating online
labor markets for experimental research: Amazon.com’s
Mechanical Turk. Political Analysis, 20, 351–368.
Berry, J. O., & Jones, W. H. (1995). The parental stress scale: Initial
evidence. Journal of Social and Personal Relationships, 12,
463–472.
Bianchi, S. M., & Milkie, M. A. (2010). Work and family research in
the first decade of the 21st century. Journal of Marriage and
Family, 72, 705–725.
Bogels, S. M., & Brechman-Toussaint, M. L. (2006). Family issues in
child anxiety: Attachment, family functioning, parental rearing
and beliefs. Clinical Psychology Review, 26, 834–856.
Brannan, A. M., Heflinger, C. A., & Bickman, L. (1997). The
Caregiver Strain Questionnaire: Measuring the impact on the
family of living with a child with serious emotional disturbance.
Journal of Emotional and Behavioral Disorders, 5, 212–222.
Burstein, M., Ginsburg, G. S., & Tein, J.-Y. (2010). Parental anxiety
and child symptomatology: An examination of additive and
interactive effects of parent psychopathology. Journal of
Abnormal Child Psychology, 38, 897–909.
Cassileth, B. R., Lusk, E. J., Strouse, T. B., Miller, D. S., Brown, L.
L., Cross, P. A., & Tenaglia, A. (1984). Psychosocial status in
chronic illness. The New England Journal of Medicine, 311,
506–511.
Chandler, J., Mueller, P., & Paolacci, G. (2013). Nonnaıvete among
Amazon Mechanical Turk workers: Consequences and solutions
for behavioral researchers. Behavior Research Methods, 46,
112–130.
Chorpita, B. F., & Barlow, D. H. (1998). The development of anxiety:
The role of control in the early environment. Psychological
Bulletin, 124, 3–21.
Chorpita, B. F., Brown, T. A., & Barlow, D. H. (1998). Perceived
control as a mediator of family environment in etiological
models of childhood anxiety. Behavior Therapy, 29, 457–476.
Cohen, S., Kamarck, T., & Mermelstein, R. (1983). A global measure
of perceived stress. Journal of Health and Social Behavior, 24,
385–396.
Conger, R. D., Elder, G. H, Jr, Lorenz, F. O., Simons, R. L., &
Whitbeck, L. B. (1994). Families in troubled times. New York:
De Gruyter.
Cooper, C. E., Mclanahan, S. S., Meadows, S. O., & Brooks-gunn, J.
(2010). Family structure transitions and maternal parenting
stress. Journal of Marriage and Family, 71(3), 558–574.
3244 J Child Fam Stud (2015) 24:3235–3246
123

Costa, N. M. & Weems, C. F., Pellerin, K., & Dalton, R. (2006).
Parenting stress: An examination of specificity to internalizing
and externalizing symptoms. Journal Of Psychopathology and
Behavioral Assessment, 28, 113–122.
Costello, E. J., Compton, S. N., Keeler, G., & Angold, A. (2003).
Relationships between poverty and psychopathology: A natural
experiment. JAMA, 290, 2023–2029.
Cotter, R. B., Burke, J. D., Stouthamer-Loeber, M., & Loeber, R.
(2005). Contacting participants for follow-up: How much effort
is required to retain participants in longitudinal studies? Eval-
uation and Program Planning, 28, 15–21.
Crawford, A. M., & Manassis, K. (2001). Familial predictors of
treatment outcome in childhood anxiety disorders. Journal of the
American Academy of Child and Adolescent Psychiatry, 40,
1182–1189.
Day, R. D., & Lamb, M. E. (2004). Measuring and conceptualizing
fatherhood involvement. Mahwah, NJ: Erlbaum.
De Graaf, R., Bijl, R. V., Smit, F., Ravelli, A., & Vollebergh, W. A.
(2000). Psychiatric and socio-demographic predictors of attrition
in a longitudinal. American Journal of Epidemiology, 152,
1039–1047.
De Los Reyes, A., & Kazdin, A. E. (2005). Informant discrepancies in
assessment in childhood psychopathology: A critical review.
Psychological Bulletin, 131, 483–509.
Dearing, E., Taylor, B. A., & McCartney, K. (2004). Implications of
family income dynamics for women’s depressive symptoms
during the first 3 years after childbirth. American Journal of
Public Health, 94, 1372–1377.
Derogatis, L. R., Lipman, R. S., & Covi, L. (1973). SCL-90: An
outpatient psychiatric rating scale-preliminary report. Psycho-
pharmacology Bulletin, 9, 13–17.
Duhig, A. M., Renk, K., Epstein, M. E., & Phares, V. (2000).
Interparental agreement on internalizing, externalizing, and total
behavior problems: A meta-analysis. Clinical Psychology:
Science and Practice, 7, 435–453.
Dunst, C. J., Trivette, C. M., & Deal, A. G. (1988). Enabling and
empowering families: Principles and guidelines for practice.
Cambridge, MA: Brookline Books.
Eisenberg, N., Zhou, Q., Spinrad, T. L., Valiente, C., & Fabes, R. A.
(2005). Relations among positive parenting, children’s effortful
control, and externalizing problems: A three-wave longitudinal
study. Child Development, 76, 1055–1071.
Elander, J., & Rutter, M. (1996). Use and development of the Rutter
parents’ and teachers’ scales. International Journal of Methods
in Psychiatric Research, 6, 63–78.
Eriksson, K., & Simpson, B. (2010). Emotional reactions to losing
explain gender differences in entering a risky lottery. Judgment
and Decision Making, 5, 159–163.
Gibson, E., Piantadosi, S., & Fedorenko, K. (2011). Using Mechanical
Turk to obtain and analyze English acceptability judgments.
Language and Linguistics Compass, 5, 509–524.
Ginsburg, G. S., Siqueland, L., Masia-Warner, C., & Hedtke, K. A.
(2004). Anxiety disorders in children: Family matters. Cognitive
and Behavioral Practice, 11, 408–412.
Goodman, J. S. (1996). Assessing the non-random sampling effects of
subject attrition in longitudinal research. Journal of Manage-
ment, 22, 627–652.
Goodman, R. (1997). The strengths and difficulties questionnaire: A
research note. Journal of Child Psychology and Psychiatry, 38,
581–586.
Goodman, S. H., Rouse, M. H., Connell, A. M., Broth, M. R., Hall, C.
M., & Heyward, D. (2011). Maternal depression and child
psychopathology: A meta-analytic review. Clinical Child and
Family Psychology Review, 14, 1–27.
Goodman, R., & Scott, S. (1999). Comparing the strengths and
difficulties questionnaire and the child behavior checklist: Is
small beautiful? Journal of Abnormal Child Psychology, 27,
17–24.
Griffin, C., Guerin, S., Sharry, J., & Drumm, M. (2010). A multicentre
controlled study of an early intervention parenting programme
for young children with behavioural and developmental diffi-
culties. International Journal of Clinical Health and Psychology,
10, 279–294.
Hammen, C. (2009). Adolescent depression: Stressful interpersonal
contexts and risk for recurrence. Current Directions in Psycho-
logical Science, 18, 200–204.
Horton, J. J., & Chilton, L. B. (2010). The labor economics of paid
crowdsourcing. In Proceedings from EC’10: The 11th ACM
conference on electronic commerce (pp. 209–218). New York,
NY: ACM.
Kessler, R. C., Little, R. J. A., & Groves, R. M. (1995). Advances in
strategies for minimizing and adjusting for survey nonresponse.
Epidemiological Review, 17, 192–204.
Lamb, M. E. (Ed.). (2010). The role of the father in child development
(5th ed.). Hoboken NJ: Wiley.
Lease, M., Hullman, J., Bigham, J. P., Bernstein, M. S., Kim, K.,
Lasecki, W., et al. (2013). Mechanical Turk is not anonymous.
Social Science Research Network. doi:10.2139/ssrn.2228728.
Mason, W., & Suri, S. (2012). Conducting behavioral research on
Amazon’s Mechanical Turk. Behavior Research Methods, 44,
1–23.
Mason, W. A., & Watts, D. J. (2009). Financial incentives and the
‘‘Performance of crowds.’’ In Proceedings of the Human
Computation Workshop. Paris: ACM.
McQuaid, E., & Barakat, L. (2012). Introduction to special section:
Advancing research on the intersection of families, culture, and
health outcomes. Journal of Pediatric Psychology, 37(8),
827–831.
Miller, R. B. & Hollist, C. S. (2007). Attrition bias. Faculty
Publications, Department of Child, Youth, and Family Studies.
http://digitalcommons.unl.edu/famconfacpub/45
Paolacci, G., & Chandler, J. (2014). Inside the Turk: Understanding
Mechanical Turk as a participant pool. Current Directions in
Psychological Science, 23, 184–188.
Paolacci, G., Chandler, J., & Ipeirotis, P. (2010). Running experi-
ments on Amazon Mechanical Turk. Judgment and Decision
Making, 5, 411–419.
Pe’er, E., Vosgerau, J., & Acquisti, A. (2014). Reputation as a
sufficient condition for data quality on Amazon Mechanical
Turk. Behavior Research Methods, 46, 1023–1031.
Phares, V. (1992). Where’s poppa? The relative lack of attention to
the role of fathers in child and adolescent psychopathology.
American Psychologist, 47, 656–664.
Phares, V. (1997). Accuracy of informants: Do parents think that
mother knows best? Journal of Abnormal Child Psychology, 25,
215–226.
Phares, V., Fields, S., Kamboukos, D., & Lopez, L. (2005). Still
looking for Poppa. American Psychologist, 60, 735–736.
Rand, D. G. (2012). The promise of Mechanical Turk: How online
labor markets can help theorists run behavioral experiments.
Journal of Theoretical Biology, 299, 172–179.
Rapee, R. M. (1997). Potential role of childrearing practices in the
development of anxiety and depression. Clinical Psychology
Review, 17, 47–67.
Rubin, K. H., & Mills, R. S. (1990). Maternal beliefs about adaptive
and maladaptive social behaviors in normal, aggressive, and
withdrawn preschoolers. Journal of Abnormal Child Psychology,
18, 419–435.
Schleider, J. L., Chorpita, B. F., & Weisz, J. R. (2014). Relation
between parent psychiatric symptoms and youth problems:
Moderation through family structure and youth gender. Journal
of Abnormal Child Psychology, 42, 195–204.
J Child Fam Stud (2015) 24:3235–3246 3245
123

Schleider, J. L., Patel, A., Krumholz, L., Chorpita, B. F., & Weisz, J.
R. (2015). Relations between parent symptomatology and youth
problems: Multiple mediation through family income and
parent–youth stress. Child Psychiatry and Human Development,
46, 1–9.
Seiffge-Krenke, I., & Kollmar, F. (1998). Discrepancies between
mothers’ and fathers’ perceptions of sons’ and daughters’
problem behaviour: A longitudinal analysis of parent-adolescent
agreement on internalising and externalising problem behaviour.
Journal of Child Psychology, Psychiatry, and Allied Disciplines,
39, 687–697.
Shaffer, A., Lindhiem, O., Kolko, D. J., & Trentacosta, C. J. (2013).
Bidirectional relations between parenting practices and child
externalizing behavior: A cross-lagged panel analysis in the
context of a psychosocial treatment and 3-year follow-up.
Journal of Abnormal Child Psychology, 41, 199–210.
Shapiro, D. N., Chandler, J., & Mueller, P. A. (2013). Using
Mechanical Turk to study clinical populations. Clinical Psycho-
logical Science, 1, 213–220.
Smedje, H., Broman, J.-E., Hetta, J., & von Knorring, A.-L. (1999).
Psychometric properties of a Swedish version of the ‘‘strengths
and difficulties questionnaire’’. European Child and Adolescent
Psychiatry, 8, 63–70.
Snowden, L. R., & Cheung, F. K. (1990). Use of inpatient mental
health services by members of ethnic minority groups. American
Psychologist, 45, 347–355.
Strohschein, L. (2005). Parental divorce and child mental health
trajectories. Journal of Marriage and Family, 67, 1286–1300.
Suri, S., Goldstein, D. G., & Mason, W. A. (2011). Honesty in an
online labor market. In L. von Ahn & P. G. Ipeirotis (Eds.),
Papers from the 2011 AAAI workshop. Menlo Park, CA: AAAI
Press.
Trivette, C. M., Dunst, C. J., Deal, A., Hamer, A., & Propst, S. (1990).
Assessing family strengths and family functioning style. Topics
in Early Childhood Special Education, 10, 16–35.
Van Oort, F. V. A., Verhulst, F. C., Ormel, J., & Huizink, A. C.
(2010). Prospective community study of family stress and
anxiety in (pre)adolescents: The TRAILS study. European Child
and Adolescent Psychiatry, 19, 483–491.
Veit, C., & Ware, J. (1983). The structure of psychological distress
and well-being in general populations. Journal of Consulting and
Clinical Psychology, 51, 730–742.
Ventura, S. J., & Bachrach, C. A. (2000). Nonmarital childbearing in
the United States, 1940–1999. National Vital Statistics Reports,
48, 1–40.
Vespa, J., Lewis, J. M., & Kreider, R. M. (2013). America’s families
and living arrangements: 2012. Washington, DC: U.S. Census
Bureau.
Warren, S. L., Huston, L., Egeland, B., & Sroufe, L. A. (1997). Child
and adolescent anxiety disorders and early attachment. Journal
of the American Academy of Child and Adolescent Psychiatry,
36, 637–644.
Williams, A. W., Ware, J. E., & Donald, C. A. (1981). A model of
mental-health, life events, and social supports applicable to
general populations. Journal of Health and Social Behavior, 22,
324–336.
Yancey, A. K., Ortega, A. N., & Kumanyika, S. K. (2006). Effective
recruitment and retention of minority research participants.
Annual Review of Public Health, 27, 1–28.
3246 J Child Fam Stud (2015) 24:3235–3246
123