Using Machines to Improve Human Saliency Detection
5
Using Machines to Improve Human Saliency Detection Nikhil Rao * , Joseph Harrison † Tyler Karrels * , Robert Nowak * and Timothy T. Rogers † * Department of Electrical and Computer Engineering University of Wisconsin - Madison, Madison, Wisconsin 53706 Email: nrao2,[email protected] , [email protected] † Department of Psychology University of Wisconsin - Madison, Madison, Wisconsin 53706 Email: ttrogers,[email protected] Abstract—Humans are adept at identifying informative regions in individual images, but it is a slow and often tedious task to identify the salient parts of every image in a large corpus. A machine, on the other hand, can sift through a large amount of data quickly, but machine methods for identifying salient regions are unreliable. In this paper, we develop a new method for identifying salient regions in images and compare this to two previously reported approaches. We then consider how such machine-saliency methods can be used to improve human performance in a realistic target-detection task. I. I NTRODUCTION Consider the task of an analyst searching for signs of human habitation amongst images taken by drone planes over some vast and sparsely occupied region. The drones are capable of providing masses of data, but only a few will contain items of interest. The human analysts are skilled at detecting the interesting images when they appear, but the data is generated much more rapidly than it can be processed: the analyst is overwhelmed with an ever-increasing number of images, most containing nothing of interest. How can machines help the analyst to find the interesting images? One idea might be to apply pattern recognition methods to the image data, but such approaches are both resource- intensive – requiring large amounts of human-labeled training data – and notoriously unreliable. In this paper we instead con- sider a salience-based approach to target detection. Salience describes the tendency for certain subregions of a scene to “stand out” from their surroundings in human perception. In detection problems like that described above, the target images often contain highly salient items viz. items that are dissimilar to their backgrounds, such as a house in the desert or a boat in the water, whereas the uninteresting images often do not. In such cases, salience might provide a useful cue for finding target images. Machines could aid in the detection task by automatically computing the maximal salience of each image in the corpus and prioritizing highly salient images for presentation to the analyst. Empirical research in human perception suggests that salient subregions of a scene are those that carry high information relative to other subregions [1]. There are, however, at least two different ways of thinking about the informativeness of a given region. The first proposes that a region is informative if its features cannot be predicted by the features present in its immediate spatial surroundings [2]. We will refer to this as the center-surround approach to saliency. The second approach stipulates that a region carries high information if it contains features that are dissimilar to those appearing in the scene globally. We will refer to this as the similarity-based approach to saliency. Human saliency detection appears to be influenced by both the spatial distribution of features in a scene (consistent with the center-surround approach; see [3]– [5]) and by the global similarity of features (consistent with the similarity-based view; see [6]). Computer models based on the center-surround approach have been developed by [3], but we are unaware of prior work proposing a strict similarity-based model of salience. After reviewing existing methods for salience in Section II, we will develop a novel similarity-based approach in Section III. We outline the ranking schemes we developed in Section IV. We will then compare this model with the others reviewed in Section V. The different models will be used to rank order the items in a corpus of 500 satellite images by maximal salience. Fifteen percent of the images contain evidence of human habitation, and we will investigate how many of these ”target” items appear among the highly-ranked images for each algorithm. We will see that the models vary significantly in their performance on this task. In an empirical study, we will then consider how the machine rankings can be used to dramatically improve human performance in the target detection task. In Section VI we will present conclusions and areas for future research. II. EXISTING METHODS Recently, robotic vision, anomaly detection, and vast im- age databases have spurred interest in computer algorithms for visual saliency. Many methods have been developed to find salient objects in images, but much of the work in- volves knowledge of the target object. Here we consider only “bottom-up” methods that do not require such knowledge. In [3], [4], [7], the authors develop a model inspired by the center surround architecture of neurons in early visual cortex. The final saliency map recombines normalized activation maps
Transcript of Using Machines to Improve Human Saliency Detection

Using Machines to Improve Human SaliencyDetection
Nikhil Rao∗, Joseph Harrison† Tyler Karrels∗, Robert Nowak∗ and Timothy T. Rogers†∗Department of Electrical and Computer Engineering
University of Wisconsin - Madison, Madison, Wisconsin 53706Email: nrao2,[email protected] , [email protected]
†Department of PsychologyUniversity of Wisconsin - Madison, Madison, Wisconsin 53706
Email: ttrogers,[email protected]
Abstract—Humans are adept at identifying informative regionsin individual images, but it is a slow and often tedious task toidentify the salient parts of every image in a large corpus. Amachine, on the other hand, can sift through a large amountof data quickly, but machine methods for identifying salientregions are unreliable. In this paper, we develop a new methodfor identifying salient regions in images and compare this totwo previously reported approaches. We then consider howsuch machine-saliency methods can be used to improve humanperformance in a realistic target-detection task.
I. INTRODUCTION
Consider the task of an analyst searching for signs of humanhabitation amongst images taken by drone planes over somevast and sparsely occupied region. The drones are capable ofproviding masses of data, but only a few will contain itemsof interest. The human analysts are skilled at detecting theinteresting images when they appear, but the data is generatedmuch more rapidly than it can be processed: the analyst isoverwhelmed with an ever-increasing number of images, mostcontaining nothing of interest. How can machines help theanalyst to find the interesting images?
One idea might be to apply pattern recognition methodsto the image data, but such approaches are both resource-intensive – requiring large amounts of human-labeled trainingdata – and notoriously unreliable. In this paper we instead con-sider a salience-based approach to target detection. Saliencedescribes the tendency for certain subregions of a scene to“stand out” from their surroundings in human perception. Indetection problems like that described above, the target imagesoften contain highly salient items viz. items that are dissimilarto their backgrounds, such as a house in the desert or aboat in the water, whereas the uninteresting images often donot. In such cases, salience might provide a useful cue forfinding target images. Machines could aid in the detectiontask by automatically computing the maximal salience of eachimage in the corpus and prioritizing highly salient images forpresentation to the analyst.
Empirical research in human perception suggests that salientsubregions of a scene are those that carry high informationrelative to other subregions [1]. There are, however, at leasttwo different ways of thinking about the informativeness of a
given region. The first proposes that a region is informativeif its features cannot be predicted by the features presentin its immediate spatial surroundings [2]. We will refer tothis as the center-surround approach to saliency. The secondapproach stipulates that a region carries high information if itcontains features that are dissimilar to those appearing in thescene globally. We will refer to this as the similarity-basedapproach to saliency. Human saliency detection appears tobe influenced by both the spatial distribution of features in ascene (consistent with the center-surround approach; see [3]–[5]) and by the global similarity of features (consistent withthe similarity-based view; see [6]).
Computer models based on the center-surround approachhave been developed by [3], but we are unaware of priorwork proposing a strict similarity-based model of salience.After reviewing existing methods for salience in Section II,we will develop a novel similarity-based approach in SectionIII. We outline the ranking schemes we developed in SectionIV. We will then compare this model with the others reviewedin Section V. The different models will be used to rank orderthe items in a corpus of 500 satellite images by maximalsalience. Fifteen percent of the images contain evidence ofhuman habitation, and we will investigate how many of these”target” items appear among the highly-ranked images foreach algorithm. We will see that the models vary significantlyin their performance on this task. In an empirical study, wewill then consider how the machine rankings can be usedto dramatically improve human performance in the targetdetection task. In Section VI we will present conclusions andareas for future research.
II. EXISTING METHODS
Recently, robotic vision, anomaly detection, and vast im-age databases have spurred interest in computer algorithmsfor visual saliency. Many methods have been developed tofind salient objects in images, but much of the work in-volves knowledge of the target object. Here we consider only“bottom-up” methods that do not require such knowledge. In[3], [4], [7], the authors develop a model inspired by thecenter surround architecture of neurons in early visual cortex.The final saliency map recombines normalized activation maps
across several spatial scales. In [6], the saliency map reflectsthe stationary distribution on a graph where the nodes arepixels and the weights correspond to a similarity measurethat captures both spatial proximity and feature similarity.An information theoretic approach is taken by [8], whereinpeaks in the entropy distribution correspond to the locationof regions of interest. An extremely simple and fast methodusing the Gaussian pyramid is developed in [9], but it trades offaccuracy for speed. The authors in [10] use image windows tofind the saliency map of a given image, and propose a methodto efficiently place the windows.
It can be seen that all methods can be broadly classified intotwo categories: local and global. Local methods use the biolog-ically motivated principle of finding objects that are differentfrom their immediate surroundings (scale is incorporated tovary the “size” of surroundings). Global methods, on the otherhand, tend to look for objects that are most different in theentire image; they look for outliers in the image.
III. CLUSTER BASED SALIENCY
We now describe a novel technique to find salient regionsin images. Like some of methods above, our approach usesunsupervised clustering and outlier detection to find salientregions. Most outlier detection schemes detect point outliersin the data, but we are interested in finding an outlier cluster:data that is an essential part of the image, and is thus not anoutlier in the true sense of the word. Related work was reportedby [11], wherein the authors use the spatial scan statistic [12]to find spatially anomalous clusters.
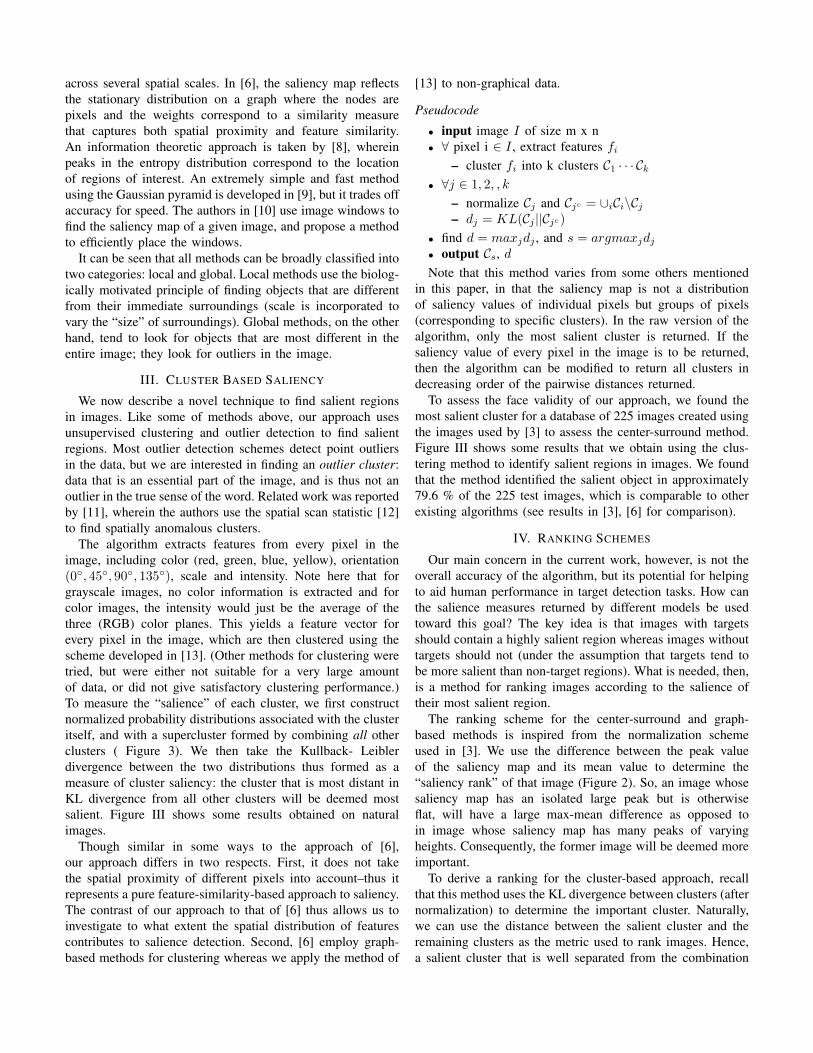
The algorithm extracts features from every pixel in theimage, including color (red, green, blue, yellow), orientation(0◦, 45◦, 90◦, 135◦), scale and intensity. Note here that forgrayscale images, no color information is extracted and forcolor images, the intensity would just be the average of thethree (RGB) color planes. This yields a feature vector forevery pixel in the image, which are then clustered using thescheme developed in [13]. (Other methods for clustering weretried, but were either not suitable for a very large amountof data, or did not give satisfactory clustering performance.)To measure the “salience” of each cluster, we first constructnormalized probability distributions associated with the clusteritself, and with a supercluster formed by combining all otherclusters ( Figure 3). We then take the Kullback- Leiblerdivergence between the two distributions thus formed as ameasure of cluster saliency: the cluster that is most distant inKL divergence from all other clusters will be deemed mostsalient. Figure III shows some results obtained on naturalimages.
Though similar in some ways to the approach of [6],our approach differs in two respects. First, it does not takethe spatial proximity of different pixels into account–thus itrepresents a pure feature-similarity-based approach to saliency.The contrast of our approach to that of [6] thus allows us toinvestigate to what extent the spatial distribution of featurescontributes to salience detection. Second, [6] employ graph-based methods for clustering whereas we apply the method of
[13] to non-graphical data.
Pseudocode• input image I of size m x n• ∀ pixel i ∈ I , extract features fi
– cluster fi into k clusters C1 · · · Ck• ∀j ∈ 1, 2, , k
– normalize Cj and Cjc = ∪iCi\Cj– dj = KL(Cj ||Cjc)
• find d = maxjdj , and s = argmaxjdj• output Cs, dNote that this method varies from some others mentioned
in this paper, in that the saliency map is not a distributionof saliency values of individual pixels but groups of pixels(corresponding to specific clusters). In the raw version of thealgorithm, only the most salient cluster is returned. If thesaliency value of every pixel in the image is to be returned,then the algorithm can be modified to return all clusters indecreasing order of the pairwise distances returned.
To assess the face validity of our approach, we found themost salient cluster for a database of 225 images created usingthe images used by [3] to assess the center-surround method.Figure III shows some results that we obtain using the clus-tering method to identify salient regions in images. We foundthat the method identified the salient object in approximately79.6 % of the 225 test images, which is comparable to otherexisting algorithms (see results in [3], [6] for comparison).
IV. RANKING SCHEMES
Our main concern in the current work, however, is not theoverall accuracy of the algorithm, but its potential for helpingto aid human performance in target detection tasks. How canthe salience measures returned by different models be usedtoward this goal? The key idea is that images with targetsshould contain a highly salient region whereas images withouttargets should not (under the assumption that targets tend tobe more salient than non-target regions). What is needed, then,is a method for ranking images according to the salience oftheir most salient region.
The ranking scheme for the center-surround and graph-based methods is inspired from the normalization schemeused in [3]. We use the difference between the peak valueof the saliency map and its mean value to determine the“saliency rank” of that image (Figure 2). So, an image whosesaliency map has an isolated large peak but is otherwiseflat, will have a large max-mean difference as opposed toin image whose saliency map has many peaks of varyingheights. Consequently, the former image will be deemed moreimportant.
To derive a ranking for the cluster-based approach, recallthat this method uses the KL divergence between clusters (afternormalization) to determine the important cluster. Naturally,we can use the distance between the salient cluster and theremaining clusters as the metric used to rank images. Hence,a salient cluster that is well separated from the combination

Fig. 1. Results of the cluster based saliency method. The images on the leftare the original images, and the ones on the right display the salient objectoccluded by an opaque patch.
Fig. 2. Ranking for center surround and graph based methods. The lengthof the double headed arrow indicates the difference between max and meanin the final saliency map. A higher length indicates the particular image isranked higher, or is more important
of all other clusters will be deemed more important that onethat is not that well separated. The idea here is that a largerdegree of separation (in the KL divergence sense) implies thatthe salient object is “more different” than the other objects inthe image.
Fig. 3. Cluster based saliency. The ellipse around the clusters on the leftindicates that they are all considered to be a single cluster, and the KLdivergence is calculated between this supercluster and the isolated clusteron the right. Note that this happens in a much higher dimensional setting inour case. The length of the double headed arrow indicates the KL divergencebetween the supercluster indicated by the ellipse and the smaller cluster onthe right. A higher length indicates the particular image is ranked higher, oris more important.
V. COMPARING SALIENCY MODELS FOR TARGETDETECTION
To test the ranking schemes, we formed a database of 500aerial images taken over various terrain including forest, sea,desert, snow and fields. Of these, 75 images contained man-made objects such as boats, houses, warehouses, roads, and soon. These comprised the “salient” images. Figure 4 and Figure5 show a small sample of the images we used. The modelswere compared by using them to rank-order the 500 imagesby maximal salience. We then considered how many of the 75target images appeared in the top 75 ranked images for eachmodel.
All three of the models we considered–center surround,graph based and cluster based saliency–employ the samefeatures extracted from the given image. These features areessentially those introduced by [3], which were motivatedby properties of neurons in early visual cortex. To makeall algorithms comparable, we modified the multiscale centersurround method to incorporate scale as a separate feature.Scale of a pixel is determined by entropy peaks as in [8].
Figure 6 shows how many of the 75 target images ap-pear within the top n-ranked images, with n plotted alongthe abscissa. All three models produce rankings that exceedrandom performance, but there are clear differences amongthem. Notably, the graph-based and clustering models–both ofwhich take feature similarity into account–strongly outperformthe center-surround approach. Taken on their own, however,the models are far from optimal. Table I shows, for each

Fig. 4. sample of target images.
Fig. 5. sample of images without targets.
Fig. 6. Comparison of various ranking schemes. The y axis corresponds tothe proportion of salient images (out of 75) identified and ranked. The x axisis the rank assigned. An optimal method would have all the salient images inthe first 75 after ordering, and a random ordering will result in a 45◦ line
model, how many of the 75 target images appear withinthe top-75 ranked images (Hits), and how many non-targets(false alarms). The table also shows the hit rate (hits / totalnumber of targets) and false alarm rate (false alarms / totalnumber of non-targets) associated with each model, and thecorresponding d’(hit rate - false alarm rate) for discriminatingtargets and non-targets. Even the best-peforming graph-basedmodel detects just above 50% of the targets, and achieves ad’ of just 1.57. The clustering model is next-best, followed bythe center-surround model.
TABLE IHIT RATES FOR THE METHODS WITHOUT HUMANS. ’HITS’ CORRESPONDS
TO THE NUMBER OF IMPORTANT IMAGES IN THE TOP 75 IMAGES ASRANKED BY THE SCHEMES (IDEALLY HITS WILL BE 75).
Method Hits False Alarms Hit Rate FA Rate d’Graph 42 33 0.56 0.08 1.57Cluster 36 39 0.48 0.09 1.28
CS 28 47 0.37 0.11 0.89Random 11 64 0.15 0.15 0.00
Given the mediocre performance of these different models,we next inquired whether they could be of use in improvinghuman performance on the target-detection task. We conducteda behavioral study that was a simple analog of the detectiontask: participants were given 3 minutes to identify amongthe 500 items as many items containing evidence of humanhabitation as possible. Images were presented sequentially tothe participant, who pressed a button to indicate whether anyman made objects were visible in the scene. Participants hadas long as they liked to inspect each image, but were toldthey had only 3 minutes to find as many targets as possible.As soon as a decision for a given image was made, a newimage appeared. There were four different conditions varyingonly in the order in which the images were presented to theparticipants: images could be ordered at random or accordingto the rankings generated by one of the three models. Wethen considered, for each condition, how many targets weredetected and how many false-alarms were generated.
TABLE IIHIT RATES AND FALSE ALARM RATES FOR THE METHODS. THE HIT RATESARE CALCULATED FOR THE IMAGES SEEN, WHEREAS THE FALSE ALARMSFOR THE ENTIRE DATABASE. FA STANDS FOR FALSE ALARM, HR STANDS
FOR HIT RATE AND FA R, FOR FALSE ALARM RATE
Method Images seen Hits F A HR FA RGraph 115 45 11 0.61 0.03cluster 133 39 4 0.52 0.01
center surround 141 34 9 0.46 0.02Random 145 26 36 0.34 0.09
Table II shows the mean number of hits, false alarms, hitand false alarm rates achieved by human participants in thefour different conditions. The random condition provides base-line performance against which the models can be assessed.The orderings generated by all three models were dramaticimprovements over the random ordering, showing that evenmediocre ranking algorithms can significantly improve human

performance. However, there were strong differences acrossthe algorithms as well. The clustering and graph-based meth-ods both generated superior performance compared to thecenter-surround model. Though the graph-based orderings pro-duced the largest number of hits, it also generated substantiallymore false alarms, leading to an overall smaller d’ comparedto the clustering method.
Why does the rank-ordering improve performance so sub-stantially relative to random ordering? The reason is that,among the subset of images they can view in the limited timepermitted, the participants view a larger number of targets.They are not “wasting” their time on images that are veryunlikely to contain interesting regions. Instead, their limitedresources are optimized–the machine can weed out obviouslyuninteresting images, and the analyst can spend her morevaluable time sorting among images that are more likely tocontain targets. Of course, the better the algorithm, the betterthe human-machine pair will perform overall.
TABLE IIINUMBER OF IMPORTANT IMAGES IN THE TOTAL NUMBER OF IMAGES
ANALYZED BY HUMAN SUBJECTS.
Method images seen target imagesrandom 145 29
center surround 141 39graph 115 51cluster 133 44
VI. CONCLUSIONS AND FUTURE WORK
We have shown that automatic computation of saliency in animage can be used as a cue for detecting targets in tasks wherethe targets differ in important ways from their surroundings.Using maximal salience to detect images with targets, andusing current state-of-the-art saliency models, machines alonewill achieve only mediocre performance. Our research shows,however, that even this level of performance can dramaticallyimprove the performance of human analysts working withoutmachine aid by de-prioritizing images with no highly-salientregions.
Our results also suggest that approaches to saliency thatinclude featural similarity as a major cue will achieve superiorperformance to those based solely upon center-surround con-trast: the graph-based method and the cluster-based approachintroduced here both out-performed a center-surround methodintroduced by [3].
It is possible that these salience measures could be furtherimproved by adding feature selection steps to the algorithm.There may also exist other metrics to determine the salientcluster. For instance, one might consider the clustering schemeitself to determine the salient cluster. Specifically, if thescheme chooses k clusters, we then force it to use k - 1clusters, and determine what cluster when “absorbed” into theother clusters provide the worst fit to the data. We leave thesedevelopments for future work.
Interestingly, we also found that human participants showhigher false-alarm rates when the images are presented in
random order. We anticipate that this is a consequence of thetarget sparsity–in a given time, participants encounter very fewtargets, and so may be more inclined to “jump the gun” forquestionable images. The reasons for this are interesting froma psychological point of view, and can be investigated in futurework.
ACKNOWLEDGMENT
This work was partially supported by the Raytheon Com-pany. The authors thank Nitesh Shah and Visar Berisha fortheir support and helpful feedback.
REFERENCES
[1] N. Bruce and J. Tsotsos, “Saliency, attention, and visual search: Aninformation theoretic approach,” in Journal of Vision, vol. 9, no. 3, 2009,pp. 1–24.
[2] F. Attneave, “Some informational aspects of visual perception,” inPsychological Review, vol. 61, no. 3, 1954.
[3] L. Itti, C. Koch, and E. Niebur, “A model of saliency-based visual at-tention for rapid scene analysis,” IEEE Transactions on Pattern Analysisand Machine Intelligence, vol. 20, no. 11, pp. 1254–1259, Nov 1998.
[4] L. Itti, C. Gold, and C. Koch, “Visual attention and target detectionin cluttered natural scenes,” Optical Engineering, vol. 40, no. 9, pp.1784–1793, Sep 2001.
[5] L. Itti and C. Koch, “Target detection using saliency-based atten-tion,” in Proc. RTO/SCI-12 Workshop on Search and Target Acqui-sition (NATO Unclassified), Utrecht, The Netherlands, RTO-MP-45AC/323(SCI)TP/19, Jun 1999, pp. 3.1–3.10.
[6] C. K. J. Harel and P. Perona, “Graph-based visual saliency,” in Proceed-ings of Neural Information Processing Systems, 2007.
[7] L. Itti and C. Koch, “Feature combination strategies for saliency-basedvisual attention systems,” Journal of Electronic Imaging, vol. 10, no. 1,pp. 161–169, Jan 2001.
[8] T. Kadir and M. Brady, “Saliency, scale and image description,” In-ternational Journal of Computer Vision, vol. V45, no. 2, pp. 83–105,November 2001.
[9] P. Rosin, “A simple method for detecting salient regions,” vol. 42,November 2009, pp. 2363–2371.
[10] T. Toriu and S. Nakajima, “A method of calculating image saliency andof optimizing efficient distribution of image windows,” in Proceedingsof the First International Conference on Innovative Computing, Infor-mation and Control, 2006.
[11] D. Neill and A. Moore, “Anomalous spatial cluster detection,” in AD-KDD05, August 2005.
[12] M.Kulldorf, “A spatial scan statistic,” in Communications in Statistics:Theory and Methods, vol. 26, no. 6, 1997, pp. 1481–1496.
[13] M. Figueiredo and A. Jain, “Unsupervised learning of finite mixturemodels,” in IEEE Transactions on Pattern Analysis and Machine Intel-ligence, vol. 24, March 2002, pp. 381 – 396.