Using M-Quantile Models to measure the Contextual Value- Added of Schools in London Nikos Tzavidis...
35
Using M-Quantile Models to measure the Contextual Value-Added of Schools in London Nikos Tzavidis (University Manchester) James Brown (Institute of Education)
-
Upload
alban-higgins -
Category
Documents
-
view
213 -
download
0
Transcript of Using M-Quantile Models to measure the Contextual Value- Added of Schools in London Nikos Tzavidis...

Using M-Quantile Models to measure the Contextual Value-Added of Schools in London
Nikos Tzavidis (University Manchester)
James Brown (Institute of Education)

2
Outline
• Looking at Pupil/School Performance using the NPD• The approach ‘currently’ used by DfE
• Outline to using quantile or M-quantile approaches
• M-quantiles for exploring pupil and school performance
• Measuring and mapping performance across local authorities in London• Outcome data for 2007/8

3
The National Pupil Database
• A major Admin database held by DCSF that is utilised by researchers studying pupil and school performance…• Longitudinal record of a pupils’ attendance at State schools in
England (updated each term) with performance data linked in at KS1, KS2, (KS3), KS4, and now KS5 with further extensions into further/higher education
• Limited covariates on individual pupils and their family background• Language, ethnicity, fsm, income deprivation of area, in care,…• Possible use of linkage with the LSYPE, which does have the
more detailed family background (parental education)…

4
Measuring School Performance
• Raw exam scores can be misleading for measuring school performance• Do not reflect different intakes of schools
Value Added (VA) Models:• Provide a better measure of performance by accounting for pupil
prior attainment
Contextualised Value Added (CVA) Models:• Extension of VA models that also account for pupil
characteristics (gender, age, deprivation) and the context within the school

5
DfE CVA Model
Concept:• Include school-specific random effects to account for the
between school variation beyond that explained by the variation in model covariates.• Captures the fact that pupil performance within a school is
correlated, even after controlling for characteristics
Notation: (j = School, i = Pupil)
• Variable of interest: yij
• Covariate information: xij
• School level random effect: uj
• Pupil level random effect: eij

6
DfE CVA Model(random effects model)
Dependent variable: Capped total Key Stage 4 score (best 8 GCSEs)
Covariates (pupil level):• Pupil prior attainment, fsm, income deprivation, special education
needs, age, pupil mobility, gender, in care, ethnicity, English as an additional language, interaction terms
Covariates (school level):• School mean prior attainment, school mean spread
yij = α + βxij + uj + eij
School random effect uj:
• Measures an unknown underlying level of performance for each school• Normally distributed with constant variance…

7
Random Intercepts

8
Random Intercepts

9
Random Intercepts

10
Things to consider…
• Why should these (random) school effects be normally distributed with a constant variance?• Problems with capping in high performing schools…
• Possible lack of outlier robustness• Outlier schools and outlier pupils…
• The DfE CVA model assumes a random intercepts specification, what if random slopes provide a better fit?• Losing information by simply summarising the school impact as a
single value…• Is the school impact really the same for all pupils in the school?

11
The Quantile Approach
• The conventional definition of a regression model as a model for the mean of Y|X can be extended considerably• We view regression analysis as aimed at modelling the entire
conditional distribution f(Y|X)
• Regression quantiles, and the easier to compute regression M-quantiles, offer a deeper understanding of the structure of conditional distributions• In this presentation we don’t distinguish between regression
quantiles and regression M-quantiles as both will serve the same purpose

12
The Quantile Approach
A Linear Model for Regression Quantiles
yi = αq + βqxi + ei
Estimation of Regression Quantiles
Computation: Simplex Algorithm (quantile regression)
Weighted Least Squares (M-quantile regression)
Implemented in: R quantreg library
Stata qreg
• For M-quantiles (Chambers and Tzavidis, 2006) we use the rlm function in R modified to qrlm

13
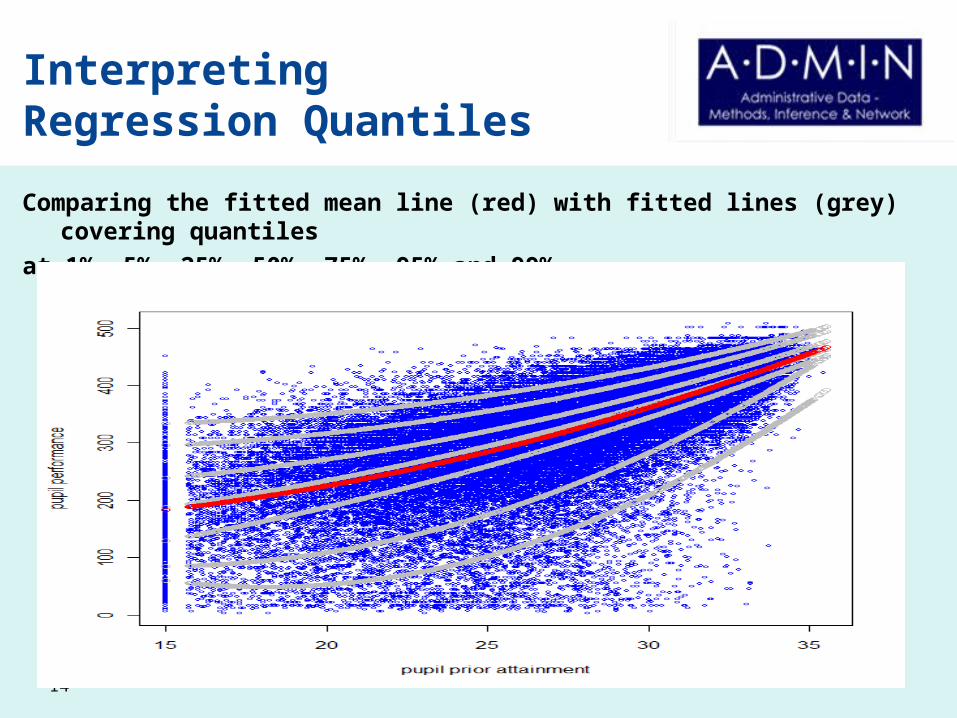
InterpretingRegression Quantiles
• For each value of q, the corresponding model shows how the qth percentile (quantile) of f(Y|X) varies with X
• q = 0.5 line shows how the “middle” (median) of f(Y|X) changes with X
• q = 0.1 line separates the “top” 90% of f(Y|X) from the “bottom” 10%• it represents the behaviour of units that are “better” than the
“worst” 10% and “worse” than the “best” 90%• the ‘fitted’ regression quantiles do not need to be parallel but they
should not cross… (if they do implies poor model specification)
14
InterpretingRegression Quantiles
Comparing the fitted mean line (red) with fitted lines (grey) covering quantiles
at 1%, 5%, 25%, 50%, 75%, 95% and 99%.

15
M-quantile Coefficients
• Individual level pupil data (yi, xi) on Y and X
• Linear regression M-quantiles mq(xi) = αq + βqxi
• For fixed x, mq(xi) is continuous in q
• each sample value (yi, xi) will lie on one and only one regression M-quantile line
• We refer to the q-value qi of this regression M-quantile as the M-quantile coefficient or q value of the corresponding pupil• The M-quantile coefficients lie between 0 and 1 and characterize
where the pupils lie in the conditional distribution f(Y|X)

16
Properties of the qi’s
• The qi’s represent dimensionless measures of the residual heterogeneity in Y after accounting for heterogeneity in X
• The qi’s satisfy 4 conditions that a good measure of performance should satisfy (Kokic et al., 1997)• They lie between 0 and 1• The poorest performing pupils given their x’s (prior attainment,…)
have a performance measure close to zero• The best performing pupils have a performance measure close to
one• The distribution of the performance measure should not depend on
the level of inputs x (i.e. the pupil’s prior attainment)

17
An Alternative Measure of School Performance…
• With the qi we have a measure of the individual pupils’ efficiencies conditional on a set of covariates But so far we have not imposed any structure on the data...
• IF the school has any additional impact on the performance of the pupils within that school it will be evidenced by pupils ‘on average’ being more or less efficient We define Qj (a measure of this school efficiency) as the mean of the pupil
qi’s within school j
• This approach in small area estimation (Chambers and Tzavidis, 2006) shows that M-quantile coefficients are able to capture group effects and tend to be highly correlated with standard random effects

18
How does it work?
Step 1:
Define a grid of q-values, e.g. g =(0.001,…,0.999) that “covers” the
conditional distribution of Y and X

19
How does it work?
Step 2:
Fit an M-quantile model for each q-value in g and estimate the unique M-quantile
coefficient qi for each pupil in the sample
Step 3:
The qi’s describe pupil differences after controlling for X.
• Higher qi’s imply better performance – Pupil efficiency

20
How does it work?
Step 4:
Using the qi’s of pupils in the same school, estimate a school
M-quantile coefficient, Qj, using the mean or the median
Measure of school performance given by Qj: Higher → Better

21
‘Properties’ of using quantilesfor School Performance
• Less assumptions (should cope better with the capping of the performance measure) with respect to the structure of the school effects the data guide the modelling process
• Less assumptions do generally imply less efficiency working with London we still have a lot of data...
• Outlier robustness automatically achieved by using M-quantiles
• Defining a measure of individual (pupil) efficiencies allows flexible summaries at the school (and other) levels BUT what about measuring the uncertainty associated with Qj?

22
MSE Estimation of thePerformance Measure
Estimated using non-parametric bootstrap (Tzavidis et al. 2010) • Starting from the original sample s, fit the M-quantile model and compute
• B bootstrap finite populations are generated by sampling
• From each bootstrap population, select L samples using simple random sampling without replacement within the schools
• For each bootstrap sample L implement the estimation procedure
*U *ije
ˆˆ
jij ij ij Qe y xT
* *ˆ
ˆj
ij ij ijQy e xT
2
21 1 1 1 *
1 1 1 1
aˆ ˆ ˆ ˆ( ) )v (B L B L
*bl *bl *bl bj j j j j
b l b lLMSE Q B L Q Q B L Q Q

23
Evaluating the MSE Estimator
Use model-based simulation. Bootstrap is embedded within the Monte-Carlo
• Population data are generated using
• We generate in total 250 populations of size 16020 units in 40 schools
• From each of the 250 populations take independent samples by randomly selecting pupils within the 40 schools.
• MSE estimation: For each Monte-Carlo sample we implement the bootstrap scheme with B=1 and L=250
57 14 , ~ (27,4), ~ (0,17.15), ~ (0,65.13)
ij ij j ij ij j ijy x x N N N

24
Evaluating the MSE Estimator
Across schools distribution of the true (Monte Carlo) MSE, averages over Monte
Carlo simulations of estimated mean squared error, relative bias (%) of the
bootstrap MSE estimator and coverage rates of nominal 95% CIs
MSE Percentiles of across schools distribution
Min 25th 50th Mean 75th Max
True
0.027 0.033 0.040 0.041 0.044 0.067
Bootstrap 0.028 0.034 0.040 0.041
0.043
0.065
Relative Bias (%) -7.27 -2.21 0.98 2.01 5.04
14.51
Coverage 0.928 0.940 0.948 0.952 0.961 0.984

25
Evaluating the MSE Estimator
True (empirical) Mean Square Error (Red Line) and estimated Mean Square Error
(black line) of the M-quantile measure of school performance.

26
Modelling Pupil Performance across London
We now implement the approach to the data for pupils within schools in
London using linked NPD/PLASC Data (2007/08 cohort)
• Performance at age 11 (prior attainment) performance at age 16 (the outcome) – NPD Data
• Linked PLASC data to provide the background information
• Our working model specification similar to the CVA model Ray (2006)

27
Modelling Pupil Performance across London
Comparing the fitted mean line (red) with fitted lines (grey) covering quantiles
at 1%, 5%, 25%, 50%, 75%, 95% and 99%.

28
Pupil Performancewithin and across schools
Caterpillar plot for school comparing males and females

29
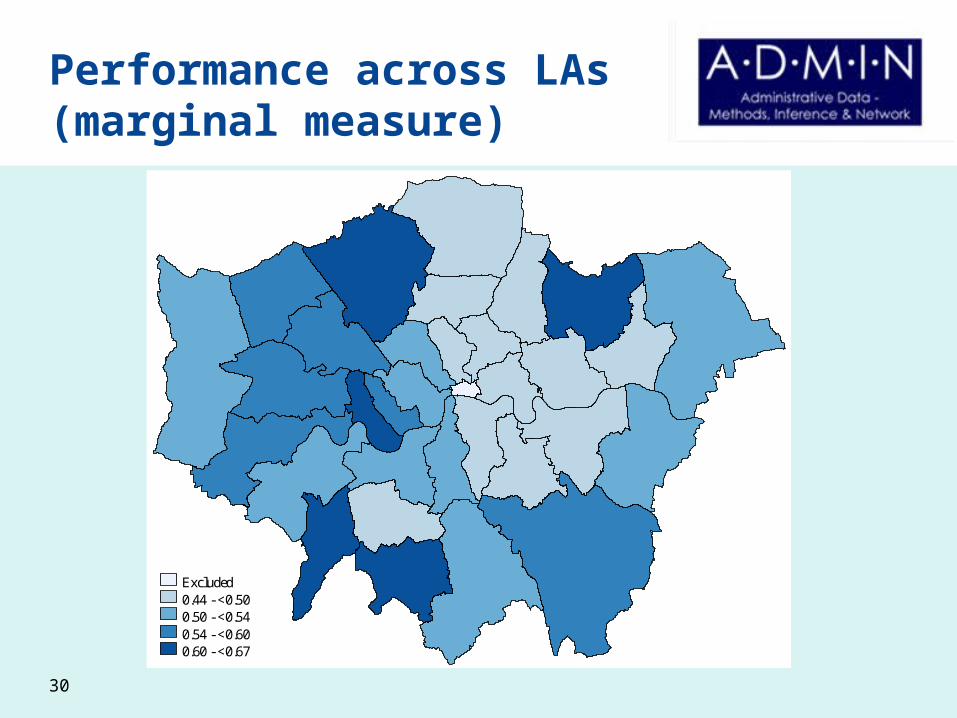
Performance across LAs
• By estimating a pupil level effect we do not pre-impose a structure on the data• To get a school performance value we are averaging across pupils
in the school...• The school has an impact when the average differs from the overall
mean (close to 0.5)
BUT• We can estimate for other structures by aggregating our pupils by
the desired structure• the impact of the structure being represented by an average
efficiency for the pupils different to the overall average
30
Performance across LAs(marginal measure)
Excluded0.44 - <0.500.50 - <0.540.54 - <0.600.60 - <0.67

31
Performance across LAs(conditional measure)
Excluded0.44 - <0.500.50 - <0.540.54 - <0.60

32
Performance across LAs(difference from mean)
ExcludedBelowExpectedAbove

33
Discussion...
• Utilising quantile models leads to a ‘robust’ measure of the relative performance of the individual pupils• Measures how efficient a pupil is relative to others with the same
inputs (prior attainment) and context
• We can then impose ‘structure’ on the data to see if that has any influence on the performance of the ‘group’ of students• School effects• Average pupil performance at the LA level

34
Some References
Tzavidis, N. and Brown J. J. (2010). Using M-quantile models as an alternative to random effects to model the contextual value-added of schools in London. DoQSS Working Papers 1011, Department of Quantitative Social Science - Institute of Education, University of London.
Chambers, R. and Tzavidis, N. (2006). M-quantile Models for Small Area Estimation. Biometrika, 93, 255-268.
Kokic, P. N., Chambers, R. L., Breckling, J. U. and Beare, S. (1997). A measure of production performance. Journal of Business and Economic Statistics, 10, 419 - 435.
Tzavidis, N., Marchetti, S. and Chambers, R. (2010). Robust prediction of small area means and quantiles.[To appear in the Australian and New Zealand Journal of Statistics].
Institute of EducationUniversity of London20 Bedford WayLondon WC1H 0AL
Tel +44 (0)20 7911 5412Fax +44 (0)20 7612 6686Email [email protected] www.ioe.ac.uk/qss

35
Modelling Pupil Performance across London
Comparing the multilevel and the M-quantile CVA measures