Using Integrated Data to Measure Performance at TriMet
24
Using Integrated Data to Measure Performance at TriMet David T. Crout Tri-County Metropolitan Transportation District of Oregon [email protected] www.trimet.org Conference on Performance Measures for Transportation and Livable Communities Session 6: Livable Communities and Transit Performance Measures September 7, 2011
Transcript of Using Integrated Data to Measure Performance at TriMet

Using Integrated Data to Measure Performance at TriMet
David T. Crout Tri-County Metropolitan Transportation District of Oregon
[email protected] www.trimet.org
Conference on Performance Measures for Transportation and
Livable Communities
Session 6: Livable Communities and Transit Performance Measures
September 7, 2011

2
Tri-County Metropolitan Transportation District of Oregon
(TriMet) • Service Area Population (2010 Census): 1.5M • 100 bus routes, 4 light rail lines, one commuter
rail line. • FY 2011 Ridership: 100M Bus: 58.5M Light Rail: 41.2M Commuter Rail: 370.8k
• 650 buses, 127 LRVs, 3 DMUs, 2 RDCs (Budd)

3
TriMet Performance Measures • TriMet Performance Measures Integrate Data
from a Variety of Sources: Automatic vehicle location (AVL)/automatic passenger
counters (APCs) (ridership, on-time performance) Human Resources (attendance, hours worked) Financial (budget, fare revenue, operations costs) Maintenance (mechanical failures, scheduled
maintenance, ticket vending machine [TVM]) Operations (“extraboard”, “pullouts”) Safety (incidents/collisions) Customer Service (complaints)

TriMet Performance Dashboard (external)
4

5
http://www.trimet.org/about/dashboard.htm

Selected Performance Measures (internal)
6

7

8
TriMet Maintenance Monthly Performance Monthly
Target July 2011
June 2011
July 2010
FY Year to Date
Bus M
aint
enan
ce
Scheduled vs. Unscheduled Maintenance >= 70% 74% 75% 69% 74%
Miles Between MAJOR Mechanical Failures Increase 8,610 8,981 8,610
Miles Between MINOR Mechanical Failures Increase 5,904 6,242 5,904
Miles Between Mechanical Failures Increase 3,503 3,682 3,503
Miles Between Mechanical Failures - Lost Service Increase 6,888 6,800 6,888
PM Schedule Compliance >= 85% 98.4% 96.3% 98.2% 98.4%
Deferred Work List Growth Reduction 244 242 247 244
Missed Pullouts Due to Vehicle Availability 0 0 0 0 0.0
Employee Productivity >= 70% 78.4% 78.1% 77.4% 78.4%
Attendance Rate >= 93.5% 94.7% 93.7% 94.1% 94.7%
Employees FTE to Budget 293 298.0 277.0 281.6 298.0
Unscheduled Overtime to Budget 0.0% -10.5% -18.2% -6.0% -10.5%
Injuries <= 14% 10.5% 10.5%
Rail
Equ
ipm
ent M
aint
enan
ce
Scheduled vs. Unscheduled Maintenance > 70% 69% 68% 68% 69%
Avg. Miles Between Mechanical Failures > 3,749 2,439 2,706 2,786 2,439 Avg. Miles Between Mechanical Failures with Lost Service Increase
PM Schedule Compliance >= 80% 27.1% 23.9% 7.0% 27.1%
Pending Work List under dev 912 912 912
Missed Pullouts Due to Vehicle Availability 0 0 0 0 0.0
Employee Productivity > 70% 81.0% 67.9% 72.7% 81.0%
Attendance Rate >= 95% 94.2% 94.8% 94.7% 94.2%
Employees FTE to Budget 162 167.0 157.5 138.8 167.0
Unscheduled Overtime to Budget 0.0% 58.5% 68.7% -24.9% 58.5%
Injuries <= 9% 7.9% 7.9%
Faci
litie
s M
anag
emen
t
Scheduled vs. Unscheduled Maintenance under dev 16.6% 19.0% 16.6%
PM Schedule Compliance under dev 0.0% 0.0%
Pending Work List under dev 34 34
Employee Productivity under dev 82.6%
Attendance Rate >= 95% 93.9% 96.4% 94.2%
Employees FTE to Budget 82 76.0 64.0 72.0 76.0
Unscheduled Overtime to Budget 0.0% 26.4% 70.0% 163.4% 26.4%

9
TriMet Maintenance of Way Monthly Performance
Monthly
Target July
2011 June 2011
July 2010
FY Year to Date
MO
W
Attendance Rate >= 95% 91.6% 91.9% 92.5% 91.6%
Employees FTE to Budget 95 87.0 77.2 75.0 87.0
Unscheduled Overtime to Budget 0.0% 13.4% 47.8% 90.5% 13.4%
Injuries <= 9% 16.8% 16.8%
Fiel
d
Scheduled vs. Unscheduled Maintenance >= 70% 12.2% 11.0% 10.6% 12.2%
PM Compliance >= 90% 66.0% 70.9% 17.2% 66.0%
TVM Reliability >= 91% 92.7% 90.8% 93.5% 92.7%
Pending Work List under dev 0 0
Employee Productivity >= 70% 77.7% 81.3% 70.9% 77.7%
OCS
Scheduled vs. Unscheduled Maintenance >= 70% 42.4% 47.5% 29.3% 42.4%
PM Compliance >= 95% 0.0% 97.1% 100.0% 0.0%
Pending Work List under dev 120 134 120
Employee Productivity >= 70% 54.1% 87.6% 67.5% 54.1%
Sign
als
Scheduled vs. Unscheduled Maintenance >= 70% 63.4% 59.1% 81.9% 63.4%
PM Compliance >= 95% 98.6% 99.1% 99.8% 98.6%
Pending Work List under dev 51 48 51
Employee Productivity >= 70% 26.3% 27.1% 51.1% 26.3%
Trac
k
Scheduled vs. Unscheduled Maintenance >= 70% 97.5% 98.8% 83.2% 97.5%
PM Compliance >= 95% 94.6% 90.3% 54.6% 94.6%
Pending Work List under dev 4 4 4
Employee Productivity >= 70% 45.7% 44.7% 25.7% 45.7%
Subs
tati
ons Scheduled vs. Unscheduled Maintenance >= 70% 98.8% 82.7% 83.3% 98.8%
PM Compliance >= 95% 63.9% 91.3% 69.0% 63.9%
Pending Work List under dev 45 11 45
Employee Productivity >= 70% 56.6% 91.9% 57.5% 56.6%

TriMet Performance Dashboard (internal)
10

11
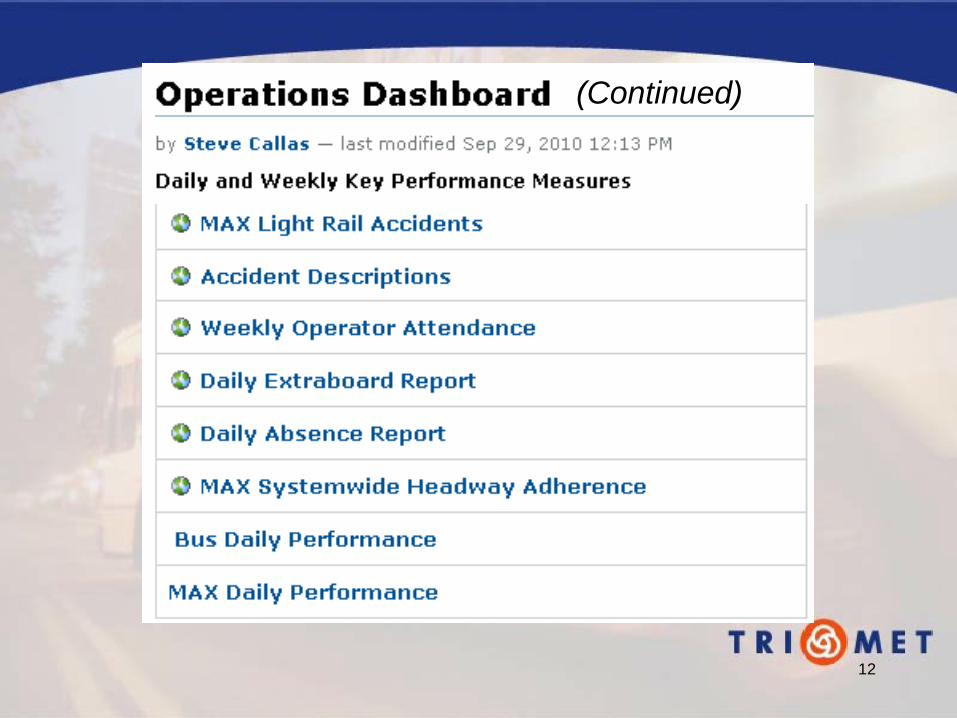
12
(Continued)

13
14

15
16

17

18

19
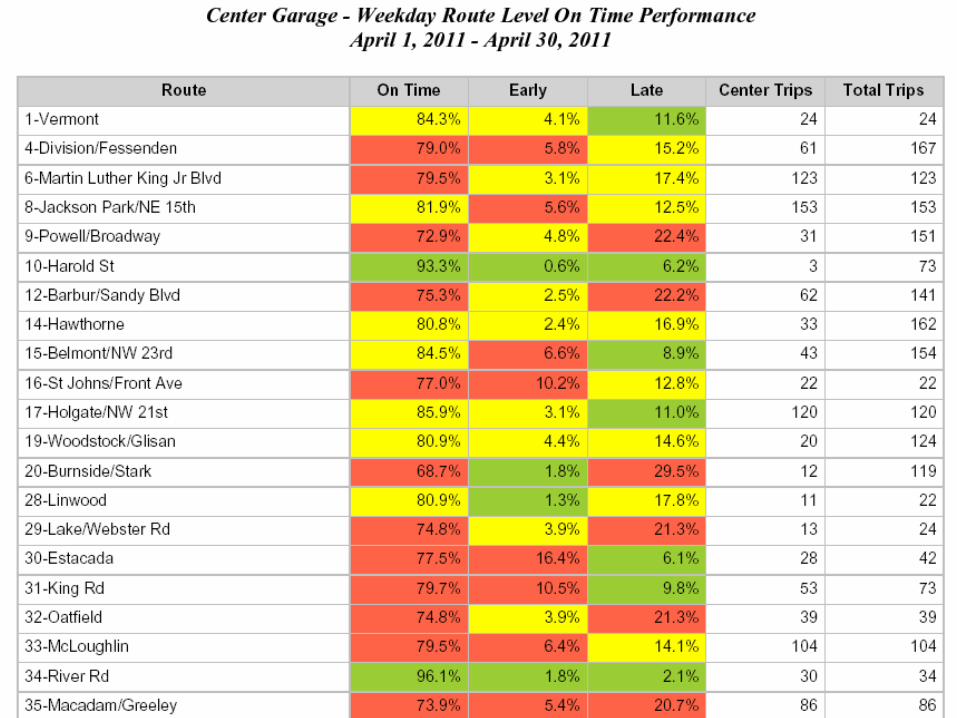
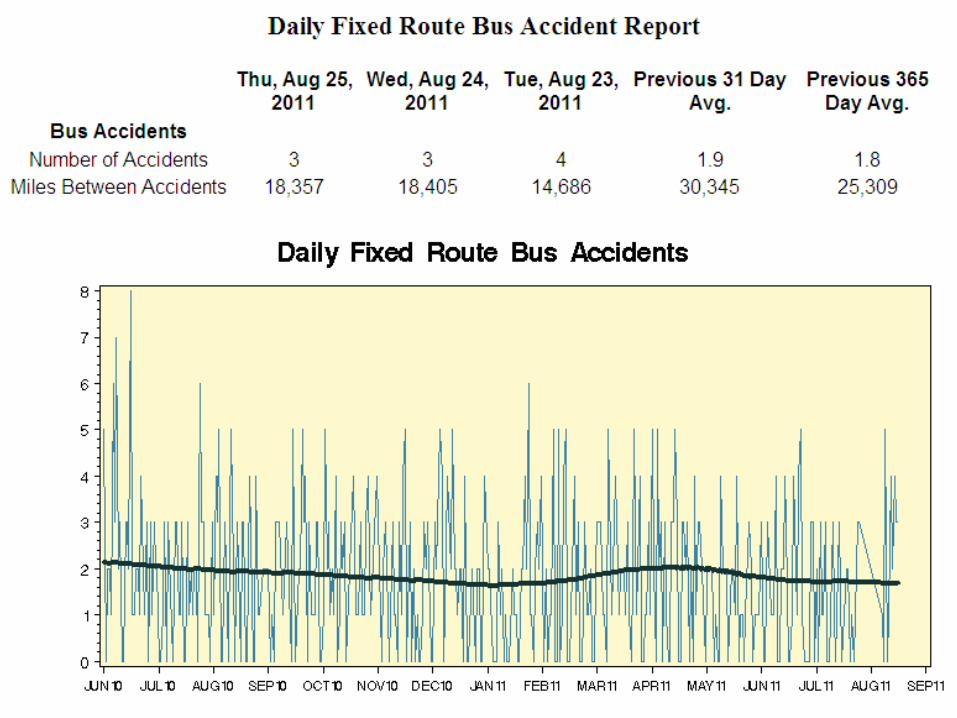
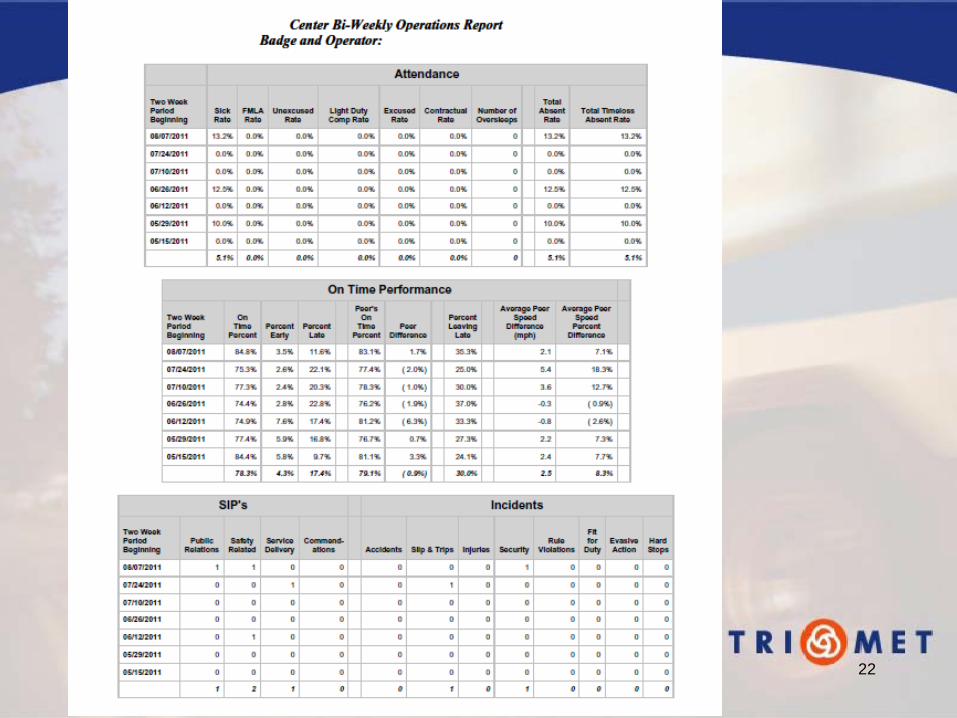
Other Examples of Integrated Performance Reports
20

21
22

23
TriMet Performance Measures – Next Steps
• Expand external performance dashboard to
include more measures. Facilitate public access to data.
• Increase use of internal measures among departments and seek to “institutionalize” them.
• Work with internal stakeholders to adjust performance goals and make them “realistic.”