Using Gravity for Subsurface Imaging at Ship Rock, New Mexico
50
Using Gravity for Subsurface Imaging at Ship Rock, New Mexico Sarina Yospin, Senior Integrative Exercise March 9, 2007 Submitted in partial fulfillment of the requirements for a Bachelor of Arts degree from Carleton College, Northfield, Minnesota
Transcript of Using Gravity for Subsurface Imaging at Ship Rock, New Mexico

Using Gravity for Subsurface Imaging at Ship Rock, New Mexico
Sarina Yospin, Senior Integrative Exercise
March 9, 2007
Submitted in partial fulfillment of the requirements for a Bachelor of Arts degree from Carleton College, Northfield,
Minnesota

TABLE OF CONTENTS Introduction…………………………………………………………………………..….1 Location, Geologic History and Setting……………………………………………......4 Models for Emplacement…………………………………………………………….…7 Volcanic Neck Model………………………………………………………….…7 Diatreme Model………………………………………………………………..…7 Variations on the Diatreme Model………………………………………….…..8 Gravity…………………………………………………………………………………...9 Questions and Plan of the Study…………………………………………………….....9 Methods………………………………………………………………………….………10 Theory of Gravity Correction………………………………………………………….15 Drift Correction…………………………………………………………………15 Latitude correction………………………………………………………………16 Free-air correction………………………………………………………………16 Simple Bouguer Correction……………………………………………………..17 Regional Gravity Trend Correction…………………………………………….17 Terrain Correction………………………………………………………………17 Results…………………………………….……………………………………………..18 Subsurface Modeling of Gravity Features……………………………………………19 Interpreting the Model…………………………………………………………………28 Interpretation #1: Diatreme Pipe and Magma Chamber………………………28 Interpretation #2: Volcanic Plug……………………………………………….32 Interpretation #3: Large-Scale Magma Chamber……..……………………….36 Summary of Inferred Subsurface Geometry……………………………………37 Discussion……………………………………………………………………………....37 Potential Problems and Sources of Error…………………………………………….40 Further Questions and Future Work……………………………………………..…..41 Acknowledgements…………………………………………………………………..…45Works Cited…………………………………………………………………………......46

Using Gravity for Subsurface Imaging at Ship Rock, New Mexico
Sarina Yospin Carleton College March 9, 2007
Advisors:
Mary Savina, Carleton College Charly Bank, University of Toronto, KECK Geology Consortium
ABSTRACT
Ship Rock, a large brecciated formation of igneous rock with radially arranged dikes, is a prominent feature of the Navajo Volcanic Field in northwestern New Mexico. This study uses geophysical gravity surveys and modeling to investigate Ship Rock and test competing hypotheses for its formation. Using LaCoste and Romberg Model G gravimeters, a total of 105 gravity readings were taken at 0.3 km spacing in a 12 km x 11 km study area. After corrections to isolate the effect on gravity anomalies of subsurface density, indicative of subsurface rock type, the Bouguer gravity data show a +16 mGal high and a +7 mGal low in the northwest sector of the study area. Both anomalies are circular and <3 km in diameter. One possible model suggested that the gravity high was produced by a downwards continuation of Ship Rock's diatreme pipe, and the low was produced by a deeply buried magma chamber with hollowed-out components. However, given the context at Ship Rock, it is more likely that the gravity high shows a shallowly buried volcanic plug just east of Ship Rock, and the slight gravity low is a result of Ship Rock itself. This study did not find viable evidence of any magma chamber, and therefore firmly refute the volcanic neck model for Ship Rock, although they cannot reveal specifics of subsurface geometry. This study is important because subsurface gravity imaging can reveal how Ship Rock formed and could provide a possible model for how other diatreme systems form. Keywords: Bouguer anomalies, diatremes, geophysical surveys, gravity anomalies, subsurface geology

1
INTRODUCTION
Ship Rock is a prominent volcanic feature in northwestern New Mexico, and is
also called Tse Bit’a’i or “Rock with Wings” by the Navajo (Fig. 1). Radial dikes, the
“wings,” propagated outward from a magma reservoir and are expressed on the surface
flanking the main feature, Ship Rock (Chadwick and Dietrich, 1995). The emplacement
history of Ship Rock is debated, although it is featured in many introductory geology
textbooks, cited as a prime example of a volcanic neck that was once part of a cinder
cone (e.g. Monroe and Wicander, 1995). Many volcanic neck-radial dike systems
geometrically resemble Ship Rock.
Recently, however, the volcanic neck interpretation of Ship Rock has been
questioned. Instead, some geologists (Delaney, 1987; Semken, 2003) propose that Ship
Rock was part of a dike-and-diatreme system. A diatreme is defined as a volcanic vent or
pipe drilled vertically through the surrounding rock by the explosive energy of a gas-
charged magma (McCallum and Mabarak, 1976) (Fig. 2). Diatremes are typically
cylindrical or funnel-shaped with steep sides (Everson and Roggenthen, 1988). As for
the radially arranged dikes, Semken (2003) hypothesizes that they formed radiating up
and in towards what is now Ship Rock and either preceded or followed the diatreme
explosion that created Ship Rock itself.
Because the sequences of events would generate different subsurface geometries,
this study aims to answer the questions regarding Ship Rock’s formation through
geophysical gravity surveys and modeling. Gravity anomalies, as detected on the surface
using highly sensitive gravimetry instruments, could indicate the presence and location of
subsurface dikes and other igneous features, such as buried volcanic plugs, that formed

37°00’N
100°02’W
108°50’12”W
36°41’16”N
Shiprock, NM
Figure 1.Ship Rock is located in Shiprock, New Mexico on southern Colorado Plateau.Inset aerial satellite image shows diatreme and associated dikes.(Aerial photograph from Google Maps)
N
2

CBAAir
Figure 2.As a gas-charged magma ascends into a sedimentary environment, extreme high pressure built up from liquid de-gassing releases in an explosion, and a diatreme and maar crater develop, as seen in thesecross-section schematic diagrams of how Ship Rock could have developed. (Adapted from Everson and Roggenthen, 1988)
Maar crater
Layers of shale(with groundwater)
Diatreme pipe
}
3

4
more slowly as magma was extruded into cracks either opened by an explosive diatreme-
forming event, or possibly formed before the explosive event along lines of weakness. A
better understanding of the geometry of the explosion chamber and the buried dikes could
provide evidence in support of this diatreme model.
I will investigate the presence of two significant gravity anomalies detected at
Ship Rock, will model what subsurface features they may reveal, and will discuss which
model of Ship Rock’s formation is supported by the gravity data.
LOCATION, GEOLOGIC HISTORY AND SETTING
In the Cretaceous, a great continental seaway covered the southern Colorado
Plateau and deposited sandstone, mudstone and shale, including the prominent 200 m
thick Mancos Shale layer at Ship Rock (Delaney and Pollard, 1981). In the early
Tertiary, roughly 60 million years ago, subduction of the Farallon plate to the west fueled
the Laramide orogeny. Between the Oligocene and Miocene, part of the Farallon
detached and the Laramide orogeny ended, relaxing E-W compression and building the
area into alternating uplifts and basins bounded by north- to northeast-trending
monoclines, possibly related to reverse faulting at depth (Charles and Laughlin, 1992).
Volcanism erupted onto the Colorado Plateau and continued throughout the mid-Tertiary,
often characterized by explosive volcanism (Fig. 3). This episode led to the emplacement
of several types of volcanic features: kimberlite pipes, composed of volatile-rich potassic
ultrabasic rocks; diatremes, breccia- filled pipes formed by gaseous explosions; and, by
more passive volcanism, potassic and ultrapotassic flows; sills; and dikes (Charles and
Laughlin, 1992) (Fig. 4). Ship Rock is one of over 80 of these volcanic centers in the

Diatreme
Tuff Pipe
Utah
New Mexico
Colorado
Arizona
Ship Rock
Figure 3.Ship Rock is one of over 80 volcanic centers in the Navajo Volcanic Field and many moreon the Colorado Plateau. Major volcanic features of the Plateau are shown above.(Adapted from Semken, 2003)
0 km 60N
5

Mitt
en R
ock
Antic
line
Minette
Tuff Breccia
Gallup Sandstone
Mancos Shale
Dakota Sandstone
Morrison Formation
Tertiary
Cretaceous
Jurassic
Monocline
Syncline
Anticline
Small Volcanic Plugs
Volcanic Dikes
Ttb
Ga
Ma
DS
Mo
Tmn
Tmn
Tmn
Tmn
Tmn
Tmn
Ttb
Ma
Ma
MaMa
Ma
Ga
Ga
DS
Ga
Mo
36 45’
36 40’
108 55’108 50’
36 40’
Rattlesnake Anticline
0 1 2 3 4
Kilometers
Ship Rock
Figure 4.Geologic map of the Ship Rock area, showing sedimentary formations, volcanic features and regional structures.(Adapted from Delaney and Pollard, 1981)
36 45’
6

7
Navajo Volcanic Field (Semken, 2003).
In some of Ship Rock’s breccia, angular fragments of minette are housed in a tuff
matrix, implying that effusive minette features (dikes) were emplaced prior to the
explosive (diatreme). However, there are also dikes of solid minette locally cutting the
Ship Rock diatreme; the relationship between these two rock types does not definitively
indicate the temporal relationship of their emplacement in the study area (Delaney and
Pollard, 1981).
COMPETING MODELS FOR EMPLACEMENT
Volcanic Neck Model
If Ship Rock were emplaced as a volcanic neck, as it is often labeled, the material
of the main feature would be the same fine-grained material of the dikes, as both would
have formed non-explosively. The feature as seen today, according to this model, is the
solidified neck of an enormous volcano, whose cinder-cone exterior has entirely eroded
away. Gravity anomalies could reveal buried dikes, arranged in a very regular, radial
pattern, even underground, and the entire system would rest atop an extremely large
magma chamber that would have held all the magma fueling the active volcanic system.
Diatreme Model
According to this diatreme model of interpretation, the feature was emplaced
when groundwater in the shale was heated to extremely high temperatures under
confining pressure by upwelling magma in upward-migrating dikes (Semken, 2001;
Sheridan and Wohletz, 1983; Wolhetz and Heiken, 1992). A series of phreatomagmatic

8
explosions ensued, creating a shallow maar crater at the surface. As the groundwater
reservoir was depleted, the explosions migrated downwards, building up a pipe of minette
tuff breccia, specifically identified as a potassic mica lamprophyre (Semken, 2003), with
some collapsed sedimentary wall rock and pyroclastics. According to the diatreme model,
Ship Rock would not have been formed by magma from a large subterranean chamber, as
would a large volcanic neck; gravity data would be expected to show only a small magma
chamber underneath the Rock, at a depth much greater than that of the dikes.
The diatreme, formed as an underground explosion chamber, has been exhumed
since formation. Because Ship Rock is composed of almost all minette tuff-breccia, and
not a large amount of slumped-in wallrock, it is thought by those who support the
diatreme model that the above-surface feature is at mid-diatreme, and therefore at least
550 m of material originally above the present feature has been eroded (Semken, 2001).
Scientists have developed competing hypotheses to explain the non-volcanic neck
model for Ship Rock. One school explains the coexistence of the phreatomagmatic
feature (diatreme) and effusive features (the associated dikes and plugs) by hypothesizing
that the effusive features formed later, when magma resurgence built up dikes and plugs
not related to the initial explosion. If the violent explosion during which Ship Rock was
formed opened up great tension fractures, these could have immediately filled with
magma from a large magma chamber conduit, and solidified to form the dikes (Vokes,
1942).
Another view is that these dikes preceded the formation of Ship Rock diatreme,
with one main dike, likely the largest South Dike, fed the diatreme. The dike-fed
diatreme model postulates that a small but highly active magma chamber sent pressurized

9
molten material through cracks and weaknesses in the surrounding rocks. The material in
these cracks cooled and formed the dikes. Perhaps they were all trending towards a
singular weak point or area in the Mancos shale that offered the least confining pressure,
and in this area, when the dikes built up sufficient pressure by heating moisture in the
shale, the explosion occurred and the diatreme was formed.
GRAVITY
These possibilities (volcanic neck or diatreme; dike-fed diatreme or diatreme pre-
dating dikes) can be tested by using gravity anomalies, as detected on the surface,
indicative of subsurface rock density differences, to model images of subsurface
geometry. Imaging can show the subsurface bodies’ shapes and locations in the volcanic
field, and the root contacts of dikes and diatreme or magma chamber at depth.
Subsurface gravity anomalies caused by dense volcanic rock in less dense Mancos shale
(country rock) can be detected by sensitive instruments at the surface, using geophysical
surveying methods, including the gravimeters used in this study. Testing with gravity is
the method of this study because of its capabilities for accurate subsurface imaging. This
technique is especially important at Ship Rock, where surveys involving more invasive
methods like drilling or coring would be both uneconomical and highly disrespectful and
inappropriate on these lands sacred to and owned by the Navajo Nation.
QUESTIONS AND PLANS OF STUDY
Several questions can be addressed by analyzing gravity anomalies:

10
(1) Using the technology available for this study, are significant gravity anomalies
detected?
(2) Do gravity anomalies show evidence for subsurface dikes, plugs, or sills of dense,
volcanic material buried in the less-dense country rock?
(3) Can the data be modeled to understand and constrain the subsurface dike
geometry and depth of their emplacement, and provide support for any one model of Ship
Rock’s formation?
(4) Do gravity data indicate the presence of a buried magma chamber underneath
Ship Rock?
All of these questions are important because answering them could reveal how
Ship Rock formed and how its dikes propagated, either as a volcanic neck or as a
diatreme, and, if it formed as a diatreme, the sequence of events of its features’
formations. In the latter case, Ship Rock could provide a possible model for how other
diatreme systems form.
METHODS
Two LaCoste and Romberg Model G gravimeters were used in this study (Fig. 5).
Both operated using leveling and aliod system, one electronic and one non-electronic.
Each gravimeter houses a mass suspended on a spring. After the device is precisely
leveled on the ground, and the mass is given at least ten seconds to stabilize, the spring’s

Figure 5.Two LaCoste and Romberg Model G Gravimeters were used for gravity data collection. The box containing the highly sensitive spring and extension-reading device must be set on a completely level plate before a reading is taken.(Photo: Yospin, 2006)
11

12
extension is measured and interpreted as indicative of the gravity field strength in that
location.
Gravity readings were taken at .3 km (300 m) spacing in a 12 km E-W x 11 km
N-S area along several roads around Ship Rock, creating a network of approximately E-
W and N-S striking gravity profiles. The data collection lines were selected to construct
a loose grid around the Ship Rock diatreme and its associated dikes, with a total of 105
readings taken along 8 sampling lines. Gravity was read in milligals, and recorded from
two separate gravimeters. One measured in milligals, while the other measured in dial-
spins. All readings taken on the latter gravimeter had to be multiplied by a conversion
constant of 1.0264 dials to milligals so that all readings could be compared.
Horizontal position was taken at each measurement site using Trimble roving
GPS units (Fig. 6). GPS error sources include interference from the ionosphere and
troposphere, inaccuracy in satellite clocks and receiver noise (Bank, 2006). With these
inaccuracies, a regular GPS reading gives location with a roughly 9 m horizontal error.
Most of these errors can be corrected with differential processing, reducing error to
roughly 1.3 m. For even greater accuracy, the carrier phase is used, reducing error to 10
– 20 cm, post-processing. Horizontal position was recorded in Universal Transverse
Mercator Zone 12, which contains the area of study.
Total Station surveying equipment was used at each gravity station site to obtain
vertical position data within 10 cm of the elevation at every site (Fig. 7). The raw data in
this study consist of gravity readings in milligals with the time each reading was taken, as

Figure 6.GPS data collection was done using roving units to gather carrier-phase data at each measurement site. Data was corrected to the differential for 10 - 20 cm horizontal position accuracy.In photo: Carolyn Tewksbury, Smith College(Photo: Yospin, 2006)
13

Figure 7.Total Station elevation readings, were taken at every gravity site usinga Leica sighting instrument, providing 10 cm vertical position accuracy.(Photo: Yospin, 2006)
14

15
well as the GPS-provided and total station-revised northing and easting values of its
precise location, and vertical position data from total station measurements.
I will use published densities of the various rock types present in the Ship Rock
area to construct and interpret models in examination of this factor’s effect on observed
gravity anomalies from the 1981 Ship Rock study by Delaney and Pollard.
Minette ≈ 3.0 g/cm^3 Tuff breccia ≈ 2.04 – 2.27 g/cm^3 Shale ≈ 1.8 g/cm^3 at surface, ≈ 2 g/cm^3 at depth
THEORY OF GRAVITY CORRECTION
Gravity’s effect varies significantly in space from the standard 9.8m/s^2, due to
several factors. Gravity variation can be measured as an anomaly; as with any sort of
anomaly, a gravity anomaly signals that something is out of the ordinary. This deviation
can be caused by any number of variables, including rock density, the factor of interest to
this study. To isolate the effect of rock density on a gravity reading, which this study
must do to constrain data for subsurface imaging, each unrelated variable must be
extracted out of the data. To account for these unrelated factors, a value must be either
added to or subtracted from the gravity reading as taken in the field.
Drift Correction
In this gravity survey, loops back to base stations were completed approximately
every hour to re-measure gravity and account for abundant sources of drift. Readings do
vary slightly with time, due to internal machine spring fatigue, temperature variation, and
most significantly, variation with the tidal cycle. Within the time space of about an hour,

16
this drift is assumed to be roughly linear. A drift curve is constructed from the data and
every reading is corrected to this curve.
Latitude correction
The latitude at which a gravity reading is taken must be accounted for, as gravity
is affected by the amount of material between a body and the massive core of the earth.
Because the shape of the earth is an oblate spheroid, not a sphere, gravity varies
depending on latitude. The closer one is to the poles of the earth, the stronger the gravity
field. This phenomenon is also related to the effect of strong centrifugal force at the
equator. The difference in gravity field reading moving from the equator to a pole is 5
gal (Bank, 2007), a significant difference for a study such as this one.
The latitude correction was calculated using published values for the region’s
height above the ellipsoid base level, as determined by the base station elevation,
according to differentially corrected GPS.
Free-air correction
The free air correction amount is 0.3086 mGal per meter above sea level, and
adjusts data to fit the assumption that there is only “free air” between sea level and the
station being measured. This correction is positive, because increased distance from
earth’s center serves to decrease gravity readings. Given the magnitude of gravity
readings taken, this is quite a large correction; hence, accuracy in elevation data (from
GPS) is particularly significant for the study.

17
Simple Bouguer Correction
The Bouguer correction accounts for elevation and rock density between the
measurement station and a reference level – the “Bouguer slab.” The Bouguer slab is a
simplified model of the earth’s surface used in gravity surveys, based on the assumption
that the world’s topography can be represented by a flat plate of uniform density with a
thickness equal to the height of a gravity station above a known reference level. This
correction removes the effect of the slab’s gravitational pull, when the slab is assigned a
known density. The Bouguer gravity effect is calculated as
Field = 2πρGh
where ρ is the density of the surface rock, approximately 2.67g/cm3, G is the universal
gravitational constant, and h is plate thickness. This correction is negative, to adjust for
the positive effect of slab thickness.
Regional Gravity Trend Correction
In a given region, gravity often increases or decreases on a continuous gradient,
because of large-scale regional structures. In order to correctly interpret local gravity
anomalies, the slope of this gradient’s line must be corrected to horizontal, and anomalies
must be analyzed in terms of their deviation from this corrected gradient.
Terrain Correction
Terrain corrections adjust for deviations of actual topography from an imaginary
plane, running parallel to sea level, at the elevation of a gravity station. Terrain
corrections are always positive. Curvature correction is another part of terrain correction,

18
accounting for the spherical cap shape of the Bouguer slab, as draped over the Earth’s
surface. The Hayford-Bowie system of compartment curvature adjustment corrects for
these terrain effects out to a radius of 167 km (LaFehr, 1991), which is adequate for the
relatively non-rugged terrain surveyed in this project.
For this study, complete terrain corrections would be done using terrain correction
software and the total station data we gathered to provide a high-accuracy Digital
Elevation Map (DEM) for the small region. However, such a program was not available
for my use in this study, and it should be noted that in this almost-flat landscape, terrain
corrections may not be the most crucial adjustment made to data. Ship Rock itself,
however, does potentially exert a large terrain-effect on gravity anomalies, and this effect
was roughly corrected for, as will be addressed later in the “Interpreting the Model”
section of this paper.
RESULTS
A high gravity anomaly in this case would reflect that the detection instrument
was situated above high-density material. Solid minette (as in the dikes) is the densest
material this study will likely encounter; minette tuff breccia, the material of the diatreme
and likely of its feeder pipe, is less dense than pure minette; and the Mancos shale
country rock is far less dense than either igneous material. Because of the density
difference anticipated between dike-material and diatreme-material, it is possible that
though the volume of the diatreme pipe is likely much greater than any dike’s volume,
the gradient of an anomaly caused by tuff-breccia will be less steep than an anomaly from
a minette dike. Other factors such as depth of burial will complicate this.

19
A contour map, constructed using the computer program Surfer, shows simple
Bouguer gravity data as gathered in the field (Fig. 8). A consistent gravity value trend
can be observed, with values decreasing on a line striking NW-SE. The removal of this
regional gravity gradient is a correction supported by a statewide regional gravity
gradient in New Mexico, trending in the same direction (Fig. 9). The regionally
corrected data are deflected around two main features: the paired steep high and slight
low in the northwest sector of the study area (Fig. 10).
The roughly circular +16 mGal high extends about 2 km E-W and 2.5 km N-S.
Just east of this, a slight gravity low of +7mGal has a 1 km E-W, 2.5 km N-S extent. The
+16 mGal high is steepest to the northwest of the anomaly’s center, and gravity values
decrease away from the anomaly on all other sides at a fairly steady rate, with the
exception of the location of the +7 mGal low. These are the two most prominent
anomaly features of the gravity data, and given the distribution of stations around them,
the anomalies are well-constrained and credible. Figure 11 shows the corrected and
contoured Bouguer gravity data superimposed onto a DEM of the Ship Rock area. As
seen on this map, the gravity high falls west of Ship Rock and the slight gravity low is
located at Ship Rock itself. A three-dimensional representation of this data, as viewed
from three points of perspective, shows how this high and low relate to gravity value
trends over the study area (Fig. 12).
SUBSURFACE MODELING OF GRAVITY FEATURES
The gravity high and low are the most significant anomalies detected in this study,
so modeling was done for these buried bodies along the line of Northing position that cut

N
Figure 8.Contoured Bouguer gravity data, before extraction of the regional gravity gradient,shows a steep decreasing trend from NW to SE. Gravity measurement stations areindicated by post marks.
20

N
Figure 9.The Bouguer gravity anomaly map for the state of New Mexicoshows a decreasing large-scale regional gravity gradient trending NW to SE.This gradient trend is echoed in the trend for data in this Ship Rock study, located at white star on the above map, and was corrected out of theBouguer gravity data.(Adadpted from Heywood, 1992)
21

Figure 10.Regionally corrected Bouguer gravity data values are deflected aroundtwo main anomalies, a high and slight low. Gravity measurement sitesare represented by post marks.
22
N
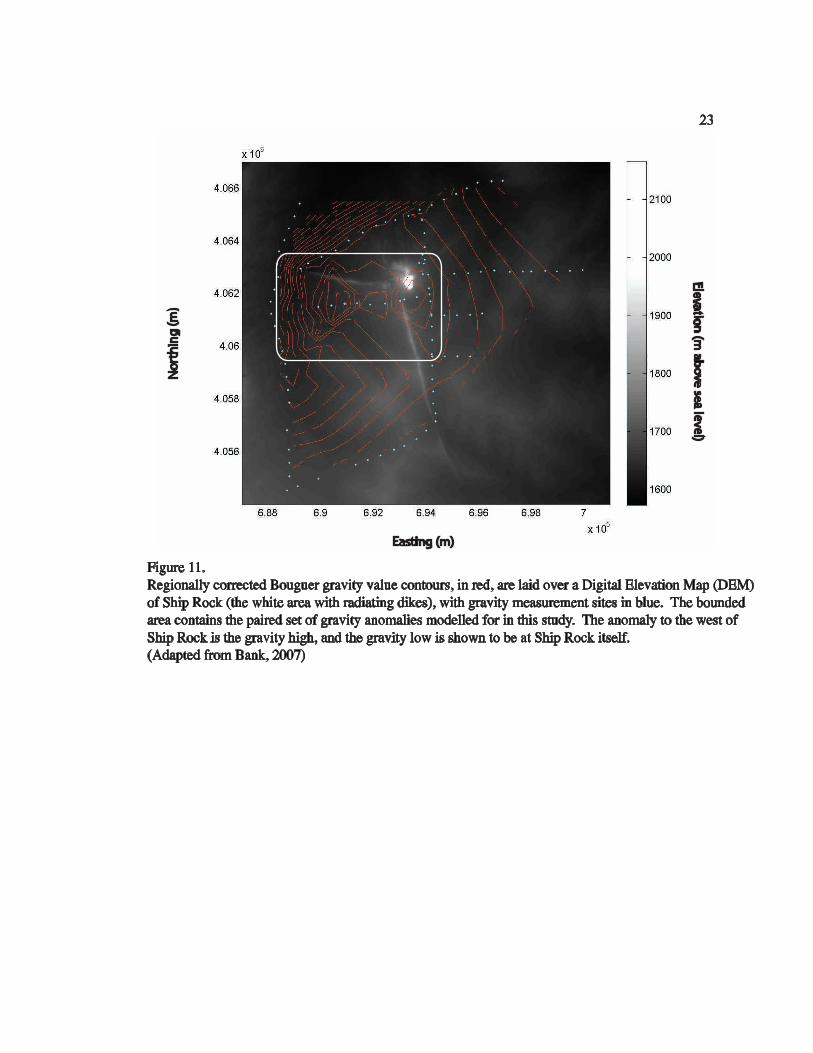
Figure 11.Regionally corrected Bouguer gravity value contours, in red, are laid over a Digital Elevation Map (DEM)of Ship Rock (the white area with radiating dikes), with gravity measurement sites in blue. The boundedarea contains the paired set of gravity anomalies modelled for in this study. The anomaly to the west ofShip Rock is the gravity high, and the gravity low is shown to be at Ship Rock itself.(Adapted from Bank, 2007)
Easting (m)
No
rth
ing
(m)
Elevation
(m ab
ove sea level)23
View to North
View to Northeast
View to Southwest
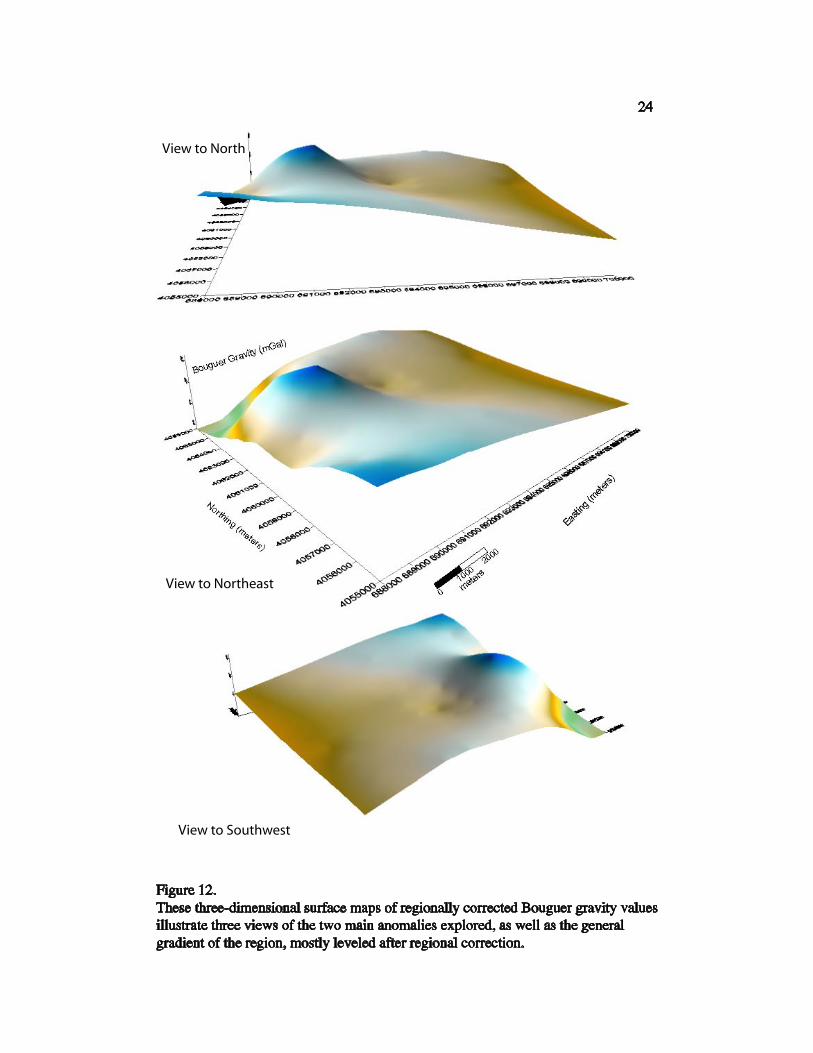
Figure 12.These three-dimensional surface maps of regionally corrected Bouguer gravity valuesillustrate three views of the two main anomalies explored, as well as the general gradient of the region, mostly leveled after regional correction.
24

25
across the intriguing anomalies (Fig. 13). I developed one possible model for Ship
Rock’s subsurface geometry to explain observed Bouguer gravity anomalies (Fig. 14).
Using the subsurface imaging software Grav2DC, designed by Dr. Gordon Cooper, the
regional gradient-corrected Bouguer gravity data were plotted with their northing and
easting positions. This computer program allows users to input virtual buried rock
bodies, specifying their density contrast with the host rock, depth, width, and shape. The
user can adjust these parameters, altering the factors determinant of the observed gravity
anomaly as it would be detected on the surface, until the observed and modeled gravity
anomalies resemble each other.
In this model, observed Bouguer gravity data points are represented by the post
marks along an x-axis of easting in meters and an upper y-axis showing gravity value in
mGal. The lower y-axis shows the depth of the subsurface body in kilometers. Two
bodies have been modeled: the first, shown in orange, is placed underneath the larger of
the two observed anomalies. It is buried shallowly, at a depth of roughly 3 km, with a
density contrast of +0.165 g/cm^3 with the surrounding country rock, with a width of
roughly 150 m. The second body, shown here in blue, is buried much deeper, at 75 km,
and placed east of the anomalous low. Its width is 145 m, and its density contrast is
+0.075 g/cm^3. These density contrasts are quite small given the densities of minette
(3.0 g/cm^3), tuff breccia (2.1 g/cm^3) and shale (1.8 g/cm^3); although the modeled
bodies fit the data, the parameters required for these sorts of deeply buried bodies to
match the observed data are far from what is expected at Ship Rock.
The important caveat in gravity modeling is the plurality of “correct answers.” A
model can successfully fit data without successfully fitting the geological context of a
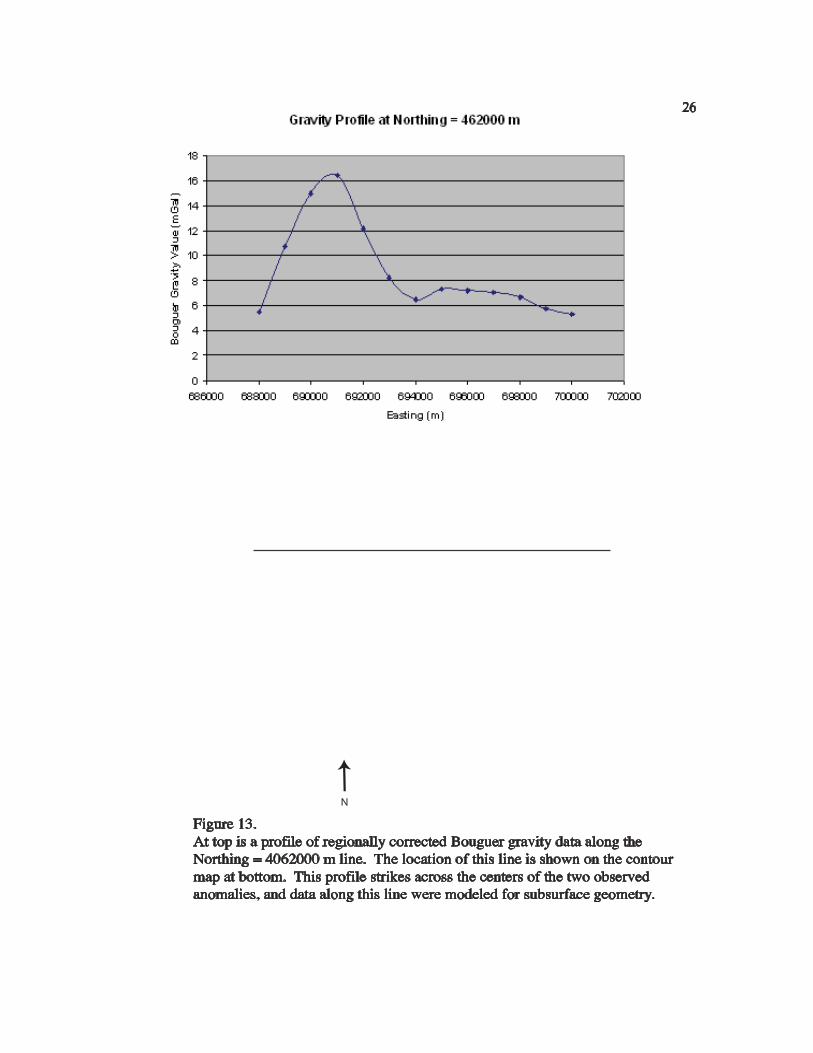
Figure 13.At top is a profile of regionally corrected Bouguer gravity data along the Northing = 4062000 m line. The location of this line is shown on the contour map at bottom. This profile strikes across the centers of the two observed anomalies, and data along this line were modeled for subsurface geometry.
26
N

27
Figure 14.Alongside observed, regionally corrected Bouguer gravity from the observed paired anomaly (post marks), hypothetical anomalies are plotted (black lines), as would be caused by the two modeled subsurface bodies. These properties were manipulated until the modeled anomalies most closely fit the observed anomalies. Shown on the model above are Easting (x-position), gravity value in mGal (upper y-axis position), subsurface burial
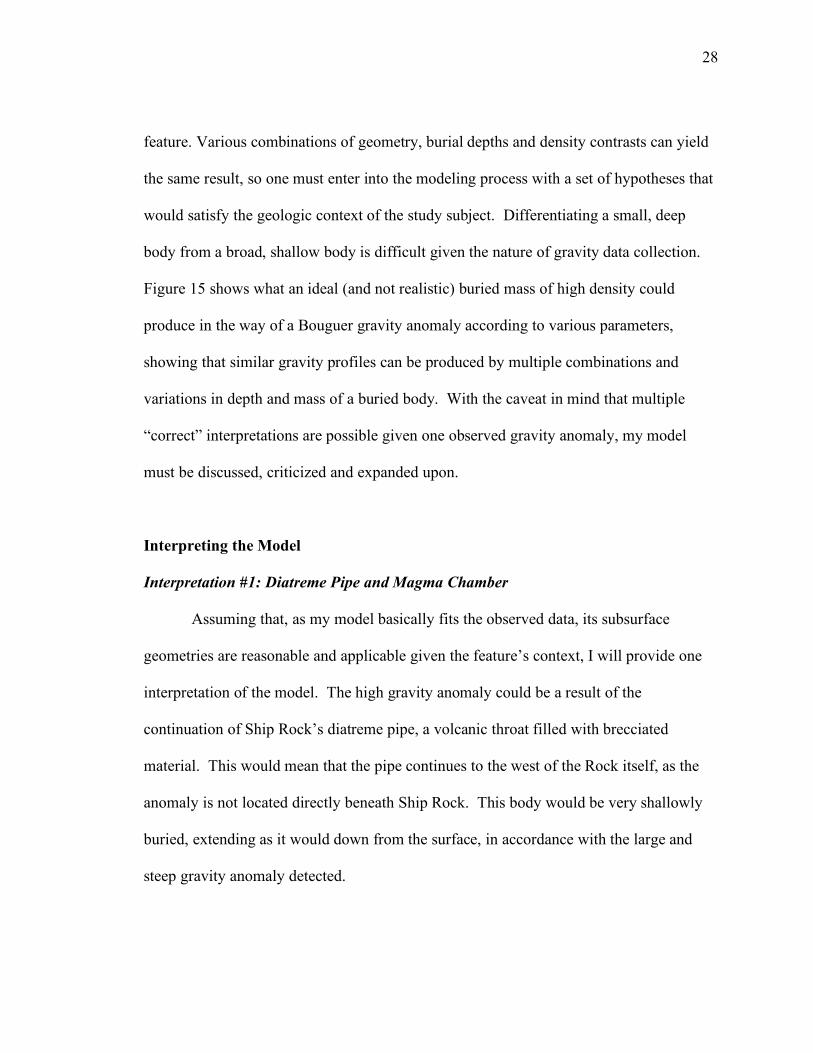
28
feature. Various combinations of geometry, burial depths and density contrasts can yield
the same result, so one must enter into the modeling process with a set of hypotheses that
would satisfy the geologic context of the study subject. Differentiating a small, deep
body from a broad, shallow body is difficult given the nature of gravity data collection.
Figure 15 shows what an ideal (and not realistic) buried mass of high density could
produce in the way of a Bouguer gravity anomaly according to various parameters,
showing that similar gravity profiles can be produced by multiple combinations and
variations in depth and mass of a buried body. With the caveat in mind that multiple
“correct” interpretations are possible given one observed gravity anomaly, my model
must be discussed, criticized and expanded upon.
Interpreting the Model
Interpretation #1: Diatreme Pipe and Magma Chamber
Assuming that, as my model basically fits the observed data, its subsurface
geometries are reasonable and applicable given the feature’s context, I will provide one
interpretation of the model. The high gravity anomaly could be a result of the
continuation of Ship Rock’s diatreme pipe, a volcanic throat filled with brecciated
material. This would mean that the pipe continues to the west of the Rock itself, as the
anomaly is not located directly beneath Ship Rock. This body would be very shallowly
buried, extending as it would down from the surface, in accordance with the large and
steep gravity anomaly detected.
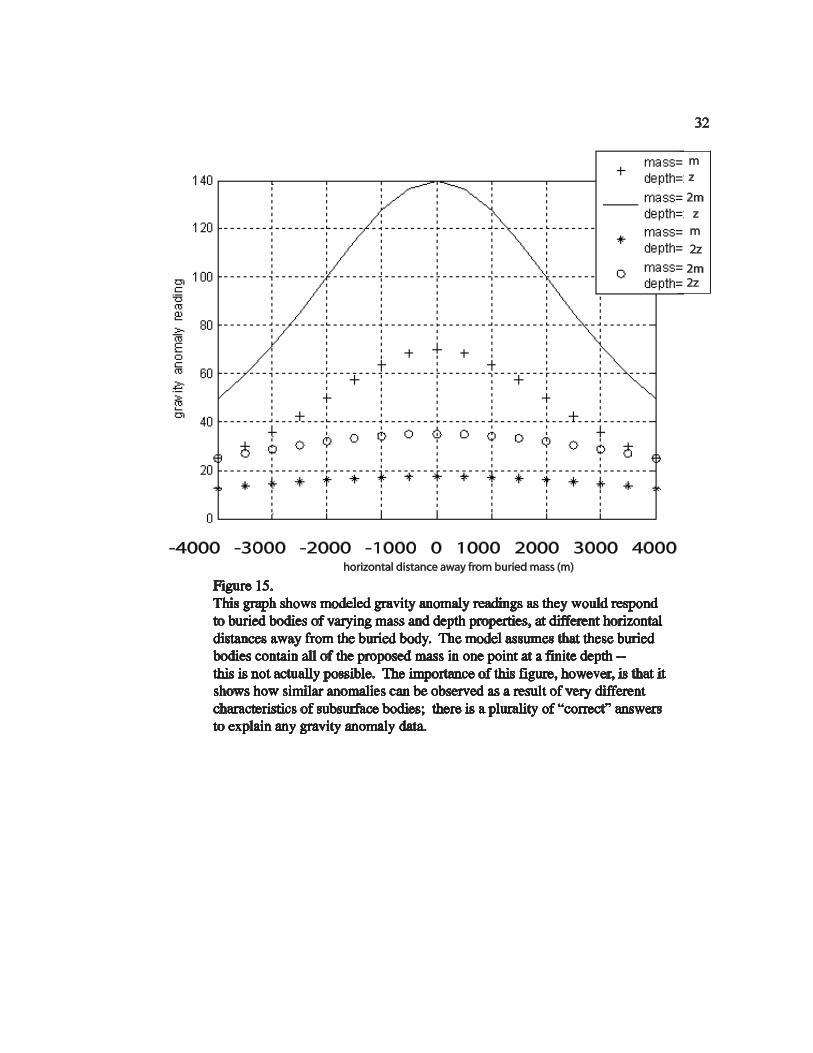
horizontal distance away from buried mass (m)
-4000 -3000 -2000 -1000 0 1000 2000 3000 4000
mz
2mz
m
2z
2m2z
Figure 15.This graph shows modeled gravity anomaly readings as they would respondto buried bodies of varying mass and depth properties, at different horizontaldistances away from the buried body. The model assumes that these buriedbodies contain all of the proposed mass in one point at a finite depth --this is not actually possible. The importance of this figure, however, is that it shows how similar anomalies can be observed as a result of very differentcharacteristics of subsurface bodies; there is a plurality of “correct” answersto explain any gravity anomaly data.
32

30
The second buried body could be interpreted as being a deeper feature with a
positive but low (relative to its surrounding gravity values) gravity signature, perhaps a
buried magma chamber with hollowed-out components. At Ship Rock, this magma
chamber would reasonably be located far deeper than the features it fed, and would be
greater in width than either the dikes or the buried diatreme pipe. However, with the
rather small modeled width of 145 m, this chamber is not large enough to have fed the
formation of a giant volcanic neck, and this interpretation would therefore fit with the
postulated dike-diatreme model. This feature is interpreted, according to this model, as
having a lower density contrast with the surrounding rock than does the diatreme pipe,
even though a magma chamber could be expected to contain higher density minette rather
than explosion-formed tuff. This discrepancy between the expected and the modeled
could be explained by a hypothesis that the magma chamber is partly hollowed out, after
being emptied by the Ship Rock explosion and the dikes’ formation, which would greatly
decrease its gravity signature. A diatreme, on the contrary, is considered to be composed
of solid rock. Diatremes modeled in cross-section, such as Black Butte in Montana by
Everson and Roggenthen (1988), are usually shown to be made up of a combination of
breccia and pyroclastics, containing little to no high-density basaltic/ minette material
(Fig. 16).
Breccia pipes usually extend straight downwards to their source magma
chambers, but they are sometimes inclined (Everson and Roggenthen, 1988). Given that
the general shape of Ship Rock diatreme, if outlined from above, is a roughly NE-SW
trending ellipse (Fig. 4), it could be interpreted as a diatreme pipe oriented at an angle, so
that its surface expression is not perfectly circular. This orientation direction can be

met
ers
600
400
200
200 400 6000meters
met
ers
600
400
200
200 400 6000meters
met
ers
600
400
200
200 400 6000meters
met
ers
600
400
200
200 400 6000meters
met
ers
Breccia
600
400
200
200 400 6000meters
Figure 16.This diagramatic cross-section of the Black Butte diatreme in Montana shows that the feature consistsmostly of bedded pyroclastics and some breccia, cutting thorugh sedimentary layers.(Adapted from Everson and Roggenthen, 1988)
Sedimentary Layers
31

32
inferred from the gradient of gravity data increase in various directions around the
anomaly. The fact that the observed gravity anomaly is steepest towards the northwest of
the circular anomaly supports the diatreme pipe’s orientation slanting downwards SE, so
that the feature is closest to the surface in the NW, producing a sharp gravity gradient in
that region. According to this proposed model, the diatreme pipe could be sloping
towards the magma chamber at its base, buried at depth.
Interpretation #2: Volcanic Plug
Many aspects of the first interpretation of gravity data are inconsistent with the specific
context of Ship Rock and with the geometry of other dike-diatreme systems, so an
alternative to the model is proposed. In general, a subsurface feature does not exceed in
depth the breadth of its gravity anomaly as detected at the surface; as both detected
gravity highs are expressed as narrow-range surface anomalies, their depths of
emplacement should be quite shallow, likely under 2 km. A magma chamber would be
buried, and a diatreme pipe would extend, deeper than this estimate. Given the evidence,
it is more likely that the observed anomalies indicate a shallowly emplaced feature, in the
case of the gravity high, and Ship Rock itself, in the case of the gravity low.
Above the surface, many relatively small, dense minette features exist in the
vicinity of Ship Rock as satellites of the main feature, mostly line with the dikes arranged
radially around the Rock (Fig. 17). The volcanic plugs, as they are called, are made of
highly dense minette, rather than tuff breccia. Given the presence of these features above
surface, perhaps a shallowly buried volcanic plug just east of Ship Rock is producing the
observed gravity anomaly high. The geometry of these plugs’ emplacement above-

Figure 17.This aerial photograph view of Ship Rock to the SSE shows small satellite volcanic plugs (lower left).Such bodies, buried to the east of Ship Rock, may be responsible for the observed gravity anomaly high.(Photo: from Maher, 1966)
550 m
33

34
surface has not been the subject of much geological or geophysical research, although
they tend to be arranged around Ship Rock in alignment with an associated dike.
Because the sampling density is shown to be insufficient for illustrating the
presence of a feature so small as a minette dike, these data cannot be used to determine
whether this possible plug is associated with a buried dike, and, if so, the orientation of
such a dike.
The + 7 mGal low to the east of the high anomaly is a small anomaly given the
values surrounding it. Given the position of this anomaly as shown with the DEM in
Figure 11, the gravity low is most likely a result of the effects on gravity signature of
Ship Rock as a massive above-ground feature. The presence of so much dense material
on the surface would be expected to lower gravity signature enough to produce a gravity
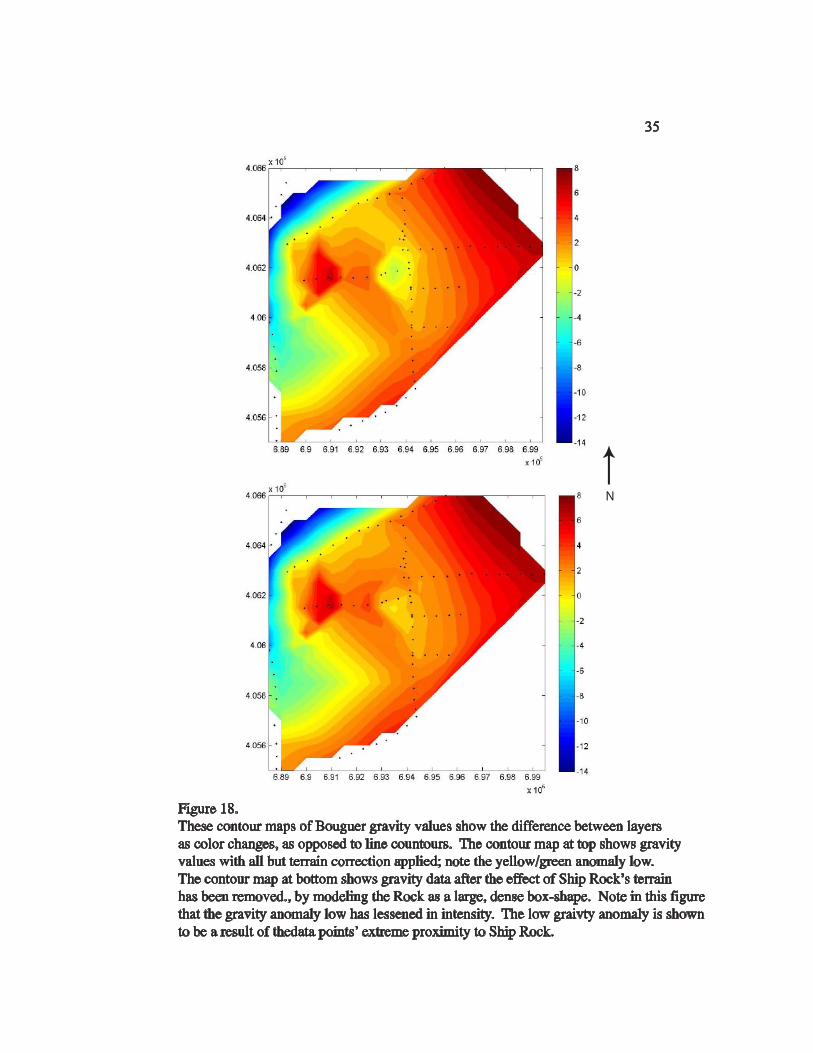
low near Ship Rock. To estimate this terrain correction, the vertical attraction due to Ship
Rock, approximated by a box-shaped object 500 m up, and 500 m x 500 m at its base,
was calculated. A density of 2670 kg/m^3 (standard Bouguer density) was assumed.
Correction values for stations close to the diatreme are about 2.5 mGal. As expected, this
basically removes the simple Bouguer gravity low S of Ship Rock (Fig. 18).
Focusing on interpretation of the circular high of + 16 mGal, its emplacement at
such a shallow depth could be examined in light of the known stratigraphy of the area.
Stratigraphic surveys have estimated the thickness of the Mancos shale at 200 m near
Ship Rock given present-day surface elevation. Perhaps in the space available at the
contact between the Mancos and the underlying basement rock, at a depth of roughly 200
m, these volcanic plugs formed, with a vertical orientation but taking advantage of the
N
35
Figure 18.These contour maps of Bouguer gravity values show the difference between layersas color changes, as opposed to line countours. The contour map at top shows gravityvalues with all but terrain correction applied; note the yellow/green anomaly low. The contour map at bottom shows gravity data after the effect of Ship Rock’s terrainhas been removed., by modeling the Rock as a large, dense box-shape. Note in this figurethat the gravity anomaly low has lessened in intensity. The low graivty anomaly is shownto be a result of thedata points’ extreme proximity to Ship Rock.
36
roughly horizontal plane of weakness. A ~ 200 m emplacement depth would fit the
observed data relatively well, and offers one explanation for the feature’s burial depth.
Perhaps this plug feature, vertical in nature, strikes NW-SE and dips at a fairly
steep angle, producing the steeply graded gravity data to the NW of the anomaly and the
evenly decreasing values in all other directions outward from the anomaly. This
orientation was suggested for a diatreme pipe in the first interpretation of the data and the
proposed model. This second interpretation has shown that the diatreme pipe is
unrealistic, but the inclined cylindrical feature aspect of the first interpretation still seems
viable when applied to this possible volcanic plug. Perhaps a diatreme pipe anomaly was
not detected because Ship Rock itself, located directly above the continuation of its own
diatreme pipe, cancels out the detectable gravity anomaly.
Interpretation #3: Large-Scale Magma Chamber
My data show a local + 4 mGal anomaly and another local –1 mGal anomaly,
deviating from a fairly steadily sloped gravity gradient with a roughly 16 mGal range.
This suggests that gravity values indicate a broad and high plateau, with two main
deviations. This could arguably be used as evidence in favor of a large magma
chamber’s presence; perhaps the entire plateau of values for the study area is a result of
this magma chamber. To this argument, I would respond that the similarity of gravity
gradients in our small-scale study and the larger scale New Mexico study, as recorded by
Heywood et al. (1992), shows that the plateau of values is part of a larger, regionally-
scaled trend in gravity, rather than reflective of a large Ship Rock magma chamber.

37
Summary of Inferred Subsurface Geometry
The subsurface geometry, as can be best inferred from the proposed model and
from the critique of the proposed model of gravity data, is characterized by a shallowly-
emplaced dense feature, likely a volcanic plug striking NW-SE and dipping downwards
at a moderate angle; this is the interpretation of the gravity high. The low is interpreted
as a small deviation from a steadily decreasing gravity gradient to the east of the high
anomaly, a result of the terrain effect of Ship Rock’s above-ground mass. This gravity
survey did not detect significant gravity anomalies that could be interpreted as dikes
around the Ship Rock area. This is to be expected; dikes are extremely narrow features
(those at the surface do not exceed 2 m in width) that produce quite small gravity
anomalies. Evidence to support a magma chamber buried at depth was not found in this
study, for either a small or a large magma chamber.
DISCUSSION
I will review the questions outlined in the plan of this study, and discuss how and
why the study was or was not able to provide answers to these questions.
The gravity survey was able to detect anomalies that likely show evidence for at
least one buried dense body. This body is almost certainly not a deep magma chamber, a
narrow dike, or a continuation of the diatreme pipe of Ship Rock. The survey sampling
was too sparse to pick up on anomalies caused by extremely narrow dikes; other surveys
of local-scale gravity anomalies that have been able to detect such subsurface features
have had far more data points in a given area than did the Ship Rock survey, and have
tended to cover a much larger area.

38
In the 2003 study by Hofmann et al., gravimetric modeling was done to detect the
existence and geometry of a possible source of mantle upwelling or a magma chamber, as
related to the occurrence of swarm earthquakes in Vogtland/NW-Bohemia region.
Gravity data in the Hofmann study was gathered as 17000 data points, covering a total
area 142.2 x 165.2 km2 to construct a Bouguer gravity map. Hofmann’s survey, then, is
far larger than this survey of the Ship Rock area. The authors of the Bohemia study,
however, put full confidence in the spacing of their data points to provide good resolution
of local structures, and high resolution of deep structures (Hofmann et al., 2003). Our
data surveying, on the other hand, did not record anomalies from features so small as
minette dikes, likely because our survey was not of a dense enough resolution to focus on
each; perhaps, with our density of spacing over a larger area, as in the Hofmann et al.
study of 2003, resolution would have been sufficient to detect such small features and
confidently describe their geometry.
In their 2003 study, Hofmann et al. also made use of a deep borehole within their
study area, an excellent tool for confirming or denying theories of subsurface geological
composition and geometry. However, in Ship Rock, such a data resource would be
offensive, according to Navajo tradition, and illegal, according to United States law.
Purely non-invasive geophysical methods have been employed for this Ship Rock study.
This study’s gravity data were used to make modeled subsurface bodies roughly
fitting the observed Bouguer anomalies, but the model is shown to be non-viable given
the context of Ship Rock. Gravity data can be shown to support the presence of a
shallowly emplaced volcanic plug, but gravity values do not provide a unique picture of
subsurface geometry. Other gravity studies address the non-unique solution problem of

39
subsurface gravity modeling. Everson and Roggenthen (1988) detected a buried chamber
and modeled it experimentally as a cylinder, a cone, and as a combined cylinder-cone
shape, all of which could be made to roughly fir their observed data. The study of a
Galapagos volcanic system by Chadwick and Dietrich (1995) modeled three idealized
shapes for a buried magma chamber/ diatreme of brecciated material as well: a sphere,
oblate spheroid (flattened at the poles), and prolate spheroid (egg-shaped). The models
they choose in their studies are the ones that most closely fit their gravity data, and, just
as importantly, the predicted context of their features; the same must be said of my study.
Given these previous studies’ work to define the shape of diatreme pipes, some
hypotheses on Ship Rock’s diatreme pipe geometry can be said independent of gravity
data.
Through modeling these shapes, Chadwick and Dietrich as well as Everson and
Roggenthen suggest that in a dike-diatreme system, the most likely shape of such a pipe
is something a vertical, cylindrical conduit. This is useful for examining Ship Rock,
which has an elliptical cross-section as expressed at the surface. Based on this, the
inclined diatreme pipe seems a viable possibility, even if this study’s gravity data do not
reveal the shape or extent of the diatreme pipe. Perhaps no anomaly reminiscent of a
diatreme pipe was detected because the gravity effect of the buried diatreme pipe was
cancelled out by the gravity effect of the above-ground diatreme pipe (Ship Rock itself)
situated above it.
Given the data collected, even after all the corrections had been performed, an
accurate model of the diatreme pipe cannot be realistically constructed from this survey
of the Ship Rock area. As for the magma chamber, this study’s data cannot classify the

40
shape or depth of any magma chambers; no such body was detected. This absence,
though, is an important result: a small magma chamber was postulated to be a possibility
in this diatreme system, as opposed to a large magma chamber that would be expected to
fuel a volcanic neck system. No magma chamber of any size was detected in this survey,
meaning that the process of Ship Rock’s formation was not fed by a magma chamber at
all. This evidence firmly refutes any sort of volcanic neck model in application to Ship
Rock, in addition to the fact that the brecciated material of Ship Rock further
distinguishes it from a volcanic neck, which would be composed of rock formed of
molten material (Everson and Roggenthen, 1988).
POTENTIAL PROBLEMS AND SOURCES OF ERROR
Possible problems could arise from the gravimeters’ machine error. Sources of
this error include wind blowing while readings were taken, which can throw off the
leveling of the gravimeter. Extreme heat on the machine could have affected the internal
spring’s extension, although it is unlikely given that the spring resides inside a
temperature-controlled box, which uses most of the machine’s battery power for constant
temperature maintenance. Imprecise instrument placement of the gravimeter, GPS roving
unit, and total station could reduce the accuracy and consistency of readings, due to
human error or to the shifting of the crumbling Mancos Shale. Error could also arise
from inconsistency in how readings were taken by multiple people and on multiple
machines.
Drift, machine and tidal, was assumed to be linear between base station readings,
but this is not exact, and could be a source of error in the study. By completing

41
approximately hourly loops back to base stations, we hope that our study accounted for
this drift. However, if drift is not really linear, then even hourly loops may not adjust for
it.
It is also possible that our site spacing (0.3 km) was too broad to pick up on all
gravity anomalies. The area the study covered in its survey was large and the bodies
which this study hopes to locate could be too small; the dikes expressed on the surface
are at most ~ 2 m thick, and other features may also be small. It is possible that, in order
to catch such gravity anomalies, the grid on a gravity survey would need to be tighter.
Our data reductions could be imprecise. For our horizontal positions, GPS
differential correction using carrier phase data gives good, but not perfect, precision.
Depending on satellite configuration in the sky at any given moment, an abundance of
satellites could be contributing position data, and at another moment, it could be that no
satellites’ signals would be received. For this reason, we allowed for several minutes of
GPS data collection at each gravity site, but even with this method, GPS position could
have been slightly inaccurate.
FURTHER QUESTIONS AND FUTURE WORK
As discussed, many of the questions outlined in the plans for the study could not
be answered by the data gathered. Future work could expand on our data set and more
densely sample the area to further investigate the geologic story behind Ship Rock.
Producing a fully terrain-corrected Digital Elevation Map (DEM) with our data
would be useful to future gravity surveys of the Ship Rock area. Many gravity surveys
are published without any complete terrain correction, because computing them is time-

42
consuming and requires expensive software. Data is not entirely meaningful unless all of
the appropriate corrections have been performed and performed correctly; some of this
study’s data is questionable or unexplainable, possibly because terrain corrections were
not performed. If our data could be used to build a highly accurate terrain map of the
area, then future geophysicists would have a much easier job of getting accurate gravity
data for the area and further investigating questions of Ship Rock’s formation.
Future work on this topic could expand our study by putting together our area
gravity map with an area map of magnetic anomalies. Magnetic anomalies would be
expected to parallel gravity anomalies, because both magnetic signature and gravity field
are stronger for minette than for shale. Magnetic field is higher over these dikes because
minette has a much higher percentage of iron, as well as other magnetic minerals, than is
found in shale. Other students working on this same KECK project conducted a magnetic
survey of the same area with the same questions for their studies: finding and
understanding the geophysics of subsurface minette dikes. If more studies of the same
area are done in gravimetry and magnetometry, these data could be compiled and layered
over the accurate map for which this study’s survey was completed.
Putting these studies together could strengthen hypotheses on the presence and
locations of subsurface minette dikes, shedding more light onto how the Ship Rock
diatreme formed and propagated. More work could be done in areas where we detected
slight gravity anomalies, where finely-tuned microgravity surveys could reveal small but
significant variations. One student on this KECK project, Carolyn Tewksbury of Smith
College, executed microgravity and micromagnetic surveys over a small area of a dike
which had experienced en echelon faulting. Her findings on detailed dike geometry at a
43
small scale could perhaps be unified with this study’s larger scale surveys, to model more
precisely how subsurface dikes could be formed.
Gravity surveying has been done on a larger scale in New Mexico (Heywood,
1992) but never in order to investigate a specific and small-scale subsurface geological/
geophysical question. This study shows, however, that even on such a small scale,
sampling for gravity data must be done more densely to show very small or narrow
subsurface bodies (as in dikes) or to further constrain data for gravity models. Studies
have been done to investigate the emplacement history of Ship Rock, but gravity
surveying and subsurface imaging based off of that data are unprecedented methods for
the Ship Rock area. More dense gravity surveying should be done in our study area and
in the Four Corners region for regional, dense-sampling gravity comparison and
composite data gathering.
The implications of this study need not end in Shiprock, New Mexico; our
findings can, I hope, be applied to researching other diatreme systems and testing the
dike-fed diatreme model at other volcanic centers.
A question separate from this field study, but of special interest to this author, is
that of how geologic research on sacred Native American land can be conducted non-
invasively, and without disrespecting the stories already in place to explain such geologic
features. Science need not be separate from its setting, geographic or cultural. How can
research be done without discrediting or devaluing other stories humans use to explain
their world? Although not addressed in this paper, these questions should be addressed,
through reflection on how scientific research is conducted in connection with American
Indian nations in the United States and, more globally, scientific research in conjunction

44
with indigenous cultures and peoples. All work done to make gravity surveys and
subsurface imaging more effective methods, will also be progress made towards the
success of non-invasive methods used for answering questions of geologic history. In the
specific case of Ship Rock, efforts in this direction give hope for an increasingly positive
relationship between the geoscientific investigation of an exhumed diatreme and Navajo
ways of knowing about Tse Bit’a’i.

45
ACKNOWLEDGMENTS
Many thanks are owed to my comps project advisor, Mary Savina. Sarah Titus
was also instrumental in helping me follow this project through to completion. My
advisor during the research component of this project, conducted over the summer of
2006 in Shiprock, New Mexico was Charly Bank, Lecturer in Geophysics at the
University of Toronto in Canada, who also assisted me throughout the data analysis and
writing process. Funding for this project was generously provided by the KECK Geology
Consortium. I also thank Dr. Gary Cooper, who corresponded with me from South
Africa to instruct me in the use of his Grav2DC modeling software.

46
WORKS CITED
Bank, Charly, 2006-2007, Personal Correspondence. Cajete, G., 2000, Native science : natural laws of interdependence: Santa Fe, N.M., Clear
Light Publishers, xii, 315 p. p. Case, J. E., Morin, R. L., and Dickerson, R. P., 1992, Maps showing interpretation of
geophysical anomalies of the northwestern Uncompahgre uplift and vicinity, Grand County, Utah, and Mesa County, Colorado: Reston, VA
-, 1992, Map showing interpretation of geophysical anomalies of the northwestern Uncompahgre Uplift and vicinity, Grand County, Utah, and Mesa County, Colorado.
Chadwick, W. W. J. a. D., J. H., 1995, Mechanical modeling of circumferential and radial dike intrusion on Galapagos volcanoes: Journal of Volcanology and Geothermal Research, v. 66, p. 37-52.
Delaney, P. T., 1987, Ship Rock, New Mexico; the vent of a violent volcanic eruption, in Beus, S. S., ed., Rocky Mountain section of the Geological Society of America: Boulder, Geol. Soc. Am.
Delaney, P. T., and Pollard, D. D., 1981, Deformation of host rocks and flow of magma during growth of minette dikes and breccia-bearing intrusions near Ship Rock, New Mexico, Geological Survey professional paper ; 1202: Washington, U.S. G.P.O. : For sale by the Supt. of Docs. U.S. G.P.O., iv, 61 p. p.
Ervin, C. P., 1977, Theory of the Bouguer anomaly: Geophysics, v. 42, no. 7, p. 1468. Everson, D. D., and Roggenthen, W. M., 1988, Gravity and magnetic models of the
Tomahawk Diatreme, northern Black Hills, South Dakota, in Thirty-ninth field conference; eastern Powder River basin-Black Hills, Casper.
Heywood, C. E., 1992, Isostatic residual gravity anomalies of New Mexico. Hofmann, Y., Jahr, T., and Jentzsch, G., 2003, Three-dimensional gravimetric modelling
to detect the deep structure of the region Vogtland/NW-Bohemia: Journal of Geodynamics, v. 35, no. 1-2, p. 209-220.
Hooten, J. A., Ort, Michael H., 1999, Explosive dynamics and related physical features of phreatomagmatic diatremes, Hopi Buttes volcanic field, Arizona: Abstracts with Programs - Geological Society of America, v. 31, no. 7, p. 207.
Keller, G. R., Cordell, L., New Mexico Energy Institute., and United States. Dept. of Energy. Division of Geothermal and Hydropower Technologies., 1983, Geothermal resources of New Mexico : Bouguer gravity anomaly map of New Mexico: Division of Geothermal and Hydropower Technologies U.S. Dept. of Energy ;
Kroeger, Glenn, 2006-2007, Personal Correspondence. LaFehr, T. R., 1991, An exact solution for the gravity curvature (Bullard B) correction:
Geophysics, v. 56, no. 8, p. 1179-1184. -, 1991, Standardisation in gravity reduction: Geophysics, v. 56, no. 8, p. 1170-1178. Laughlin, A. W., and Charles, R. W., 1992, Lamprophyric dikes of the Navajo volcanic
field, in Semken, S. C., ed., Field guide to a geologic excursion in the northeastern Navajo Nation: Shiprock, Navajo Community College.
Mabey, D. R., and Morris, H. T., 1967, Geologic interpretation of gravity and aeromagnetic maps of Tintic Valley and adjacent areas, Tooele and Juab

47
Counties, Utah, Geophysical field investigations.: Washington,, U.S. Govt. Print. Off., iii, 10 p.
Mabey, D. R., Zietz, I., and Eaton, G. P., 1975, Regional gravity and magnetic patterns of the Cordillera: Abstracts with Programs - Geological Society of America, v. 7, no. 7, p. 1181-1182.
McCallum, M. E., and Mabarak, C. D., 1976, Diamond in kimberlitic diatremes of northern Colorado: Geology, v. 4, no. 8, p. 467-469.
Monroe, J. S. a. W., Reed, 1998, Physical Geology: Exploring the Earth: Albany, Wadsworth Publishing Company.
Semken, S. C., 2001, The Navajo volcanic field, in Symposium on Volcanoes and volcanology in New Mexico, Albuquerque.
-, 2003, Black Rocks protruding up; the Navajo volcanic field . Vokes, H. E., 1942, The story of Ship Rock [New Mexico]: Natural History, v. 49, no. 4,
p. 212-215. Wohletz, K., and Heiken, G., 1992, Geothermal systems associated with basaltic
volcanoes, Volcanology and geothermal energy. Wohletz, K. H., and Sheridan, M. F., 1983, Hydrovolcanic explosions; II, Evolution of
basaltic tuff rings and tuff cones: American Journal of Science, v. 283, no. 5, p. 385-413.
![Mapping Subsurface Alteration Using Gravity and · PDF fileMapping Subsurface Alteration Using Gravity and Magnetic Inversion Models Williams, N. [1], Dipple, G. [1] _____ 1. Mineral](https://static.fdocuments.us/doc/165x107/5abe32647f8b9ad8278cdba9/mapping-subsurface-alteration-using-gravity-and-subsurface-alteration-using.jpg)