Using GORCAM A Demonstration
32
Using GORCAM A Demonstration Developing Forestry and Bioenergy Projects within CDM Quito, Ecuador March, 2004
description
Using GORCAM A Demonstration. Developing Forestry and Bioenergy Projects within CDM Quito, Ecuador March, 2004. GORCAM GORCAM - WCI Creating Initial Conditions Pasture Examples Reforestation for conservation Reforestation for fiber production Reforestation for bioenergy - PowerPoint PPT Presentation
Transcript of Using GORCAM A Demonstration

Using GORCAMA Demonstration
Developing Forestry and Bioenergy Projects within CDM
Quito, EcuadorMarch, 2004

Joanneum Research / Woodrising Consulting Inc.
2
Overview• GORCAM• GORCAM - WCI• Creating Initial Conditions
– Pasture• Examples
– Reforestation for conservation– Reforestation for fiber production– Reforestation for bioenergy
• Program Improvements

Joanneum Research / Woodrising Consulting Inc.
3
GORCAMMain Sheet
Parameter Input A
rea
Output Area

Joanneum Research / Woodrising Consulting Inc.
4
GORCAM Detailed View
Scenario Menu
Growth Curve MenuLitter Dynamics Menu
1st Harvest Parameters
Graph Type Menu
Harvest Type Menu

Joanneum Research / Woodrising Consulting Inc.
5
GORCAMGraphical Output
0
50
100
150
200
250
300
350
0 10 20 30 40 50 60 70 80 90 100
Time [years]
Cum
ulat
ive
carb
on [t
C/h
a] Fossil fuel input [MgC/ha]Displaced foss. fuels [MgC/ha]Energy for products [MgC/ha]Landfill [MgC/ha]Short-lived products [MgC/ha]Long-lived products [MgC/ha]Trees [MgC/ha]Litter [MgC/ha]Soil [MgC/ha]

Joanneum Research / Woodrising Consulting Inc.
6
GORCAM - WCIInput Sheet

Joanneum Research / Woodrising Consulting Inc.
7
GORCAM - WCIGraphical Output
Biomass
0
100
200
300
400
500
600
700
800
2004 2014 2024 2034 2044 2054 2064 2074 2084 2094 2104
Year
tonn
es /
hect
are
Cons LandfillWW LandfillLLPSLPOther VegTreesAG LitterBG LitterRootsSoil

Joanneum Research / Woodrising Consulting Inc.
8
GORCAM - WCIGraphical Output
Emissions
-50
-45
-40
-35
-30
-25
-20
-15
-10
-5
02004 2014 2024 2034 2044 2054 2064 2074 2084 2094 2104
Year
Ann
ual (
t CO
2e/h
a)
-1200
-1000
-800
-600
-400
-200
0
Cum
ulative (t CO
2e/ha)
ElectricityFF SavedFF UsedLandfill GasBiomassTotalCumulative

Joanneum Research / Woodrising Consulting Inc.
9
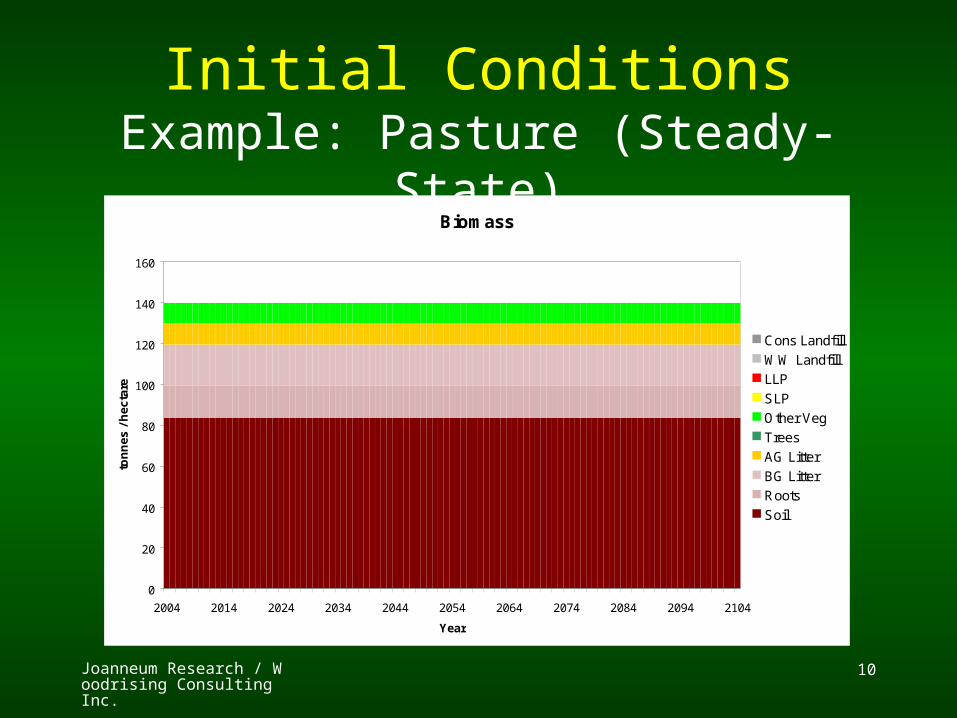
Initial ConditionsExample: Pasture (Steady-State)
Parameter GORCAM - WCIMaximum Standing Stock Above ground biomass (AGB) = 10 t /ha 13.00 tC / ha
Root / AGB = 160%Fine litter / year 25% of AGB 1.25 tC / haFine root litter / year 30% of roots 2.40 tC / haLitter decay rate 3.60 years (Corrected to 6C, 1250 mm) 0.28 1/yearsFine root litter decay rate 3.60 years (Corrected to 6C, 1250 mm) 0.28 1/yearsLitter input to Soil 5% 5%Root litter input to Soil 50% 50%Soil decay rate 32.60 years (Corrected to 6C, 1250 mm) 0.031 1/years
GORCAM
Joanneum Research / Woodrising Consulting Inc.
10
Initial ConditionsExample: Pasture (Steady-State)
Biomass
0
20
40
60
80
100
120
140
160
2004 2014 2024 2034 2044 2054 2064 2074 2084 2094 2104
Year
tonn
es /
hect
are
Cons LandfillWW LandfillLLPSLPOther VegTreesAG LitterBG LitterRootsSoil

Joanneum Research / Woodrising Consulting Inc.
11
Reforestation for ConservationParameter GORCAM - WCIMaximum Standing Stock From yield curve modelling 236.86 tC / haRoot / AGB 22%Fine Root / Root 0.072+0.354exp(-0.060 Root)Fine litter / year 1.8% of AGB 3.49 tC / haCoarse litter / year 0.81% of AGB 1.57 tC / haFine root litter / year 64% of fine roots 2.71 tC / haCoarse root litter / year 0.41% of roots 0.18 tC / haFine litter decay rate 4.30 years (Corrected to 6C, 1250 mm) 0.23 1/yearsCoarse litter decay rate 12.30 years (Corrected to 6C, 1250 mm) 0.081 1/yearsFine root litter decay rate same as fine litter 0.23 1/yearsCoarse root litter decay rate same as coarse litter 0.081 1/yearsLitter input to Soil 5% 5%Root litter input to Soil 50% 50%Soil decay rate 32.60 years (Corrected to 6C, 1250 mm) 0.031 1/years
GORCAM

Joanneum Research / Woodrising Consulting Inc.
12
Reforestation for ConservationBiomass
0
100
200
300
400
500
600
700
800
2004 2014 2024 2034 2044 2054 2064 2074 2084 2094 2104
Year
tonn
es /
hect
are
Cons LandfillWW LandfillLLPSLPOther VegTreesAG LitterBG LitterRootsSoil

Joanneum Research / Woodrising Consulting Inc.
13
Reforestation for ConservationAnnual Emissions
-50
-45
-40
-35
-30
-25
-20
-15
-10
-5
02004 2014 2024 2034 2044 2054 2064 2074 2084 2094 2104
Year
Ann
ual (
t CO
2e/h
a) ElectricityFF SavedFF UsedLandfill GasBiomassTotal
Joanneum Research / Woodrising Consulting Inc.
14
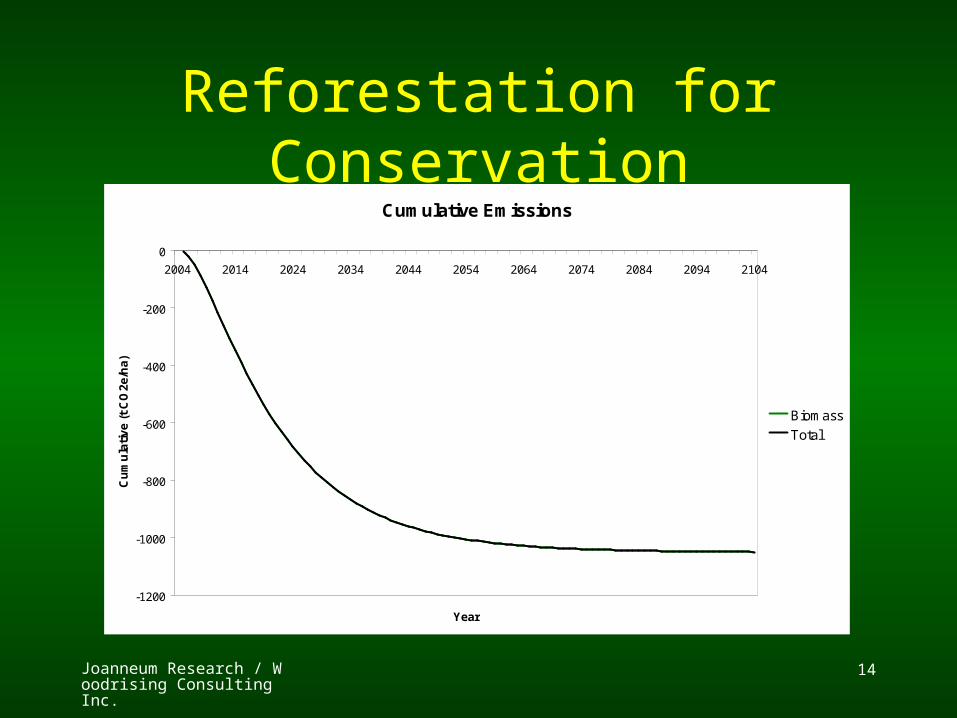
Reforestation for ConservationCumulative Emissions
-1200
-1000
-800
-600
-400
-200
02004 2014 2024 2034 2044 2054 2064 2074 2084 2094 2104
Year
Cum
ulat
ive
(t C
O2e
/ha)
BiomassTotal

Joanneum Research / Woodrising Consulting Inc.
15

Joanneum Research / Woodrising Consulting Inc.
16
Reforestation for Fiber Production
Parameter AssumptionsPercent for fuel 27% of harvested AGB 22% of harvested biomassPercent to lumber 33% of harvested AGB 27% of harvested biomassPercent to paper 12% of harvested AGB 10% of harvested biomassPercent to waste 7% of harvested AGBPercent to foliage litter 8% of harvested AGB 6.6% of harvested biomassPercent to coarse litter 13% of harvested AGB 11% of harvested biomassPercent to fine root litter 8.8% of total roots 1.6% of harvested biomassPercent to coarse root litter 22% of AGB 16% of harvested biomassLumber decay rate 30 years 30 yearsPaper decay rate 2 years 2 yearsLandfill decay rate same as soil decay 32.6 yearsPercent of lumber to landfill no recycling or energy use 100%Percent of paper to landfill no recycling or energy use 100%
Value

Joanneum Research / Woodrising Consulting Inc.
17
Reforestation for Fiber ProductionExcluding Wood Products
Biomass
0
100
200
300
400
500
600
700
2004 2014 2024 2034 2044 2054 2064 2074 2084 2094 2104
Year
tonn
es /
hect
are
Cons LandfillWW LandfillLLPSLPOther VegTreesAG LitterBG LitterRootsSoil

Joanneum Research / Woodrising Consulting Inc.
18
Reforestation for Fiber ProductionIncluding Wood Products
Biomass
0
200
400
600
800
1000
1200
2004 2014 2024 2034 2044 2054 2064 2074 2084 2094 2104
Year
tonn
es /
hect
are
Cons LandfillWW LandfillLLPSLPOther VegTreesAG LitterBG LitterRootsSoil

Joanneum Research / Woodrising Consulting Inc.
19
Reforestation for Fiber ProductionIncluding Wood Products
Annual Emissions
-60
-40
-20
0
20
40
60
80
100
120
140
2004 2014 2024 2034 2044 2054 2064 2074 2084 2094 2104
Year
Ann
ual (
t CO
2e/h
a) ElectricityFF SavedFF UsedLandfill GasBiomassTotal

Joanneum Research / Woodrising Consulting Inc.
20
Reforestation for Fiber ProductionEnergy Use
• Mechanical harvesting• Transportation
– 100 km to mill• Processing
Parameter AssumptionsEmissions from harvest 7.9 m3/hr, 14 L Diesel / hr, 2.76 kg CO2e/L 0.0122 t CO2e / t roundwoodEmissions from transportation 35 m3/truck, 40 L/100 km, 2.76 kg CO2e/L 0.0158 t CO2e / t roundwoodEmissions from processing Fossil fuels 0.0029 t CO2e / t wood product
Electricity (0.68 MWh/t, 0.273 t CO2e/MWh) 0.1856 t CO2e / t wood productGORCAM-WCI (Fossil fuels) 0.0521 t CO2e / t wood productGORCAM-WCI (Electricity) 0.6800 MWh / t wood productGORCAM 0.0478 t C / t C harvested
Value

Joanneum Research / Woodrising Consulting Inc.
21
Reforestation for Fiber ProductionIncluding Energy Use
Annual Emissions
-100
-50
0
50
100
150
200
2004 2014 2024 2034 2044 2054 2064 2074 2084 2094 2104
Year
Ann
ual (
t CO
2e/h
a) ElectricityFF SavedFF UsedLandfill GasBiomassTotal

Joanneum Research / Woodrising Consulting Inc.
22
Reforestation for Bioenergy
• Biodiesel Plant– converts biomass into diesel and charcoal– located 100 km from reforestation site
• Harvest• Transportation• Conversion to bioenergy

Joanneum Research / Woodrising Consulting Inc.
23
Reforestation for BioenergyParameter AssumptionsPercent for fuel 92% of harvested AGB 70% of harvested biomassPercent of foliage litter 8% of harvested AGB 7% of harvested biomassPercent to coarse litter 0% of harvested biomassEmissions from harvest 7.9 m3/hr, 14 L Diesel / hr, 2.76 kg CO2e / L 0.0122 t CO2e / t biofuelEmissions from transportation 35 m3/truck, 40 L/100 km, 2.76 kg CO2e/L 0.0158 t CO2e / t biofuelEmissions from harvesting GORCAM-WCI 0.0280 t CO2e / t biofuel
GORCAM 0.0153 t C / t C harvestedEmissions from conversion Natural gas (0.06 GJ/t, 50.7 kg CO2e/GJ) 0.0030 t CO2e / t biofuel
Electricity (0.20 MWh/t, 0.273 t CO2e/MWh) 0.0546 t CO2e / t biofuelBiodiesel (0.70 GJ/t, 0.157 kg CO2e/GJ) 0.0001 t CO2e / t biofuelCharcoal (3.5 GJ/t, 5.44 kg CO2e/GJ) 0.0190 t CO2e / t biofuel
Emissions from conversion GORCAM-WCI 0.0768 t CO2e / t biofuelGORCAM 0.0419 t C / t C harvested
Production Biodiesel 10.0 GJ / t biofuelCharcoal 2.0 GJ / t biofuel
Biodiesel efficiency factor 90%Biodiesel energy produced 9.0 GJ / t biofuelDiesel emission factor 66.2 kg CO2e/GJ 0.0181 t C/GJDiesel emissions displaced 0.16 t C / t biofuelBiofuel displacement factor 0.32 t C / t C
Value

Joanneum Research / Woodrising Consulting Inc.
24
Reforestation for BioenergyBiomass
0
100
200
300
400
500
600
700
2004 2014 2024 2034 2044 2054 2064 2074 2084 2094 2104
Year
tonn
es /
hect
are
Cons LandfillWW LandfillLLPSLPOther VegTreesAG LitterBG LitterRootsSoil

Joanneum Research / Woodrising Consulting Inc.
25
Reforestation for Fiber ProductionExcluding Wood Products
Biomass
0
100
200
300
400
500
600
700
2004 2014 2024 2034 2044 2054 2064 2074 2084 2094 2104
Year
tonn
es /
hect
are
Cons LandfillWW LandfillLLPSLPOther VegTreesAG LitterBG LitterRootsSoil

Joanneum Research / Woodrising Consulting Inc.
26
Reforestation for BioenergyAnnual Emissions
-200
-100
0
100
200
300
400
500
2004 2014 2024 2034 2044 2054 2064 2074 2084 2094 2104
Year
Ann
ual (
t CO
2e/h
a) ElectricityFF SavedFF UsedLandfill GasBiomassTotal

Joanneum Research / Woodrising Consulting Inc.
27
Reforestation for BioenergyCumulative Emissions
-1600
-1400
-1200
-1000
-800
-600
-400
-200
02004 2014 2024 2034 2044 2054 2064 2074 2084 2094 2104
Year
Cum
ulat
ive
(t C
O2e
/ha)
BiomassTotal

Joanneum Research / Woodrising Consulting Inc.
28
Reforestation for BioenergyWithout Replanting
Biomass
0
100
200
300
400
500
600
2004 2014 2024 2034 2044 2054 2064 2074 2084 2094 2104
Year
tonn
es /
hect
are
Cons LandfillWW LandfillLLPSLPOther VegTreesAG LitterBG LitterRootsSoil

Joanneum Research / Woodrising Consulting Inc.
29
Reforestation for BioenergyWithout Replanting
Annual Emissions
-200
-100
0
100
200
300
400
500
2004 2014 2024 2034 2044 2054 2064 2074 2084 2094 2104
Year
Ann
ual (
t CO
2e/h
a) ElectricityFF SavedFF UsedLandfill GasBiomassTotal

Joanneum Research / Woodrising Consulting Inc.
30
Reforestation for BioenergyWithout Replanting
Cumulative Emissions
-700
-600
-500
-400
-300
-200
-100
02004 2014 2024 2034 2044 2054 2064 2074 2084 2094 2104
Year
Cum
ulat
ive
(t C
O2e
/ha)
BiomassTotal

Joanneum Research / Woodrising Consulting Inc.
31
Program Improvements• Merge GORCAM and GORCAM-WCI• User-friendly• Non-CO2 Gases• Tropical Forestry Situations• Agroforestry• Parameter Database• Time-varying Parameters

Joanneum Research / Woodrising Consulting Inc.
32