Using GIS Technology to Assess US Bone Marrow ... Bone Marrow Transplantation Capacity At Be The...
31
Using GIS Technology to Assess US Bone Marrow Transplantation Capacity At Be The Match ® Eric P. Williams Senior Bioinformatics Scientist National Marrow Donor Program April 10, 2014
Transcript of Using GIS Technology to Assess US Bone Marrow ... Bone Marrow Transplantation Capacity At Be The...

Using GIS Technology to Assess
US Bone Marrow Transplantation
Capacity At Be The Match®
Eric P. Williams
Senior Bioinformatics Scientist
National Marrow Donor ProgramApril 10, 2014
2

What the NMDP does
Our Mission Statement
We save lives through cellular transplantation – science,
service and support.
3

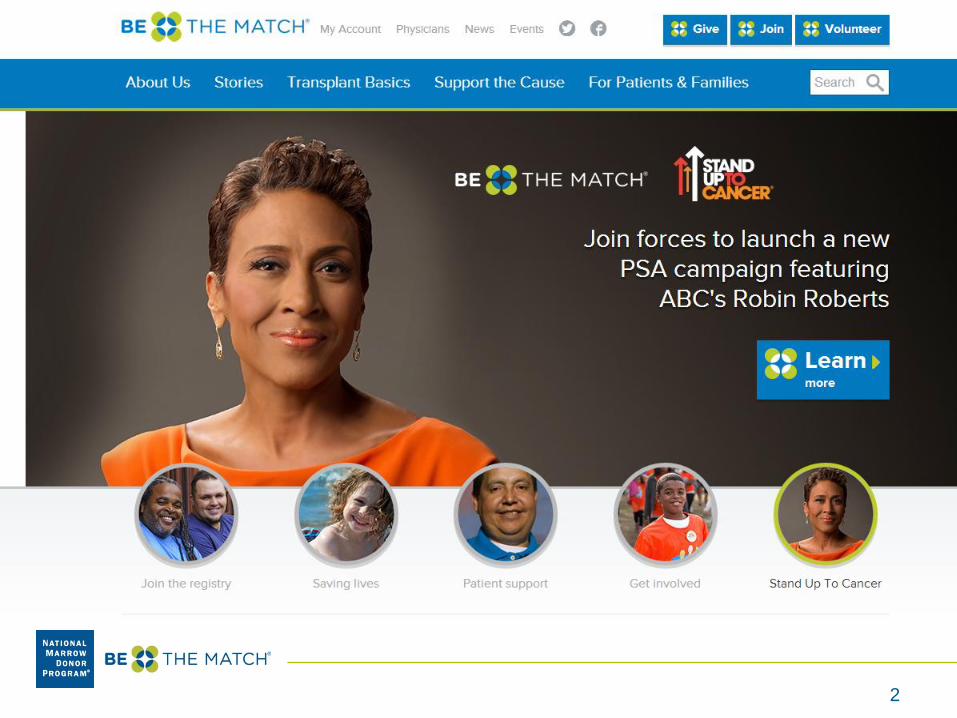
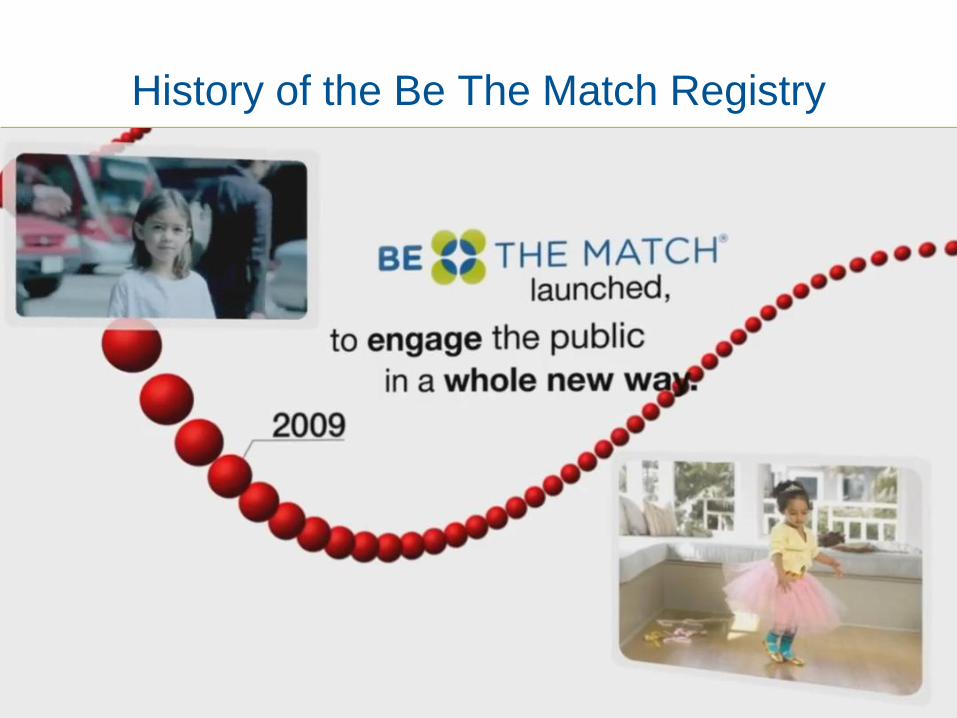
History of the Be The Match Registry
4

History of the Be The Match Registry
In 1987 the program is launched with
congressional support. Championed
by congressman C.W. Bill Young
and with funding from the U.S. Navy
Admiral E.R. Zumwalt Jr.
10, 000 donors
step forward
and
the program
registry is
started
5
History of the Be The Match Registry
6

History of the Be The Match Registry
7
History of the Be The Match Registry
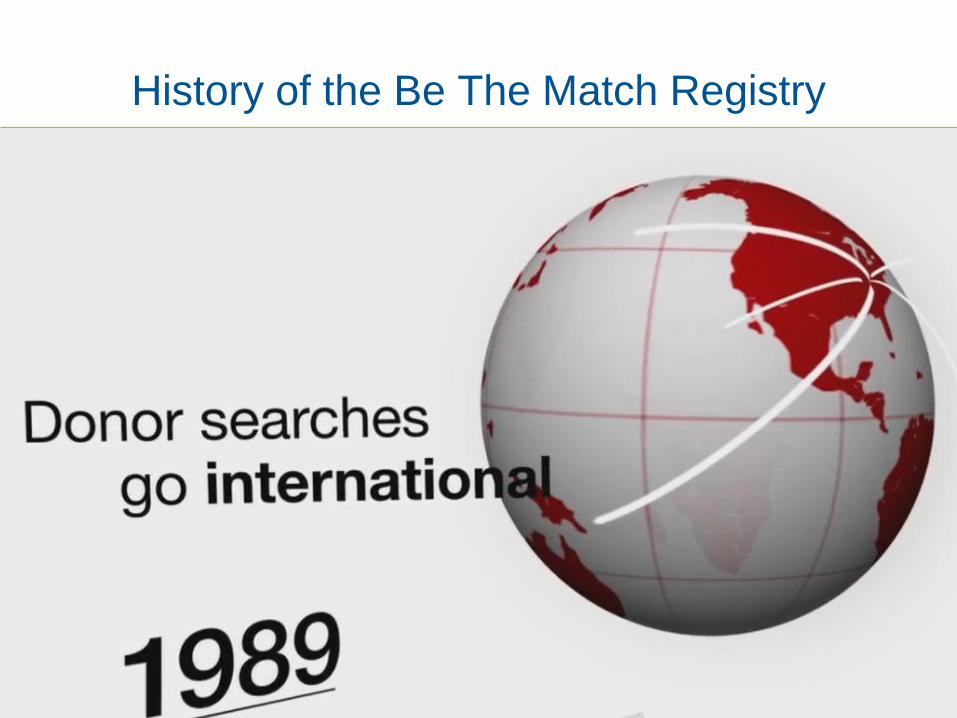
8
In 2004 the International Bone
Marrow Transplant Registry
(IBMTR) at the Medical College of
Wisconsin joined together with the
NMDP and formed the CIBMTR

9
History of the Be The Match Registry
In 2006 the RITN
(Radiation Injury
Treatment Network)
is created
History of the Be The Match Registry
10
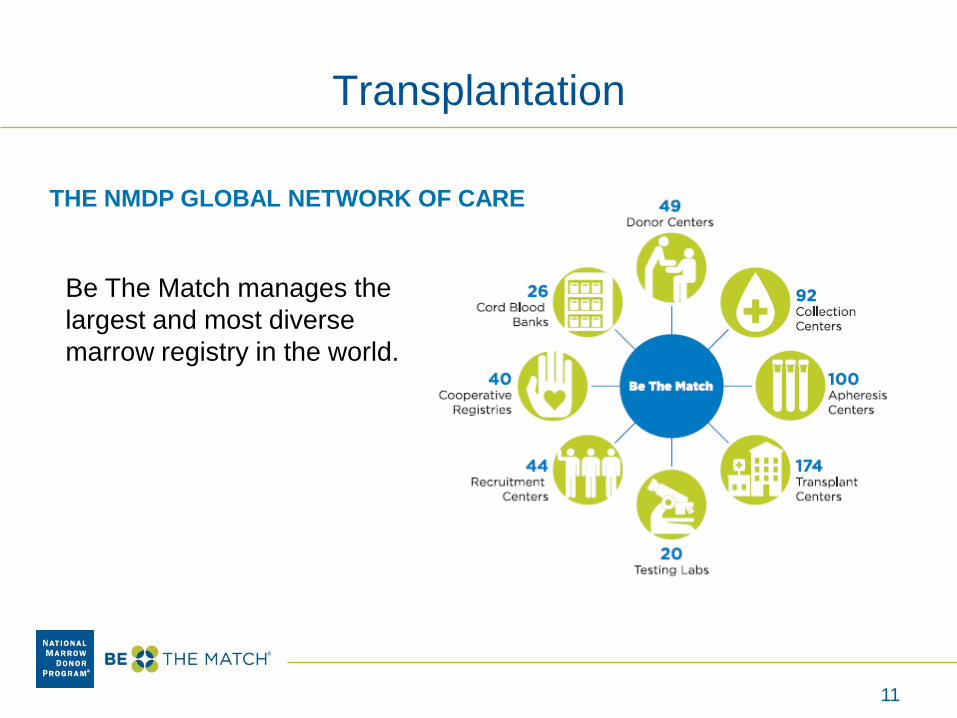
Transplantation
THE NMDP GLOBAL NETWORK OF CARE
Be The Match manages the
largest and most diverse
marrow registry in the world.
11
Unrelated Donors and Transplantation
1. On average 70 % of patients don’t find related donors
2. Unrelated hematopoietic stem cell sources
a) PBSC – Peripheral Blood Stem Cell
b) BM – Bone Marrow
c) CB – Cord Blood
12

13
0
500
1,000
1,500
2,000
2,500
3,000
3,500
4,000
4,500
5,000
5,500
6,000
19
88
19
89
19
90
19
91
19
92
19
93
19
94
19
95
19
96
19
97
19
98
19
99
20
00
20
01
20
02
20
03
20
04
20
05
20
06
20
07
20
08
20
09
20
10
20
11
NMDP Transplants by Cell Source
Bone Marrow Peripheral Blood Stem Cells Cord Blood

Transplantation
The NMDP
• Has facilitated more than 55,000 unrelated transplants
• Facilitates more than 5,800 transplants yearly
• Now linked to Transplant Centers, Donor Centers and Registries
in 41 countries
• There are currently over 10.5 Million possible donors and
180,000 cord blood units (CBU) available
• 626,000 donors signed up to join the registry and 20,800 CBU
were added in 2012
• Through international collaboration, patients have access to over
20.5 Million unrelated donors and 590,000 CBU
14
What Has Happened in the Last Decade?
• Related transplants flat
• Unrelated transplants up 3 fold
– Minority transplants up 4.5 fold
– Transplants over 50 up 8 fold
– Transplants over 65 up 12 fold
– Incremental growth in all other decades of life
15
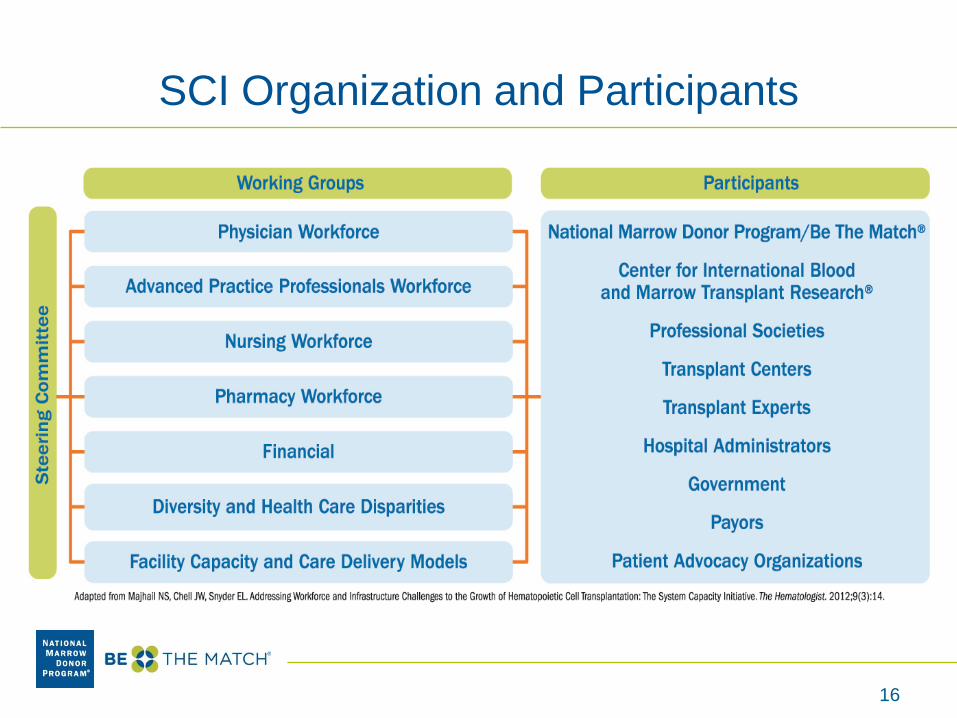
SCI Organization and Participants
16

Regional Market Potential Analysis
• Concept:
– Determine unmet transplant demand within individual US
geographic markets around transplant center(s)
• Purpose:
– Visualize growth potential within individual markets to assist
program/hospital administration in making informed decisions
regarding BMT program expansion
– Apply socioeconomic variables to identify general market
barriers for strategic planning & initiatives
– Potentially visualize underserved markets within US for
additional consideration
17

Adult Allogeneic Transplant Centers
Adult Transplant Center
Market boundary
© 2011 National Marrow Donor ProgramNot for disclosure/distribution/duplication without permission
18
Pediatric Transplant Center
Market boundary
© 2011 National Marrow Donor ProgramNot for disclosure/distribution/duplication without permission
19
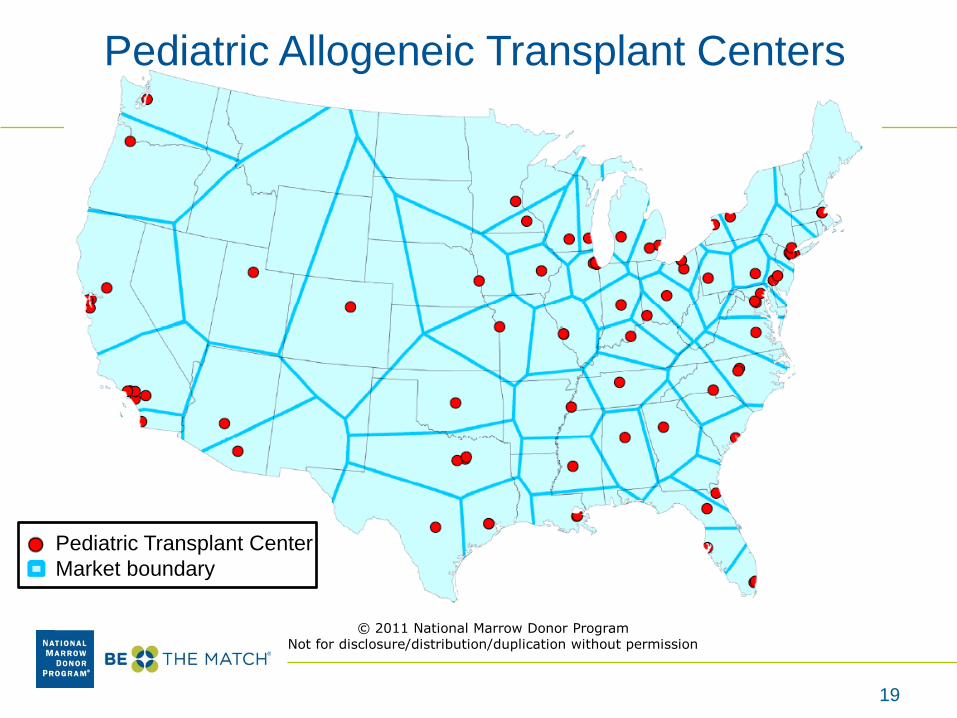
Pediatric Allogeneic Transplant Centers

Regional Market Potential Analyses
• Calculate transplant demand within each individual
market using current Census & SEER data
• Transplant demand – actual transplants =
unmet need (market potential) within geographic market
• Recognize some transplant centers may pull from
outside their geographic markets (secondary markets)
20
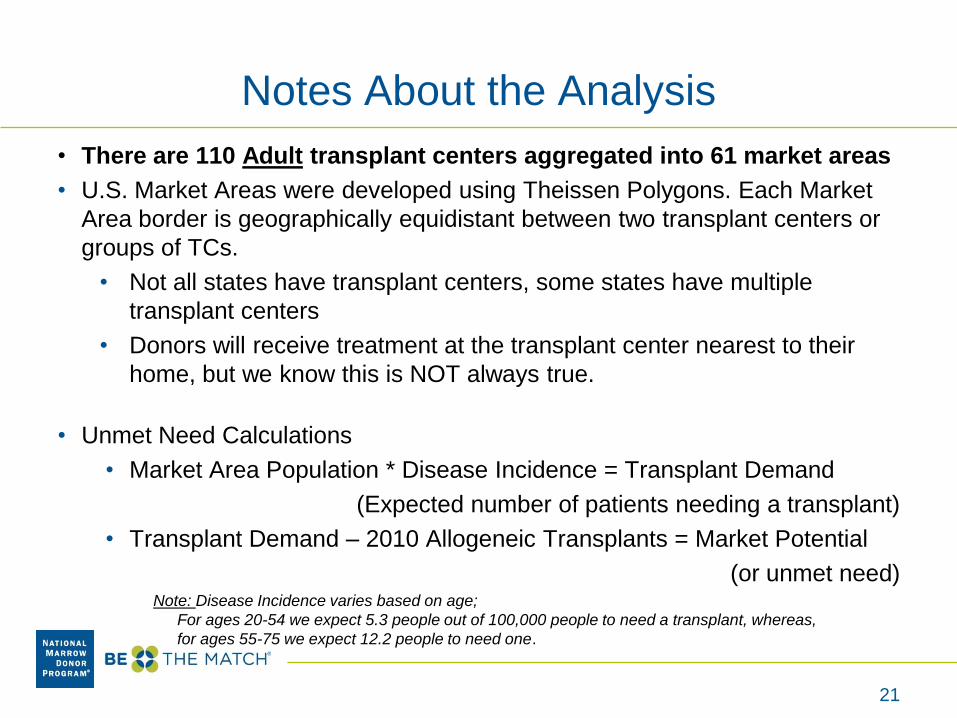
Notes About the Analysis
• There are 110 Adult transplant centers aggregated into 61 market areas
• U.S. Market Areas were developed using Theissen Polygons. Each Market
Area border is geographically equidistant between two transplant centers or
groups of TCs.
• Not all states have transplant centers, some states have multiple
transplant centers
• Donors will receive treatment at the transplant center nearest to their
home, but we know this is NOT always true.
• Unmet Need Calculations
• Market Area Population * Disease Incidence = Transplant Demand
(Expected number of patients needing a transplant)
• Transplant Demand – 2010 Allogeneic Transplants = Market Potential
(or unmet need)Note: Disease Incidence varies based on age;
For ages 20-54 we expect 5.3 people out of 100,000 people to need a transplant, whereas,
for ages 55-75 we expect 12.2 people to need one.
21

TRANSPLANT CENTER
410 TEXAS TRANSPLANT INSTITUTE
22

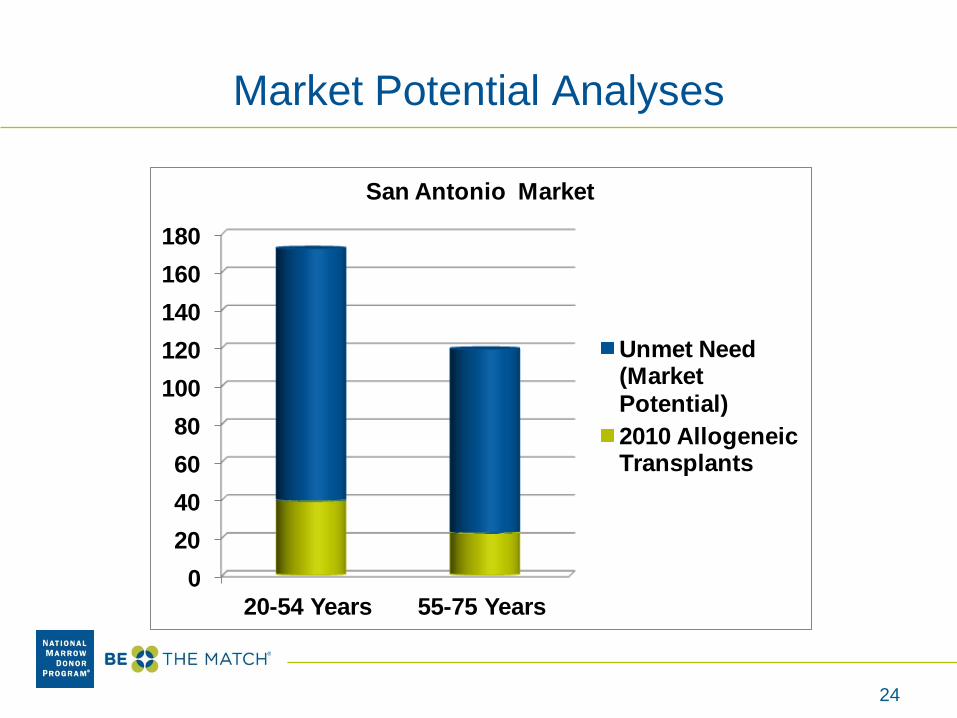
23
San Antonio20-54
Years
55-75
Years
Population 3,253,919 973,831
Disease Incidence/100,000 Population 5.3 12.2
Transplant Demand = pop x (disease incidence/100,000) 172 119
2010 Allogeneic Transplants (related + unrelated) 39 22
Market Potential = demand - actual 133 97
Market Potential Analyses
24
Market Potential Analyses
0
20
40
60
80
100
120
140
160
180
20-54 Years 55-75 Years
San Antonio Market
Unmet Need (Market Potential)
2010 Allogeneic Transplants

Notes About the Analysis
• There are 81 pediatric TCs aggregated into 52 market areas
• U.S. Market Areas were developed using Theissen Polygons. Each Market
Area border is geographically equidistant between two transplant centers or
groups of TCs.
• Not all states have transplant centers, some states have multiple
transplant centers
• Donors will receive treatment at the transplant center nearest to their
home, but we know this is NOT always true.
• Unmet Need Calculations
• Market Area Population * Disease Incidence = Transplant Demand
(Expected number of patients needing a transplant)
• Transplant Demand – 2010 Allogeneic Transplants = Market Potential
(or unmet need)Note: Disease Incidence varies based on age;
For ages 20-54 we expect 5.3 people out of 100,000 people to need a transplant, whereas,
for ages 55-75 we expect 12.2 people to need one.
25

TRANSPLANT CENTER
410 TEXAS TRANSPLANT INSTITUTE
26
27
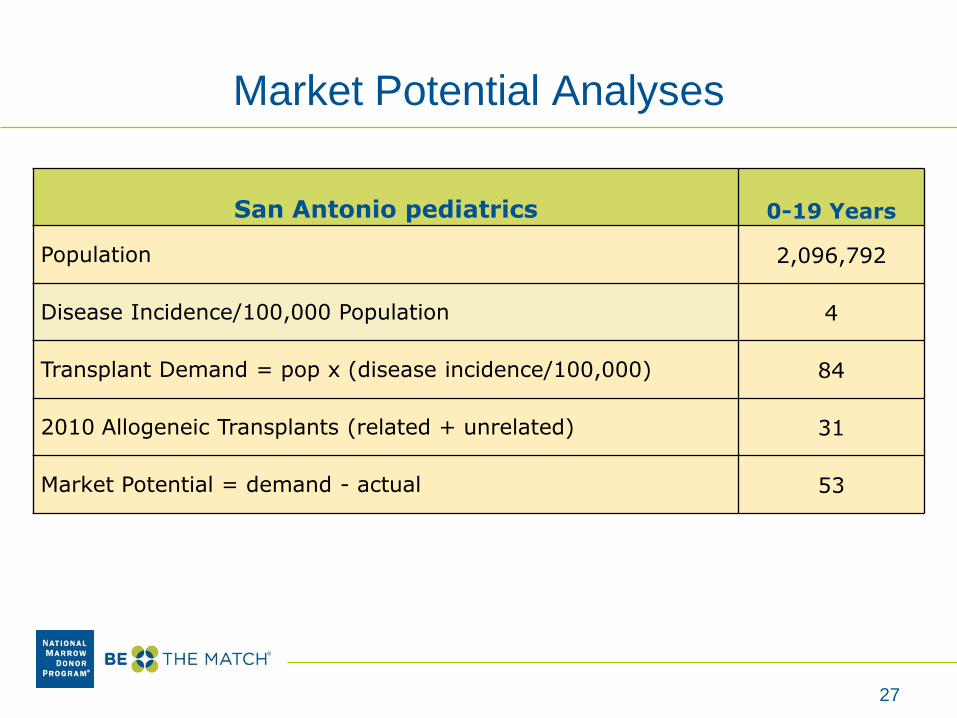
San Antonio pediatrics 0-19 Years
Population 2,096,792
Disease Incidence/100,000 Population 4
Transplant Demand = pop x (disease incidence/100,000) 84
2010 Allogeneic Transplants (related + unrelated) 31
Market Potential = demand - actual 53
Market Potential Analyses

28
Market Potential Analyses
0
10
20
30
40
50
60
70
80
90
0-19 Years
San Antonio Market
Unmet Need (Market Potential)
2010 Allogeneic Transplants
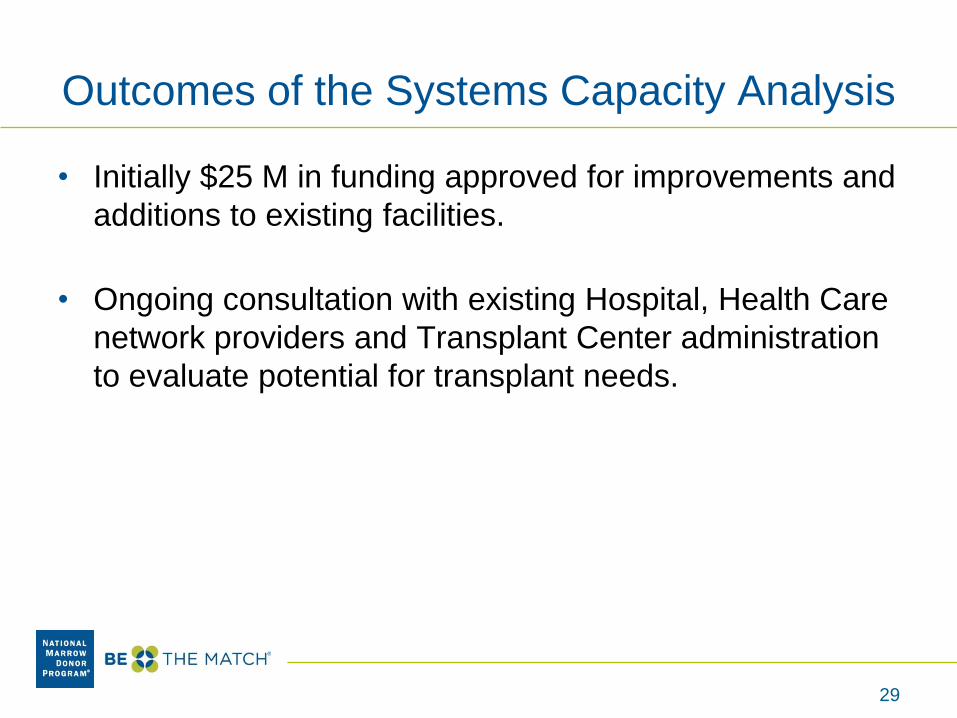
Outcomes of the Systems Capacity Analysis
• Initially $25 M in funding approved for improvements and
additions to existing facilities.
• Ongoing consultation with existing Hospital, Health Care
network providers and Transplant Center administration
to evaluate potential for transplant needs.
29
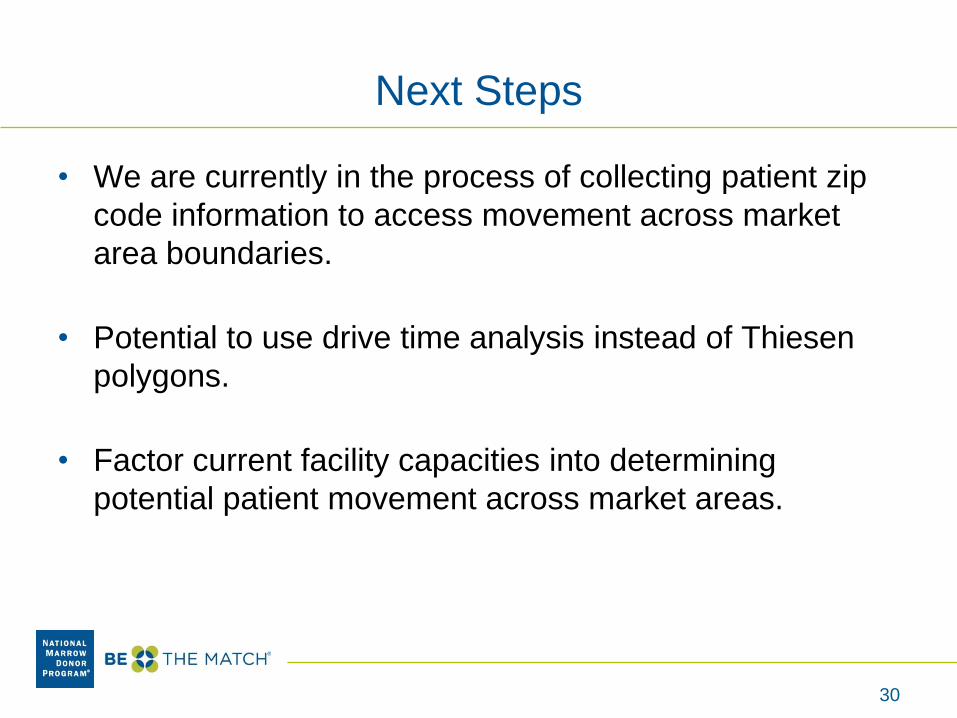
Next Steps
• We are currently in the process of collecting patient zip
code information to access movement across market
area boundaries.
• Potential to use drive time analysis instead of Thiesen
polygons.
• Factor current facility capacities into determining
potential patient movement across market areas.
30

The NMDP Bioinformatics Team
31
Mark Albrecht
Kelsey Besse
Catherine Calistro
Stephanie DiPrima
Kathryn Doroshak
John Freeman
Loren Gragert
Michael Halagan
Caleb Kennedy
Abeer Madbouly
Bob Milius
Vanja Paunic
Jane Pollack
David Roe
Joel Schneider
Adarsh Sivasankaran
Debra Turner
Eric Williams
Michael Wright
Martin Maiers - Director